Department of Biomedical Engineering,University of Michigan, Ann Arbor, MI 48109
Ronald B. HirschlDepartment of Surgery, University of Michigan,
Ann Arbor, MI 48109
A Mathematical Model of AlveolarGas Exchange in Partial LiquidVentilationIn partial liquid ventilation (PLV), perfluorocarbon (PFC) acts as a diffusion barriergas transport in the alveolar space since the diffusivities of oxygen and carbon dioxithis medium are four orders of magnitude lower than in air. Therefore convection inPFC layer resulting from the oscillatory motions of the alveolar sac during ventilatcan significantly affect gas transport. For example, a typical value of the Pe´clet numberin air ventilation is Pe;0.01, whereas in PLV it is Pe;20. To study the importance oconvection, a single terminal alveolar sac is modeled as an oscillating sphericalwith gas, PFC, tissue and capillary blood compartments. Differential equations desing mass conservation within each compartment are derived and solved to obtainperiodic partial pressures. Significant partial pressure gradients in the PFC layerpartial pressure differences between the capillary and gas compartments~PC-Pg! arefound to exist. Because Pe@1, temporal phase differences are found to exist betwPC-Pg and the ventilatory cycle that cannot be adequately described by existingconvective models of gas exchange in PLV. The mass transfer rate is nearly cothroughout the breath when Pe@1, but when Pe!1 nearly 100% of the transport occurduring inspiration. A range of respiratory rates (RR), including those relevant to hfrequency oscillation (HFO)1PLV, tidal volumes~VT! and perfusion rates are studied tdetermine the effect of heterogeneous distributions of ventilation and perfusion oexchange. The largest changes in PCO2 and PCCO2 occur at normal and low perfusionrates respectively as RR and VT are varied. At a given ventilation rate, a low RR-high VTcombination results in higher PCO2 , lower PCCO2 and lower ~PC-Pg! than a highRR-low VT one. @DOI: 10.1115/1.1835352#
Keywords: Partial Liquid Ventilation, Liquid Breathing, Perfluorocarbon, Gas Echange, Convection
t
e
e
s
e
s
i
n
heit isons
olarsed
angea
esthere-m-ted
in-Pe
tiveses
id
1 IntroductionLiquid breathing in mammals using perfluorocarbon~PFC! was
first demonstrated by Clark and Gollan@1#. Since then the concephas led to the development of partial liquid ventilation~PLV! as apromising alternative to conventional mechanical gas ventila~GV! for treating acute respiratory distress syndrome~ARDS! andacute lung injury~ALI !. Studies on animal models@2–6# andhuman trials@7–11# have indicated improvement in gas exchanand lung compliance associated with the use of PLV.
Recent studies have examined the effects of PLV on regioventilation (VA) and blood flow (Q) distribution in the lung inorder to understand the mechanisms behind the global changgas exchange and lung mechanics. PFC was found to be prednantly distributed in the dependent regions of injured adult shlungs undergoing PLV and more gas than PFC was found topresent in the nondependent regions of the lung@6#. Redistributionof blood flow from the dependent to the nondependent regionthe lung was observed during PLV in lambs@12# and pigs@13#.Ventilation-perfusion (VA /Q) inhomogeneity was found to bhigher during PLV compared to GV in healthy piglets@14#. Sig-nificant regions with lowVA /Q ratios were observed in rabbitwith acute lung injury during PLV@15#. Harris et al.@16# com-pared regional distributions of ventilation, blood flow, anventilation-perfusion ratio in the normal lung of a sheep durPLV and GV. They found that both ventilation and perfusion ashifted from the dependent regions to the nondependent regio
Contributed by the Bioengineering Division for publication in the JOURNAL OFBIOMECHANICAL ENGINEERING. Manuscript received by the Bioengineering Divsion December 1, 2003; revision received September 8, 2004. Associate EJames Moore.
the lung in PLV, leading to a wide distribution ofVA /Q in differ-
ent regions of the lung. In contrastVA /Q ratios were close tounity over most of the lung in GV. In order to understand tmechanisms responsible for improved gas exchange in PLV,crucial to determine the contribution to gas exchange of regi
whoseVA , Q, and VA /Q differ significantly from their normalvalues in GV.
Previous animal studies indicated enhanced arterial-alve(a-A) partial pressure gradients in PLV as a result of increashunt fraction and ventilation-perfusion heterogeneity@14#. Van-Lobensels et al. developed a mathematical model of gas exchduring PLV in lung subunits with a PFC layer that indicateddiffusion limitation could lead to significant (a-A) gradients@17#.However they only considered diffusion of respiratory gasthrough a stagnant layer of PFC in an alveolar sac. In realityexpansion and contraction of the sac during tidal ventilation cates a flow field within the PFC layer contained inside. The iportance of convective effects on transport can be estimathrough the Pe´clet number, Pe52pfR2/D, wheref is the breath-ing frequency in breaths/second,R is the sac radius, andD is thegas diffusivity in the alveolar medium~air in GV, PFC, in PLV!.Values of Pe@1 indicate that convection plays a significant roletransport while values of Pe!1 indicate that diffusion is the dominant transport mechanism. At normal respiratory rates,;1023– 1022 in GV while it is on the order of 15–50 in PLV.This is a result of the small diffusivities of O2 and CO2 in PFC,which are 1000–10,000 times smaller than in air. Thus conveceffects play an important role in the transport of respiratory ga
-itor:
2005 by ASME Transactions of the ASME
g
hnler
vi
n
o
o
t
t
fandm-
ous
l airantlly
erhe
ct of
ionr tol offoreandvol-the
dulted incesing
tscle.ing
l-
y
through the PFC layer. In this work we extend the model of VaLobensels et al. to include the effects of the PFC flow field ontransport.
A given ventilation rateVA may be obtained using differencombinations of respiratory rates~RR! and tidal volumes (VT)since VA5RR3VT . Our model allows the specification of botRR and VT independently in contrast to the model of VaLobensels et al. in which onlyVA could be specified. As a resuthe effect of both tidal volume and respiratory rate on gaschange can be determined. This difference is especially impofrom a clinical perspective since ventilation strategies for choing RR andVT are usually aimed at meeting target blood gtensions. However studies have indicated that the use of largevolumes coupled with large PFC doses increases the risk of allar rupture@18#. Therefore there has been interest in developeffective ‘‘lung-protective’’ ventilation strategies to minimize thrisk of ventilator-induced lung injury. One such strategy involvithe combination of high frequency oscillation~HFO! with PLV~HFO1PLV! has been found to enhance lung protection whproviding adequate gas exchange@19–23#. These studies haveshown that, in general, gas exchange is not improved comparePLV with conventional ventilation. The current work aims at prviding an understanding of the physical transport mechanismlung subunits partially filled with PFC and their dependencetidal volumes and respiratory rates, which can help explainobservations of experimental studies and provide guidance inveloping optimal ventilation strategies.
2 Model
2.1 Description of the Model. Following VanLobenselset al.@17# we model functional subunits of the lung at the levelalveolar sacs that comprise of several alveoli opening into a cmon chamber as shown in Fig. 1. The shape of these sacirregular and varies widely within the lung, but the overall sizefairly constant@24#. In order to reduce the geometrical complexiwe replace the asymmetric sacs with spherical structures ofsame mean size, marked by the circle in Fig. 1. The simplifimodel is shown in Fig. 2, in which a terminal alveolar sacmodeled as an oscillating spherical shell with internal radRS(t) at timet, encapsulated by a tissue layer of thicknessh. Thislayer represents the respiratory membrane and is assumedmuch thinner than the radius of the sac@h!RS(t)#. The interiorof the shell consists of two regions:~1! A well-mixed central gascore with radiusRg(t); ~2! a shell of PFC between the core an
Fig. 1 Micrograph of mammalian lung parenchyma „200Ã…
showing alveolar sac and associated alveoli „courtesy of Pro-fessor Rick Gillis, Department of Biology University ofWisconsin-La Crosse …
Journal of Biomechanical Engineering
n-as
t
-tx-
tantos-astidaleo-ngeg
ile
d to-
s inonthede-
ofm-s isisy,theedisius
o be
d
the alveolar wall in which liquid flow is driven by ventilation othe sac. In the course of ventilation, tidal volumes of gas enterleave the sac through the core. A well-mixed capillary blood copartment perfused by a constant blood flow rateQ surrounds theshell. Blood enters the compartment with constant mixed vengas partial pressuresPV and exits with capillary pressuresPC(t).
Over the course of a breath, O2 and CO2 transport occurs be-tween the gas core and the tissue–blood interface. In normabreathing, the sac is completely filled with air and the domintransport mechanism is diffusion. During PLV, the sac is partialiquid-filled and tidal ventilation results in liquid flow within thePFC layer. Since diffusion is about 4 orders of magnitude slowin PFC compared to air, this flow plays an important role in ttransport of O2 and CO2 . In the following sections, we will deriveand solve equations for gas transport that incorporate the effeflow in the PFC layer.
The spherical model used here is a highly simplified descriptof the actual asymmetric geometry of alveolar sacs. In ordejustify the simplification, we note that gas exchange at the levealveolar sacs averages contributions from many alveoli. Therewe expect the results to be less sensitive to geometrical detailsdepend primarily on gross geometrical features such as theume and surface area of the sac, which are fixed by choosingdiameter of the spherical model to match the average size of ahuman alveolar sacs measured from micrographs, as explainSec. 2.3. With this choice of dimensions the model reproduwell-established experimental results for normal air breath~Sec. 3.1!, which provides support to the assumptions.
2.2 Governing Equations. The sac expands and contracas a result of ventilation during the course of a breathing cyThe variation of the sac radius with time is modeled by choosa sinusoidal breathing pattern with anI :E ratio of 1:2 as shown inFig. 3. Thus
RS~ t !5RFRC@11d f ~ t !#, (1)
whereRFRC is the minimum radius of the sac when the lung voume is equal to the functional residual capacity~FRC! and
f ~ t !5H 12cos~3vt/2!
2, 0,t,2p/3v
12cos~3vt/41p/2!
2, 2p/3v<t<2p/v.
(2)
The breathing frequencyv52pRR/60 where RR is the respiratorrate in breaths per minute. At end-expiration (t50) f (t)50,
Fig. 2 Schematic of the alveolar sac model. An oscillatingspherical shell of radius RS„t … encapsulated by a tissue layer ofthickness h represents the sac. A well-mixed capillary bloodcompartment perfused at a constant blood flow rate Q sur-rounds the sac. A well-mixed central core of radius Rg„t … insidethe sac supplies fresh gas at a constant partial pressure Pinduring inspiration and removes expired gas at partial pressurePg„t … during expiration.
FEBRUARY 2005, Vol. 127 Õ 47
48 Õ Vol. 127, FEBRUA
Fig. 3 Waveform of the duty cycle with I:EÄ1:2 over one breath. Time isnormalized with the breathing period, 2 pÕv, and the sac radius with theminimum radius, RFRC . The maximum radius is equal to RFRC„1¿d… andoccurs at end inspiration.
eo
ton.
s.
inse of
e
y
RS(t)5RFRC and at end-inspiration (t52p/3v) f (t)51, RS(t)5RFRC(11d). Assuming that the tidal volumeVT is equally di-vided amongNS sacs,d is determined from the relation
~4p/3!RFRC3 ~11d!32~4p/3!RFRC
3 5VT /NS . (3)
Gas solubilities in air (bg), PFC (bPFC), and tissue (bT) areconstant, so gas concentrationsC are converted to partial pressuresP using the relationC5bP. However, gas solubilities inblood are nonlinear functions ofP and are calculated from bloodgas dissociation relationships described later in this section.transport in the model is described by coupled partial differenequations that relate the rate of change of partial pressure incompartment to the delivery and removal of gas via ventilatiperfusion, convection and diffusion.
In the gas core,P5Pg(t) and the rate of change of massbalanced by the flow rate of gas into or out of the core dueventilation and the diffusive flux at the core-PFC layer bounda
bg
d
dt S 4p
3Rg
3~ t !PgD54pRg2~ t !
dRg
dtbgP0
14pRg2~ t !DPFCbPFC
]PPFC
]r Ur 5Rg~ t !
.
(4)
Table 1 Respiratory parameters for air breathing, conven-tional PLV, and HFO ¿PLV
Here, Rg(t) is the radius of the gas core andDPFC is the gasdiffusivity in PFC. The first term on the right-hand side is equalthe gas flow rate into/out of the core during inspiration/expiratioDuring inspirationP05Pin , the partial pressure of inspired gaDuring expiration exhaled gas leaves the core withP05Pg(t).The volume of the sac,VS54pRS
3(t)/3, changes during thecourse of ventilation. Since the volume of PFC in the sac remaconstant, the rate of change of core volume is equal to the ratchange of sac volume. Therefore,
Rg2~ t !
dRg
dt5RS
2~ t !dRS
dt, (5)
which yields the solution
Rg3~ t !2Rg
3~0!5RS3~ t !2RFRC
3 . (6)
The radius of the gas core at end expiration,Rg(0), depends onthe PFC dose. WhenRg(0) approachesRFRC the model representsan air filled sac undergoing GV. WhenRg(0) approaches zero, thsac is completely filled with PFC.
The partial pressurePPFC(r ,t) in the PFC layer is described ba convective-diffusive equation:
]PPFC
]t1ur~r ,t !
]PPFC
]r5
DPFC
r 2
]
]r S r 2]PPFC
]r D . (7)
Table 2 Solubilities †ml gas Õ„100 ml solvent mm Hg …‡ and dif-fusivities „cm2Õs… of O2 and CO2 in different media. Solubility ofgas in air is defined to be 100 Õ760 ml Õ„100 ml air mm Hg …
Fig. 4 Partial pressure profiles during GV: „a… PO2 during inspiration, „b… PO2 during expiration, „c… PCO2 duringinspiration, „d… PCO2 during expiration. Static diffusion profile is plotted for comparison. All profiles in the sac areflat because of the relatively high diffusivities of O 2 and CO2 in air. Profiles are linear in the tissue layer; s is anormalized radial coordinate †see Eq. „21…‡. The scale of the tissue layer is greatly exaggerated.
y
r
u
a
c-
odryod
e
s-.
Ventilation of the sac drives a radial flow field within the PFlayer and results in convective gas transport within the laywhich is given by the second term in Eq.~7!. The radial PFCvelocity, ur(r ,t), at a distancer from the center is determined bequating the rate of volume change,dVS /dt, to the flow rateacross a shell of surface area 4pr 2. Thus,
4pr 2ur~r ,t !5dVS
dt54pRS
2~ t !dRS
dt, (8)
which gives
ur~r ,t !5RS
2~ t !
r 2
dRS
dt. (9)
The third term in the equation describes diffusive gas transpothe PFC layer.
Since the thickness of the respiratory membrane is msmaller than the sac radius@h!RS(t)#, a thin-layer approxima-tion is used in this region. As a result, convective transporttime derivative terms can be neglected and a diffusion equatioobtained:
al of Biomechanical Engineering
Cer,
t in
ch
ndn is
DT
r 2
]
]r S r 2]PT
]r D50, (10)
wherePT andDT are the partial pressure and diffusivity, respetively, in the tissue.
In the blood compartment, the rate of change of capillary blopartial pressure,PC(t), must be balanced with the net gas delivethrough perfusion and the diffusive flux through the tissue–blointerface:
VC
d
dt~bCPC!5Q~b VPV2bCPC!24p@RS~ t !
1h#2DTbT
]PT
]r Ur 5RS~ t !1h
. (11)
Venous blood enters the compartment at a constant flow ratQwith a constant, mixed venous partial pressure of gas,PV , whilecapillary blood exits with a time-dependent capillary partial presure of gas,PC(t). The first term on the right-hand side of Eq
FEBRUARY 2005, Vol. 127 Õ 49
50 Õ V
Fig. 5 Partial pressure profiles in the PFC and tissue layers during PLV: „a… PO2 during inspiration, „b… PO2during expiration, „c… PCO2 during inspiration, „d… PCO2 during expiration. The static diffusion profile is plot-ted for comparison. Significant partial pressure gradients are seen in the PFC layer. Gradients are larger in theconvective model during inspiration compared to static diffusion. Profiles are linear in the tissue. s is anormalized radial coordinate †see Eq. „21…‡. The scale of the tissue layer is greatly exaggerated.
no
r
y
g-
of
eoga-i-
~11! represents the net gas delivery to the compartment byprocess of perfusion, while the second term represents the dsive flux of gas at the blood-respiratory membrane interface.b Vand bC are theeffectivegas solubilities in venous and capillarblood, respectively, which are not constant, but nonlinear futions of the gas partial pressure. They are determined from blogas dissociation relationships as described below.
Both O2 and CO2 are present in different forms in blood. Asmall fraction of the total blood gas content of O2 and CO2 isfound dissolved in plasma. Most of the O2 is bound to hemoglo-bin while most of the CO2 is in the form of bicarbonate ions obound to hemoglobin and plasma proteins@25#. The total bloodgas contentC of these gases at any partial pressureP can beexpressed as
C5bPP1gf~P!, (12)
wherebP is the constant solubility of the gas in plasma andf(P)is a nonlinear function of the partial pressure. The linear terepresents the portion dissolved in plasma, while the nonlinterm gives the chemically bound portion. For O2 , f(P) is theoxyhemoglobin saturation andg is the oxygen carrying capacitof hemoglobin. The value
ol. 127, FEBRUARY 2005
thisiffu-
yc-d–
rmear
g520.1 (13)
is obtained as the product of the hemoglobin content of blood@15g/~100 ml blood!# and the binding capacity of [email protected] O2/~g hemoglobin!#. We used a correlation due to Severinhaus@26# for the oxyhemoglobin saturation:
f~P!5P31150P
P31150P123 400. (14)
For CO2 , the equations of Kelman@27# were simplified using avalue of 6.11 for the pK of blood and assuming a hematocrit42% to obtain
g53.979,(15)
f~P!5P0.665.
In both cases the units ofP are mm Hg. Here pK is related to thacid-base balance in blood and is defined as the negative lrithm of the equilibrium constant for the equilibrium between bcarbonate ions, hydrogen ions, and dissolved carbon dioxide@25#.
Transactions of the ASME
Jo
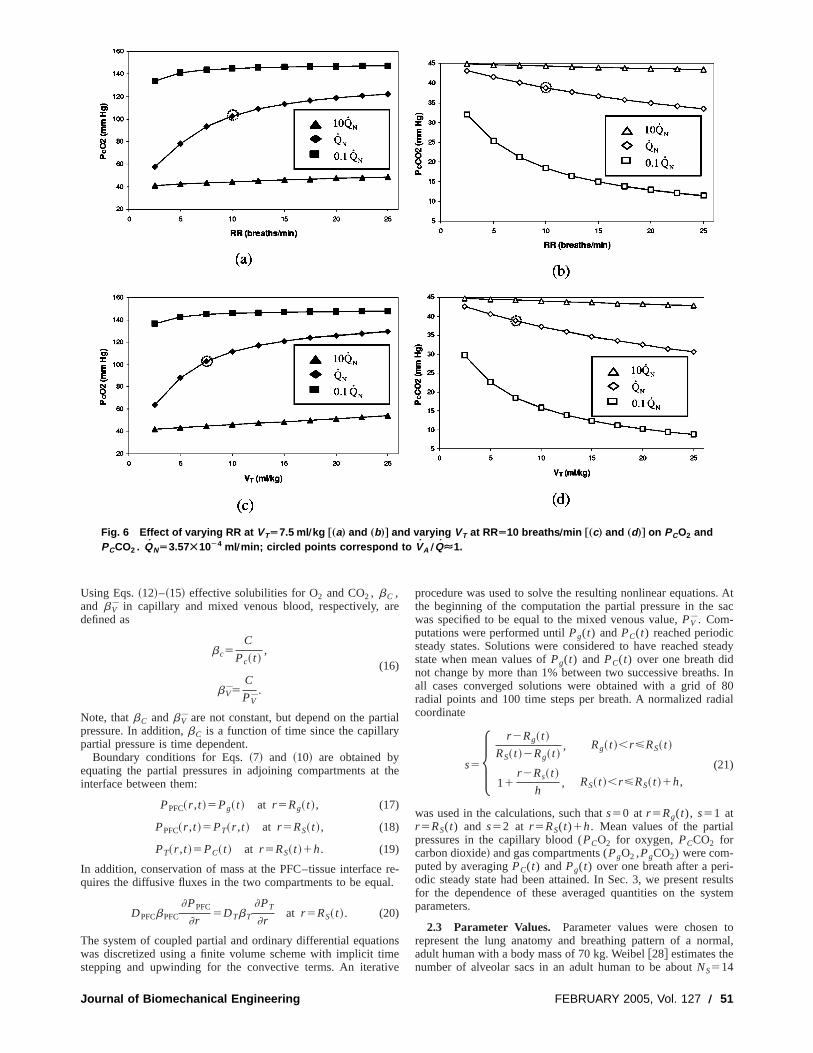
Fig. 6 Effect of varying RR at VTÄ7.5 ml Õkg †„a… and „b…‡ and varying VT at RRÄ10 breaths Õmin †„c… and „d…‡ on PCO2 andPCCO2 . QNÄ3.57Ã10À4 ml Õmin; circled points correspond to VA ÕQÉ1.
y
a
o
i
s. Atsac
teady
s. In80
dial
l
-sultsstem
tomal,
Using Eqs.~12!–~15! effective solubilities for O2 and CO2 , bC ,and b V in capillary and mixed venous blood, respectively, adefined as
bc5C
Pc~ t !,
(16)
b V5C
PV.
Note, thatbC andb V are not constant, but depend on the partpressure. In addition,bC is a function of time since the capillarpartial pressure is time dependent.
Boundary conditions for Eqs.~7! and ~10! are obtained byequating the partial pressures in adjoining compartments atinterface between them:
PPFC~r ,t !5Pg~ t ! at r 5Rg~ t !, (17)
PPFC~r ,t !5PT~r ,t ! at r 5RS~ t !, (18)
PT~r ,t !5PC~ t ! at r 5RS~ t !1h. (19)
In addition, conservation of mass at the PFC–tissue interfacequires the diffusive fluxes in the two compartments to be equ
DPFCbPFC
]PPFC
]r5DTbT
]PT
]rat r 5RS~ t !. (20)
The system of coupled partial and ordinary differential equatiwas discretized using a finite volume scheme with implicit timstepping and upwinding for the convective terms. An iterat
urnal of Biomechanical Engineering
re
ial
the
re-l.
nse
ve
procedure was used to solve the resulting nonlinear equationthe beginning of the computation the partial pressure in thewas specified to be equal to the mixed venous value,PV . Com-putations were performed untilPg(t) andPC(t) reached periodicsteady states. Solutions were considered to have reached sstate when mean values ofPg(t) and PC(t) over one breath didnot change by more than 1% between two successive breathall cases converged solutions were obtained with a grid ofradial points and 100 time steps per breath. A normalized racoordinate
s5H r 2Rg~ t !
RS~ t !2Rg~ t !, Rg~ t !,r<RS~ t !
11r 2Rs~ t !
h, RS~ t !,r<RS~ t !1h,
(21)
was used in the calculations, such thats50 at r 5Rg(t), s51 atr 5RS(t) and s52 at r 5RS(t)1h. Mean values of the partiapressures in the capillary blood (PCO2 for oxygen, PCCO2 forcarbon dioxide! and gas compartments (PgO2 ,PgCO2) were com-puted by averagingPC(t) andPg(t) over one breath after a periodic steady state had been attained. In Sec. 3, we present refor the dependence of these averaged quantities on the syparameters.
2.3 Parameter Values. Parameter values were chosenrepresent the lung anatomy and breathing pattern of a noradult human with a body mass of 70 kg. Weibel@28# estimates thenumber of alveolar sacs in an adult human to be aboutNS514
FEBRUARY 2005, Vol. 127 Õ 51
52
Fig. 7 Effect of varying RR at VTÄ7.5 ml Õkg †„a… and „b…‡ and varying VT at RRÄ10 breaths Õmin †„c… and „d…‡ on„Pg-PC…O2 and „PC-Pg…CO2 . QNÄ3.57Ã10À4 ml Õmin. Circled points correspond to VA ÕQÉ1.
5
an
d
l
-
o
in,
t-
te
sationsed
e
-5%
of a
3
3106. The sac radius at functional residual capacity~FRC!,RFRC, is calculated by assuming the lung volume to be equadistributed among NS spherical units, i.e., FRC5NS
3(4p/3)RFRC3 . In normal air breathing FRC52400 ml ~34.1 ml/
kg! and RFRC5345mm. For PLV, a typical value of FRC530ml/kg has been reported in the literature@14,17#. This correspondsto a FRC of 2100 ml andRFRC5330mm. These sizes are consistent with reported measurements in human lungs@29#. Clinicaltrials in adult humans have used PFC doses with mean varanging from 20 to 25 ml/kg@9,10#. We used a PFC volume of 2ml/kg so that the sac is partially filled with liquid, resulting ingas core radius at FRC,Rg(0)5181mm.
In spontaneous air breathing, the normal respiratory rateRR515 breaths/min. The volume of fresh air inspired per breis 500 ml, of which 350 ml ventilates the alveoli after accountifor dead space. Thus the effective tidal volume isVT55 ml/kgand the alveolar ventilation rate per sac isVA5(weight3VT
3RR)/NS53.7531024 ml/min. In our PLV calculations we onlyuse effective tidal volumes,VT . In large animal experiments anhuman trials of conventional PLV, respiratory rates and tidal vumes in the range RR56–20 breaths/min andVT58 – 15 ml/kghave been reported@3,6,9–11,30,31#. We examined parameter vaues in the range RR52.5–25 breaths/min and VT52.5– 25 ml/kg. In HFO1PLV respiratory rates and tidal volumes in the range RR5120–1500 breaths/min andVT50.25– 10 ml/kg are common@19–22,32–34#. We used values inthe range RR560–900 breaths/min andVT50.1– 5 ml/kg in ourcalculations. In all cases, anI :E ratio of 1:2 is used. Differentcombinations ofVT and RR are used to obtain alveolar ventilati
Õ Vol. 127, FEBRUARY 2005
lly
-
lues
a
isthg
ol-
-
n
ratesVA in the range 9.3831025– 1.2531023 ml/min in conven-tional PLV and 1.2031024– 2.2531023 ml/min in HFO1PLV.
The normal cardiac output of an adult human is 5000 ml/mwhich yields a perfusion rateQN53.5731024 ml/min per sac~5000 ml/143106). In order to study the effect of perfusion heerogeneity in conventional PLV and HFO1PLV we consideredtwo other perfusion rates that are 10 times larger (Q510QN
53.5731023 ml/min) and 10 times smaller (Q50.1QN53.5731025 ml/min) than the normal value. These choices of RR,VT ,and Q result in a wide range ofVA /Q values. In conventionalPLV, VA /Q varies from 2.6 to 35 at the low perfusion ra(0.1QN), 0.26–3.5 at the normal perfusion rate (QN) and 0.026–0.35 at the high perfusion rate (10QN). The corresponding rangein HFO1PLV are 3.4–63 at the low perfusion rate, 0.34–6.3the normal perfusion rate, and 0.034–0.63 at the high perfusrate. A summary of the ventilation and perfusion parameters uis provided in Table 1.
A tissue layer thicknessh50.6mm was chosen based on thaverage thickness of the respiratory membrane@25#. The volumeof the capillary blood compartment,VC , was calculated by assuming the capillary network encapsulating the sac to cover 7of the surface area with a thickness equal to the diametersingle red blood cell, tRBC58 mm.@17# Thus, VC50.7534pRFRC
2 tRBC54.6831026 ml.The solubilitiesbP of O2 and CO2 in plasma are equal to 0.00
ml O2/~100 ml blood mm Hg! and 0.057 ml CO2/~100 mlblood mm Hg!, respectively. Lango et al.@35# have tabulated solu-
Transactions of the ASME
Jou
Fig. 8 Effect of varying RR and VT at constant VA on „a… PCO2 , „b… PCCO2 , „c… „Pg-PC…O2 , „d… „PC-Pg…CO2 . QNÄ3.57Ã10À4 ml Õmin.
a
-
b
v
eenqua-
ofones08of
ringd.
i ofpa-
d inondep-os-
c
-fornd
ucewithery
bilities of various gases in biological media. Their data indicthat the solubility of O2 in the tissue layerbT is equal to thesolubility in plasma. Since no data were available for CO2 weassumed that the solubility of CO2 in lung tissue is also equal toits solubility in plasma. Solubilities of O2 and CO2 in PFC weretaken from VanLo¨bensels et al.@17# who measured solubilities inthe PFC Perflubron. Tham et al.@36# measured diffusion coeffi-cients of O2 and CO2 in three PFCs~Caroxin-D, Caroxin-F, andFC-80! and found mean values ofDPFC55.6131025 cm2/s forO2 andDPFC54.3631025 cm2/s for CO2 . In comparison the cor-responding diffusivities in air at 37°C are 0.190 cm2/s (O2) and0.147 cm2/s (CO2). Lango et al.@35# estimate that the gas diffusivities in tissue vary from 25% to 50% of the diffusivity in wateat the same temperature. We used values for the tissue diffusDT51.231025 cm2/s for O2 andDT50.9631025 cm2/s for CO2which correspond to 40% of the values in water at 37°C. Soluity and diffusivity values are summarized in Table 2.
3 Results
3.1 Partial Pressure Profiles. In order to validate themodel we simulated normal air breathing with the parameter
Table 3 Combinations of RR and VT used to obtain VAÄ3.75Ã10À4 ml Õmin
RR ~breaths/min! 3.5 5 7.5 10 12.5 15 20
VT (ml/kg) 21.43 15 10 7.5 6 5 3.75
rnal of Biomechanical Engineering
te
rivity
il-
al-
ues listed in Table 1. In air breathing the annular region betwthe gas core and the tissue layer is gas filled. The governing etions were solved using the physical properties of air insteadPFC. Mean values of the capillary partial pressures overbreath (PCO2 and PCCO2) were computed when the solutionattained a periodic state.PCO2 reached a steady state value of 1mm Hg in 17 breaths whilePCCO2 reached a steady state value38.5 mm Hg in ten breaths.
Figure 4 shows PO2 andPCO2 profiles in the gas-filled annularegion and the tissue layer at different times during the breathcycle. For comparison, a static diffusion profile is also plotteThis static profile was obtained as follows: First, the mean radithe sac and gas core over one breath were computed for therameters in Table 1. Then the steady diffusion equation@Eq. ~7!without the convective and time derivative terms# was solved inthis model using a flow-through gas compartment as describe@14#. This nonconvective model cannot describe second-to-secchanges in tidal breathing and thus the static diffusion result rresents an average profile when convective effects due to thecillatory motion of the sac are neglected.
As expected, both PO2 and PCO2 are almost constant in the sabecause of the relatively large diffusivities of O2 and CO2 in airand linear in the tissue layer. In the convective model Pe´clet num-ber is small, about 0.01. PO2 is seen to be maximum at end inspiration and minimum at end expiration. The opposite is truePCO2 . These results confirm that the mathematical model anumerical scheme result in time periodic solutions and reprodmean partial pressures and profiles that are in agreementwell-established results for air breathing. Convection has v
FEBRUARY 2005, Vol. 127 Õ 53
54
Fig. 9 Effect of varying RR at VTÄ0.5 ml Õkg †„a… and „b…‡ and VT at RRÄ240 breaths Õmin †„c… and „d…‡ on PCO2 andPCCO2 . QNÄ3.57Ã10À4 ml Õmin; circled points correspond to VA ÕQÉ1; QNÄ3.57Ã10À4 ml Õmin; circled points corre-spond to VA ÕQÉ1.
fn
r
rfs
e
b
i
o-med
n in
t
resr
enti-
ion
little effect because Pe is very small. As a result, the static dision profile is qualitatively similar to the profiles from the covective model.
PO2 and PCO2 profiles during PLV are shown in Fig. 5 foRR510 breaths/min, VT57.5 ml/kg and Q5QN53.5731024 ml/min. This choice of parameters matchesVA andQ val-ues used for the air breathing calculations and allows a dicomparison between GV and PLV. The corresponding static dision profile is also plotted. In each case significant partial presgradients exist within the PFC layer and the profiles are curvmost noticeably during inspiration. The static diffusion profialso shows partial pressure gradients due to the relativelydiffusivities of O2 and CO2 in PFC. These gradients are smallthan the gradients in the convective model during inspiration,larger during expiration. The difference in partial pressurestween the gas side (s50) and the capillary side (s52) rangesfrom 9 to 22 mm Hg for O2 and from 1 to 8 mm Hg for CO2 inthe convective model. The corresponding differences in staticfusion are 14 mm Hg (O2) and 4 mm Hg (CO2). These differ-ences are a measure of the driving force for gas transfer andgreatest at midinspiration and smallest at midexpiration inconvective model. This suggests that gas exchange rates aalveolar-blood boundary are highest in the period between mand end-inspiration when both partial pressure gradients andface area are large.
3.2 Effect of Varying VA. Variations in regional ventilationand redistribution of blood flow in a PFC filled lung resultslocal values ofVA , Q, and VA /Q varying widely in different
Õ Vol. 127, FEBRUARY 2005
fu--
ectfu-ureed,lelowr
bute-
dif-
arethet theid-sur-
n
regions of the lung. In order to study the effect of regional inhmogeneities in these quantities on gas exchange, we perforcalculations over a wide range ofVA for low, normal, and highvalues ofQ. SinceVA can be varied by changing either RR orVTwe considered two cases:~1! VT fixed at 7.5 ml/kg, RR variesfrom 2.5 to 25 breaths/min and~2! RR fixed at 10 breaths/min,VTvaries from 2.5 to 25 ml/kg. These choices for RR andVT result inVA varying from 9.3831025 to 1.2531023 ml/min while VA /Qvalues range from 2.6 to 35 at 0.1QN , 0.26 to 3.5 atQN , and0.026 to 0.35 at 10QN .
Figures 6–8 show the effect of varying RR orVT on averagepartial pressures in the gas and blood for different values ofQ.Figure 6 shows that the average partial pressure of oxygeblood, PCO2 , increases while that of carbon dioxide,PCCO2 ,decreases with increasing RR orVT . In each graph the poincorresponding to matched ventilation perfusion (VA /Q'1) ismarked with a circle. At these points the capillary partial pressu(PCO25102.8 mm Hg,PCCO2538.8 mm Hg) are close to theinormal values. The deviation ofPCO2 and PCCO2 from theirnormal values depends on the degree of mismatch between vlation and perfusion. Figure 6 indicates thatPCO2 is most sensi-tive to changes in RR orVT whenQ5QN andVA /Q varies from0.26 to 3.5. When the mismatch between ventilation and perfusis much greater (VA /Q@1 for 0.1QN or VA /Q!1 for 10QN),PCO2 is quite insensitive to changes in RR orVT . In contrastPCCO2 changes significantly at 0.1QN and normalQN .
Figure 7 shows the effect of varying RR andVT on (Pg-PC)O2
Transactions of the ASME
Journal
Fig. 10 Effect of varying RR at VTÄ0.5 ml Õkg †„a… and „b…‡ and VT at RRÄ240 breaths Õmin †„c… and „d…‡ on„Pg-PC…O2 and „PC-Pg…CO2 . QNÄ3.57Ã10À4 ml Õmin; circled points correspond to VA ÕQÉ1.
u
i
hr
n
left
in
ts inas
in
o
with
singers
ehighaf-
and (PC-Pg)CO2 which are measures of alveolar-arterial pressdifferences@(A-a)DO2 and (a-A)DCO2]. In contrast to GV, non-zero pressure differences are found even at matched ventilatperfusion ratios @(Pg-PC)O2510.6 mm Hg, (PC-Pg)CO253.5 mm Hg]. Figures 7~a!–7~b! show that both (Pg-PC)O2 and(PC-Pg)CO2 increase with increasing RR. The differences a
small at low perfusion rates, 0.1QN and do not change much witRR or VT . (Pg-PC)O2 magnitudes and variations with RR a
significantly larger at high perfusion rates, 10QN compared to
normal perfusion rates,QN . In contrast (PC-Pg)CO2 values are
comparable atQN and 10QN ~,2 mm Hg difference!. WhenVT isvaried at constant RR different behavior is seen in Figs. 7~c!–7~d!: (Pg-PC)O2 passes through a maximum with increasingVT
at QN while (PC-Pg)CO2 passes through a maximum at 0.1QN .
The fact that these maxima are not seen for similarVA and Qvalues in Figs. 7~a!–7~b! indicates that (Pg-PC)O2 and(PC-Pg)CO2 are affected by the particular combination of R
andVT used to obtain a givenVA .
3.3 Effect of Varying RR or VT at Constant VA. A givenventilation rateVA can be obtained using different combinatioof RR andVT . A high RR-lowVT combination results in a shortebreathing period and smaller surface area compared to a lowhigh VT combination. We studied how these changes in the alvlar dynamics affect gas exchange by using differentVT-RR com-binations listed in Table 3 to provide a constant value ofVA
53.7531024 ml/min. This particular value ofVA was chosen toprovide VA /Q'1 ratios whenQ5QN . Capillary partial pres-sures andPC-Pg differences are plotted in Fig. 8 for differen
of Biomechanical Engineering
re
on–
re
e
R
srRR-eo-
t
values ofQ. In these figures RR increases as one moves fromto right and the correspondingVT decreases to maintainVA con-stant. In Figs. 8~a!–8~b! PCO2 decreases slightly~less than 4 mmHg! and PCCO2 increases slightly~less than 2 mm Hg! with in-creasing RR. Variations are quite small, butPCO2 changes morethan PCCO2 . As in Figs. 7~a!–7~b!, PCO2 is most sensitive atQ5QN while PCCO2 is most sensitive atQ50.1QN . Thus a highRR-low VT combination results in a very slight deteriorationgas exchange, quantified by lowerPCO2 and higherPCCO2 val-ues. To explain this observation, note that increasing RR resula faster flow while increasingVT leads to a larger surface areawell as faster flow. The combination of these two effects resultsless efficient gas exchange at a high RR-lowVT combinationcompared to a low RR-highVT one at any givenVA . Figures8~c!–8~d! indicate thatPC-Pg differences are more sensitive tRR-VT combinations for both O2 and CO2 . For both gasesPC-Pgvalues increase by 50%–66% as RR is increased. VariationsRR are most significant at 10QN for O2 while they are of similarmagnitude atQN and 10QN for CO2 .
3.4 High Frequency Oscillation With PLV „HFO¿PLV ….The previous results indicate that increasing RR and decreaVT while maintaining a given ventilation rate results in lowPCO2 , higherPCCO2 and largerPC-Pg differences. These trendbecome more pronounced in HFO1PLV where very high respira-tory rates are used in conjunction with small tidal volumes. Wstudied gas exchange with parameter values relevant to thefrequency regime in order to determine how gas exchange isfected under these conditions.
As in the case of conventional PLV,VA was varied first at
FEBRUARY 2005, Vol. 127 Õ 55
56 Õ Vol. 127
Fig. 11 Variation of „a… PCO2 , PgO2 „left axis …, „Pg-PC…O2 „right axis … and „b… dimensionlessventilation „VA… and mass transfer „VO2… rates over one breath for PeÄ0.001. VA and VO2 arescaled with their peak values.
constantVT and then at constant RR atQ50.1QN , QN , and10QN . In the first case, RR was varied in the range 60–9breaths/min atVT50.5 ml/kg. In the second case, RR was fixed240 breaths/min andVT varied from 0.1 to 5 ml/kg. These rangeof RR andVT result in VA values in the range 1.2031024– 2.25
, FEBRUARY 2005
00ats
31023 ml/min. VA /Q values lie in the range 3.4–63 at 0.1QN ,0.34–6.3 atQN , and 0.034–0.63 at 10QN . These values arehigher than the ones in the conventional PLV calculations.
Capillary partial pressures andPC-Pg differences are plotted inFigs. 9 and 10. As seen in Figs. 9~a! and 9~b!, PCO2 increases and
Transactions of the ASME
Journal of Biome
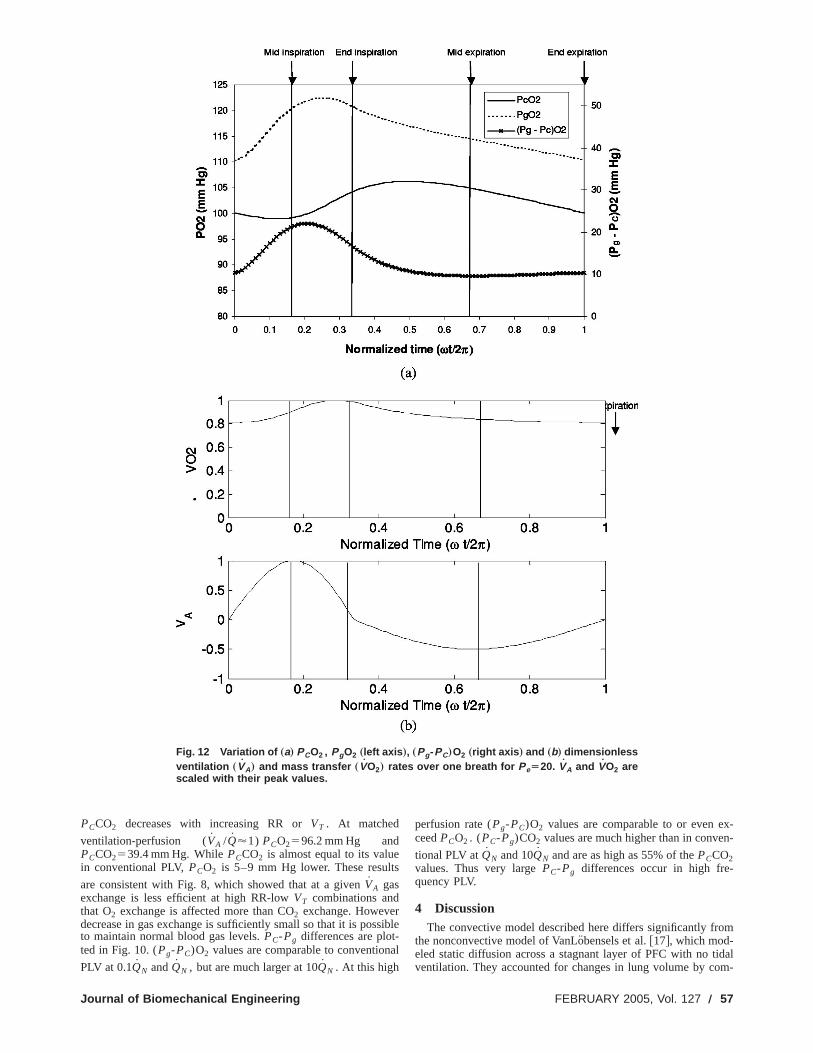
Fig. 12 Variation of „a… PCO2 , PgO2 „left axis …, „Pg-PC…O2 „right axis … and „b… dimensionlessventilation „VA… and mass transfer „VO2… rates over one breath for PeÄ20. VA and VO2 arescaled with their peak values.
s
s
x-n-
m
idalm-
PCCO2 decreases with increasing RR orVT . At matched
ventilation-perfusion (VA /Q'1) PCO2596.2 mm Hg andPCCO2539.4 mm Hg. WhilePCCO2 is almost equal to its valuein conventional PLV,PCO2 is 5–9 mm Hg lower. These result
are consistent with Fig. 8, which showed that at a givenVA gasexchange is less efficient at high RR-lowVT combinations andthat O2 exchange is affected more than CO2 exchange. Howeverdecrease in gas exchange is sufficiently small so that it is posto maintain normal blood gas levels.PC-Pg differences are plot-ted in Fig. 10. (Pg-PC)O2 values are comparable to convention
PLV at 0.1QN andQN , but are much larger at 10QN . At this high
chanical Engineering
ible
al
perfusion rate (Pg-PC)O2 values are comparable to or even eceedPCO2 . (PC-Pg)CO2 values are much higher than in conve
tional PLV atQN and 10QN and are as high as 55% of thePCCO2values. Thus very largePC-Pg differences occur in high fre-quency PLV.
4 DiscussionThe convective model described here differs significantly fro
the nonconvective model of VanLo¨bensels et al.@17#, which mod-eled static diffusion across a stagnant layer of PFC with no tventilation. They accounted for changes in lung volume by co
FEBRUARY 2005, Vol. 127 Õ 57
s
t
e
i
aina
t
r
a
ss1
r
u
-
tf
,
arly
hex-e ofol-
iontes.so
e as
at
on-%rget be
thetowdsR-
al
r
althethe
tallye theith
FC
the
s.ns-the
nter,aten al-etrysacal
alls-
rapay
ndre-
rch
puting steady statePC and Pg values at different sac radii corresponding to end expiratory and end inspiratory conditions. Thia quasistatic, Pe!1, approach which assumes that the capillaand gas side pressure quickly equilibrate to their steady stateues after a volume change. As the authors point out, this mmore accurately represent the effect of breath holding rathertidal ventilation. Using this approach they found thatPC-Pg dif-ferences are smallest at end inspiration when the PFC layethinnest and largest at end expiration when the PFC layer is thest, as one would expect in static diffusion. We show that vdifferent results are obtained when tidal ventilation is includeda PLV model. The typical time required to reach steady statesystem with length scaleR and diffusivity D is TD;R2/D. InPLV, TD;18 s for a sac of radiusR5300mm and D5531025 cm2/s. The typical time scale of ventilation over whiclung volume changes isTV;1/v51/(2pRR/60)51 s for abreathing rate RR510 breaths/min. The ratioTD /TV;vR2/D isthe Peclet number, Pe, whose magnitude is 0.001–0.01 in GV15–50 in PLV. Low values of Pe in GV indicate that diffusionfast compared to ventilation and the quasistatic assumptiovalid. However, in PLV there is insufficient time for the equilibrtion of gas and capillary side partial pressures and thereforenot appropriate to model the effects of ventilation by steady ssolutions at different lung volumes.
In order to quantify the effect of nonzero Pe onPC and Pg inPLV, we compared two cases, one with a very low respiratoryRR5531024 breaths/minute~Pe50.001! and a second with anormal respiratory rate RR510 breaths/minute~Pe520!. In eachcase the other parameters were fixed at FRC530 ml/kg, VT
57.5 ml/kg, PFC dose525 ml/kg, and Q5QN53.5731024 ml/min. For the low Pe,PCO2 , PgO2 , and (Pg-PC)O2are plotted over one breath in Fig. 11~a!. Dimensionless forms ofthe sac radius, RS(t), the ventilation rate VA
54pRS2(t)dRS(t)/dt and the mass transfer rateVO2 are shown in
Fig. 11~b!. RS(t) is scaled withRFRC while VA andVO2 are scaledwith their maximum values over one breath. Figures 12~a! and12~b! show the same quantities for the higher Pe. When50.001,PCO2 , PgO2 , (Pg-PC)O2 , VA andVO2 are all in phase.During the inspiratory phase of the cycle pressures and mtransfer rate increase withVA and reach their maximum valuesmid inspiration, whenVA is highest.PCO2 and PgO2 decreaseduring the latter half of inspiration, become essentially equalend inspiration, whenVA is zero, and remain so during the expratory phase. Almost all the gas exchange occurs during insption. Thus when diffusion is fast compared to ventilation~Pe!1!the dynamics are essentially quasistatic, i.e., the capillaryreacts almost instantaneously to changes in the gas side pres
The situation is quite different for larger Pe, as seen in Fig.When Pe@1, PCO2 requires a finite time to respond to changesPgO2 resulting from ventilation. Therefore the partial pressuare no longer in phase andPCO2 lags behindPgO2 as seen in Fig.12~a!. This phase difference leads to some counterintuitive resFor instance, during the initial stages of inspiration, asVA in-creases, PCO2 decreases. However PgO2 increases and the neeffect leads to higherPC-Pg differences when ventilation is increased holding perfusion constant. At end inspiration,PCO2 isincreasing whilePgO2 is decreasing. As a result (Pg-PC)O2 is notminimum when the PFC layer is thinnest, but at a later time incycle. Figure 12~b! indicates thatVO2 remains higher than 80% oits peak value during expiration and the mass transfer rate remnearly constant throughout the cycle.
4.1 Summary. Gas transport mechanisms in GV and PLare very different, since Pe´clet numbers are small in GV~Pe50.001–0.01! compared to PLV~Pe515–50!. Significant partialpressure gradients in the PFC layer and nonzeroPC-Pg differ-ences exist in PLV. The higher Pe´clet numbers in PLV result in
58 Õ Vol. 127, FEBRUARY 2005
-is
ryval-ay
han
r isick-ryin
n a
h
nds
is-
it isate
ate
Pe
asst
byi-ira-
ideures.2.
ines
lts.
t
he
ains
V
phase differences betweenPC andPg over the course of a breathwhich contribute to the nonzeroPC-Pg values that persistthroughout the respiratory cycle. The mass transfer rate is neconstant throughout the breath when Pe@1, but when Pe!1 al-most all the transport occurs during inspiration.
One of the aims of our modeling effort was to determine teffect of different ratios of ventilation and perfusion on gas echange in PLV. We examined gas exchange over a wide rangventilation rates by varying either the respiratory rate or tidal vume at low, normal, and high perfusion rates.PCO2 was found tobe most sensitive to changes in ventilation at normal perfusrates, but did not change much at low and high perfusion raWhile PCO2 was most sensitive at low perfusion rates it alshowed significant changes at normal perfusion rates. (Pg-PC)O2varied over a wide range at high perfusion rates and could blarge asPCO2 in conventional PLV and up to 33PCO2 in HFO1PLV. However, it did not vary much with the ventilation ratelow and normal perfusion rates. In contrast, (PC-Pg)CO2 valueswere comparable at normal and high perfusion rates in both cventional PLV and HFO1PLV and could be as large as 50%–66of the PCCO2 values. A practical consequence of these laPC-Pg differences is that expired gas partial pressures may noaccurate indicators of arterial blood gas pressures.
An interesting finding was that gas exchange depends onparticular combination of respiratory rate and tidal volume usedobtain a given ventilation rate. It was found that using a loRR-highVT combination to achieve a given ventilation rate leato slightly more efficient gas exchange compared to a high Rlow VT combination as quantified by lowerPCO2 and higherPCCO2 . This may be one factor that can help explain clinicobservations that gas exchange is not improved in HFO1PLVcompared to conventional PLV@19,21,22#. The effect of differentRR-VT combinations is most noticeable in thePC-Pg differences:Both (Pg-PC)O2 and (PC-Pg)CO2 are up to 50%–65% highefor a high RR-lowVT combination compared to a low RR-highVTcombination at the same ventilation rate.
While our work provides significant insight into the physicmechanisms responsible for transport in a PFC filled lung,results cannot be directly compared to experimental data sincemodel describes transport in a single alveolar sac. Experimenmeasured quantities such as arterial blood gas pressures arweighted mean of the contributions of a number of such sacs wa heterogeneous distribution of ventilation, perfusion, and Pvolume. The partial pressure of gas entering the sac (Pin) is speci-fied as an input parameter in the current model. In reality, onlypartial pressure at the mouth is known andPin must be calculatedby accounting for diffusion and mixing in the conducting airwayA possible extension to the model would account for these traport processes in the conducting airways by incorporatingtrumpet-shaped model of Paiva@37#. Finally, the sac geometrywas idealized to be spherical with gas entering through the ceresulting in a radial flow field in the PFC layer. In a more accurrepresentation, the sac is connected to an airway through aveolar duct that serves as a conduit for flow. Such a geomwould lead to more complicated flow patterns inside the@38,39# and affect convective transport. In addition, the interngeometry of the sac is not smooth, but lined with the septal wof individual alveloli. This may lead to the formation of recirculation regions within the sac. In steady flows such regions tliquid and lead to poor transport. However, the recirculations mexhibit temporal growth and decay during tidal ventilation aimprove transport by enhancing mixing. These considerationsmain to be explored in future work.
AcknowledgmentsThis work was supported by NIH Bioengineering Resea
Partnership Grant No. HL64373.
Transactions of the ASME
e
e
n
e
a
e
u
o
.
eim
tiali-
gute
-and
rit.
s-ppl.
inJ.
Oise
O
an
Nor-
ide
r-e
ofJ.
aya-
d,’’
s
of
lly
References@1# Clark, L. C., and Gollan, F., 1966, ‘‘Survival of Mammals Breathing Organ
Liquids Equilibrated With Oxygen at Atmospheric Pressure,’’ Science,152, p.1755.
@2# Curtis, S., Peek, J., and Kelly, D., 1993, ‘‘Partial Liquid Breathing With Pflubron Improves Arterial Oxygenation in Acute Canine Lung Injury,’’ J. AppPhysiol.,75, pp. 2696–2702.
@3# Hirschl, R. B. et al., 1995, ‘‘Improvement of Gas Exchange, Pulmonary Fution, and Lung Injury With Partial Liquid Ventilation. A Study Model in aSetting of Severe Respiratory Failure,’’ Chest,108, pp. 500–508.
@4# Leach, C. L. et al., 1993, ‘‘Perfluorocarbon-Associated Gas Exchange~PartialLiquid Ventilation! in Respiratory Distress Syndrome: A Prospective, Randoized, Controlled Study,’’ Crit. Care Med.,21, pp. 1270–1278.
@5# Papo, M. C. et al., 1996, ‘‘Perfluorocarbon-Associated Gas Exchangeproves Oxygenation, Lung Mechanics, and Survival in a Model of Adult Rpiratory Distress Syndrome,’’ Crit. Care Med.,24, pp. 466–474.
@6# Quintel, M. et al., 1998, ‘‘Computer Tomographic Assessment of Perfluocarbon and Gas Distribution During Partial Liquid Ventilation for Acute Repiratory Failure,’’ Crit. Care Med.,158, pp. 249–255.
@7# Gauger, P. G. et al., 1996, ‘‘Initial Experience With Partial Liquid Ventilatioin Pediatric Patients With the Acute Respiratory Distress Syndrome,’’ CCare Med.,24, pp. 16–22.
@8# Greenspan, J. S. et al., 1999, ‘‘Partial Liquid Ventilation in Critically Ill Infants Receiving Extracorporeal Life Support,’’ Pediatrics,99, p. E2.
@9# Hirschl, R. B. et al., 1996, ‘‘Initial Experience With Partial Liquid Ventilatioin Adult Patients With the Acute Respiratory Distress Syndrome,’’ JAMA,Am. Med. Assoc.,275, pp. 383–389.
@10# Hirschl, R. B. et al., 2002, ‘‘Prospective, Randomized, Controlled Pilot Stuof Partial Liquid Ventilation in Adult Acute Respiratory Distress SyndromeAm. J. Respir. Crit. Care Med.,165, pp. 781–787.
@11# Leach, C. L. et al., 1996, ‘‘Partial Liquid Ventilation With Perflubron in Prmature Infants With Severe Respiratory Distress Syndrome: The LiquiVStudy Group,’’ N. Engl. J. Med.,335, pp. 761–767.
@12# Doctor, A. et al., 1998, ‘‘Pulmonary Blood Flow Distribution During PartiLiquid Ventilation,’’ J. Appl. Physiol.,84, pp. 1540–1550.
@13# Morris, K. P. et al., 2002, ‘‘Distribution of Pulmonary Blood Flow in thPerfluorocarbon-Filled Lung,’’ Intensive Care Med.,26, pp. 756–763.
@14# Mates, E. A. et al., 1997, ‘‘Shunt and Ventilation-Perfusion Distribution Ding Partial Liquid Ventilation in Healthy Piglets,’’ J. Appl. Physiol.,82, pp.933–942.
@15# Lim, C. M. et al., 2001, ‘‘Effect of Increasing Perfluorocarbon DoseV~Over Dot!A/Q~Over Dot! Distribution During Partial Liquid Ventilation inAcute Lung Injury,’’ Anesthesiology,94, pp. 637–642.
@16# Harris, R. S. et al., 2002, ‘‘Regional VA, Q, and VA/Q During PLV: Effects oNitroprusside and Inhaled Nitric Oxide,’’ J. Appl. Physiol.,92, pp. 297–312.
@17# van Lobensels, E. M., Anderson, J. C., Hildebrandt, J., and Hlastala, M1999, ‘‘Modeling Diffusion Limitation of Gas Exchange in Lungs ContaininPerfluorocarbon,’’ J. Appl. Physiol.,86, pp. 273–284.
@18# Cox, P. N. et al., 1997, ‘‘Concealed Air Leak Associated With Large TidVolumes in Partial Liquid Ventilation,’’ Am. J. Respir. Crit. Care Med.,156,pp. 992–997.
@19# Doctor, A. et al., 2001, ‘‘High-Frequency Oscillatory Ventilation of thPerfluorocarbon-Filled Lung: Dose-Response Relationships in an AnModel of Acute Lung Injury,’’ Crit. Care Med.,29, pp. 847–854.
Journal of Biomechanical Engineering
ic
r-l.
nc-
m-
Im-s-
ro-s-
nrit.
-
J.
dy,’’
-ent
l
r-
n
f
P.,g
al
al
@20# Gothberg, S. et al., 2002, ‘‘High-Frequency Oscillatory Ventilation and ParLiquid Ventilation After Acute Lung Injury in Premature Lambs With Respratory Distress Syndrome,’’ Crit. Care Med.,28, pp. 2450–2456.
@21# Smith, K. M. et al., 1997, ‘‘Partial Liquid Ventilation: a Comparison UsinConventional and High-Frequency Techniques in an Animal Model of AcRespiratory Failure,’’ Crit. Care Med.,25, pp. 1179–1186.
@22# Smith, K. M. et al., 1997, ‘‘Prolonged Partial Liquid Ventilation Using Conventional and High-Frequency Ventilatory Techniques: Gas ExchangeLung Pathology in an Animal Model of Respiratory Distress Syndrome,’’ CCare Med.,25, pp. 1888–1897.
@23# Sukumar, M. et al., 1998, ‘‘High-Frequency Partial Liquid Ventilation in Repiratory Distress Syndrome: Hemodynamics and Gas Exchange,’’ J. APhysiol.,84, pp. 327–334.
@24# Gefen, A., Elad, D., and Shiner, R. J., 1999, ‘‘Analysis of Stress Distributionthe Alveolar Septa of Normal and Simulated Emphysematic Lungs,’’Biomed. Opt.,32, pp. 891–897.
@25# Guyton, A. C., 1986,Textbook of Medical Physiology, 7th ed., W. B. SaundersCompany, Philadelphia.
@26# Severinghaus, J. W., 1979, ‘‘Simple, Accurate Equations for Human-Blood2Dissociation Computations,’’ J. Appl. Physiol.: Respir., Environ. ExercPhysiol.,46, pp. 599–602.
@27# Kelman, G. R., 1967, ‘‘Digital Computer Procedure for Conversion of Pc2Into Blood Co2 Content,’’ Respir. Physiol.,3, pp. 111.
@28# Weibel, E. R., 1963,Morphometry of the Human Lung, Academic, New York,p. 151.
@29# Haefeli-Bleuer, B., and Weibel, E. R., 1988, ‘‘Morphometry of the HumPulmonary Acinus,’’ Anat. Rec.,220, pp. 401–414.
@30# Hernan, L. J. et al., 1996, ‘‘Perfluorocarbon-Associated Gas Exchange inmal and Acid-Injured Large Sheep,’’ Crit. Care Med.,24, pp. 475–481.
@31# Overbeck, M. C. et al., 1996, ‘‘Efficacy of Perfluorocarbon Partial LiquVentilation in a Large Animal Model of Acute Respiratory Failure,’’ Crit. CarMed., 24, pp. 1208–1214.
@32# Baden, H. P. et al., 1997, ‘‘High-Frequency Oscillatory Ventilation With Patial Liquid Ventilation in a Model of Acute Respiratory Failure,’’ Crit. CarMed., 25, pp. 299–302.
@33# Hoskyns, E. W., Milner, A. D., and Hopkin, I. E., 1992, ‘‘MeasurementTidal Lung Volumes in Neonates During High-Frequency Oscillation,’’Biomed. Eng.,14, pp. 16–20.
@34# Scalfaro, P. et al., 2001, ‘‘Reliable Tidal Volume Estimates at the AirwOpening With an Infant Monitor During High-Frequency Oscillatory Ventiltion,’’ Crit. Care Med.,29, pp. 1925–1930.
@35# Lango, T., Morland, T., and Brubakk, A. O., 1996, ‘‘Diffusion Coefficients anSolubility Coefficients for Gases in Biological Fluids and Tissues: A ReviewUndersea Hyperbaric Med.,23, pp. 247–272.
@36# Tham, M. K., Walker, R. D., and Modell, J. H., 1973, ‘‘Diffusion-Coefficientof O2 , N2 , and Co2 in Fluorinated Ethers,’’ J. Chem. Eng. Data,18, pp.411–412.
@37# Paiva, M., 1973, ‘‘Gas Transport in Human Lung,’’ J. Appl. Physiol.,35, pp.401–410.
@38# Davidson, M. R., and Fitz-Gerald, J. M., 1972, ‘‘Flow Patterns in ModelsSmall Airway Units of Lung,’’ J. Fluid Mech.,52, p. 161.
@39# Wei, H. H., and Grotberg, J. B., ‘‘Flow and Transport in a RhythmicaBreathing Alveolus Partially Filled With Liquid,’’ Phys. Fluids~Submitted!.