A Medium Term Conflict Detection and Resolution system for Terminal Maneuvering Area based on Spatial Data Structures and 4D Trajectories Sergio Ruiz a,⇑ , Miquel A. Piera a , Isabel Del Pozo b a Technical Innovation Cluster on Aeronautical Management, Universidad Autònoma de Barcelona, Sabadell, Spain b Boeing Research & Technology Europe, Madrid, Spain article info Keywords: Conflict detection and resolution algorithms Time–distance separation 4D trajectories Air traffic management Single European Sky ATM Research (SESAR) Airspace capacity abstract In this paper an efficient Medium Term Conflict Detection and Resolution (MTCD&R) approach based on 4D trajectories to solve conflicts in a Terminal Maneuvering Area (TMA) is presented. The conflict detection subsystem (CD) is based on a Spatial Data Struc- ture (SDS), avoiding non-efficient pairwise trajectory comparisons, and using a simplified wake vortex modeling through 4D tubes to detect time-based separation infringements between aircraft. The conflict resolution subsystem (CR) solves the detected conflicts with an efficient and dynamic 3D allocation of the arrival routes that takes into consideration the execution of Continuous Descent Approaches (CDAs). Algorithms have been tested with several stressing traffic scenarios (rush hour and saturation rush hour) taking place in a 3D simulation model of Gran Canaria Extended TMA. The resulting conflict-free trajectories have been validated for flyability conformance both with real A380 FMS avionics and with a certified B738 Full Flight Simulator. A new CR performance metric to measure the degree of runway utilization is also proposed in order to enable comparisons between different MTCD&R systems. Finally, a discussion about strengths and limitations of the algorithms for reducing controller’s workload while increasing airspace capacity of the future Single European Sky is outlined. Ó 2012 Elsevier Ltd. All rights reserved. 1. Introduction The European Commission (EC) and the European Organization for the Safety of Air Navigation (EUROCONTROL) started in 2005 a program called SESAR (Single European Sky ATM Research) whose main goal is to modernize the technologies, avi- onics and procedures used in the European Air Traffic Management (ATM) system in order to: improve predictability throughout the whole system, increase capacity, productivity and safety of the ATM, and reduce environmental noise and emissions (SESAR Consortium, 2007, 2009). One of the most important challenges to reach these targets consists on the introduction of the Trajectory Based Opera- tions (TBOs), which implies the use of 4D trajectories (trajectories defined in the three spatial dimensions together with a time-stamp), also known as Business Trajectories (BTs) in the SESAR’s terminology for civil flights (Cook, 2010). The required technologies to enable and support this new ATM paradigm include, among others, precise navigation equipment (P-RNAV) based on satellite technologies (GNSS) (Civil Aviation Safety Authority (Australian Goverment), 2006; EUROCONTROL, 2007a, 2007b), and aircraft-state information broadcasting and self-separation systems (ADS-B) (EUROCONTROL, 2007a). With regards to the capacity of the ATM, nowadays the high volume of air traffic observed in Europe, combined with the current procedures used to manage the air traffic flows, causes the saturation of several air sectors during most confluent 0968-090X/$ - see front matter Ó 2012 Elsevier Ltd. All rights reserved. http://dx.doi.org/10.1016/j.trc.2012.10.005 ⇑ Corresponding author. Tel.: +34 937287754. E-mail address: [email protected](S. Ruiz). Transportation Research Part C 26 (2013) 396–417 Contents lists available at SciVerse ScienceDirect Transportation Research Part C journal homepage: www.elsevier.com/locate/trc
Transcript
Transportation Research Part C 26 (2013) 396–417
Contents lists available at SciVerse ScienceDirect
Transportation Research Part C
journal homepage: www.elsevier .com/locate / t rc
A Medium Term Conflict Detection and Resolution system forTerminal Maneuvering Area based on Spatial Data Structuresand 4D Trajectories
Sergio Ruiz a,⇑, Miquel A. Piera a, Isabel Del Pozo b
a Technical Innovation Cluster on Aeronautical Management, Universidad Autònoma de Barcelona, Sabadell, Spainb Boeing Research & Technology Europe, Madrid, Spain
a r t i c l e i n f o
Keywords:Conflict detection and resolution algorithms
Time–distance separation4D trajectoriesAir traffic managementSingle European Sky ATM Research (SESAR)Airspace capacity
0968-090X/$ - see front matter � 2012 Elsevier Ltdhttp://dx.doi.org/10.1016/j.trc.2012.10.005
In this paper an efficient Medium Term Conflict Detection and Resolution (MTCD&R)approach based on 4D trajectories to solve conflicts in a Terminal Maneuvering Area(TMA) is presented. The conflict detection subsystem (CD) is based on a Spatial Data Struc-ture (SDS), avoiding non-efficient pairwise trajectory comparisons, and using a simplifiedwake vortex modeling through 4D tubes to detect time-based separation infringementsbetween aircraft. The conflict resolution subsystem (CR) solves the detected conflicts withan efficient and dynamic 3D allocation of the arrival routes that takes into considerationthe execution of Continuous Descent Approaches (CDAs). Algorithms have been tested withseveral stressing traffic scenarios (rush hour and saturation rush hour) taking place in a 3Dsimulation model of Gran Canaria Extended TMA. The resulting conflict-free trajectorieshave been validated for flyability conformance both with real A380 FMS avionics and witha certified B738 Full Flight Simulator. A new CR performance metric to measure the degreeof runway utilization is also proposed in order to enable comparisons between differentMTCD&R systems. Finally, a discussion about strengths and limitations of the algorithmsfor reducing controller’s workload while increasing airspace capacity of the future SingleEuropean Sky is outlined.
� 2012 Elsevier Ltd. All rights reserved.
1. Introduction
The European Commission (EC) and the European Organization for the Safety of Air Navigation (EUROCONTROL) startedin 2005 a program called SESAR (Single European Sky ATM Research) whose main goal is to modernize the technologies, avi-onics and procedures used in the European Air Traffic Management (ATM) system in order to: improve predictabilitythroughout the whole system, increase capacity, productivity and safety of the ATM, and reduce environmental noise andemissions (SESAR Consortium, 2007, 2009).
One of the most important challenges to reach these targets consists on the introduction of the Trajectory Based Opera-tions (TBOs), which implies the use of 4D trajectories (trajectories defined in the three spatial dimensions together with atime-stamp), also known as Business Trajectories (BTs) in the SESAR’s terminology for civil flights (Cook, 2010). The requiredtechnologies to enable and support this new ATM paradigm include, among others, precise navigation equipment (P-RNAV)based on satellite technologies (GNSS) (Civil Aviation Safety Authority (Australian Goverment), 2006; EUROCONTROL, 2007a,2007b), and aircraft-state information broadcasting and self-separation systems (ADS-B) (EUROCONTROL, 2007a).
With regards to the capacity of the ATM, nowadays the high volume of air traffic observed in Europe, combined with thecurrent procedures used to manage the air traffic flows, causes the saturation of several air sectors during most confluent
S. Ruiz et al. / Transportation Research Part C 26 (2013) 396–417 397
hours, particularly in those Terminal Maneuvering Area sectors (TMAs) at where the most demanded airports are located(EUROCONTROL, 2001; NATS, 2009; SESAR Consortium, 2009).
Over decades, air traffic controllers have been able to maintain a safe and orderly flow of air traffic in TMAs, using via-voice communications and traditional management operations, such as FIFO landing sequencings and aircraft in holding pro-cedures (a predetermined maneuver which keeps an aircraft within a specified airspace while awaiting further clearance; seeFig. 1), operations mainly based on ICAO (International Civil Aviation Organization) procedures (ICAO, 2005, 2007; Castelliet al., 2010).
However, when the number of trajectories and the interactions among them are relatively high within the TMA (i.e. high-com-plexity terminal operations occur, in terms of SESAR), the task-load of controllers is then intensified, usually up to saturation, thusprovoking the congestion of the sector (SESAR Consortium, 2007). As consequence, more frequent and longer holding trajectoriesare observed nearby the airports, which results on important extra fuel consumption and pollution (SESAR Consortium, 2008;NATS, 2009). In addition, delays may be affecting to takeoff and landing operations, which quickly propagate backwards andmay also affect other TMAs and the whole ATM (i.e. TMAs are currently one of the main bottlenecks of the ATM system) (Xuet al., 2005; EUROCONTROL, 2008a). Considering that it is forecasted an increment of the air traffic flows in a factor of 2� or3� by 2030 (EUROCONTROL, 2008a, 2008b), it is clear the necessity of finding new ways to increase the current ATM capacity.
To achieve the needed threefold capacity it is required to improve management procedures and aircraft operations in or-der to ensure a perfect synchronization of all air traffic flows, particularly improving the runway’s throughput (minimizing inthis manner the average delay per aircraft and its negative effects), and reducing the task-load of air traffic controllers, spe-cially during high-complexity terminal operations (EUROCONTROL, 2008b; Djokic et al., 2010).
Medium Term Conflict Detection and Resolution systems (MTCD&R) are planning tools designed to help controllers man-aging air traffic flows at tactical level (medium term), providing with real-time information about possible future conflicts(understanding a conflict as a loss of due separation between two or more aircraft (ICAO, 2007; EUROCONTROL, 2006)) with-in a foreseen time-window of 20–30 min, and also providing with possible ways of solving those conflicts (EUROCONTROL,2006; SESAR Consortium, 2009).
In this paper it is presented an efficient MTCD&R approach for TMA using a simplified wake vortex envelope model (i.e.4D tubes enveloping the worst-cases of the stochastic vortex behavior) to detect conflicts among 4D trajectories taking intoconsideration the current time-based separation standards. Resolution amendments are then computed in order to synchro-nize and merge the traffic approaching to an airport, giving priority to obtain a good runway throughput (without misleadingsafety) while allowing the execution of efficient aircraft descent profiles (i.e. CDAs).
The concept of operation of this research assumes convergent traffic to a single runway only, with an aircraft mix of Hea-vy and Medium categories (according to ICAO vortex categorization) and under no-wind conditions. To better introduce thekey aspects of the research, only the nominal model of the MTCD&R algorithms is presented (i.e. with a limited set of uncer-tainty sources under consideration), thus: a) a simplified wake vortex behavior is specified, b) perfect or near-perfect exe-cution of 4D trajectories is assumed, and c) no relevant weather effects nor other classes of perturbations is considered. Abrief discussion about how uncertainty may affect the nominal model is outlined in Section 6.
These MTCD&R algorithms were initially designed under the ATLANTIDA project (leaded by Boeing Research & Technol-ogy Europe) in order to detect tactical conflicts among a set of UAVs maneuvering under Free-Flight conditions. After that,same algorithms were scaled to detect and solve conflicts among Heavy and Medium aircraft in Canary Islands and obtainedresults are presented in this paper. More recently, the STREAM research project (a SESAR’s WP-E leaded by ALG-INDRA) hasalso adopted some of the ideas presented in this paper, specifically the usage of Spatial Data Structures for conflict detectionand resolution at strategic level (long term) with a seamless coordination with the tactical level (medium term) (Ranieriet al., 2011).
2. State of the art
2.1. Description of a conflict
There are different types of conflicts. ICAO 6108873-DOC-4444 documentation (ICAO, 2007) describes the minimumsafety distances to be preserved between aircraft. It defines the required vertical, horizontal and temporal safety distances
Fig. 1. Holding procedure.
398 S. Ruiz et al. / Transportation Research Part C 26 (2013) 396–417
to minimize the probability of collision. Temporal safety distances, which state the necessary lapse of time in which an air-craft cannot cross the same space than a previous aircraft, are also required to avoid dangerous encounters with the turbu-lences (wake vortex), generated by previous aircraft.
For simplicity purposes, in this paper only temporal safety distances to avoid vortex encounters in TMA are considered,which is of interest of SESAR’s Service Level 5 (spatial safety distances can also be afforded by setting the same algorithmspresented in this paper).
Different temporal distances are defined depending on the aircraft weight categories. Heavy/Medium aircraft generatebigger and stronger vortexes than other smaller aircraft, especially in low altitudes and at slow speeds (i.e. most dangerousvortex encounters occur during Heavy/Medium taking-off and landing operations). Vortexes remain in the air form 80 s to150 s and sink down up to 1000 ft (300 m) under the aircraft that generated them (see Figs. 2 and 3). Vortexes spread lat-erally no more than twice the wingspan of the aircraft (which is about 60 m in case of biggest Heavy-class aircraft like B777).Lateral winds can move the vortex from its original position (Dole, 1994; Blajev, 2006); no-wind or soft-wind conditions areconsidered in this research, thus vortexes may be assumed to remain static with respect the aircraft trajectory in the hor-izontal plane (dynamic and uncertain behavior could be also managed; see Section 6 about Uncertainty).
2.2. Conflict categorization
When a conflict is detected it can be classified into several different categories (Isaacson and Robinson, 2001; Isaacs andBrooks, 2008). Since only convergent traffic is considered in this paper (all the aircraft flying towards a single runway), theclassification of the conflicts can be simplified in two categories, the catch-up type and the merging type.
A catch-up conflict occurs when there are two aircraft following the same path and the trailing aircraft is speedy enoughto catch the leading aircraft, inducing a safety distance infringement.
A merging conflict occurs when two aircraft coming by different routes find each other in a merging point of these routes,trespassing the required safety distances. Note that in this case, it is not a necessary condition that the trailing aircraft flies athigher speed than the leading aircraft.
2.3. Basic aspects of MTCD&R systems
MTCD&R systems can be designed separately as two different but coordinated subsystems, one of them in charge of theconflict detection (CD), and another one in charge of the conflict resolution (CR). Both subsystems can be classified accordingto the way they handle detection/resolution when multiple conflicts among two or more trajectories happen. It is referred asa pairwise strategy when the algorithms sequentially detect/solve considering the minimum safety distances between eachpair of trajectories, or it is referred as a global strategy when the entire traffic situation is examined simultaneously (Kucharand Yang, 2000).
Pairwise-based algorithms are simple and easy to code but imply high inefficiencies in computational terms when a con-siderable amount of aircraft are processed (Reif and Sharir, 1985; Chiang et al., 1997).
Currently, CD algorithms that are implemented in operational MTCD applications (CTAS, FASTI, iFACTS, ERATO or VAFOR-IT, among others) are mainly based on pairwise strategies (EUROCONTROL, 2002a, 2007b, 2010). Automated CR tools are cur-rently under development, but early operational applications are also based on pairwise strategies (EUROCONTROL, 2002b,2007c; Kupfer et al., 2008).
Fig. 2. Top view of vortex.
Fig. 3. Lateral view of vortex.
S. Ruiz et al. / Transportation Research Part C 26 (2013) 396–417 399
On the other hand, SESAR’s Service Level 5 is defined with the use of time-based aircraft separations in the TMA opera-tions, set to avoid aircraft instabilities due the wake vortex (turbulences) encounters (SESAR Consortium, 2008; Cook, 2010).Furthermore, FLYSAFE and WAKE4D projects also stated the importance of taking into account wake vortex hazards not onlyin take-off and landing operations but also in cruise traffic (Desenfans et al., 2007; Group for Research in Turbulence andVertical Flows, 2010). The implementation of temporal distances for safety factors could provide important benefits to min-imize airspace latent capacity.
An efficient CD algorithm is presented in this paper, which allows managing either spatial or temporal distances, withexcellent computational performance, and storing the whole state space of the problem (characteristic that opens the pos-sibility to design new CR algorithms that take advantage of this crucial information). In this paper, the algorithm has been setto work with time-distance separations by using a time-representation of the wake vortex generated by aircraft. The CR willtake relevant data from the state-space stored in the CD in order to generate resolution maneuvers that solve the conflicts.
3. CD algorithm
3.1. Representation and storage of spatio-temporal information
The main objective of a CD system is to detect conflicts between trajectories and inform the CR system. The CR system willneed a minimum amount of information about the conflicts for the resolution process. The idea behind the CD proposed inthis paper is similar to take a ‘‘snapshot’’ of the scenario in where the aircraft execute their trajectories, providing in thismanner to the CR system with the required information.
As happens with digital snapshots, first it is necessary to discretize the information in order to make it computer-tractableand store it in a digital database. Discretization will convert the continuous space of a certain scenario into a set of pixels thatstores a discrete approximation of the original scenario.
It is important to point out that, by sorting the 4D information in a spatial structure, the information of a certain place canbe easily stored/recovered into/from a database applying simple mathematical formulas. Concretely, the (discretized) unitsof information of the database can be sorted according to the (discretized) spatial positions they occupy in the space.
This kind of databases storing relevant information (i.e. state-space variables) sorted according to its position within acertain spatial region is called Spatial Data Structures (SDS) (Samet, 1989, 1990; Reynolds, 2000, 2006). The name of theSDS reflects the fact that the proper structure of the database stores the information about the spatial position (the coordi-nate) that a certain element/object occupies in the real world.
Fig. 4 shows a graphical representation of an SDS. A SDS can be thought as a mesh of discrete points distributed along thespace in where the state-space ‘‘snapshot’’ is going to be taken. Note that inside the three-dimensional SDS (the cube) thereis a discretized 4D trajectory (different 3D positions of an aircraft in different discrete time steps).
In this research the sampling rate to discretize the temporal dimension of a trajectory is constant, so the spatial distancebetween positions depends only on the speed of the aircraft, whereas the relative positions of the waypoints depend on theheading of the aircraft.
Wake vortex generated from these trajectories can be bounded, in a given instant, with a time-stamped sphere containing(within a required confidence interval) all the air turbulences that the other aircraft should avoid. Note that this 4D object(the sphere) does not represent the real position and rotation of a vortex but rather it represents a ‘‘container’’ or ‘‘envelope’’that fits the worst-cases of the vortex behavior in a given instant, within reasonable certainty, considering the stochasticnature of this physical phenomenon. In addition, since an aircraft flying is always moving, and since the vortex is dynami-cally generated with the movement of the aircraft, the time-projection of the sphere describes a cylindrical shape (or ‘‘tube’’)when the real and continuous trajectory is considered instead of the discrete one. Note that modeling the wake vortex with a4D enveloping tube is an oversimplification of the real behavior of the underlying fluid dynamics of this phenomenon, butthis basic shape (the tube) provides with enough precision about the vortex behavior for conflict detection purposes, while atthe same time it ensures a good algorithm performance due to the avoidance of complex fluid dynamic simulations. Similar
Fig. 4. Sample of SDS and a 4D trajectory.
400 S. Ruiz et al. / Transportation Research Part C 26 (2013) 396–417
(although more precise) modeling of the vortex by means of a 4D enveloping tube has been performed within the WAKE4Dproject (Group for Research in Turbulence and Vertical Flows, 2010).
In order to store the tube envelope (originally continuous), only those parts of the tube matching with the discrete coor-dinates (i.e. matching with a vertex of the SDS’s bins) will be stored. Therefore, a discrete representation of the original tubewill be stored inside the database (Hearn and Baker, 2006).
The total memory positions in the SDS database (totalMemPos) can be calculated with:
totalMemPos ¼ X � Y � Z ð1Þ
being X, Y and Z the maximum number of discrete coordinates (i.e. the order) of each spatial dimension, respectively.Since the discrete coordinates are sorted in a sequential order in the database (see Fig. 5), they can be easily accessed (for
writing/reading) applying the following equation:
memPosðx; y; zÞ ¼ x � Y � Z þ y � Z þ zþ 1 ð2Þ
being memPos a unique memory position inside the database that stores the information of a particular coordinate (x,y,z),with x e [0, X � 1], y e [0, Y � 1] and z e [0, Z � 1].
For instance, consider a sector of size 500 � 500 � 10 km3 with discrete coordinates separated every 100 m. According to(1) this sector can be represented by a database with 5000 � 5000 � 100 = 25 � 108 memory positions (note that each XYplane dimension of the SDS fits 500,000 m/100 m = 5000 discrete coordinates whereas the vertical dimension fits10,000 m/100 m = 100 discrete coordinates). For instance, among these memory positions, the unique memory position(i.e. row of database of Fig. 5) corresponding to coordinate (x = 40, y = 35, z = 80) is:
To optimize the CD run-time performance it is important to implement the SDS in the computer main memory (i.e. RAMmemory) since the access-time to any memory position is constant and faster than with any kind of external memory de-vices. Granularity or resolution of the SDS is the distance between discrete points of the SDS. To determine the optimal sep-aration between SDS points is not an easy matter, and there is no a general method to do that. Note that the excess ofresolution may lead to a loss of computer performance as well as to an inoperable amount of main memory requirements,whereas a lack of resolution may lead to lose some important objects of the space, thus missing the detection of some exist-ing conflicts (i.e. false negative errors). Factors as the size of the physical airspace to model, the size of the objects to be storedin the database, the speed at what these objects move, the quantity of memory available in the computer, and the speed ofexecution of the algorithms, among other factors, should be considered to determine the granularity of the SDS (Ruiz andPiera, 2009).
In this research, a spatial discretization of 100 m between points of the discrete mesh has been considered. Such granu-larity ensures, for the purposes of this paper, a good trade-off between the quality of the information stored in the SDS forconflict detection purposes (i.e. no missed conflicts) and the run-time performance of the CD&R algorithms. This granularityhas taken into account the size of the 4D tube used as envelope of the wake vortexes (with considered diameter of 300 msince it is the maximum assumed vortex sinking), the aircraft speed (generally over 100 m/s) and the quantity restrictionsof the RAM memory (4 GB in the testing computer) as well as the size of the scenario used for simulations (see Section 5).
Note that a radius of 300 m for the tube envelope is big enough to also fit the horizontal dimensions of the two vorticesgenerated by largest Heavy aircraft (i.e. around 120 m maximum) and leave relevant looseness to lead with navigationaltracking errors. The radius of the 4D tube-envelope can be increased in case of stronger and changing winds, in order to mod-el the stochastic position of the vortex (see Section 6 about Uncertainty).
3.2. Conflict detection
According to the trajectories to be flown by aircraft (and assuming that weather conditions are known), a 4D tube is builtas a 4D container that envelops, within a reasonable confidence interval, the generated wake vortex, considering intrinsicuncertainties in position and duration. Dimensions of the 4D tube should be specified according to the current knowledgeand prediction ability of the wake vortex phenomenon.
Once a discrete tube has been built (rounding the discrete surface of the tube to the nearest discrete coordinates), it isready to be stored in the SDS. Every discrete point that conforms the tube is identified in a unique location (a discrete coor-dinate), which can be found in the SDS in form of a memory position.
Every data stored into the SDS can be interpreted as a reservation (or ‘‘booking’’) of an aircraft, which intends to use aspatial resource (the coordinate) for a certain period of time. Thus, minimum information to be stored is the aircraft id (whichis the object that occupies the discrete coordinate of the SDS) and the time-window at which the coordinate will be occupiedby the corresponding safety tube of the aircraft. If two or more aircraft want to use the same coordinate at the same time (orduring overlapped time-windows), then it means there is a conflict between their trajectories.
Note that storing the time (time window) makes the SDS to be a 4D snapshot of the real world. Time windows can bestored explicitly, with the couple [vortexOn-time, vortexOff-time], or implicitly, since it can be stored only the vortexOn-time and, when needed, it can be calculated the vortexOff-time through adding a constant interval of time to the vortex-On-time. For example, in the case of modeling turbulences, it is possible to store implicit time-windows, as the turbulencesare considered remaining in the air during a maximum constant time period of 120 s (for simplicity only Heavy aircraft areconsidered in this paper).
Fig. 5 illustrates an example of SDS content. The SDS has been implemented as a big one-dimensional array stored in aRAM memory (for efficiency purposes), but it can be conceptually drawn as a table containing as many rows as coordinatesare in the modeled airspace and as many columns as aircraft/trajectories will be processed.
Under a scenario without holding procedures it is possible to assume that no aircraft will cross the same place more thanonce, so only one booking per aircraft and coordinate is allowed.
Fig. 6 shows the CD algorithm, being N the number of airplanes, Wa an array storing all the tube points (3D coordinates) ofaircraft a, SDS an array which represents a table with as many rows as coordinates in the modeled airspace and N columns,and verifyTwOverlap(booking1, booking2) a function returning true if two time windows overlap.
At the moment of storing a tube-point the algorithm reads the first column. If its value is zero it means that no other air-craft intend to use such a coordinate, so this spatial resource can be booked without conflict. If the first column is not empty,then the algorithm compares the (explicit or implicit) time windows. If their time-windows are overlapping, then a conflict isdetected and the CR system is informed. If the time windows are not in conflict, it means that the coordinate might bebooked in the following column. In next columns applies sequentially the same procedure.
402 S. Ruiz et al. / Transportation Research Part C 26 (2013) 396–417
Therefore, comparisons among aircraft are only performed in those locations that will be used by more than one aircraft,and always limited to the maximum amount of aircraft using those coordinates, which usually is much less than the totalnumber of trajectories in the scenario. Thus, the SDS acts like a ‘‘spatial prune’’ avoiding the pairwise strategy and linearizingthe temporal performance of the algorithm (see next section).
Tubes convexity property has been used to ensure that all the possible conflicts will be detected on the surface of thetubes, so important computational time savings are possible since only the surface of the tubes are processed.
3.3. Proof of linear temporal complexity and non-pairwise behavior
A pairwise CD algorithm is characterized because it sequentially processes all the trajectories by comparing the distanceseparation among all the possible pairs in which these trajectories can be grouped. A formal complexity analysis of a simplepairwise algorithm can be made by combinatorial analysis: the maximum amount of comparisons among different pairs oftrajectories that can be formed with N aircraft (without repetition) is NðN�1Þ
2 . Therefore, it implies a temporal complexity orderof the algorithm of O(N2). Same results can be found in Isaacson and Erzberger (1997).
It is important to note, that the required NðN�1Þ2 comparisons is done for each time-instant in which a 4D trajectory is sam-
pled (e.g. 4D discrete trajectories are sampled every 1 s steps in this paper so, for each sample a pairwise comparison withthe same time-stamped sample of other trajectories is required). Therefore, as the number of computations is always thesame at each time-step (i.e. there is no best-case nor worst-case), the global algorithm complexity consists on an exact qua-dratic order, H(N2).
On the other hand, the SDS-based CD is considered a non-pairwise algorithm since in order to perform the detection ofconflicts the algorithm only compares – the time-windows of – those trajectories that use the same spatial resources, as itcan be inferred form the complexity analysis of the algorithm.
The complexity analysis of the SDS-based CD algorithm, due to its particular design, requires another kind of complexitystudy different from the combinatorial analysis. Following the methodology of Baase (1988), Cormen et al. (1997), Aho et al.(1998), and Peláez Sánchez (2003) a demonstration of linear complexity (and non-pairwise behavior) is done through theaverage case of the temporal algorithm’s complexity. To study the average-case a probabilistic analysis is performed, whichallows observing how the probability of a given 3D airspace coordinate (and thus a mesh-point of the SDS) of being used byexactly all the trajectories become smaller as the number of aircraft N grows.
Fig. 6 shows the SDS-based CD algorithm with some labeled lines. Let N be the total amount of aircraft/trajectories to pro-cess, Wa an array storing all the coordinates used to represent the wake vortex envelope of aircraft a (i.e. the full 4D tube),and SDS a bidimensional array storing all the bookings (a, i, j, and DBposition are indexes to move along those arrays). Thenumber of Elementary Operations (EO) of this algorithm can be decomposed in:
� In line 1: 2 EO are executed, 1 for assignment, 1 for comparison and 2 additional for the end of loop.� In line 2: 2 EO are executed, 1 for assignment, 1 for comparison and 2 additional for the end of loop.� In line 3: 1 EO is executed.� In line 4: 1 EO is executed.� In line 5: 2 EO are executed, 1 for accessing the SDS, 1 for comparison and 2 for the end of the loop.� In line 6: 3 EO are executed, 2 accesses to tables and 1 to call an external procedure.� In line 7: 1 EO is executed, to call an external procedure.� In line 8: 2 EO are executed, 1 for arithmetic operation and 1 for assignment.� In line 9: 2 EO are executed, 1 for access to table and 1 for assignment.
Note that Wa.length indicates the total amount of discrete coordinates that build the safety tubes of a particular aircraft/tra-jectory. For simplicity of the analysis this number is assumed to be constant for all the aircraft and it is represented by L.
Let assume that all the coordinates have the same probability of being used by a given trajectory (equiprobability is as-sumed for simplicity of the argument, although the proof is valid for any set of probabilities, including the ones associated to
Fig. 6. CD algorithm.
S. Ruiz et al. / Transportation Research Part C 26 (2013) 396–417 403
TMA scenarios with either a prefixed structure of arrival and departure routes or with dynamic 3D routes allocation). Let C tobe the total amount of discrete (3D) coordinates which compose a certain airspace sector, then the probability pc of an aircraftto use a certain coordinate in a given instant of time is:
pc ¼1C
ð6Þ
Thus, the probability pA of an aircraft using a determined coordinate of the SDS, with a safety tube (that covers the trajectory)made of L discrete points, is:
pA ¼ pc � L ¼LC
ð7Þ
Finally, the probability pN of all the N aircraft using the same coordinate (not necessarily at the same time) is:
pN ¼ ðpAÞN ¼ L
C
� �N
ð8Þ
Usually L� C (the amount of coordinates composing a trajectory is much smaller than the amount of available coordinatesin the airspace sector), so in general pN � 0. It means that in average (and considering realistic scenarios) it is unlikely thatthe SDS-based CD compares among all the pairs of trajectories in each time-step of the trajectories, since it will only estab-lish comparisons among those trajectories that use the same spatial resources. Therefore, it can be stated that the SDS-basedCD algorithm is non-pairwise.
In addition, note that when the amount of aircraft N increases, the probability of exactly all of the trajectories using a same3D coordinate becomes smaller, being 0 at the limit:
limN!1
pN ¼ 0 ð9Þ
It can also be observed that the greater is the size of the sector, C, and the fewer is the size of the trajectories, L, the lower isthe probability of coincidence of exactly all the N aircraft using a certain coordinate, which is congruent with intuition.
Adding probability pN to the complexity analysis of the algorithm, the average-case for N aircraft/trajectories can be com-puted with eK ¼ pN � N as follows (eK is the average amount of executions of the while loop in line 5 of Fig. 6):
TðNÞ ¼XN
a
2þXL
i
4þXeK
j
8þ 4
0@ 1Aþ 2
0@ 1Aþ 2
24 35 � tEO ¼XN
a
2þXL
i
8þ 8eK� �þ 2
!þ 2
" #� tEO
¼XN
a
ð4þ ð8þ 8eK ÞLÞ þ 2
" #� tEO ¼ ½8LeK N þ ð8Lþ 4ÞN þ 2� � tEO ð10Þ
being tEO the average time needed to process an Elementary Operation.Since in general eK � N (being eK ¼ 0 asymptotically), the average upper bound of complexity is TðNÞ ¼ OðeKN þ NÞ ¼ OðNÞ.
And since the average upper bound and the lower bound (i.e. the best case) belongs to the same order (lower bound occurswhen eK ¼ 0) it means that the exact order of complexity of such an algorithm is linear, H(N) for most scenarios (for those –unrealistic – scenarios in which O(L) ffi O(C) or L P C the proof of linearity is not valid and thus the algorithm behaves as apairwise algorithm).
Empirical analysis have validated the linear behavior of the algorithm, measuring the CD performance among differentsets of trajectories all of them lasting 30 min and coexisting during the same time-window in a TMA in which the L� C con-dition applied. For this particular scenario, Eq. (10) can be approximated with the following formula (see Fig. 7):
TðNÞ ¼ N � t ¼ N � 5 ms ð11Þ
being t the average processing-time of each 4D trajectory, which includes the construction, rotation and placement of the 4Dtubes that bound the aircraft vortex (t = 5 ms for this research).
In addition, the same scenarios were computed and compared (see Fig. 7) with a standard pairwise algorithm whose pro-cessing-time, T, can be approximated as a function of the number of aircraft, N, by:
TðNÞ ¼ NðN � 1Þ2
� p � t ð12Þ
being p the percentage of pairs not pruned by altitude pre-filters and t the average processing-time of each 4D trajectorycomparison, which mainly depends on the computer processor’s speed (t = 40 ls for this research).
It should be noted that the value of p strongly depends on the traffic patterns of the considered scenario. Nevertheless,due to the different algorithm runtime behaviors (i.e. linear vs. quadratic behavior), even when considering a low valuefor p (for example, p = 0.4 for some TMAs, according to Isaacson and Erzberger (1997)) the linear behavior of the SDS-basedalgorithm may still take advantage over a quadratic behavior when considering certain amount of aircraft. However, conclu-sions should be extracted carefully from Fig. 7, since the algorithms used for the comparison are qualitatively different andthus they cannot be directly compared only by their runtimes (i.e. the SDS-based algorithm performed conflict detection
Fig. 7. Empirical performance results.
404 S. Ruiz et al. / Transportation Research Part C 26 (2013) 396–417
comparing temporal distances among 4D tubes representing wake vortexes, whereas the standard pairwise algorithm usedspatial distance comparisons among aircraft point-mass positions).
4. CR algorithm
Some unplanned incidents may occur (i.e. perturbations), due to advances or delays introduced in the times of arrival ordeparture of the aircraft, fostering conflicts to emerge between trajectories of aircraft flying within the same TMA.
In case of arrivals, and due to the limited capacity of the runways to absorb the incoming traffic, perturbations duringpeak hours can rapidly lead to the congestion of the TMA, further augmenting the probabilities of conflicts between trajec-tories and thus generating a more complicated task-load for controllers. Thus, one of the main objectives of the CR system,apart of providing with conflict-free trajectories, is to keep the runway fed in order to take advantage of its capacity to absorbthe traffic.
Holding procedures are used in order to safely handle the air traffic arriving to an airport at the same time the runway iskept fed. For example, in Heathrow airport around a 56% of the incoming traffic (1200 aircraft a day in average) are asked towait in a holding stack typically from 3 to 10 min (EUROCONTROL, 2009; NATS, 2009). These holding procedures are effectivefrom the point of view of safety, and even of capacity, but they embody important inefficiencies in fuel-costs and pollution-emissions terms. Therefore, one of the objectives of the SESAR project is to provide to controllers with Decision Support Sys-tems like MTCD&R systems in order to reduce their task-load and to improve the tactical management of the airspace, espe-cially in TMAs.
To minimize fuel costs, the strategy used by the CR proposed in this paper is to generate vectors (path stretching) for air-craft in conflict while minimizing the change of vertical and speed profiles with respect the Reference Business Trajectories(RBT) (Zúñiga et al., 2010). RBTs are considered the optimum trajectories since they accomplish with controller’s restrictionsand also take into account the business preferences of airlines.
In addition, RBTs used in this research supports an innovating descending maneuver that is known as CDA (ContinuousDescent Approach), a maneuver currently spreading between airlines because of its benefits in fuel savings, and emissionsand noise reduction (EUROCONTROL, 2008c).
4.1. Conflict resolution
This paper focuses on convergent scenarios, thus only two types of conflicts are considered: catch-up conflicts and mergingconflicts (see Section 2.2). Catch-up conflicts can be solved both by speeding up the leading aircraft or by speeding down thetrailing one (or a mix of both maneuvers with a speed variation limit of ± 5–6%). However, since CR tries to saturate the run-way, it will be assumed that leading aircraft will not be able to speed up in order to not cause a catch-up conflict with priorleading aircraft, so the resolution of a catch-up conflict in this research will consists only on a delay of the trailing aircraft(note, however, that this resolution may propagate the conflict backwards, being necessary the same procedure to solvenew conflicts).
Merging conflicts in TMA can be solved by speed changes or path stretching/shortening, with or without modification ofthe planned landing schedule. For simplicity, no advances are permitted between aircraft (AMAN’s sequence is static), andsince leading aircraft cannot speed up (because the runway is supposed to be saturated), it is possible in this simple scenario
S. Ruiz et al. / Transportation Research Part C 26 (2013) 396–417 405
to solve merging conflicts also by applying a delay, same as in presence of catch-up conflicts. Therefore, all conflicts in thisresearch will be solved with a delay in trailing aircraft.
Being tc the elapsed time from the entry-time of an aircraft into TMA up to the moment this aircraft enters in conflict witha leading aircraft, and being �v the average velocity of such aircraft during this period, it can be derived the covered distance bythis aircraft, d, from:
d ¼ �v � tc ð13Þ
As conflicts are solved through delays in trailing aircraft, Dtc, an increment of d or a reduction of �v is required (or a mix ofboth).
In general, modifying the speed of an airplane has greater difficulties than modifying the covered distance, due to thetechnical and physical limitations to accelerate or decelerate an aircraft. Moreover, a resolution based on speed changesmay require not only decelerations but also accelerations (implying a higher fuel consumption). Note that similar argumentsare given in (Erzberger, 2006).
Mathematically, the new covered distance for the resolution, d0, can be calculated with:
d0 ¼ ð�v þ D�vÞ � ðtc þ DtcÞ ð14Þ
being D�v the increment of the average speed (necessary to equal the speed of A2 with the speed of A1), and Dtc the due delay tosolve the conflict.
First, it is calculated the required delay for trailing aircraft, A2, with the information about the time of the 4D coordinate inconflict that is stored in the SDS, plus adding tds seconds of the (implicit) time window (120 s in this research, for categoriesHeavy and Medium). Particularly, delay is calculated as:
DtA2c ¼ ðtA1
c � tA2c Þ þ tA2
ds ð15Þ
being A1 the prior aircraft, A2 the rear one, tc the time of the in-conflict 4D coordinates of respective safety tubes (which arestored in the SDS) and tA2
ds the minimum required safety distance for A2 flying behind A1. Extra temporal buffers could be stilladded to (15) due to uncertainties, e.g. due to the precision of current navigation systems that do not allow flying a 4D tra-jectory with exact accuracy (see Section 6 about Uncertainty).
Once A2’s delay is calculated with (15), a new 4D waypoint, named PTarget, can be fixed in the route of the trailing aircraft.The spatial coordinates of PTarget will be the same as the 4D point where A2 had the conflict, but the time of this 4D point ischanged from tc to (tc + Dtc). Thus, A2 will arrive to PTarget just tA2
ds seconds later than A1, so the conflict will be solved at thispoint.
Note that to avoid future conflicts, and since the destination of both aircraft is the same, A2 should follow exactly the sameroute used by A1 from PTarget to runway and with the same speed profile (assumed same aircraft performance). Thus, to ob-tain d0 it must be considered that A2 has to converge to the same speed of A1 from PTarget onwards, what ensures that A2 willnot enter in conflict with A1 anymore, while ensuring an optimum throughput in the runway (i.e. minimum gap betweenaircraft). The required average speed change for the trailing aircraft to be used in (14) is calculated as follows:
D�vA2 ¼ vA1c � vA2
c
2ð16Þ
where vA1c and vA2
c are the instantaneous speeds at the time of conflict for aircrafts A1 and A2 respectively.Once calculated with (14) the new distance d0 to be covered by A2 to avoid the conflict, the next step is to calculate a dis-
tortion in the original route of A2 in order to find a new route with origin in Pentry and destination in PTarget such that it can becovered by A2 at an average speed of ð�v þ D�vÞ instead of �v and in a period of time of (tc + Dtc) instead of tc.
In general, it will occur that d0 > d, so a possible way of calculating the distortion is shown in Fig. 8.Four waypoints are considered. Pentry and PTarget are, respectively, the point of entry to the TMA and the point where the
aircraft entered in conflict. Pmid is a waypoint just in the middle between Pentry and PTarget. And Pcurve is the waypoint respon-sible of generating the necessary distortion in the original route, forming a ‘‘curve’’ with two segments of length equal to d0/2.In this manner, aircraft A2 will cover the exact distance needed to solve the conflict, ending its curved route in the same pointwhere it had the conflict (PTarget).
Note that the new distance to be covered, d0, calculated in (14), is a three-dimensional distance. To simplify, the problemis treated first in 2D (as in Fig. 8), and later it is converted again to 3D, taking into account the calculation of the Top Of Des-cend (TOD) of a CDA landing maneuver.
On the other hand, it also can happen that d0 < d. This case can occur when the average speed derived form speeds con-vergence D�v is lower than the average speed of the original trajectory. In this case the resolution will consist on increment-ing the average speed in order to make d0 be greater until d0 = d. Since v0 and vf are determined, the most efficient solution isto maintain initial speed v0 until a certain distance Dx1 be covered, and then to (constantly) decelerate until aircraft reachspeed vf while covering a distance Dx2. The goal is, again, to arrive to PTarget in the time calculated for resolution, (tc + Dtc).Fig. 9 shows the geometrical problem to solve.
In this case, it is of interest to know the distance Dx1 along the aircraft will fly at a constant speed v0. This track distancewill be covered in a period of time t1 = Dx1/v0. Once covered the distance Dx1 trailing aircraft has to begin decelerating with a
Fig. 8. The geometric problem of varying the route.
Fig. 9. The geometric problem of varying the speed.
406 S. Ruiz et al. / Transportation Research Part C 26 (2013) 396–417
constant rate, covering a Dx2 distance and ending with vf speed. This second track distance will be covered in a period oftime t2 = 2Dx2/(v0 + vf) (assumed constant deceleration). Thus, knowing that it must be accomplished the restrictions oft1 + t2 = (tc + Dtc) and Dx1 + Dx2 = d, it is possible to obtain Dx1 as a function of the already known parameters:
Dx1 ¼v0ððtc þ DtcÞðv0 þ v f Þ � 2dÞ
ðv f � v0Þð17Þ
Note that resolutions of the proposed approach uses a set of rule-based vectoring maneuvers that are routinely applied incurrent air traffic control practice since they are easily understandable by pilots as well as easily implementable by on-boardautopilots which regulate the aircraft to heading and speed waypoints. Thus, in a medium-term time window, conflict sce-narios can be smoothly resolved, so that they do not become near-range threats. At the same time, the proposed maneuversminimize the change with respect the RBT, so the fuel consumption (and pollution) is heuristically minimized for eachtrajectory.
Note that geometrical problems have been stated considering a Euclidean 3D space (not curved space) as shown inFig. 10B. However, for real applications the CD&R system should consider the curvature of the Earth (Fig. 10A). Since Euclid-ean spaces make simpler the construction of the SDS and the processing of the conflict-free trajectories, a planar projectionof the Earth has been considered using a coordinate system with minimum distortion like the Universal Transversal Mercator(UTM) (Pérez Navarro et al., 2009).
4.2. Validation of flyability for conflict resolution proposed trajectories
Mechanical and physical restrictions, as for example maximum and minimum speeds, must be considered whencomputing the resolution trajectories for real aircraft. Recent validation experiments with real FMS avionics and with ahigh-precision Boeing 737-800 certified simulator (Full Flight Simulator category D) have shown that the trajectoriesgenerated by the CR algorithm are flyable with a Boeing 737-800.
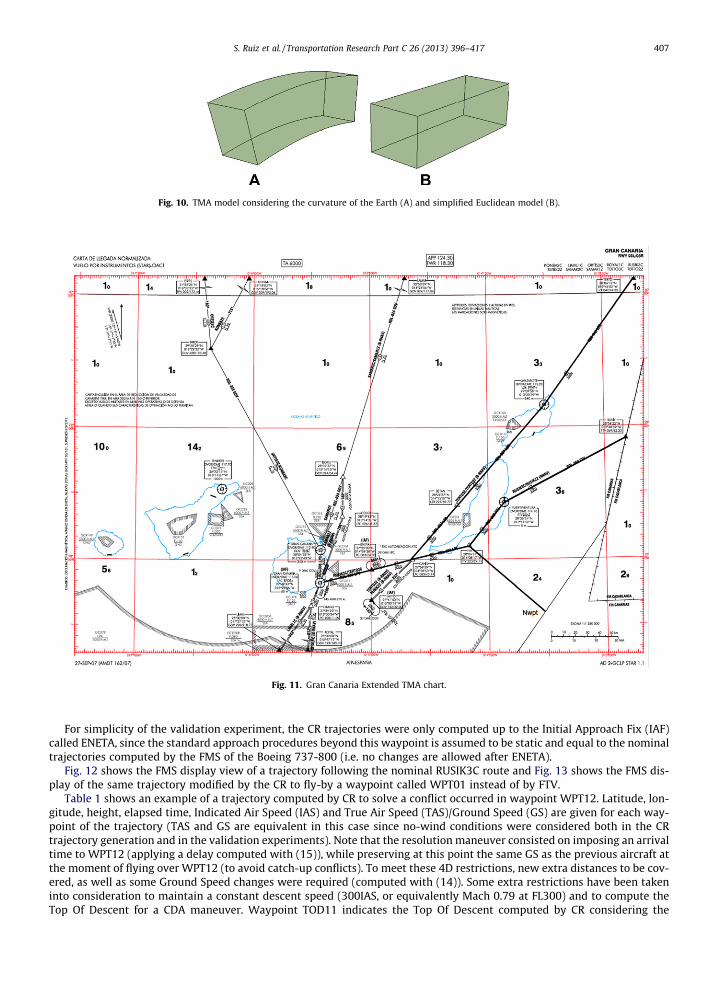
The STAR (Standard Arrival Route) configuration of the Gran Canaria Extended TMA has been used to test the flyability ofthe maneuvers proposed by the CR algorithm (see Fig. 11).
According to the Spanish Aeronautical Information Publication (AIP), the nominal STARs TERTO3C and RUSIK3C arecomposed by the following waypoints:
Fig. 10. TMA model considering the curvature of the Earth (A) and simplified Euclidean model (B).
Fig. 11. Gran Canaria Extended TMA chart.
S. Ruiz et al. / Transportation Research Part C 26 (2013) 396–417 407
For simplicity of the validation experiment, the CR trajectories were only computed up to the Initial Approach Fix (IAF)called ENETA, since the standard approach procedures beyond this waypoint is assumed to be static and equal to the nominaltrajectories computed by the FMS of the Boeing 737-800 (i.e. no changes are allowed after ENETA).
Fig. 12 shows the FMS display view of a trajectory following the nominal RUSIK3C route and Fig. 13 shows the FMS dis-play of the same trajectory modified by the CR to fly-by a waypoint called WPT01 instead of by FTV.
Table 1 shows an example of a trajectory computed by CR to solve a conflict occurred in waypoint WPT12. Latitude, lon-gitude, height, elapsed time, Indicated Air Speed (IAS) and True Air Speed (TAS)/Ground Speed (GS) are given for each way-point of the trajectory (TAS and GS are equivalent in this case since no-wind conditions were considered both in the CRtrajectory generation and in the validation experiments). Note that the resolution maneuver consisted on imposing an arrivaltime to WPT12 (applying a delay computed with (15)), while preserving at this point the same GS as the previous aircraft atthe moment of flying over WPT12 (to avoid catch-up conflicts). To meet these 4D restrictions, new extra distances to be cov-ered, as well as some Ground Speed changes were required (computed with (14)). Some extra restrictions have been takeninto consideration to maintain a constant descent speed (300IAS, or equivalently Mach 0.79 at FL300) and to compute theTop Of Descent for a CDA maneuver. Waypoint TOD11 indicates the Top Of Descent computed by CR considering the
Fig. 12. Nominal RUSIK3C route.
Fig. 13. Modified RUSIK3C route example.
408 S. Ruiz et al. / Transportation Research Part C 26 (2013) 396–417
performance of a B738. WPT11 was computed as a turning point (Pcurve of Fig. 8) in order to make the trajectory matchingwith all the restrictions (see Fig. 14).
In Fig. 15 it can be observed the KIAS speed (or the equivalent Mach number) and the Flight Levels computed by FMS foreach waypoint. Fig. 16 shows the Expected Time of Arrival (ETA) in format HHMM at the moment of the simulation. Bothfigures reflect the same information as Table 1.
Table 2 provides information of another CR resolution trajectory example but now starting at TERTO instead of at RUSIK.Figs. 17–19 illustrate, respectively, the trajectory profile displayed in the FMS, the KIAS and Flight Level for every waypoint,and their corresponding ETAs.
S. Ruiz et al. / Transportation Research Part C 26 (2013) 396–417 409
This validation experiment confirms that the current CR algorithm generates flyable resolution trajectories for B738. It isimportant to point out, though, that due to the fact that the ETAs are rounded to minutes in the FMS (17 min for WPT12 and24 min for WPT02 according to Figs. 16 and 19) it is not possible to verify the total fulfillment of ETAs computed by CR withrespect the ETAs obtained in the simulated flight. However, these ETAs coincide if rounded to minutes (17.3 for WPT12 and24.4 for WPT02, as shown in Tables 1 and 2).
Several authors used GS in their CR algorithms since it relates the position and speed of all aircraft to a common and staticcoordinate system, for example (Erzberger, 2006). In our research, since no-wind conditions were considered, GS has beenused not only to maintain aircraft separation but also to compute the CDA trajectories with constant IAS. However, in pres-ence of noticeable wind, the CR algorithm should be updated to compensate the GS and TAS differences during the compu-tation of the CDAs whilst respecting the GS restrictions to maintain the due aircraft separation.
4.3. Integration of the CR and CD systems
Each time a conflict is detected in the CD module the CR generates a new 4D trajectory for the following aircraft with adue delay to solve the conflict with the prior aircraft. This new trajectory is then passed again to the CD module and stored inthe SDS. The process is repeated until no conflict is detected with other trajectories (in this research it has been generallyreached in the first iteration).
On the other hand, since the processing of information expends resources (time and memory), it is convenient to adaptthe ‘‘capture’’ of information of the CD in order to process only the minimum and relevant information for the CR (Ruiz andPiera, 2009).
In this research, the ‘‘capture’’ of the CD has been limited to the aircraft id, the implicit time window and the coordinatesused by the aircraft (coordinates are stored in the structure of the SDS). Note that for a more sophisticated CR system, otherdata about the space state might be interesting and could be also stored in the SDS (e.g. probabilistic data, weather informa-tion, etc.).
410 S. Ruiz et al. / Transportation Research Part C 26 (2013) 396–417
5. Simulation and results
In order to test the CD&CR algorithms and the developed implementation several simulations has been executed withsynthetic traffic data provided by BR&TE.
The computer used for those simulations was a MacBook laptop with a processor Intel Core 2 Duo at 2.26 GHz, with 4 GBof RAM. According to Carnegie Mellon University (Moravec, 2009) and to specialized software (Geekbench, 2010), the pro-cessor’s speed of this computer is 10,000 MIPS (Million of Instructions per Second).
5.1. Scenarios
The scenario simulated is based on Gran Canaria Extended TMA, which includes three STAR routes up to the runway andall the available Flight Levels. The modeled surface sized 275 � 330 km2 and the maximum allowed altitude for the exper-iment was 12,800 m. The spatial resolution for the SDS was 100 m between discrete points.
Fig. 18. B738 FMS data.
Fig. 19. B738 FMS data (ETAs).
S. Ruiz et al. / Transportation Research Part C 26 (2013) 396–417 411
Fig. 20 shows the shape of the TMA, with 1 runway, 2 merging points and 3 entry points. Route corresponding to entrypoint A has been synthetically added to the real TMA in order to increment the complexity of the scenario (2 merging pointscomplicates the synchronization of the traffic).
Two sets of convergent trajectories have been used as a workload for simulations. The first one, with 30 aircraft approx-imating to the airport in an interval of 1 h is called rush hour, and the second workload, with 35 aircraft, is named saturationrush hour.
5.2. CD metrics and requirements
In 1997 Isaacson and Erzberger published an article with details of a pairwise CD algorithm to manage the US airspace(Isaacson and Erzberger, 1997). They found four necessary requirements for a CD algorithm: efficiency, flexibility, complete-ness and trial planning capability.
Efficiency was found the most influential factor in the design of a CD algorithm, since a CD module should be able to pro-cess a huge amount of trajectories in real time (it is know that pairwise algorithms have a quadratic complexity O(n2)).
Flexibility is the ability to process the whole set of trajectories each time the track aircraft positions are updated (e.g., incase of deviations). Note they considered a processing-time of 10 s acceptable, as tracking radar had an update cycle of 12 s.
Completeness refers to the ability of the CD to detect all the existing conflicts among a set of trajectories, whilst not warn-ing about false conflicts. It is more important for those algorithms that use probabilities (i.e. risk of deviation) to determine aconflict.
Trial planning is the automatic process of proposing a resolution. It will be ignored in this paper, since the process of pro-posing resolutions corresponds to the CR system.
5.3. CR metrics and requirements
In 2007, Farley, Kupfer and Erzberger (NASA) (Farley et al., 2007) proposed two metrics to analyze the performance of CRsystems, trying to establish a formal frame to allow comparatives between different algorithms: the safety and the efficiency.
Fig. 20. TMA scenario.
412 S. Ruiz et al. / Transportation Research Part C 26 (2013) 396–417
Safety is a CR characteristic that is measured with the percentage of conflicts that have been correctly solved over thetotal number of detected conflicts.
Efficiency is defined by the average delay per solved conflict (the lower is the average delay, the higher is the efficiency).In 2008, same authors published some studies about these metrics (Kupfer et al., 2008), concluding that both parameters
are highly affected by the kind of scenario under consideration (so comparisons among different algorithms should be doneunder same scenarios and workloads). They also suggested the scientific community to develop new metrics to evaluate thequality of CR resolutions, and also to enable comparisons between different algorithms.
In this article the runway utilization index is proposed, q, as a metric of efficacy of a CR algorithm and allowing compar-isons between resolution algorithms. This metric quantifies the percentage of actual utilization of a runway, k, given a deter-mined service rate, l (Cooper, 1981; Balin and Erzberger, 1996; Bolender and Slater, 1996):
q ¼ actual utilizationservice rate
¼ kl
ð18Þ
According to NATS terminology (Cavanagh et al., 2008), the actual utilization of a runway, k, is the number of observed air-craft landing in a certain time interval, T. Sometimes this concept is also called landing rate or arrival rate.
Actual utilization can be expressed as:
k ¼ T~tcr
ð19Þ
being ~tcr the average temporal safety distance achieved by CR for a given sequence of landings in a time period T.The service rate, l, is defined as the maximum throughput that is possible to obtain from a runway for a given landing
sequence of an aircraft mix (generated for instance by an AMAN/DMAN) under a given set of conditions (meteorological con-ditions, runway’s layout, availability of taxiways, availability of landside resources, etc.). Service rate is the maximum num-ber of operations that a runway is able to support in a time interval T (usually 3600 s). Some studies refer to this concept asachievable capacity, available capacity and maximum capacity among others.
Service rate can be represented as:
l ¼ T~tmin
ð20Þ
being ~tmin to be the minimum temporal safety distance that can be observed between all the landing aircraft, as statistical aver-age, in a time interval T (i.e. considering the maximum saturation of the runway).
Thereby, mixing previous equations for a same time interval T, the utilization index can be expressed as follows:
q ¼ kl¼ T=~tcr
T=~tmin¼
~tmin
~tcrð21Þ
Note that always should be ~tmin 6 ~tcr (if not, CR would be generating trajectories with conflicts). Therefore, q e [0, 1], being 1the maximum utilization of the runway (i.e. using the whole available capacity/service rate), and 0 the contrary. To achieve
S. Ruiz et al. / Transportation Research Part C 26 (2013) 396–417 413
q = 1 in a rush hour the CR system has to saturate the runway with minimum gaps between landings (corresponding to min-imum safety distances). In presence of uncertainty, it would be not possible for CR algorithms to reach q = 1 because of theextra buffers required, but for CR benchmarking purposes ideal context operations can be considered.
5.4. Results and analysis of MTCD&R system
With 4 bytes per booking, the total size (in Gigabytes) of the SDS for the 30-aircraft scenario was 1.089 GB, whereas forthe 35-aircraft scenario was 1.27 GB (a 2D projection of the SDS has been implemented in order to save RAM memory).
The MTCD&R system has been able to detect and solve the totality of the conflicts appeared in less than 1/2 s, includingthe generation of the output files encoding the final conflict-free trajectories, one file in TXT format (with UTM coordinates)and another one in XML (with WGS84 coordinates), which can be used to observe the motion of the resultant trajectorieswith specialized GIS software (Figs. 21 and 22).
According to the metrics presented in Section 5.2, the CD module can be classified as efficient due to its linear behavior,and flexible due to the ability of re-computing all the trajectories in less than 1/2 s (ideal for real-time applications). Note thatthe usage of simplified wake vortex modeling rather than complex high-fidelity fluid dynamics has positively contributed tothe obtained excellent performance.
The degree of completeness of the CD has not been quantified in this research, but it is expected that with a good param-eterization of the 4D tube containing the vortex (obtaining the parameters through studying high-fidelity vortex simula-tions) all the existing conflicts may be identified and only a low degree of false conflicts may be detected. Other sourcesof uncertainty should be also considered to perform the completeness analysis (e.g. TP errors, weather conditions, etc.).
To analyze the CR module it has been assumed that the service rate of the runway only depends on the safety distancesbetween landings (although in real cases it can also depend on other factors, such as the runway and airport layouts or theavailability of taxiways, among others). Only Heavy aircraft has been considered in this model, so the minimum safety dis-tance in absence of meteorological perturbations is 120 s. Therefore, using (20) and considering a time-interval of 1 h(3600 s), the maximum service rate of the runway under such conditions is:
l ¼ 3600120
¼ 30 aircrafts=hour ð22Þ
Note that it explains why the 30-aircraft scenario is considered a rush hour scenario (30 aircraft is the maximum achievablerunway’s throughput in 1 h).
CR system adds a buffer of 1 extra second to minimum safety distances, so most of the aircraft cross the runway’s thresh-old with 121 s time-distance respect the previous aircraft (some airplanes might cross with 120 or 122 s due to discretizationerrors in trajectories). Thus, the number of landing operations achieved by CR (actual utilization) under ideal conditions andwith no uncertainty, can be calculated with (19) as:
k ¼ 3600121
¼ 29:75 aircrafts=hour ð23Þ
Then, the utilization index, according to (21), is:
q ¼ 29:7530
¼ 3600=1203600=121
¼ 121120
¼ 0:9917 ð24Þ
Fig. 21. CD&R simulation. 2D view.
Fig. 22. CD&R simulation. 3D view.
414 S. Ruiz et al. / Transportation Research Part C 26 (2013) 396–417
What means that the MTCD&R generated trajectories use over a 99% of the whole runway capacity (considering a peak hour).Table 3 shows the statistics generated by the MTCD&R system for the scenarios with 30 and 35 aircraft. Note that in both
scenarios a utilization index (in bold) over the 99% has been achieved, implying (almost) the total exploitation of the avail-able capacity.
It is also interesting to point out the big difference in total delays between both workloads, being 2099 s for the 30-air-craft scenario and 12,093 s for the 35-aircraft scenario. It explains why the 35-aircraft scenario was called saturation rushhour, and also allows making an idea of how difficult can become this scenario, which only adds 5 more aircraft, to control-lers’ workload.
MTCD&R outputs trajectories that accomplish with the requirements of being conflict-free (safety), minimize changeswith respect the optimum RBT, and avoid the systematic use of holding procedures, so near-optimal consumption profilescan be expected (fuel consumption and emissions efficiency).
6. Perturbations and uncertainty
Despite all technological and management efforts developed in the SESAR framework, 4D RBTs are subject to differenttypes of perturbations and uncertainties that can provoke some differences between the planned intended trajectories
Table 3CD&R simulation results.
Scenarios
30 aircraft 35 aircraft
No. of detected and solved conflicts 38 49Average applied delay per aircraft 69.96 s 345.514 sAverage applied delay per conflict 55.23 s 246.796 sMinimum applied delay 5 s 2 sMaximum applied delay 125 s 666 sTotal sum of delays 2099 s 12,093 sTotal time of runway’s utilization 3632 s 4242 sIdeal time of runway’s utilization 3600 s 4200 sUtilization excess (total � ideal) 32 s 42 sIndex of runway’s utilization, q 0.991171 0.990051Aircraft/hour according to index 29.73 29.7015Aircraft/hour ideala 30 30No. of landings with distance 120 s 3 3No. of landings with distance 121 s 21 21No. of landings with distance 122 s 5 10Average distance between landings 121.069 s 121.206 s
a For the landing sequences considered in these scenarios.
S. Ruiz et al. / Transportation Research Part C 26 (2013) 396–417 415
and the actually flown trajectories. To preserve safety factors, it is important to consider how perturbations and uncertain-ties affect the MTCD&R algorithms in order to guarantee that the flyable trajectories will be conflict free:
Perturbations: refers to those external facts that affect the planned TMA schedules, such as cancelations, regulations, air-space blockings, ground delays and others. These kinds of fitful events justify the use of MTCD&R systems in the ATM, as away to update the trajectory schedules taking into account the available information in order to predict the future statespace within a look-ahead of 20–30 min. MTCD&R allows absorbing the effects of these perturbations in safety distanceswith a tactical planning, which ensure better efficiencies and safety than acting reactively to these perturbations.
Uncertainties: refers to those components of the system that are not properly represented with precision in the model andgenerate errors in the predictions, such as for example the weather conditions (specially wind), the aircraft control systems(both pilot and aircraft performance errors) and the positioning/tracking precision (even considering the more precise nav-igation systems). These sources of uncertainty, which are currently far away of allowing flying 4D trajectories in a preciseway, need to be faced by adding extra buffers in the safety distances to compensate the lack of precision about the actualand future positions of the aircraft and vortexes, in a way that the current and future aircraft and vortexes locations canbe identified with a required confidence at least within a certain time-spatial region. Note that the bigger is the uncertaintythe bigger should be the used time–space buffers. However, by increasing the buffers, airspace latent capacity is also in-creased. So, precise uncertainty-buffers delimitation should be considered in MTCD&R algorithms.
The impact of these sources of uncertainties in the vortex model requires the use of extra buffers, i.e. increasing the radiusof the 4D tube containing the vortexes and also increasing the time windows of the expected passing-time for all the way-points. Taking into account that incoming navigation systems are expected to give a maximum tracking error of 185.2 m(RPN-RNAV 0.1NM), it has been considered that a radius of 300–400 m (150 m for wake vortex envelope plus 185.2 mdue to tracking errors) should be enough to ensure safety for the most suitable weather conditions and considering largeaircraft (largest vortexes).
Nevertheless, the radius parameter could be dynamically changed according to a precise weather prediction with a highupdating frequency and according to the corresponding vortex category of each aircraft. Note that the capability of theMTCD&R algorithms to be executed in real-time (i.e. less than 1 s with a medium-power computer) is an important factorto tackle the uncertainty.
With regard to the temporal adjustment of the 4D trajectories, in this research it has been considered that the minimumtemporal distances taken from ICAO documentation (120 s for Heavy aircraft) are conservative enough for the most suitableweather conditions and for all the wake vortex aircraft categories; thus, no extra temporal adjustment is required with re-gard to safety factors. However, the algorithms presented can also be set with dynamic parametrization for each vortex dura-bility, opening the door to integrate the system with technological solutions that update the vortex durability information inreal time, such as for example the LIDAR technology used as a real-time wake vortex sensor (Wiegele et al., 2008). A moreprecise parametrization of wake vortex durability would lead to a more efficient use of airspace capacity, while maintainingsame levels of safety.
If for any unexpected reason a particular aircraft exits the uncertainty tube, then it is said to occur a deviation (i.e. it isconsidered that the aircraft is not following the expected nominal trajectory). When a deviation occurs it is necessary to up-date in the MTCD&R system the expected trajectory for this aircraft, and thus to take control actions to give the aircraft backto the original intended trajectory or to follow a new proposed trajectory taking into account the possible interactions withother trajectories (i.e. a deviation is managed as a particular class of perturbation as soon as it is detected).
The risk of deviation may be included in the algorithms presented in this paper by using different tubes whose radius in-crease with time (uncertainty grows with time) and with different probabilities associated, similarly to the methods used bycurrent operational CD systems like iFACTS (Whysall, 1998), thus improving the efficiency and robustness of the CD&R algo-rithms. See Fig. 23. The ability of the algorithms to run in real-time would allow a continuous MTCD&R rolling process thatmay contribute to reduce the negative safety impacts of trajectory deviations in TMAs.
Fig. 23. Dynamic uncertainty and deviation-risk buffers.
416 S. Ruiz et al. / Transportation Research Part C 26 (2013) 396–417
7. Conclusions and outlook
One of the most important strategic challenges related with the deployment of the Single European Sky is the need offinding efficient ways for managing the available airspace capacity to ensure a sustainable air transportation system, espe-cially in TMAs since they currently are the main bottleneck of the airspace system. Improving the decision support tools usedto reduce the task-load of air traffic controllers and to improve the runways throughput is one of the ways to take betteradvantage of the airspace capacity.
In this paper, a CD and CR algorithm has been presented, integrated in a single MTCD&R system. Simulations with twodifferent scenarios of heavy traffic entering to a TMA, rush hour (30 aircraft) and saturation rush hour (35 aircraft), has beenused to show the excellent results of the implemented MTCD&R.
The CD algorithm has shown capabilities to work with wake vortex simplified models to perform the conflict detectionusing time-based distances and, at the same time, storing the state-space of the problem (like a 4D snapshot).
The excellent runtime performance of the CD module, due in part to the use of a non-pairwise (and SDS-based) CD algo-rithm, may enable the development of MTCD&R applications that provide in real-time with an updated feedback about thestate-space. This feature could contribute to tackle the uncertainty related to the (expected) trajectories to be flown byaircraft.
The CR algorithm presented is based on vectorizations calculated to absorb the necessary delays to solve a conflict. Theconflict-free trajectories have been calculated to minimize the change with respect the optimum reference (RBT), while tak-ing into account the required 4D restrictions to solve the conflicts whilst maintaining at minimum the safety distances (effi-cient use of the available runway’s capacity), as well as the computation of the Top of Descent for a CDA maneuver with aconstant descent indicated air speed. Holding procedures were avoided by MTCD&R as they can imply strong fuel-consump-tion inefficiencies.
Flyability of these CR trajectories has been validated with real FMS avionics and with a certified B738 Full Flight Simu-lator. The proposed CR algorithm is still far away of considering resolutions for complex scenarios (i.e. considering arrivals,departures and cruise traffic mixed in the same TMA), however, it showed to be effective in relaxed scenarios and demon-strated good interaction with the SDS-based CD algorithm. Due to that, it can contribute as a baseline for the design of im-proved CR applications.
An index of runway utilization has been proposed as a new metric to measure the quality of MTCD&R outputs, as well as toenable comparisons between different systems. Analysis based on this metric (in absence of uncertainty) has also showngood results for the MTCD&R system.
Altogether, these results suggest that this MTCD&R system may contribute, as a baseline of a future Decision Support Sys-tem platform, to improve the air traffic management, especially in congested TMAs, since it adapts to the requirements of theSingle European Sky established by the SESAR programme, that is: it maintains or improves the safety levels of operations (allthe conflicts were detected and solved), it augments the use of the latent capacity (by reducing controllers’ task-load andmaximizing the throughput of the runways), it gives flexibility to aircraft’s planned trajectories (with 3D route dynamic allo-cation), and it reduces the fuel-costs, as well as the CO2 emissions in the airport vicinities (by considering CDA operations andby avoiding holding procedures).
A technique based on 2D projections was used to reduce the memory requirements of the SDS but future work should befocused on reducing, even more, the growth in memory of the SDS. SDSs based on relational databases should be explored,since they might drastically reduce the memory growth.
The 4D snapshot provided by the SDS opens the door to explore the state-space of the problem. The integration of thisMTCD&R system with Petri Nets that exploits the state space stored in the SDS could lead to find new CR algorithms thattakes into account the network domino effects caused by the proposed resolution maneuvers, thus with potential for achiev-ing better ATM global resolutions.
Finally, future research will also be addressed to analyze how the consideration of uncertainty in the models affects theMTCD&R algorithms as well as the index of runway utilization, and how to tackle this uncertainty in order to generate morerobust conflict-free trajectories.
Acknowledgements
This work is partly funded by the Ministry of Economy and Competivity in the project ‘‘Fire Guided Unmanned Aircraftsand Resources Distribution (FireGUARD)’’, CICYT Spanish program TIN2011-29494-C03-01 and the Catalan Government(AGAUR) support to the research team ‘‘LOGISIM: Modelado, Simulación y Optimización de Sistemas Logísticos’’ reference2009 SGR 629.
References
Aho, A.V., Hopcroft, J.E., Ullman, J.D., 1998. Data Structures and Algorithms. Pearson.Baase, S., 1988. Computer Algorithms, second ed. Addison-Wesley.Balin, Mark G., Erzberger, Heinz, 1996. An Analysis of Landing Rates and Separations at the Dallas/Fort Worth International Airport.Blajev, T., 2006. Wake Vortex Turbulence. Hindsight (EUROCONTROL), p. 18.Bolender, Michael A., Slater, G.L., 1996. Evaluation of Scheduling Methods for Multiple Runways.
S. Ruiz et al. / Transportation Research Part C 26 (2013) 396–417 417
Castelli, Lorenzo, Pesenti, Raffaele, Ranieri, Andrea, 2010. The design of a market mechanism to allocate air traffic flow management slots. TransportationResearch Part C: Emerging Technologies.
Cavanagh, Nicola, Nordeen, Norliza, Dow, John, 2008. Terms and Definitions Used in Airport Capacity Studies.Chiang, Yi-Jen, Klosowski, James T., Lee, Changkil, 1997. Geometric algorithms for conflict detection/resolution in air traffic management. In: 36th IEEE
Conference on Decision and Control. Presented at the in 36th IEEE Conference on Decision and Control.Civil Aviation Safety Authority (Australian Goverment), 2006. Navigation using Global Navigation Satellite Systems (GNSS). Public report.Cook, Andrew, 2010. The Fourth Dimension: Implementing 4D Aircraft Trajectories. Navigation News. The Magazine of the Royal Institute of Navigation pp.
17–20.Cooper, Robert B., 1981. Introduction to Queuing Theory, second ed. North Holland.Cormen, T.H., Leiserson, C.E., Rivest, R.L., 1997. Introduction to Algorithms. MIT Press.Desenfans, O., Lonls, T., Winckelmans, G., Holzapfel, F., 2007. Description of Probabilistic Wake Predictors Adapted to Cruise Flight, FLYSAFE DI231-2.
Universite catholique de Louvain (UCL) and DLR.Djokic, Jelena, Lorenz, Bernd, Fricke, Hartmut, 2010. Air traffic control complexity as workload driver. Transportation Research Part C: Emerging
Technologies 18, 930–936.Dole, C., 1994. Flight Theory for Pilots, fourth ed. Jeppesen, Englewood.Erzberger, Heinz, 2006. Automated conflict resolution for air traffic control. In: 25th International Congress of the Aeronautical Science. Presented at the
25th International Congress of the Aeronautical Science, Hamburg, Germany.EUROCONTROL, 2001. Study of Constraints to Growth.EUROCONTROL, 2002a. MTCD Algorithms Overview.EUROCONTROL, 2002b. Towards a Controller-Based Conflict Resolution Tool – A Literature Review.EUROCONTROL, 2006. Interoperability Requirements Document (IRD) – Medium Term Conflict Detection & Resolution (MTCD&R).EUROCONTROL, 2007a. Surveillance. A Decade of Developments. Skyway, pp. 76–84.EUROCONTROL, 2007b. FASTI Operational Concept.EUROCONTROL, 2007c. FASTI Baseline Description.EUROCONTROL, 2008a. Challenges of Growth 2008.EUROCONTROL, 2008b. Long-Term Forecast: Flight Movements 2007–2030.EUROCONTROL, 2008c. CDA – Implementation Guidance Information.EUROCONTROL, 2009. ATM Airport Performance (ATMAP) Framework.EUROCONTROL, 2010. Specification for Medium-Term Conflict Detection.Farley, Todd, Kupfer, Michael, Erzberger, Heinz, 2007. Automated conflict resolution: a simulation evaluation under high demand including merging
arrivals. In: Proc. 6th USA/Europe ATM Research and Development Seminar, Baltimore, MD, USA.Geekbench, 2010. <http://www.primatelabs.ca/geekbench/> (WWW Document).Group for Research in Turbulence and Vertical Flows, 2010. UCL Operational Tools for Predicting Aircraft Wake Vortex Transport and Decay: The
Deterministic/Probabilistic Wake Vortex Models (DVM/PVM) and the WAKE4D Platform (No. v. 2.2), UCL Report.Hearn, D., Baker, M.P., 2006. Gráficos por computadora con openGL, 3a ed. Prentice Hall.ICAO, 2005. Procedures for Air Navigation Services – Aircrafts Operations (Doc 8168).ICAO, 2007. Procedures for Air Navigation Services – Air Traffic Management, 15th ed. (Doc 4444).Isaacs, Anne, Brooks, Victoria, 2008. Avoiding the Conflict. Hindsight (EUROCONTROL), pp. 34–36.Isaacson, D.R., Erzberger, H., 1997. Design of a conflict detection algorithm for the Center/TRACON automation system. In: Digital Avionics Systems
Conference. Presented at the Digital Avionics Systems Conference, Irvine, CA.Isaacson, Douglas R., Robinson III, John E., 2001. A knowledge-based conflict resolution algorithm for terminal area air traffic control advisory generation. In:
AIAA Guidance, Navigation, and Control Conference. Presented at the AIAA Guidance, Navigation, and Control Conference, Montreal, Canada.Kuchar, James K., Yang, Lee C., 2000. A Review of Conflict Detection and Resolution Modeling Methods. IEEE Transactions on Intelligent Transportation
Systems, vol. I, pp. 179–189.Kupfer, M., Farley, T., Chu, Y., Erzberger, H., 2008. Automated conflict resolution – a simulation-based sensitivity study of airspace and demand. In: Proc.
26th International Congress of the Aeronautical Sciences (ICAS).Moravec, Hans, 2009. Rise of the Robots – The Future of Artificial Intelligence. Scientific American.NATS, 2009. Acting Responsibly: NATS and the Environment 2009.Peláez Sánchez, J.I., 2003. Análisis y diseño de algoritmos: un enfoque teórico y práctico. Universidad de Málaga.Pérez Navarro, Antoni et al, 2009. Sistemes d’informacio geografica i geotelematica, 1a ed. FUOC, Barcelona.Ranieri, A., Martinez, R., Piera, M.A., Lopez, J., Vilaplana, M., 2011. Strategic Trajectory De-confliction to Enable Seamless Aircraft Conflict Management (WP-
E project STREAM). Presented at the SESAR Innovation Days, ENAC, Toulouse.Reif, J.H., Sharir, M., 1985. Motion planning in the presence of moving obstacles. In: Proc. 26th Annu. IEEE Sympos. Found. Comput. Sci. Presented at the Proc.
26th Annu. IEEE Sympos. Found. Comput. Sci., pp. 144–154.Reynolds, Craig W., 2000. Interaction with groups of autonomous characters. In: Game Developers Conference 2000. Presented at the Game Developers
Conference 2000, pp. 449–460.Reynolds, Craig W., 2006. Big fast crowds on PS3. In: Sandbox Symposium. Presented at the Sandbox Symposium.Ruiz, Sergio, Piera, Miquel A., 2009. Spatial data structure based algorithm for improving conflict detection/conflict resolution algorithms. In: Proceedings of
Unmaned Aerial Vehicles Conferences (UAV Conferences 2009). Presented at the UAV Conferences 2009, Reno, Nevada, USA.Samet, H., 1989. Applications of Spatial Data Structures. Addison-Wesley.Samet, H., 1990. The Design and Analysis of Spatial Data Structures. Addison-Wesley.SESAR Consortium, 2007. The ATM Target Concept – SESAR Definition Phase, Deliverable 3.SESAR Consortium, 2008. The SESAR Master Plan – SESAR Definition Phase, Deliverable 5.SESAR Consortium, 2009. European ATM Master Plan.Whysall, Peter, 1998. Future area control tools support – FACTS. In: Presented at the 2nd USA–Europe Air Traffic Management R and D Seminar, Orlando.Wiegele, A., Rahm, S., Smalikho, I., 2008. Ground-Based and Air-Borne Lidar for Wake Vortex Detection and Characterisation, No. DLR-FB-2008-15, DLR-
Forschungsbericht, DLR.Xu, Ning, Donohue, George, Laskey, Kathryn Blackmond, Chen, Chun-Hung, 2005. Estimation of delay propagation in the national aviation system using
Bayesian networks. In: Proceedings of 6th ATM Seminar. Presented at the 6th ATM Seminar, Baltimore, MD, USA.Zúñiga, C.A, Piera, M.A, Ruiz, S., Del Pozo, I., 2010. A TMA 4DT CD/CR causal model based in path shortening/path stretching techniques. In Proc. of 4th
International Conference on Research in Air Transportation – ICRAT 2010. Presented at the ICRAT 2010, Budapest, Hungary.