A metal-free organic– inorganic aqueous flow battery The Harvard community has made this article openly available. Please share how this access benefits you. Your story matters Citation Huskinson, Brian, Michael P. Marshak, Changwon Suh, S?leyman Er, Michael R. Gerhardt, Cooper J. Galvin, Xudong Chen, Alán Aspuru- Guzik, Roy G. Gordon, and Michael J. Aziz. 2014. A metal-free organic–inorganic aqueous flow battery. Nature 505(7482): 195-198. Published Version doi:10.1038/nature12909 Citable link http://nrs.harvard.edu/urn-3:HUL.InstRepos:11688785 Terms of Use This article was downloaded from Harvard University’s DASH repository, and is made available under the terms and conditions applicable to Open Access Policy Articles, as set forth at http:// nrs.harvard.edu/urn-3:HUL.InstRepos:dash.current.terms-of- use#OAP
Transcript
A metal-free organic–inorganic aqueous flow battery
The Harvard community has made thisarticle openly available. Please share howthis access benefits you. Your story matters
Citation Huskinson, Brian, Michael P. Marshak, Changwon Suh, S?leyman Er,Michael R. Gerhardt, Cooper J. Galvin, Xudong Chen, Alán Aspuru-Guzik, Roy G. Gordon, and Michael J. Aziz. 2014. A metal-freeorganic–inorganic aqueous flow battery. Nature 505(7482): 195-198.
Published Version doi:10.1038/nature12909
Citable link http://nrs.harvard.edu/urn-3:HUL.InstRepos:11688785
Terms of Use This article was downloaded from Harvard University’s DASHrepository, and is made available under the terms and conditionsapplicable to Open Access Policy Articles, as set forth at http://nrs.harvard.edu/urn-3:HUL.InstRepos:dash.current.terms-of-use#OAP
This paper can be cited as: B. Huskinson, M.P. Marshak, C. Suh, S. Er, M.R. Gerhardt, C.J. Galvin, X. Chen, A. Aspuru-Guzik, R.G. Gordon and M.J. Aziz, “A metal-free organic-inorganic aqueous flow battery”, Nature 505, 195–198 (2014).
The formatted version of this manuscript can be found at the following link: http://www.nature.com/nature/journal/v505/n7482/full/nature12909.html
A metal-free organic–inorganic aqueous flow battery
Brian Huskinson1*, Michael P. Marshak1,2*, Changwon Suh2, Süleyman Er2,3, Michael R.
Gerhardt1, Cooper J. Galvin2, Xudong Chen2, Alán Aspuru-Guzik2, Roy G. Gordon1,2 & Michael
J. Aziz1
1Harvard School of Engineering and Applied Sciences, 29 Oxford Street, Cambridge,
Massachusetts 02138, USA.
2Department of Chemistry and Chemical Biology, Harvard University, 12 Oxford Street,
Cambridge, Massachusetts 02138, USA.
3Molecular Materials and Nanosystems, Eindhoven University of Technology, PO Box 513,
5600 MB Eindhoven, The Netherlands.
*These authors contributed equally to this work.
As the fraction of electricity generation from intermittent renewable sources—such as solar or wind—grows, the ability to store large amounts of electrical energy is of increasing importance. Solid-electrode batteries maintain discharge at peak power for far too short a time to fully regulate wind or solar power output1,2. In contrast, flow batteries can independently scale the power (electrode area) and energy (arbitrarily large storage volume) components of the system by maintaining all of the electro-active species in fluid form3–5. Wide-scale utilization of flow batteries is, however, limited by the abundance and cost of these materials, particularly those using redox-active metals and precious metal electrocatalysts6,7. Here we describe a class of energy storage materials that exploits the favourable chemical and electrochemical properties of a family of molecules known as quinones. The example we demonstrate is a metal-free flow battery based on the redox chemistry of 9,10-anthraquinone-2,7-disulphonic acid (AQDS). AQDS undergoes extremely rapid and reversible two-electron two-proton reduction on a glassy carbon electrode in sulphuric acid. An aqueous flow battery with inexpensive carbon electrodes, combining the quinone/hydroquinone couple with the Br2/Br redox couple, yields a peak galvanic power density exceeding 0.6 W cm2 at 1.3 A cm 2. Cycling of this quinone–bromide flow battery showed >99 per cent storage capacity retention per cycle. The organic anthraquinone species can be synthesized from inexpensive commodity chemicals8. This organic approach
Page 2 of 28
permits tuning of important properties such as the reduction potential and solubility by adding functional groups: for example, we demonstrate that the addition of two hydroxy groups to AQDS increases the open circuit potential of the cell by 11% and we describe a pathway for further increases in cell voltage. The use of -aromatic redox-active organic molecules instead of redox-active metals represents a new and promising direction for realizing massive electrical energy storage at greatly reduced cost.
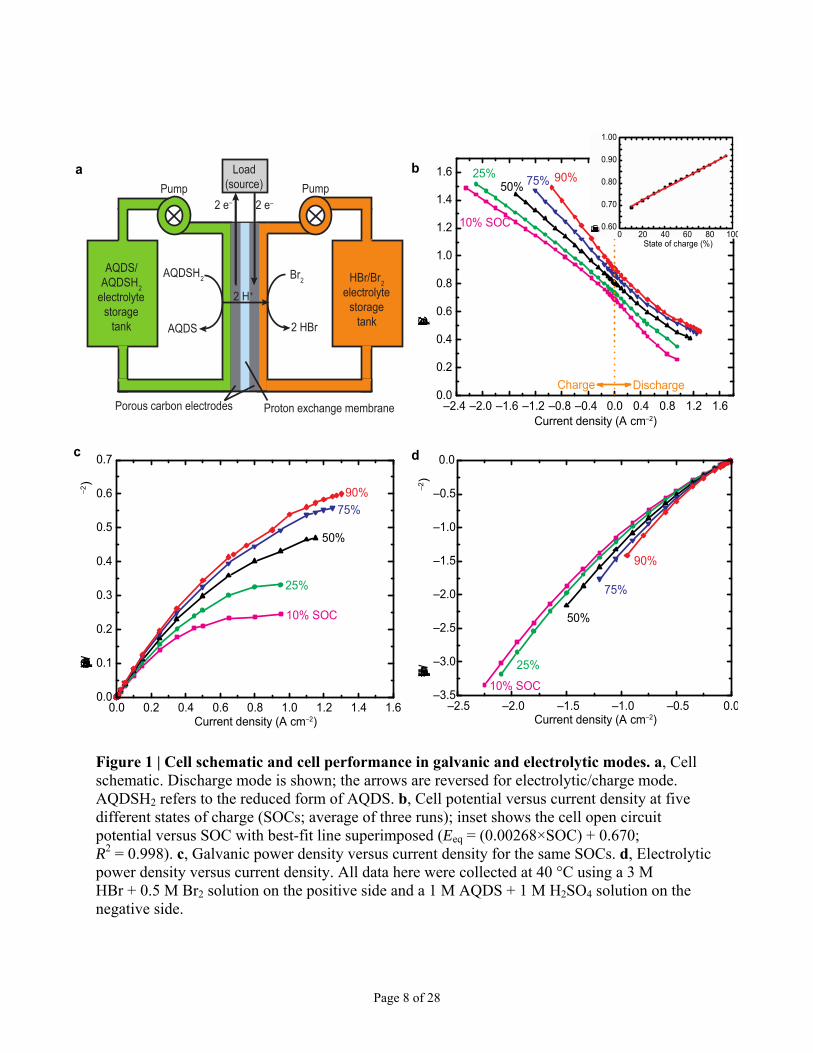
Solutions of AQDS in sulphuric acid (negative side) and Br2 in HBr (positive side) were
pumped through a flow cell as shown schematically in Fig. 1a. The quinone–bromide flow
battery (QBFB) was constructed using a Nafion 212 membrane sandwiched between Toray
carbon paper electrodes (six stacked on each side) with no catalysts; it is similar to a cell
described elsewhere (see figure 2 in ref. 7). We report the potential–current response (Fig. 1b)
and the potential–power relationship (Fig. 1c and d) for various states of charge (SOCs;
measured with respect to the quinone side of the cell). As the SOC increased from 10% to 90%,
the open-circuit potential increased linearly from 0.69 V to 0.92 V. In the galvanic direction,
peak power densities were 0.246 W cm2 and 0.600 W cm2 at these same SOCs, respectively
(Fig. 1c). In order to avoid significant water splitting in the electrolytic direction, we used a cut-
off voltage of 1.5 V, at which point the current densities observed at 10% and 90% SOCs were
−2.25 A cm−2 and −0.95 A cm−2, respectively, with corresponding power densities of
−3.342 W cm−2 and −1.414 W cm−2.
In Fig. 2 we report the results of initial cycling studies for this battery, to test for
consistent performance over longer timescales. Fig. 2a shows cycling data at ±0.2 A cm−2 using
50% of the total capacity of the battery. The cycles are highly reproducible and indicate that
current efficiencies for the battery are around 95%. Fig. 2b shows constant-current cycling data,
collected at ±0.5 A cm−2, using voltage cut-offs of 0 V and 1.5 V. These tests were done using
the identical solutions used in the battery for Fig. 1b–d. The galvanic discharge capacity
retention (that is, the number of coulombs extracted in one cycle divided by the number of
coulombs extracted in the previous cycle) is above 99%, indicating the battery is capable of
operating with minimal capacity fade and suggesting that current efficiencies are actually closer
to 99%. Full characterization of the current efficiency will require slower cycling experiments
and chemical characterization of the electrolyte solutions after extended cycling.
Page 3 of 28
In order to gain a better understanding of the quinone half-reaction on carbon, AQDS was
subjected to half-cell electrochemical measurements. Cyclic voltammetry of a 1 mM solution of
AQDS in 1 M sulphuric acid on a glassy carbon disk working electrode shows current peaks
corresponding to reduction and oxidation of the anthraquinone species9–11 (Fig. 3d, solid trace).
The peak separation of 34 mV is close to the value of 59 mV/n, where n is the number of
electrons involved, expected for a two-electron process. Rotation of this disk at a variety of rates
yields mass-transport limited currents (Fig. 3a) from which the AQDS diffusion coefficient
(D = 3.8(1) × 10−6 cm2 s−1) can be determined; throughout this paper, the numbers reported in
parentheses indicate the standard deviation in the last reported digit. Koutecký-Levich analysis at
low overpotentials (Fig. 3b) can be extrapolated to infinite rotation rate and fitted to the Butler-
Volmer equation (Extended Data Fig. 3a) to give the kinetic reduction rate constant
k0 = 7.2(5) × 10−3 cm s−1. This rate constant is faster than that found for other species used in
flow batteries such as V3+/V2+, Br2/Br− and S42−/S2
2− (see table 2 in ref. 3). It implies that the
voltage loss due to the rate of surface electrochemical reactions is negligible. The fast rate is
apparently due to an outer-sphere two-electron reduction into the aromatic system requiring
little reorganizational energy. The electrochemical reversibility of the two-electron redox
reaction was confirmed by fitting the slope to the Butler-Volmer equation (Extended Data Fig.
3a), giving the transfer coefficient = 0.474(2), which is close to the value of 0.5 expected for
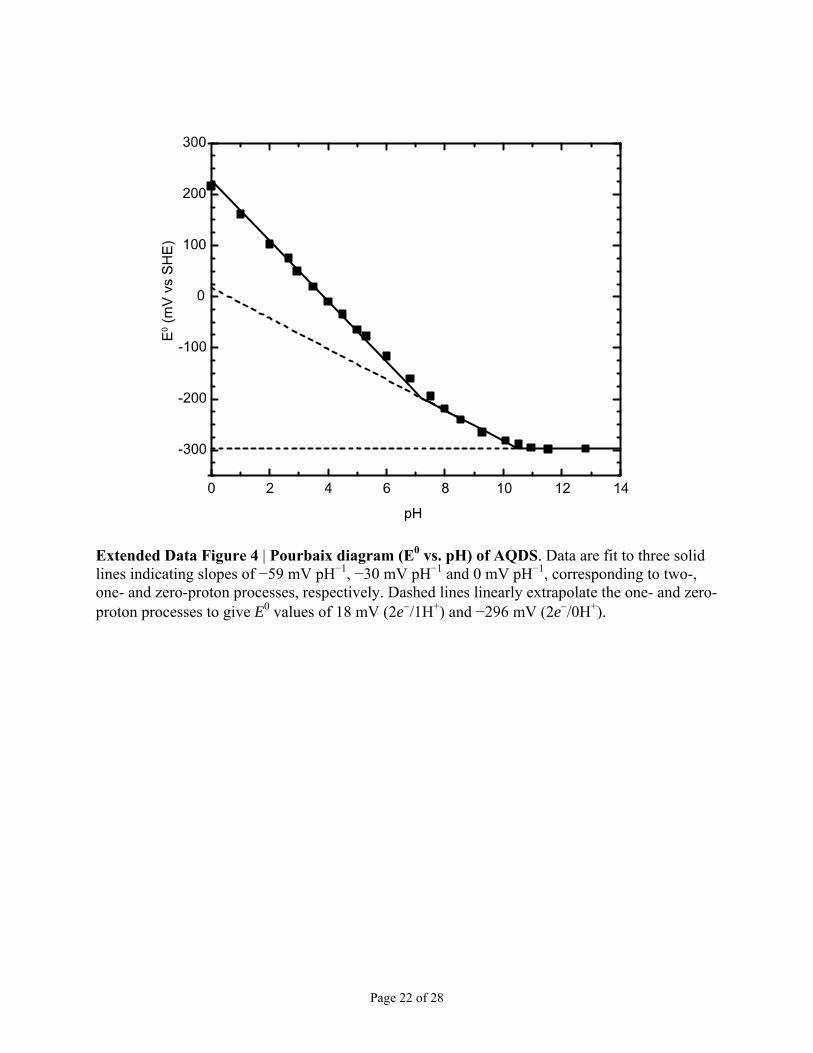
an ideally reversible reaction. The Pourbaix diagram (Extended Data Fig. 4) confirms that a two-
electron, two-proton reduction occurs in acidic solution, and yields approximate pKa values of 7
and 11 for the reduced AQDS species11.
Functionalization of the anthraquinone backbone with electron-donating groups such as
hydroxy can be expected lower the reduction potential of AQDS (E0), thereby raising the cell
voltage12. Hydroxy-substituted anthraquinones are synthesized through oxidation reactions that
may be performed at minimal cost. They are also natural products that have been extracted for
millennia from common sources such as rhubarb and could even provide a renewable source for
future anthraquinone-based electrolyte solutions.
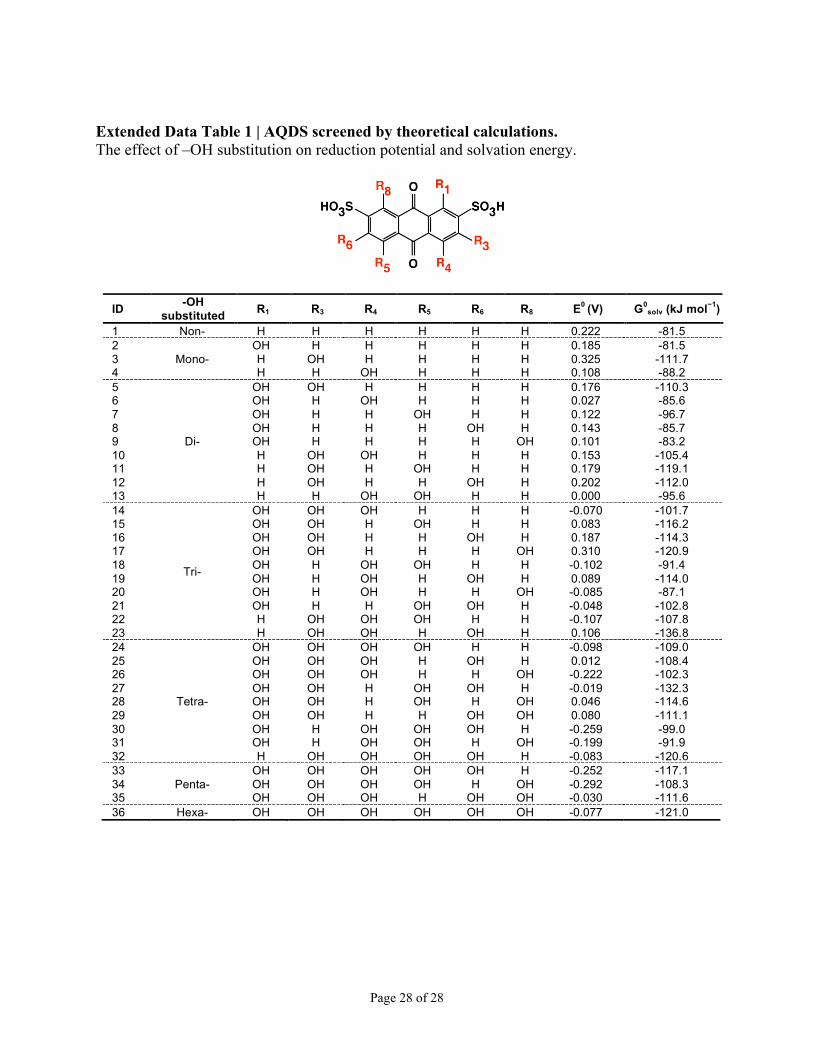
Quantum chemical calculations of un-substituted and hydroxy-substituted AQDS were
performed to predict how substitution patterns would change both E0 of the
quinone/hydroquinone couples (Fig. 3c) and the solvation free energy ( 0solvG ) in aqueous solution
Page 4 of 28
(Extended Data Table 1). The addition of −OH groups is calculated to lower the E0 by an average
of −50 mV per −OH and provide a wide window for tuning E0 by almost 0.6 V. In addition,
increasing numbers of hydroxy substituents are expected to raise the aqueous solubility due to
hydrogen bonding.
In confirmation of the theory, the experimental reduction potential of 1,8-dihydroxy-
9,10-anthraquinone-2,7-disulphonic acid (DHAQDS) was found to be 118 mV (versus the
standard hydrogen electrode), which is very close to the 101 mV calculated for this species (Fig.
3c and d). The experimental E0 of DHAQDS was 95 mV lower than AQDS, and would result in
an 11% increase in QBFB cell potential. DHAQDS was also found to have faster reduction
kinetics (k0 = 1.56(5) × 102 cm s−1), possibly due to intramolecular hydrogen bonding of the
−OH to the ketone (Extended Data Fig. 3b).
The organic approach liberates battery redox chemistry from the constraints of the limited
number of elemental redox couples of the periodic table. Although quinones have been used
previously in batteries using redox-active solids13–15, their incorporation into all-liquid flow
batteries offers the following advantages over current flow-battery technologies. First,
scalability: AQDS contains only the Earth-abundant atoms carbon, sulphur, hydrogen and
oxygen, and can be inexpensively manufactured on large scales. Because some hydroxy-
anthraquinones are natural products, there is also the possibility that the electrolyte material can
on simple, inexpensive carbon electrodes and do not require a costly precious metal catalyst.
Furthermore, this electrode permits higher charging voltages by suppressing the parasitic water-
splitting reactions. Third, stability: quinones should exhibit minimal membrane crossover due to
their relatively large size and charge in aqueous solution as a sulphonate anion. Furthermore,
although bromine crossover is a known issue in zinc-bromine, vanadium-bromine and hydrogen-
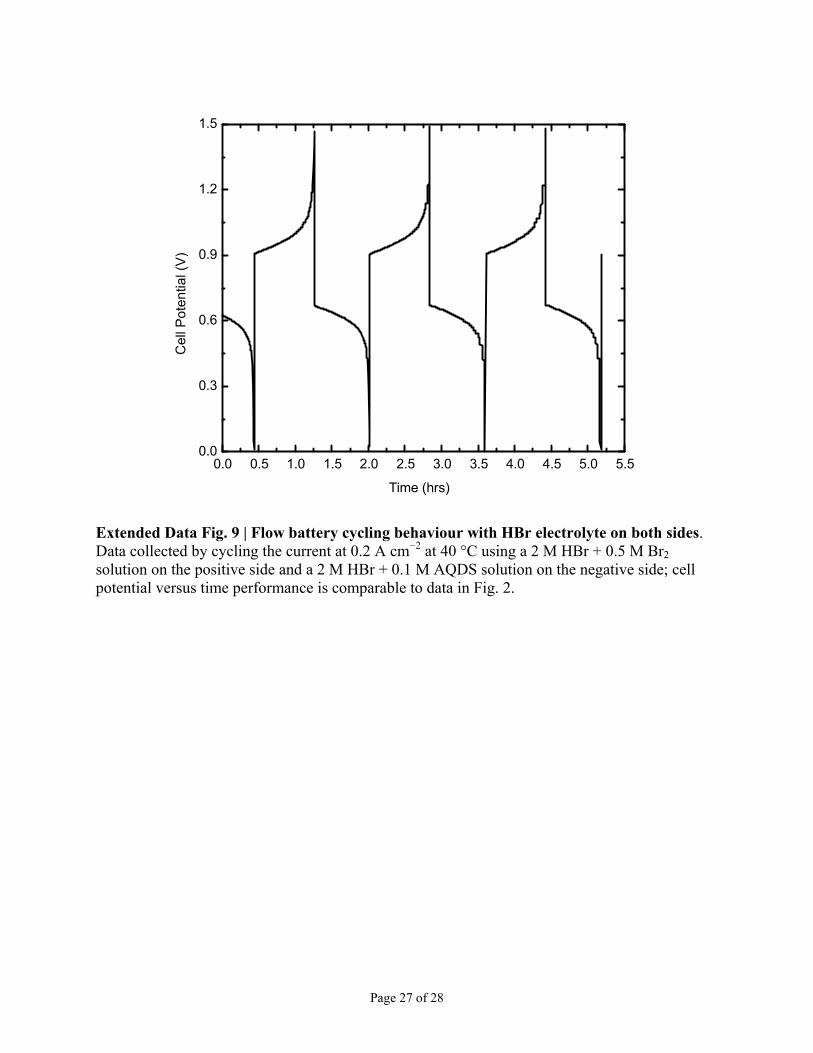
bromine cells, AQDS is stable to prolonged heating in concentrated Br2/HBr mixtures (Extended
Data Figs 5 and 6), and the QBFB can be cycled in HBr electrolyte solutions (Extended Data
Fig. 9). Fourth, solubility: AQDS has an aqueous solubility greater than 1 M at pH 0, and thus
the quinone solution can be stored at relatively high energy density—volumetric and gravimetric
energy densities exceed 50 W h l−1 and 50 W h kg−1, respectively. Last, tunability: the reduction
potential and solubility of AQDS can be further optimized by introduction of functional groups
Page 5 of 28
such as −OH. Use of DHAQDS is expected to lead to an increase in cell potential, performance,
and energy density.
These features lower the capital cost of storage chemicals per kilowatt hour, which sets a
floor on the ultimate system cost per kilowatt hour at any scale. The precursor molecule
anthracene is abundant in crude petroleum and is already oxidized on large scale to
anthraquinone. Sulphonated anthraquinones are used on an industrial scale in wood pulp
processing for paper16, and they can be readily synthesized from the commodity chemicals
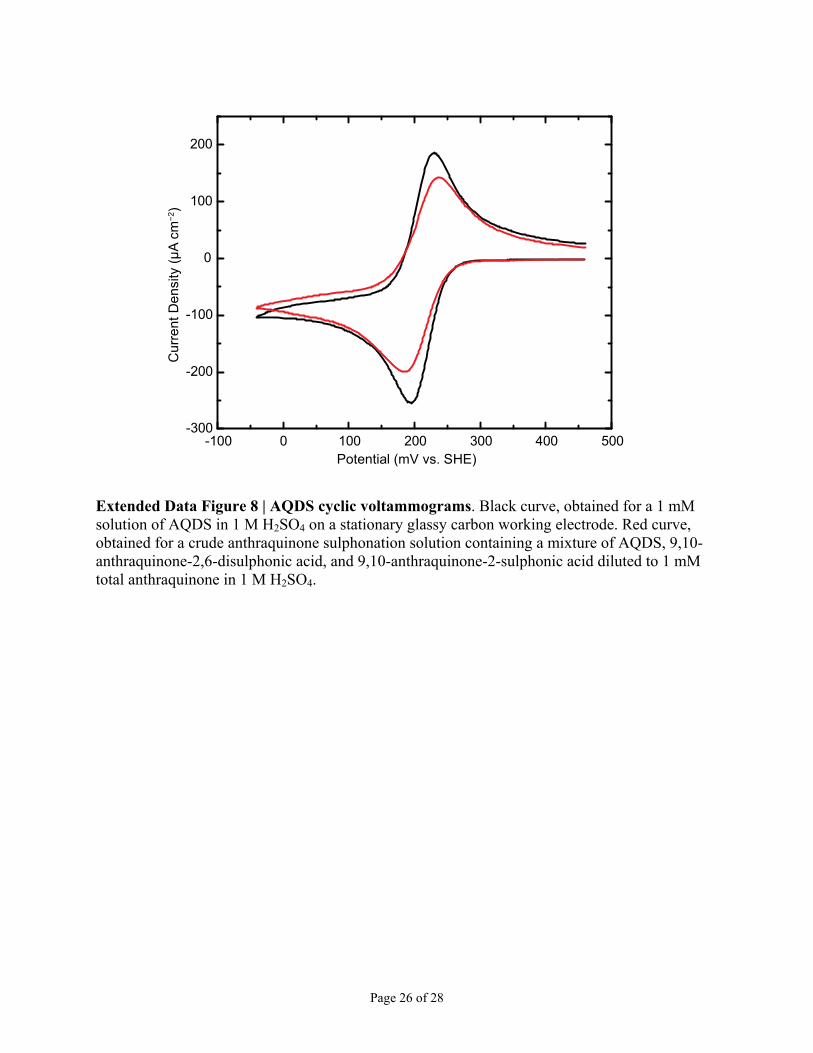
anthraquinone and oleum8. In fact, a cyclic voltammogram of the crude sulphonation product of
these two reagents is virtually identical to that of pure AQDS (Extended Data Fig. 8). Based on
this simple electrolyte preparation that requires no further product separation, we estimate
chemical costs of $21 per kilowatt hour for AQDS and $6 per kilowatt hour for bromine17 (see
Methods for information on cost calculations). The QBFB offers major cost improvements over
vanadium flow batteries with redox-active materials that cost $81 per kilowatt hour (ref. 18).
Optimization of engineering and operating parameters such as the flow field geometry, electrode
design, membrane separator and temperature—which have not yet even begun—should lead to
significant performance improvements in the future, as it has for vanadium flow batteries, which
took many years to reach the power densities we report here6. The use of redox processes in -
aromatic organic molecules represents a new and promising direction for cost-effective, large-
scale energy storage.
METHODS SUMMARY
The QBFB comprised a mixture of commercially available and custom-made components.
Pretreated 2 cm2, stacked (6×) Toray carbon paper electrodes (each of which is about 7.5 m
uncompressed) were used on both sides of the cell. Nafion 212 (50 m thick) was used as a
proton-exchange membrane, and PTFE gasketing was used to seal the cell assembly. On the
positive side of the cell, 120 ml of 3 M HBr and 0.5 M Br2 were used as the electrolyte solution
in the fully discharged state; on the negative side, 1 M 2,7-AQDS in 1 M H2SO4 was used.
AQDS disodium salt was flushed twice through a column containing Amberlyst 15H ion-
exchange resin to remove the sodium ions. Half-cell measurements were conducted using a
Ag/AgCl aqueous reference electrode (3 M KCl filling solution), a Pt wire counter electrode, and
a 3-mm-diameter glassy carbon disk electrode. For theoretical calculations, the total free energies
Page 6 of 28
of molecules were obtained from first-principles quantum chemical calculations within density
functional theory at the level of generalized gradient approximation (GGA) using the PBE
functional. Three-dimensional conformer structures for each quinone/hydroquinone molecule
were generated using the ChemAxon suite with up to 25 generated conformers per molecule
using the Dreiding force field. Generated conformers were used as input structures for the DFT
geometry optimization employed for determining the formation energy, which in turn is used to
evaluate the reduction potential. In the QBFB cost calculation, a price of $4.74 per kilogram
(eBioChem) was used for anthraquinone. To get the sulphonated form actually used here,
anthraquinone must be reacted with oleum (H2SO4/SO3), which adds a negligible cost at scale;
this cost is not included here. The price of bromine was $1.76 per kilogram, based on estimates
from the US Geological Survey17. The cell voltage used to calculate costs here was 0.858 V.
Received 26 June; accepted 25 November 2013; doi:10.1038/nature12909.
1. Rugolo, J. & Aziz, M. J. Electricity storage for intermittent renewable sources. Energy Environ. Sci. 5, 7151–7160 (2012).
2. Yang, Z. et al. Electrochemical energy storage for green grid. Chem. Rev. 111, 3577–3613 (2011).
3. Weber, A. Z. et al. Redox flow batteries: a review. J. Appl. Electrochem. 41, 1137–1164 (2011).
4. Leung, P. et al. Progress in redox flow batteries, remaining challenges and their applications in energy storage. RSC Adv. 2, 10125–10156 (2012).
5. Nguyen, T. & Savinell, R. F. Flow batteries. Electrochem. Soc. Interface 19, 54–56 (2010).
6. Skyllas-Kazacos, M., Chakrabarti, M. H., Hajimolana, S. A., Mjalli, F. S. & Saleem, M. Progress in flow battery research and development. J. Electrochem. Soc. 158, R55–R79 (2011).
7. Huskinson, B., Rugolo, J., Mondal, S. K. & Aziz, M. J. A high power density, high efficiency hydrogen–chlorine regenerative fuel cell with a low precious metal content catalyst. Energy Environ. Sci. 5, 8690–8698 (2012).
8. Crossley, M. L. The separation of mono-, 2,6- and 2,7-sulfonic acids of anthraquinone. J. Am. Chem. Soc. 37, 2178–2181 (1915).
9. Conant, J. B., Kahn, H. M., Fieser, L. F. & Kurtz, S. S. An electrochemical study of the reversible reduction of organic compounds. J. Am. Chem. Soc. 44, 1382–1396 (1922).
10. Kelsall, G. H. & Thompson, I. Redox chemistry of H2S oxidation by the British Gas Stretford process. Part III: Electrochemical behaviour of anthraquinone 2,7 disulphonate in alkaline electrolytes. J. Appl. Electrochem. 23, 296–307 (1993).
Page 7 of 28
11. Forster, R. J. & O’Kelly, J. P. Protonation reactions of anthraquinone-2,7-disulphonic acid in solution and within monolayers. J. Electroanal. Chem. 498, 127–135 (2001).
12. Song, Y. & Buettner, G. R. Thermodynamic and kinetic considerations for the reaction of semiquinone radicals to form superoxide and hydrogen peroxide. Free Radic. Biol. Med. 49, 919–962 (2010).
13. Xu, Y. et al. Novel organic redox flow batteries using soluble quinonoid compounds as positive materials. World Non-Grid-Connected Wind Power and Energy Conference 1–4 (2009). DOI: 10.1109/WNWEC.2009.5335870
14. Wang, W. et al. Anthraquinone with tailored structure for a nonaqueous metal-organic redox flow battery. Chem. Commun. 48, 6669–6671 (2012).
15. Yao, M. et al. High capacity organic positive-electrode material based on a benzoquinone derivative for use in rechargeable lithium batteries. J. Power Sources 195, 8336–8340 (2010).
16. Gordon, O. W., Plattner, E. & Doppenberg, F. Production of pulp by the soda-anthraquinone process (SAP) with recovery of the cooking chemicals. US Patent No. 5,595,628 (1997)
17. US Geological Survey 2010 Minerals Yearbook: Bromine (2010); available at http://minerals.usgs.gov/minerals/pubs/commodity/bromine/myb1-2010-bromi.pdf.
18. US Geological Survey Vanadium Mineral Commodities Summary (2013); available at http://minerals.usgs.gov/minerals/pubs/commodity/vanadium/mcs-2013-vanad.pdf.
Acknowledgements This work was partially funded through US Department of Energy ARPA-E Award DE-
AR0000348 and partially funded through the Harvard School of Engineering and Applied Sciences. Theoretical
work was funded in part through the Extreme Science and Engineering Discovery Environment (XSEDE), which is
supported by National Science Foundation grant number OCI-1053575. B.H. was supported by an NSF Graduate
Research Fellowship. S.E. performed work as part of the Fellowships for Young Energy Scientists programme of the
Foundation for Fundamental Research on Matter (FOM), which is part of the Netherlands Organization for
Scientific Research (NWO). We thank T. Betley, L. Hartle, R. Burton and R. Duncan for discussions.
Author Contributions B.H. and M.P.M contributed equally to this work. B.H. and M.P.M. designed and tested the
battery, with direction from M.J.A. Both M.P.M and M.R.G. conducted electrochemistry experiments, with direction
from M.J.A. M.P.M and C.J.G. synthesized chemicals with direction from R.G.G. Theoretical calculations were
done by C.S. and S.E., with input from M. P. M. and R.G.G. and direction from A.A.-G. X.C. contributed NMR
results. B.H., M.P.M., C.S., M.R.G, S.E., A.A.G., R.G.G. and M.J.A. all contributed to writing the manuscript.
Author Information Reprints and permissions information is available at www.nature.com/reprints. The authors
declare competing financial interests: details are available in the online version of the paper. Readers are welcome to
comment on the online version of the paper. Correspondence and requests for materials should be addressed to
Figure 1 | Cell schematic and cell performance in galvanic and electrolytic modes. a, Cell schematic. Discharge mode is shown; the arrows are reversed for electrolytic/charge mode. AQDSH2 refers to the reduced form of AQDS. b, Cell potential versus current density at five different states of charge (SOCs; average of three runs); inset shows the cell open circuit potential versus SOC with best-fit line superimposed (Eeq = (0.00268×SOC) + 0.670; R2 = 0.998). c, Galvanic power density versus current density for the same SOCs. d, Electrolytic power density versus current density. All data here were collected at 40 °C using a 3 M HBr + 0.5 M Br2 solution on the positive side and a 1 M AQDS + 1 M H2SO4 solution on the negative side.
Figure 2 | Cell cycling behaviour. a, Constant-current cycling at 0.2 A cm−2 at 40 °C using a 2 M HBr + 0.5 M Br2 solution on the positive side and a 0.1 M AQDS + 2 M H2SO4 solution on the negative side; current efficiency is indicated for each complete cycle. b, Constant-current cycling at 0.5 A cm2 at 40 °C using a 3 M HBr + 0.5 M Br2 solution on the positive side and a 1 M AQDS + 1 M H2SO4 solution on the negative side (same solution used in Fig. 1); discharge capacity retention is indicated for each cycle.
0.4
0.5
0.6
0.7
0.8
0.9
1.0
1.1
1.2
Cel
l po
ten
tial (
V)
0 2 4 6 8 10 12 14 16 18 20Time (h)
± 0.2 A cm–2
70
75
80
85
90
95
100
Cu
rre
nt e
ffici
en
cy (
%)
0 2 4 6 8 10 12 14 Cycle number
0 10 20 30 40 50 60 70 80 90 100
0.0
0.3
0.6
0.9
1.2
1.5
1.8
Ce
ll p
ote
ntia
l (V
)
Time (h)
± 0.5 A cm–2
90
92
94
96
98
100
Dis
cha
rge
cap
aci
ty r
ete
ntio
n (%
)99.2% average
0 1 2 3 4 5 6 7 8 9 10 Cycle number
ba
Page 10 of 28
Figure 3 | Half-cell measurements and theory calculations. a, Rotating disk electrode (RDE) measurements of AQDS using a glassy carbon electrode in 1 M H2SO4 at 11 rotation rates ranging from 200 r.p.m. (red) to 3,600 r.p.m. (black). b, Koutecký-Levich plot (current1 versus rotation rate1/2) derived from a at seven different AQDS reduction overpotentials, . c, Calculated reduction potentials of AQDS substituted with –OH groups (black), calculated AQDS and DHAQDS values (blue), and experimental values for AQDS and DHAQDS (red squares). d, Cyclic voltammogram of AQDS and DHAQDS (1 mM) in 1 M H2SO4 on a glassy carbon electrode (scan rate = 25 mV s1).
Page 11 of 28
ONLINE METHODS
Full cell measurements
The QBFB comprised a mixture of commercially available and custom-made components.
Circular endplates were machined out of solid aluminium. Current collectors were
3 inch × 3 inch pyrolytic graphite blocks with interdigitated flow channels (channel
Cell Technologies). Pretreated 2 cm2, stacked (6×) Toray carbon paper electrodes (each of which
is about 7.5 m uncompressed) were used on both sides of the cell. Pretreatment consisted of a
10 min sonication in isopropyl alcohol followed by a five hour soak in a hot (50 °C) mixture of
undiluted sulphuric and nitric acids in a 3:1 volumetric ratio. Nafion 212 (50 m thick) was used
as a proton-exchange membrane (PEM, Alfa Aesar), and PTFE gasketing was used to seal the
cell assembly. Membrane pretreatment was done according to previously published protocols7.
Six bolts (3/8”,16 threads per inch) torqued to 10.2 N m completed the cell assembly, and PTFE
tubing was used to transport reactants and products into and out of the cell. The cell was kept on
a hot plate and wrapped in a proportional-integral-derivative (PID)-controlled heating element
for temperature control. On the positive side of the cell, 120 ml of 3 M HBr and 0.5 M Br2 were
used as the electrolyte solution in the fully discharged state; on the negative side, 1 M AQDS in
1 M H2SO4 was used. HBr was used on the negative side instead of H2SO4 for stability testing
results displayed in Extended Data Fig. 9. State-of-charge calculations are based on the
composition of the quinone side of the cell. 2,7-Anthraquinone disulphonate disodium salt 98%
(TCI) was flushed twice through a column containing Amberlyst 15H ion-exchange resin to
remove the sodium ions. Measurements shown here were done at 40 °C. March centrifugal
pumps were used to circulate the fluids at a rate of approximately 200 ml min1. For
characterization, several instruments were used: a CH Instruments 1100C potentiostat (which can
be used up to ±2 A), a DC electronic load (Circuit Specialists) for galvanic discharge, a DC
regulated power supply (Circuit Specialists) for electrolytic characterization, and a standard
multimeter for independent voltage measurements. The cell was charged at 1.5 V until a fixed
amount of charge ran through the cell. During this process, the electrolyte colours changed from
orange to dark green (AQDS to AQDSH2) and from colourless to red (Br− to Br2). Periodically,
the open circuit potential was measured, providing the data inset in Fig. 1b. Also, at various
Page 12 of 28
SOCs, potential–current behaviour was characterized using the equipment described above: a
fixed current was drawn from the cell, and the voltage, once stabilized, was recorded (Fig. 1b).
For the cycling data in Fig. 2b, the potentiostat was used for constant current (±0.5 A cm2)
measurements with cut-off voltages of 0 V and 1.5 V. For the cycling data in Fig. 2a, a more
dilute quinone solution (0.1 M as opposed to 1 M) was used. Here, the half-cycle lengths were
programmed to run at constant current for a fixed amount of time, provided the voltage cut-offs
were not reached, so that half of the capacity of the battery was used in each cycle. The voltage
cut-offs were never reached during charging, but were reached during discharge. Current
efficiencies are evaluated by dividing the discharge time by the charge time of the previous half-
cycle.
As shown in Fig. 2, current efficiency starts at about 92% and climbs to about 95% over
~15 standard cycles. Note that these measurements are done near viable operating current
densities for a battery of this kind. Because of this, we believe this number places an upper
bound on the irreversible losses in the cell. In any case, 95% is comparable to values seen for
other battery systems. For example, ref. 19 reports vanadium bromide batteries with current
efficiencies of 50–90%, with large changes in current efficiency observed for varying membrane
conditions. Our system will probably be less dependent on membrane conditions because we are
storing energy in anions and neutral species as opposed to cations, which Nafion can conduct
reasonably well.
In Fig. 2b we illustrate the capacity retention of the battery (that is, the number of
coulombs available for discharge at the nth cycle divided by that available for discharge at the
(n − 1)th cycle) to be 99.2% on average, which is quite high and provides direct evidence that
our irreversible losses are below 1%. If we attribute all of this loss (the 0.78% capacity fade per
cycle) to some loss of redox-active quinone, it would be equivalent to losing 0.0006634 moles of
quinone per cycle. If we attribute all of the loss to bromine crossover (which would react with
the hydroquinone and oxidize it back to quinone), this corresponds to a crossover current density
of 1.785 mA cm−2, which is within the range of the widely varying crossover values reported in
the literature20. Note that these crossover numbers can be very sensitive to membrane
pretreatment conditions. It is also important to mention that, in order to determine very accurate
current efficiencies, detailed chemical analyses of the electrolyte are necessary.
Page 13 of 28
Half-cell measurements
These were conducted using a BASi Epsilon EC potentiostat, a BASi Ag/AgCl aqueous
reference electrode (RE-5B, 3 M KCl filling solution) and a Pt wire counter electrode. Rotating
disk electrode (RDE) measurements were conducted using a BASi RDE (RDE-2) and a 3 mm
diameter glassy carbon disk electrode. Electrode potentials were converted to the standard
hydrogen electrode (SHE) scale using E(SHE) = E(Ag/AgCl) + 0.210 V, where E(SHE) is the
potential versus SHE and E(Ag/AgCl) is the measured potential versus Ag/AgCl. 2,7-
Anthraquinone disulphonate disodium salt 98% was purchased from TCI and used as received.
1,8-Dihydroxy-anthraquinone-2,7-disulphonic acid was made according to the literature
procedure21. The electrolyte solution was sulphuric acid (ACS, Sigma) in deionized H2O
(18.2 M cm, Millipore). The Pourbaix diagram (plot of E0 versus pH) shown in Extended Data
Fig. 4, was constructed using aqueous 1 mM solutions of AQDS in pH buffers using the
following chemicals: sulphuric acid (1 M, pH 0), HSO4/SO4
2 (0.1 M, pH 1–2), AcOH/AcO−
(0.1 M, pH 2.65–5), H2PO4/HPO4
2 (0.1 M, pH 5.3–8), HPO42/PO4
3 (0.1 M, pH 9.28–11.52),
and KOH (0.1 M, pH 13). The pH of each solution was adjusted with 1 M H2SO4 or 0.1 M KOH
solutions and measured with an Oakton pH 11 Series pH meter (Eutech Instruments).
RDE studies
All RDE data represent an average of three runs. Error bars in Extended Data Figs 2 and 3
indicate standard deviations. Before each run, the glassy carbon disk working electrode was
polished to a mirror shine with 0.05 µm alumina and rinsed with deionized water until a cyclic
voltammogram of a solution of 1 mM AQDS in 1 M H2SO4 showed anodic and cathodic peak
voltage separation of 34 to 35 mV (39 mV for DHAQDS) at a sweep rate of 25 mV s−1. The
electrode was then rotated at 200, 300, 400, 500, 700, 900, 1,200, 1,600, 2,000, 2,500 and
3,600 r.p.m. while the voltage was linearly swept from 310 to 60 mV (250 to −100 for
DHAQDS) at 10 mV s−1 (Extended Data Fig. 1). The currents measured at 60 mV (−100 for
DHAQDS) (that is, the diffusion limited current density) versus the square root of the rotation
rate () is plotted in Extended Data Fig. 2. The data were fitted with a straight line, with the
slope defined by the Levich equation as 0.620nFACOD2/31/6, where n = 2, Faraday’s constant
F = 96,485 C mol−1, electrode area A = 0.0707 cm2, AQDS concentration CO = 106 mol cm−3,
kinematic viscosity = 0.01 cm2 s−1. This gives D values of 3.8(1) × 106 cm2 s−1 for AQDS and
Page 14 of 28
3.19(7) × 106 cm2 s1 for DHAQDS. The reciprocal of the current at overpotentials of 13, 18,
23, 28, 33, 38 and 363 mV was plotted versus the reciprocal of the square root of the rotation rate
(Fig. 3b and Extended Data Fig. 2). The data for each potential were fitted with a straight line;
the intercept gives the reciprocal of iK, the current in the absence of mass transport limitations
(the extrapolation to infinite rotation rate). A plot of log10(iK) versus overpotential was linearly
fitted with a slope of 62 mV (AQDS) and 68 mV (DHAQDS) defined by the Butler-Volmer
equation as 2.3RT/nF (Extended Data Fig. 3), where R is the universal gas constant, T is
temperature in Kelvin, and is the charge transfer coefficient. This gives = 0.474(2) for
AQDS and 0.43(1) for DHAQDS. The x-intercept gives the log of the exchange current i0, which
is equal to FACOk0, and gives k0 = 7.2(5) × 103 cm s−1 for AQDS and 1.56(5) × 102 cm s1 for
DHAQDS.
Stability studies
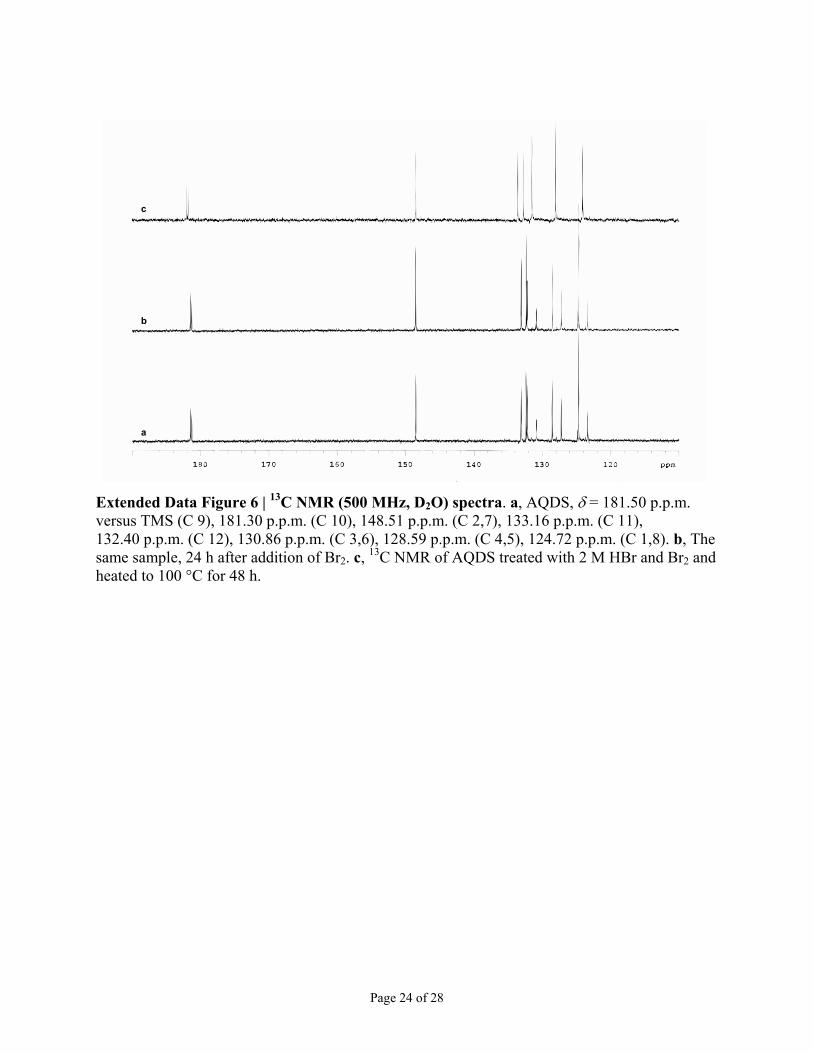
AQDS (50 mg) was dissolved in 0.4 ml of D2O, and treated with 100 µl of Br2. The 1H and 13C
NMR spectra (Extended Data Figs 5a, b and 6a, b) were unchanged from the starting material
after standing for 20 h at 25 °C. AQDS (50 mg) was then treated with 1 ml of 2 M HBr and
100 µl of Br2. The reaction was heated to 100 °C for 48 h and evaporated to dryness at that
temperature. The resulting solid was fully dissolved in D2O giving unchanged 1H and 13C NMR
(Extended Data Figs 5c and 6c); however the 1H NMR reference was shifted due to residual acid.
These results imply that bromine crossover will not lead to irreversible destruction of AQDS.
Sulphonation of anthraquinone and electrochemical study
9,10-Anthraquinone was treated with H2SO4 (20% SO3) at 170 °C for 2 h according to a
literature procedure8. The resulting red solution, containing roughly 37% AQDS, 60% 9,10-
anthraquinone-2,6-disulphonic acid and 3% 9,10-anthraquinone-2-sulphonic acid, was diluted
and filtered. A portion of this solution was further diluted with 1 M H2SO4 to ~1 mM total
anthraquinone concentration. The cyclic voltammogram (Extended Data Fig. 8) is similar to that
of pure AQDS, though the anodic/cathodic peak current density is broadened due to the presence
of the multiple sulphonic acid isomers.
Theory and methods
We used a fast and robust theoretical approach to determine the E0 of quinone/hydroquinone
couples in aqueous solutions. We employed an empirical linear correlation of Hf, the heat of
Page 15 of 28
formation of hydroquinone at 0 K from the quinone and hydrogen gas, to the measured E0
values22. Following the treatment of ref. 22, the linear correlation is described as G = −nFE0,
where G is the difference in total free energy between quinone and hydroquinone, n is the
number of electrons involved in the reaction, and F is the Faraday constant. The entropy
contributions to the total free energies of reaction have been neglected because the entropies of
reduction of quinones are found to be very similar22,23, and the E0 of the oxidation–reduction
system is linearly expressed as (−nF)−1Hf + b, where b is a constant. It was also assumed that
the reduction of quinones takes place in a single-step reaction involving a two-electron two-
proton process9,24. The total free energies of molecules were obtained from first-principles
quantum chemical calculations within density functional theory (DFT) at the level of generalized
gradient approximation (GGA) using the PBE functional25. The projector augmented wave
(PAW) technique and a plane-wave basis set26,27 as implemented in VASP28,29 were employed.
The kinetic energy cut-off for the plane-wave basis was set at 500 eV, which was sufficient to
converge the total energies on a scale of 1 meV per atom. To obtain the ground-state structures
of molecules in the gas phase, we considered multiple initial configurations for each molecule
and optimized them in a cubic box of 25 Å using -point sampling. The geometries were
optimized without any symmetry constraints using the conjugate gradient (CG) algorithm, and
the convergence was assumed to be complete when the total remaining forces on the atoms were
less than 0.01 eV Å−1. [
The search for conformational preference through theoretical calculations for each
hydroxylated quinone is crucial because of the significant effects of intramolecular hydrogen
bonds on the total free energies of the molecules30. Three-dimensional conformer structures for
each quinone/hydroquinone molecule were generated using the ChemAxon suite (Marvin 6.1.0
by ChemAxon, http://www.chemaxon.com) with up to 25 conformers generated per molecule
using the Dreiding force field31. The conformers generated were used as input structures for the
DFT geometry optimization employed for determining Hf, which in turn is used to estimate E0
and 0solvG .
In order to calculate the E0 of the hydroxy-substituted AQDS molecules (Fig 3c), the
correlation between Hf and E0 was calibrated from experimental data of six well-characterized
quinones32. Specifically, we employed the experimental values of the aqueous E0 and computed
Page 16 of 28
Hf of 1,2-benzoquinone, 1,4-benzoquione, 1,2-naphthoquinone, 1,4-naphthoquinone, 9,10-
anthraquinone, and 9,10-phenanthrene33. The training set ensures that the calibration plot
addresses most classes and aspects of quinones, including two quinones each from 1-ring
(benzoquinone), 2-ring (naphthoquinone) and 3-ring (anthraquinone and phenanthrene)
structures. In addition, the experimental values of E0 of the training set spanned from 0.09 V
(9,10-anthraquinone) to 0.83 V (1,2-benzoquinone), providing a wide range for E0 (Extended
Data Fig. 7). The linear calibration plot for E0 yields an R2 = 0.97 between the calculated Hf
and E0 (Extended Data Fig. 7).
The 0solvG values of the quinones in water were calculated using the Jaguar 8.0 program in
the Schrödinger suite 2012 (Jaguar, version 8.0, Schrödinger). The standard Poisson-Boltzmann
solver was employed 34,35. In this model, a layer of charges on the molecular surface represents
the solvent. 0solvG was calculated as the difference between the total energy of the solvated
structure and the total energy of the molecule in vacuum. A more negative value for 0solvG
corresponds to a quinone that is likely to have a higher aqueous solubility. An absolute
prediction of the solubility is not readily available, as the accurate prediction of the most stable
forms of molecular crystal structures with DFT remains an open problem36.
Cost calculations
These were done using the following formula: C = (3.6 × 10³) × (PM)/(nFE), where C is the cost
in US dollars of the compound per kilowatt hour, P is the cost in US dollars per kilogram, M is
the molecular mass of the compound, F is Faraday’s constant (96,485 C mol1), n is the number
of moles of electrons transferred per mole of storage compound (two for the QBFB), and E is the
open-circuit voltage (V) of the storage device. In calculating the price for the anthraquinone-
bromine battery, a price of $4.74 per kilogram (eBioChem) was used for anthraquinone (note
that, in order to get the sulphonated form actually used here, anthraquinone must be reacted with
oleum (H2SO4/SO3), which adds a negligible cost at scale; this cost is not included here). The
price of bromine was $1.76 per kilogram, based on estimates from the US Geological Survey17.
The cell voltage used to calculate costs here was 0.858 V. For vanadium, costs were calculated
from USGS prices from 201118 of vanadium pentoxide at $14.37 per kilogram, and the cell
voltage used was 1.2 V. Balance-of-system costs have not been estimated because the
technology is too immature.
Page 17 of 28
19. Skyllas-Kazacos, M., Milne, N. A. & Kazacos, G. C. Membrane properties and behavior in the Generation 2 vanadium bromide redox flow batteries. Materials Forum 32, 72–77 (2008).
20. Yeo, R. S. & McBreen, J. Transport properties of Nafion membranes in electrochemically regenerative hydrogen/halogen cells. J. Electrochem. Soc. 126, 1682–1687 (1979).
21. Haase, J., Baudys, J., Obruba, K. & Panek, J. Dihydroxyanthraquinone disulfonic acids. CS Patent No. 148,977 (1973).
22. Dewar, M. J. S. & Trinajstic, N. Ground states of conjugated molecules-XIV: Redox potentials of quinones. Tetrahedron 25, 4529–4534 (1969).
23. Pullman, B. & Pullman, A. Quantum Biochemistry 475 (Interscience, 1963).
24. Guin, P. S., Das, S. & Mandal, P. C. Electrochemical reduction of quinones in different media: a review. Int. J. Electrochem. 816202 (2011).
25. Perdew, J. P., Burke, K. & Ernzerhof, M. Generalized gradient approximation made simple. Phys. Rev. Lett. 77, 3865–3868 (1996).
26. Blöchl, P. E. Projector augmented-wave method. Phys. Rev. B 50, 17953–17979 (1994).
27. Kresse, G. & Joubert, D. From ultrasoft pseudopotentials to the projector augmented-wave method. Phys. Rev. B 59, 1758–1775 (1999).
28. Kresse, G. & Hafner, J. Ab initio molecular dynamics for liquid metals. Phys. Rev. B 47, 558–561 (1993).
29. Kresse, G. & Furthmuller, J. Efficient iterative schemes for ab initio total-energy calculations using a plane-wave basis set. Phys. Rev. B 54, 11169–11186 (1996).
30. Qu, R., Liu, H., Feng, M., Yang, X. & Wang, Z. Investigation on intramolecular hydrogen bond and some thermodynamic properties of polyhydroxylated anthraquinones. J. Chem. Eng. Data 57, 2442–2455 (2012).
31. Mayo, S. L., Olafson, B. D. & Goddard, W. A. III Dreiding: A generic force field for molecular simulations. J. Phys. Chem. 94, 8897–8909 (1990).
32. Wang, J. & Hou, T. Recent advances on aqueous solubility prediction. Comb. Chem. High Throughput Screen. 14, 328–338 (2011).
33. Johnsson Wass, J. R. T., Ahlberg, E., Panas, I. & Schiffrin, D. J. Quantum chemical modeling of the reduction of quinones. J. Phys. Chem. A 110, 2005–2020 (2006).
34. Tannor, D. J. et al. Accurate first principles calculation of molecular charge distributions and solvation energies from ab initio quantum mechanics and continuum dielectric theory. J. Am. Chem. Soc. 116, 11875–11882 (1994).
35. Marten, B. et al. New model for calculation of solvation free energies:�correction of self-consistent reaction field continuum dielectric theory for short-range hydrogen-bonding effects. J. Phys. Chem. 100, 11775–11788 (1996).
36. Hongo, K., Watson, M. A., Sánchez-Carrera, R. S., Iitaka, T. & Aspuru-Guzik, A. Failure of conventional density functionals for the prediction of molecular crystal
Page 18 of 28
polymorphism: a quantum Monte Carlo study. J. Phys. Chem. Lett. 1, 1789–1794 (2010).
Page 19 of 28
Extended Data Figure 1 | Plot of potential versus current density at different rotation rates of the RDE. The solution is 1 mM DHAQDS (1 mM in 1 M H2SO4), using a rotating disk electrode (RDE) of glassy carbon. Rotation rates are 200, 300, 400, 500, 700, 900, 1,200, 1,600, 2,000, 2,500 and 3,600 r.p.m.
-100 0 100 200 300-1,200
-1,000
-800
-600
-400
-200
0
Cur
rent
De
nsity
(μ
A c
m−
2 )
Potential (mV vs SHE)
3600 r.p.m.
200 r.p.m.
Page 20 of 28
Extended Data Figure 2 | Levich and Koutecký-Levich plots obtained using the RDE. a, Levich plot (limiting current versus square root of rotation rate ) of 1 mM AQDS in 1 M H2SO4. (the fitted line has a slope of 4.53(2) µA s1/2 rad1/2, giving D = 3.8(1) × 106 cm2 s1). Data are an average of three runs; error bars indicate the standard deviation. b, As a but for DHAQDS in 1 M H2SO4 (slope of 3.94(6) µA s1/2 rad1/2 gives D = 3.19(7) × 106 cm2 s1). c, Koutecký-Levich plot (i1 versus 1/2) of 1 mM DHAQDS in 1 M H2SO4. The current response i is shown for seven different AQDS reduction overpotentials .
Extended Data Figure 3 | Fit of Butler-Volmer equation. Constructed using the current response in the absence of mass-transport at low AQDS reduction overpotentials; iK is the current extrapolated from the zero-intercept of Fig. 3b and Extended Data Fig. 2c (infinite rotation rate). Data are an average of three runs; error bars indicate the standard deviation. a, AQDS: best-fit line has the equation y = 62(x + 4.32). This yields = 0.474(2) and k0 = 7.2(5) × 103 cm s1. b, DHAQDS: best-fit line is the function y = 68(x + 3.95). This yields = 0.43(1) and k0 = 1.56(5) × 102 cm s1.
-4.0 -3.9 -3.8 -3.7 -3.6 -3.5 -3.4 -3.30
5
10
15
20
25
30
35
40
45
Ove
rpo
ten
tial (
mV
)
log(iK)
-4.4 -4.3 -4.2 -4.1 -4.0 -3.9 -3.8 -3.7 -3.60
5
10
15
20
25
30
35
40
45
O
verp
ote
ntia
l (m
V)
log(iK)
a b
Page 22 of 28
Extended Data Figure 4 | Pourbaix diagram (E0 vs. pH) of AQDS. Data are fit to three solid lines indicating slopes of −59 mV pH−1, −30 mV pH−1 and 0 mV pH−1, corresponding to two-, one- and zero-proton processes, respectively. Dashed lines linearly extrapolate the one- and zero-proton processes to give E0 values of 18 mV (2e/1H+) and −296 mV (2e/0H+).
Page 23 of 28
Extended Data Figure 5 | 1H NMR (500 MHz, D2O) spectra. a, Spectrum of AQDS: chemical shift = 7.99 p.p.m. versus tetramethylsilane (TMS) (doublet (d), coupling constant J = 2 Hz, 1,8 C–H), 7.79 p.p.m. (doublet of doublets, J = 2 and 8 Hz, 4,5 C–H), 7.50 p.p.m. (d, J = 8 Hz, 3,6 C–H). b, The same sample, 20 h after addition of Br2. c, 1H NMR of AQDS treated with 2 M HBr and Br2 and heated to 100 °C for 48 h. The peaks are shifted due to presence of trace HBr which shifted the residual solvent peak due to increased acidity. Coupling constants for each peak are identical to a.
a
b
c
Page 24 of 28
Extended Data Figure 6 | 13C NMR (500 MHz, D2O) spectra. a, AQDS, = 181.50 p.p.m. versus TMS (C 9), 181.30 p.p.m. (C 10), 148.51 p.p.m. (C 2,7), 133.16 p.p.m. (C 11), 132.40 p.p.m. (C 12), 130.86 p.p.m. (C 3,6), 128.59 p.p.m. (C 4,5), 124.72 p.p.m. (C 1,8). b, The same sample, 24 h after addition of Br2. c, 13C NMR of AQDS treated with 2 M HBr and Br2 and heated to 100 °C for 48 h.
a
b
c
Page 25 of 28
Extended Data Figure 7 | Calibration model for Hf and experimental E0. This shows a linear relationship (red dashed line; R2 = 0.97 between calculated Hf (this work) and experimental E0 (from the literature) of six quinones in aqueous solutions: BQ, benzoquinone; NQ, naphthoquinone; AQ, anthraquinone; and PQ, phenanthraquinone.
-2.5 -2.0 -1.5 -1.0 -0.50.0
0.1
0.2
0.3
0.4
0.5
0.6
0.7
0.8
0.9
E0 fr
om
Lite
ratu
re (
V)
ΔHf (eV)
1,2-BQ
1,4-BQ
1,2-NQ
9,10-PQ
1,4-NQ
9,10-AQ
R2 = 0.97
Page 26 of 28
Extended Data Figure 8 | AQDS cyclic voltammograms. Black curve, obtained for a 1 mM solution of AQDS in 1 M H2SO4 on a stationary glassy carbon working electrode. Red curve, obtained for a crude anthraquinone sulphonation solution containing a mixture of AQDS, 9,10-anthraquinone-2,6-disulphonic acid, and 9,10-anthraquinone-2-sulphonic acid diluted to 1 mM total anthraquinone in 1 M H2SO4.
-100 0 100 200 300 400 500-300
-200
-100
0
100
200
Cu
rre
nt D
ens
ity (μ
A c
m−
2 )
Potential (mV vs. SHE)
Page 27 of 28
Extended Data Fig. 9 | Flow battery cycling behaviour with HBr electrolyte on both sides. Data collected by cycling the current at 0.2 A cm−2 at 40 °C using a 2 M HBr + 0.5 M Br2 solution on the positive side and a 2 M HBr + 0.1 M AQDS solution on the negative side; cell potential versus time performance is comparable to data in Fig. 2.
Extended Data Table 1 | AQDS screened by theoretical calculations. The effect of –OH substitution on reduction potential and solvation energy.
ID -OH
substituted R1 R3 R4 R5 R6 R8 E0 (V) G0
solv (kJ mol−1)
1 Non- H H H H H H 0.222 -81.5 2
Mono- OH H H H H H 0.185 -81.5
3 H OH H H H H 0.325 -111.7 4 H H OH H H H 0.108 -88.2 5
Di-
OH OH H H H H 0.176 -110.3 6 OH H OH H H H 0.027 -85.6 7 OH H H OH H H 0.122 -96.7 8 OH H H H OH H 0.143 -85.7 9 OH H H H H OH 0.101 -83.2 10 H OH OH H H H 0.153 -105.4 11 H OH H OH H H 0.179 -119.1 12 H OH H H OH H 0.202 -112.0 13 H H OH OH H H 0.000 -95.6 14
Tri-
OH OH OH H H H -0.070 -101.7 15 OH OH H OH H H 0.083 -116.2 16 OH OH H H OH H 0.187 -114.3 17 OH OH H H H OH 0.310 -120.9 18 OH H OH OH H H -0.102 -91.4 19 OH H OH H OH H 0.089 -114.0 20 OH H OH H H OH -0.085 -87.1 21 OH H H OH OH H -0.048 -102.8 22 H OH OH OH H H -0.107 -107.8 23 H OH OH H OH H 0.106 -136.8 24
Tetra-
OH OH OH OH H H -0.098 -109.0 25 OH OH OH H OH H 0.012 -108.4 26 OH OH OH H H OH -0.222 -102.3 27 OH OH H OH OH H -0.019 -132.3 28 OH OH H OH H OH 0.046 -114.6 29 OH OH H H OH OH 0.080 -111.1 30 OH H OH OH OH H -0.259 -99.0 31 OH H OH OH H OH -0.199 -91.9 32 H OH OH OH OH H -0.083 -120.6 33