A Method for the Collection, Preservation andAnalysis of Water Samples for Agricultural Chemicals(Pesticides) used in the Murrumbidgee Irrigation Area
Wolfgang Korth and Sharyn Foster
TECHNICAL REPORT NUMBER 11/98CSIRO Land and WaterGriffith
March 1998
i
TABLE OF CONTENTS
Page
1 Introduction 11.1 Background 1
2 Methods 12.1 Sample Bottle Preparation 12.2 Sample Collection 22.3 Buffering and Storage 2
2.3.1 Preparation of Phosphate Buffer 3
3 Preparation of surrogate and internal standards 33.1 Preparation of fenchlorphos (surrogate standard) 3
3.1.1 Preparation of fenchlorphos spiking mix 43.2 Preparation of 1-chlorotetradecane (internal standard) 4
3.2.1 Preparation of 1-Cl-C14 spiking mix 5
4 Preparation of pesticide standards 54.1 Preparing a stock pesticide standard solution from a primary standard 6
4.1.1 If the primary standard is a solid 64.1.2 If the primary standard is a liquid 7
4.2 Spiking Standards 74.2.1 High level standards (HLS) 74.2.2 Low level standards (LLS) 84.2.3 Matrix Working Standards 8
4.3 Air-Sandwich Technique 10
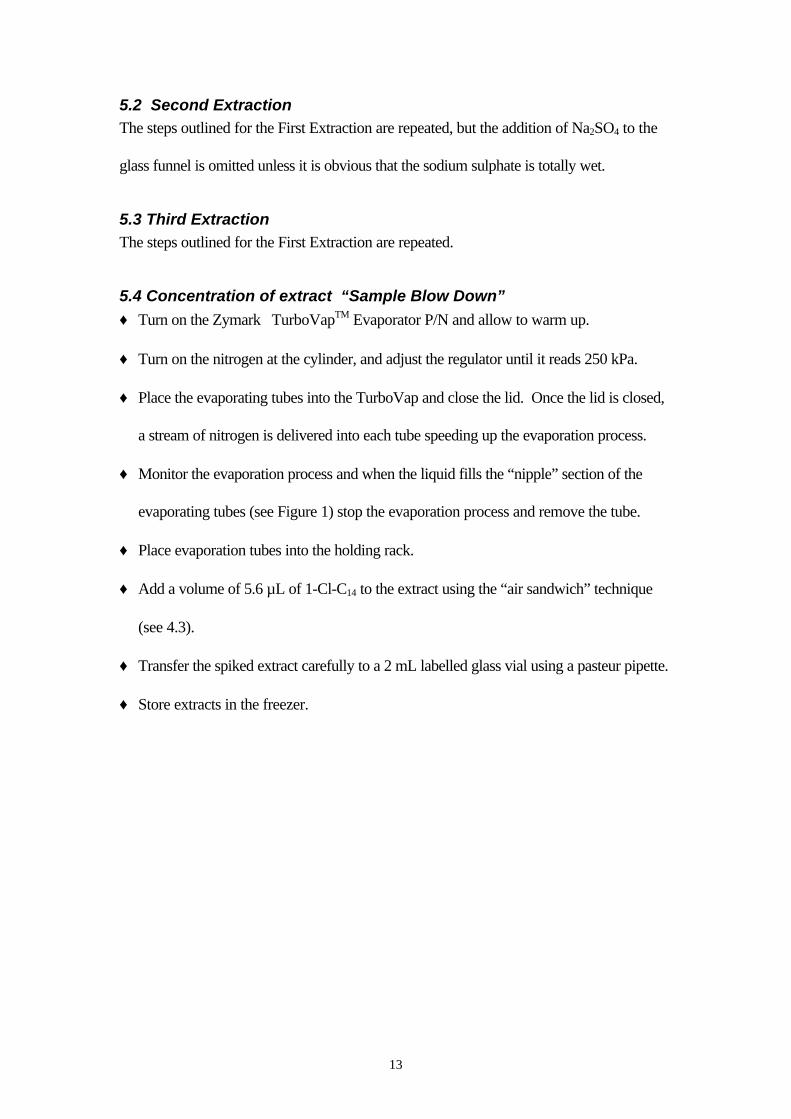
5 Preparation of samples 105.1 First Extraction 115.2 Second Extraction 125.3 Third Extraction 125.4 Concentration of extract “Sample Blow Down” 125.5 Glassware Cleaning 14
6 Analysis 146.1 GC-MSD 146.2 Calculations 156.3 LOD, LOR, precision, accuracy 17
ii
References 17
Acknowledgments 18
Appendix 1 19Appendix 2 40Appendix 3 41Appendix 4 42Appendix 5 43Appendix 6 45
1
1 Introduction
1.1 BackgroundThis technical report details the steps required to collect, preserve and analyse water
samples for pesticides. The method was developed for the conditions experienced in the
Murrumbidgee Irrigation Area (MIA) by Dr. Wolfgang Korth1, and has been in use at
CSIRO Land and Water (formerly CSIRO Division of Water Resources), Griffith since
1991. Our particular local conditions include waters that can be very turbid, as well as
containing a vast array of different pesticides at varying concentrations. For reference to
field experiments that have used this method see Korth et al, 1995a and Korth et al, 1995b.
2 Methods
2.1 Sample Bottle PreparationSamples should be collected in 1L amber glass bottles. Prior to collection, used sample
bottles must undergo a rigorous cleaning regime (as follows). New bottles are used
without cleaning.
• thoroughly rinse bottle in hot tap water
• soak overnight in a detergent bath (5% “extran 300”)
• rinse 3 times in hot tap water
• soak overnight in 10% HCl bath
• rinse 3 times in hot tap water
• rinse 3 times in distilled or MilliQ water
• rinse in methanol
• allow to dry
1 Dr. Wolfgang Korth moved to the Bureau of Resource Sciences in 1995 to take up a position as theResidues Program Chemist within the National Residues Survey.
2
• place aluminium foil over opening and replace the lid
• place a piece of water proof tape on bottle to use as a label
2.2 Sample CollectionPrior to the collection of the sample a volume of sample water of approximately 100 mL is
allowed to enter the bottle by immersing the bottle in the body of water. If the site is
difficult to access, either collect the sample in a stainless steel bucket attached to a rope
(which is thoroughly rinsed with the sample to be collected prior to filling the sample
bottle), or attach the bottle to the extendable metal pole, specifically constructed to hold the
bottle in place and allow it to be lowered into the water body. Place the lid on the bottle
and rinse. Discard contents in a way that will not disturb the sample about to be taken.
Repeat this rinse step 2 more times. Re-immerse the bottle and allow it to fill to the top of
the bottle to minimise head space. Cover the opening with aluminium foil and seal with the
screw-on lid. Once collected, samples should be stored on ice in an esky for transport to
the laboratory.
2.3 Buffering and storageOnce in the laboratory, the samples need to be buffered (pH 6.9) and stored (~4oC) to
minimise pesticide degradation. Samples are buffered by the addition of 10 mL of
concentrated phosphate buffer (see 2.3.1 for buffer preparation) to 1L of sample. A
5 mL pipette is used to dispense the buffer. A small volume (~10-15 mL) of the sample
must be discarded, after thorough mixing, to allow for addition of the buffer. Once
buffered, samples are stored at ~4oC.
3
2.3.1 Preparation of Phosphate BufferPlace ~ 800 mL of MilliQ water in a beaker with a magnetic stirrer bar and place on a
magnetic stirrer plate.
Weigh out the following:
AR grade Na2HPO4 353.3 g
AR grade KH2PO4 338.7 g
place one of the above in the MilliQ water with constant stirring. Once this has dissolved,
add the second. Continue stirring until all has dissolved. Transfer to a 1L volumetric flask
and dilute to 1L with MilliQ water. Store at room temperature in a labelled glass container2
. This solution is stable for at least 6 months.
3 Preparation of Surrogate and Internal StandardsAll standards can be purchased from commercial suppliers specialising in pesticide
standards. The standards are supplied with documentation regarding their purity, hazard
information, storage requirements and expiry date.
Stock solutions of pesticides should be prepared from primary standard materials in a fume
cupboard and gloves should be worn during the preparation process to avoid skin contact.
Care should be taken to minimise the physical handling of glassware which will be weighed
as some glove types leave powder residues which may contribute to weighing errors.
3.1 Preparation of fenchlorphos (surrogate standard)• place a clean, dry 50 mL volumetric flask on a 4 decimal place electronic balance
• tare
2 Do not use a glass container with a quick-fit stopper as this will be difficult to remove if buffersolidifies between stopper and neck of container.
4
• add an amount of fenchlorphos (~ 0.0900g) to the tared flask. Record the weigh
accurately and note the purity of the fenchlorphos. (eg. 0.0942g weighed, 95.5% pure)
• dilute to the mark with acetone (HPLC grade)
• calculate the concentration of fenchlorphos and correct for purity
( eg. 0.0942g/50 mL
= 1884 mgL-1, but since purity is 95.5%
= 1799 ppm)
• this solution is stored at -18oC and is kept as the stock solution for the subsequent
preparation of working standards.
3.1.1 Preparation of fenchlorphos spiking mix• weigh ~ 5 g of fenchlorphos stock solution into a 50 mL volumetric flask, accurately
record weight. (eg. 4.5744g)
• convert weight to volume using specific gravity of acetone (0.7899)
(eg. 4.5744/0.7899 = 5.79 mL)
• dilute to 50 mL with acetone (HPLC grade), calculate new concentration of
fenchlorphos spiking mix. (eg. 5.79 mL x 1799 ppm / 50 mL = 208 ppm)
3.2 Preparation of 1-chlorotetradecane (1-Cl-C14) (internal standard)• place a clean, dry 50 mL volumetric flask on a 4 decimal place electronic balance
• tare
• add an amount of 1-Cl-C14 (~ 0.0900g) to the tared flask. Record the weight accurately
and note the purity of the 1-Cl-C14. (eg. 0.0548g weighed, 99% pure)
5
• dilute to the mark with dichloromethane (HPLC grade)
• allowing for purity, calculate the concentration of 1-Cl-C14
( eg. 0.0548g/50 mL
= 1096 mgL-1, but since purity is 99%
= 1085 ppm)
This solution is stored at -18oC and is kept as the stock solution for the subsequent
preparation of working standards.
3.2.1 Preparation of 1-Cl-C14 spiking mix• weigh ~ 5 g of 1-Cl-C14 stock into a 50 mL volumetric flask, accurately record weight
(eg. 6.8705g)
• convert weight to volume using specific gravity of dichloromethane (1.3266)
(eg. 6.8705/1.3266 = 5.18 mL)
• dilute to 50 mL with dichloromethane (HPLC grade), calculate new concentration of 1-
Cl-C14 spiking mix (eg. 5.18 mL x 1085 ppm / 50 mL = 112.4 ppm)
4 Preparation of pesticide standards
The choice of which pesticides should be monitored was in part determined following
discussions with farmers, retailers and agronomists regarding the usage patterns of these
compounds in the study area. In addition, the following factors were also considered:
n toxicity
n potential downstream human health or ecosystem impact
6
n likelihood of partitioning into dichloromethane
n suitability for gas chromatographic analysis
Table 1 lists the pesticides that were chosen to be monitored in the 1995/96 irrigation
season based on the ability to detect these pesticides by the methods described, and their
potential use in the study site.
Table 1. Pesticides analysed for in 1995/96.atrazine diazinon lambda-cyhalothrin monocrotofosbensulfuron dicofol linuron profenfosbifenthrin diuron malathion propanilbromacil α-endosulfan methidathion simazinechlorpyrifos β-endosulfan methomyl terbufoscypermethrin endosulfan-sulfate metolachlor thiobencarbdeltamethrin fluazifop-butyl molinate trifluralin
Pesticide analysis can be both quantitative and qualitative. To determine the actual
concentration of pesticides, a number of standards containing a range of concentrations
must be prepared. Stock standards containing high pesticide concentrations are initially
prepared from the purchased primary standard, and further diluted to prepare working
standards.
4.1 Preparing a stock pesticide solution from a primary standard
4.1.1. If the primary standard is a solid• place a clean, dry 50 mL volumetric flask on a 4 decimal place electronic balance
• tare
• transfer ~100 mg of the solid into the flask with a clean spatula
• record weight accurately
7
• dilute to 50 mL with a suitable solvent. Eg acetone (HPLC grade)
• allowing for purity, calculate concentration which is generally between 1000 and 2000
ppm and record on label with compound name, date, solvent and expiry date.
This process is repeated for all solid standards. Record all steps in the preparation process
in a standards preparation book.
4.1.2 If the primary standard is a liquid• place a clean, dry 50 mL volumetric flask on a 4 decimal place electronic balance
• tare
• transfer ~100 mg of the liquid into the flask using a glass pasteur pipette
• record weight accurately
• dilute to 50 mL with a suitable solvent. Eg acetone (HPLC grade)
• allowing for purity, calculate concentration which is generally between 1000 and 2000
ppm and record on label with compound name, date, solvent and expiry date.
This process is repeated for all liquid standards. Record all steps in the preparation process
in the standards preparation book.
4.2 Spiking Standards
4.2.1 High level standard (HLS)Once stock standards have been prepared, they may be used in various combinations to
prepare spiking standards.
Given that all stock standards were prepared in the same solvent (ie. acetone), spiking
mixtures are prepared on a w/w basis.
• weigh a clean, dry 50 mL volumetric flask
• tare
8
• use a clean pasteur pipette to transfer ~ 1 mL of each pesticide stock to the flask and
record the weight. Re-tare between each pesticide addition
• after the addition of all pesticides calculate the new concentrations.
NOTE Do not make up to volume
4.2.2 Low level standard (LLS)A second, low level working stock is prepared by diluting the high level standard ~ 1/10:
• weigh a clean, dry 10 mL volumetric flask
• tare
• weigh accurately ~1g of high level standard into flask, record weight
• convert weight to volume based on specific gravity of acetone
• dilute to 10 mL with acetone, calculate new concentrations of each component
4.2.3 Matrix Working StandardsPrepare six working standards by spiking the high level and low level standards into MilliQ
water.
• add 400 mL of MilliQ to each of 6 x 500 mL glass separating funnels
• spike each separating funnel with volumes of HLS and LLS as described below:
Separating funnel Volume of
HLS (µL)
Volume of
LLS (µL)
Capacity (µL) of syringe used in
spiking procedure
1 1.6 10
2 6.0 10
3 1.6 10
4 13.5 25
5 50.0 100
6 150 250
9
• spike each separating funnel with the fenchlorphos surrogate spiking mix (5.6 µL)
• spiking is achieved using HPLC syringes of varying capacity (generally 50% greater than
the volume to be dispensed) using the “air-sandwich” technique (see 4.2.4)
• the matrix standards are extracted in the same manner as pesticide samples including the
addition of the 1-Cl-C14 internal standard, detailed in Section 5 (see 5.4).
• The amount of pesticide added to each matrix standard is determined and recorded in a
table that is referred to when calculating the actual concentration of pesticide in each
sample. Table 2 is an example of the composition of the matrix standards used in the
1995/6 season.
Table 2. Composition of pesticide matrix standards prepared for the1995/6 Irrigation season.
µµg pesticide / volume extracted (400 mL)
Pesticide Standard
1
Standard
2
Standard
3
Standard
4
Standard
5
Standard
6
atrazine 0.013 0.050 0.140 1.18 4.37 13.1
bensulfuron 0.012 0.044 0.125 0.980 3.90 11.7
bromacil 0.011 0.043 0.120 1.01 3.74 11.2
chlorpyrifos 0.013 0.050 0.140 1.19 4.39 13.2
cypermethrin 0.016 0.060 0.169 1.43 5.29 15.9
deltamethrin 0.014 0.052 0.147 1.24 4.61 13.8
dicofol 0.015 0.055 0.155 1.31 4.85 14.5
diuron 0.012 0.044 0.124 1.05 3.88 11.6
α-endosulfan 0.013 0.049 0.138 1.17 4.32 13.0
β-endosulfan 0.014 0.052 0.145 1.22 4.54 13.6
endosulfan-SO4 0.012 0.044 0.123 1.03 3.83 11.5
lambdacyhalothrin 0.017 0.065 0.184 1.55 5.75 17.3
malathion 0.018 0.067 0.188 1.59 5.89 17.7
metolachlor 0.014 0.054 0.151 1.28 4.73 14.2
molinate 0.013 0.050 0.140 1.18 4.38 13.1
simazine 0.016 0.061 0.196 1.10 5.00 14.7
thiobencarb 0.015 0.058 0.161 1.36 5.03 15.1
10
trifluralin 0.011 0.042 0.118 0.990 3.68 11.0
fenchlorphos 1.16 1.16 1.16 1.16 1.16 1.16
1-Cl-C14* 0.63 0.63 0.63 0.63 0.63 0.63
* added to final extract (see 5.4)
4.3 Air-Sandwich TechniqueTo ensure an accurate transfer of a given spiking solution into a water sample a HPLC
syringe and the air-sandwich technique are used. The air-sandwich technique involves
initially drawing ~1µL of air into the syringe followed by the required volume of spiking
solution, and finally another ~2 µL of air. Using this technique the entire volume of spiking
solution to be dispensed (including the volume in the syringe needle {~0.6 µL}) is visible in
the barrel of the syringe sandwiched between separate volumes of air. The volume of
spiking solution to be dispensed can be accurately determined by reading the scale on the
syringe barrel. The entire spiking solution is dispensed into the water by holding the syringe
needle below the water surface before pushing the plunger down. The volume of air behind
the spiking solution in the barrel of the syringe ensures that all liquid in the syringe needle is
also dispensed. After dispensing the spiking solution, the needle is kept below the surface
of the water and the syringe is rinsed 3 times with the water just spiked.
NOTE: To enable all of the spiking solution, plus adequate volumes of air both behind
and in front of the solvent to fit adequately into the syringe barrel, the capacity of the
syringe to be used for spiking purposes needs to be ~50% greater than the volume to be
dispensed.
5 Preparation of samples Dichloromethane (DCM) is the preferred solvent used in this extraction because it is not
miscible with water and extracts most organics (eg. pesticides) easily from water samples.
11
An added advantage of DCM is that it is more dense than water. Consequently, once phase
separation has occurred in the separation funnel the DCM layer is easily removed from the
bottom of the separating funnel leaving the aqueous sample behind for subsequent
extractions.
Prior to extraction, field samples are prepared as follows:
⇒ remove samples from cold storage and allow them to equilibrate to room temperature.
Thoroughly mix each sample and place 400 mL into a separating funnel (500 to 1000
mL capacity) using a measuring cylinder. Rinse the measuring cylinder between each
sample transfer with tap water and then pre-rinse with a small portion of the current
sample
⇒ ensure all relevant sample information is recorded in the extraction log book
⇒ add a volume (5.6 µL) of fenchlorphos (surrogate standard) into each sample using the
“air sandwich technique”(see 4.3). The container holding the fenchlorphos standard
should remain uncovered for as short a time as possible, and should be covered in
aluminium foil to reduce evaporation
⇒ clean the syringe between each sample by drawing acetone into the barrel 10 times and
dispensing it onto a tissue. The final volume of acetone is dispensed into a syringe
cleaner (SGE @200oC) attached to a vacuum pump, and the barrel is drawn in and out a
few times to ensure the syringe is clean.
5.1 First Extraction◊ Add ~40 mL of DCM to each sample.
12
◊ Briefly shake the separating funnel and inverted holding the stopper firmly in place.
Open the tap slowly to allow any pressure to be released.
◊ Commence the extraction procedure. NOTE: To ensure uniformity, all separating
funnels are inverted 1800 and given 3 quick shakes. This is repeated 30 times. The final
shake should be in a swirling manner with the funnel upright to ensure all solvent runs
down into the bottom of the separating funnel. While the separating funnel is upright,
remove the stopper briefly to allow any build up pressure to be released.
◊ Organic and aqueous phases are allowed to separate, the duration will vary depending
on the turbidity of the sample, eg for highly turbid samples it may be necessary to let the
samples sit overnight. The length of time required for phase separation is reduced with
each subsequent extraction. Once separation has occurred, the stopper is removed and
the bottom (organic) layer is allowed to run into a round bottom flask. Approximately 1
cm of emulsion is left in the separating funnel.
◊ Using a glass funnel, approximately 1 teaspoon of anhydrous sodium sulphate (Na2SO4)
is added to each round bottom flask. Shake the flask to dry the organic layer, if the
solvent is still “wet”, a second teaspoon of Na2SO4 may be added. “Wet” solvent can de
identified by a lack of free flowing Na2SO4.
◊ Filter the contents of the round bottom flasks through a funnel containing a glass wool
plug and a teaspoon of NaSO4 into evaporating tubes (see Figure 1 for an example of a
Zymark TURBOVAPTM evaporating tube{Cat. No. ZA7516}).
◊ Filter the contents of each round bottom flask through the funnel into the evaporating
tubes.
13
5.2 Second ExtractionThe steps outlined for the First Extraction are repeated, but the addition of Na2SO4 to the
glass funnel is omitted unless it is obvious that the sodium sulphate is totally wet.
5.3 Third ExtractionThe steps outlined for the First Extraction are repeated.
5.4 Concentration of extract “Sample Blow Down”♦ Turn on the Zymark TurboVapTM Evaporator P/N and allow to warm up.
♦ Turn on the nitrogen at the cylinder, and adjust the regulator until it reads 250 kPa.
♦ Place the evaporating tubes into the TurboVap and close the lid. Once the lid is closed,
a stream of nitrogen is delivered into each tube speeding up the evaporation process.
♦ Monitor the evaporation process and when the liquid fills the “nipple” section of the
evaporating tubes (see Figure 1) stop the evaporation process and remove the tube.
♦ Place evaporation tubes into the holding rack.
♦ Add a volume of 5.6 µL of 1-Cl-C14 to the extract using the “air sandwich” technique
(see 4.3).
♦ Transfer the spiked extract carefully to a 2 mL labelled glass vial using a pasteur pipette.
♦ Store extracts in the freezer.
14
Figure 1. Evaporating tubes (TurboVapTM) showing sample before andafter “blow down”.
Sample Before Sample After
Evaporation Evaporation
5.5 Glassware CleaningGlassware is initially rinsed in hot tap water and then soaked (for at least 2 h, but generally
overnight) in detergent. Glassware removed from the detergent bath is then thoroughly
rinsed in tap water and soaked in de-ionised water (for at least 2 h) followed by MilliQ
water rinsing and drying at 105 oC. Separating funnels are placed in their rack to drip dry.
Taps from separating funnels are wiped with acetone.
6 Analysis
6.1 GC-MSDSamples are analysed by GC-MSD using the Selective Ion Monitoring (SIM) mode. The
instrument used at Griffith laboratory of CSIRO Land and Water is a Hewlett Packard
15
5890 Series II gas chromatograph (analytical column HP-5 MS; 30 m x 0.25 mm, film 0.25
µm) coupled to a Hewlett Packard 5972 Mass Selective Detector. Chromatographic
conditions are: 2 µL injection (splitter off 1 min); injector temperature 200oC; column
temperature, 50oC (isocratic 1 min) ramped at 20oC min-1 to 160oC (isocratic 1 min),
ramped at 4oC min-1 to 190oC (isocratic 4 min) and ramped at 7oC to a final temperature of
250oC (isocratic 2 min).
Run all standards with the mass spectrometer in full scan mode to obtain a clean mass
spectrum of each compound and to establish their retention times. Choose the best target
and qualifying ions for multiple ion detection (MID) of each compound and set the
appropriate retention time windows as shown in Appendix 1. Run all standards again with
the mass spectrometer in MID mode to confirm that the correct parameters have been set.
See Appendix 5 for an example of a typical chromatogram of standards. Prior to analysis
of samples or standards, ensure that they are at room temperature. This is important as
some of the less soluble compounds could have dropped out of solution during storage in
the freezer.
6.2 CalculationsQuantification is based on the ratio of the fenchlorphos surrogate standard to the pesticide
of interest determined for the sample and the ratio of surrogate to the same pesticide
determined for the matrix standards (see Appendix 4 for malathion example). The 1-Cl-
C14 internal standard added to the extract just prior to analysis is used to monitor
fenchlorphos recovery. If the ratio of 1-Cl-C14 to fenchlorphos for any sample or standard
differs by more than 20% the extract of the sample should be repeated. Following the
successful analysis of a sample and standards the actual concentration of each pesticide
present can be determined. However, each peak should be examined prior to quantification
16
to check the retention times and the presence of characteristic ions at the expected ratios.
Once all peaks have been checked and integrated, generate a report detailing the “area
count” of each peak. This “area count” figure is listed as “Resp” in the table which appears
on the computer monitor. This figure is recorded in a table, an example of which is
presented in Appendix 2. This same process is repeated for the standards. These area
counts are then divided by the value recorded for fenchlorphos (the surrogate standard) and
recorded in a separate table (an example of which is Appendix 3). These values are then
transferred to a separate sheet for each pesticide, Appendix 4 presents Malathion as an
example. Sample and standard results are listed together with the volume of solution
extracted (usually 400 mL) and the area ratio to fenchlorphos. Values for the amount of
pesticide present in each of the standards are recorded in the “µg/vol” column (taken from
Table 2 as an example). To determine the concentration of pesticide in a given sample, the
area ratio of that sample is divided by the area ratio of one of the standards (preferably one
with a similar area ratio to fenchlorphos). This value is then multiplied by the “µg/vol”
value of the standard. To determine the concentration per litre, this value is divided by 0.4 -
the volume expressed in litres (see Appendix 4).
Concentrations of analytes outside of the linear range of the standards should not be
determined by extrapolation. If the concentration is too high, the extraction should be
repeated on an appropriately diluted sample. If the concentration is too low it should be
reported as <Limit Of Detection (LOD). However, if necessary concentrations below
LOD may be estimated by extrapolation and reported in parenthesis eg <LOD (0.02) to
indicate that they are semi quantitative.
17
6.3 Limit of Detection (LOD), Limit of Reporting (LOR), Precision,Accuracy
Establish the limit of LOD for each analyte by the repeated analysis (n≥5) of each
analyte spiked into matrix blanks at low levels. The lowest concentration giving a
signal to noise ratio of 3:1 and at which the identity of the analyte can be confirmed is
taken as the LOD. The LOR is generally set at a level of ~ 2-3 times LOD. Appendix
6 presents the LOR’s for the pesticides monitored in the 1995/96 Irrigation season.
The precision and accuracy of the method for each analyte is determined by the
repeated analysis (n≥10) of matrix blanks spiked at LOR concentrations. The mean
concentration of these analyses for each analyte is an indication of the accuracy of the
method, while precision is indicated by the associated variation of the mean (%cv).
Generally the mean concentration determined for an analyte at an LOR of 0.05 µg/L is
within 20% of the expected value.
ReferencesKorth, W., Thomas, M., Foster, S., McCorkelle, G., and Bowmer, K.H. (1995a).
Toxicity of Rice and Maize Pesticides to Ceriodaphnia sp.: Implications for
Management of Irrigation Drainage Water in Australia. Australasian Journal of
Ecotoxicology. 1, 55-62.
Korth, W., Thomas, M., McCorkelle, G and Foster, S. (1995b). Pesticide and Toxicity
Testing of MIA Drainage Water (5 October to 30 November, 1994). CSIRO
Division of Water Resources, Griffith Laboratory, Consultancy Report No. 95/25.
18
AcknowledgmentsThe outstanding technical assistance of the following people is gratefully acknowledged:
Rhonda Smith, Sue Korth, Martin Thomas, John Korth (University of Wollongong) and
Cheryl Orr. Many thanks to Jane Roberts for proof reading this document.
A p p e n d i x 1
G C - M S M e t h o d F i l e
TOPLEVEL PARAMETERS
Method Information For: C:\HPCHEM\1\METHODS\PESTSIM.M
Method Sections To Run:
(x) Save Copy of Method With Data( ) Pre-Run Cmd/Macro =(X) Data Acquisition(X) Data Analysis( ) Post-Run Cmd/Macro =
Method Comments:Organophosphorus pesticides (SIM)
END OF TOPLEVEL PARAMETERS---------------------------
ACQUISITION PARAMETERS
General Information
InletTune FileAcquisition Mode
MS Information
Solvent Delay
EM AbsoluteEMV OffsetResulting Voltage
[Sim Parameters]
GROUP 1Group IDDwell Per IonLow ResolutionGroup Start TimePlot 1 IonIons In Group
GROUP 2
: GC: MAXTUNE.U: Sim
: 3.00 min
: False: 0.0: 2023.5
: methomyl b/d 1+: 60 msec.: Yes: 3.50: 105.00: 58.00 71.00 88.00 105.00
Method: PESTSIM.M
19
Group ID : dichlorvos,BEN1Dwell Per Ion : 40 msec.Low Resolution : YesGroup Start Time : 5.90Plot 1 Ion : 109.00Ions In Group :109.00 145.00 185.00 180.00 181.00
151.00
GROUP 3Group ID : diuron,BEN2Dwell Per Ion : 40 msec.Low Resolution : YesGroup Start Time : 6.50Plot 1 Ion : 186.70Ions In Group :159.00 186.70 189.00 154.00 155.00
68.00
GROUP 4Group ID : molinate,methomDwell Per Ion : 40 msec.Low Resolution : YesGroup Start Time : 8.00Plot 1 Ion : 125.90Ions In Group : 98.00 125.90 187.00 58.00 105.00
88.00
GROUP 5Group ID : dicambaDwell Per Ion : 60 msec.Low Resolution : YesGroup Start Time : 10.10Plot 1 Ion : 173.00Ions In Group :173.00 175.00 220.00 222.00
GROUP 6Group ID : 1-Cl-C14Dwell Per Ion : 60 msec.Low Resolution : YesGroup Start Time : 11.90Plot 1 Ion : 91.00Ions In Group : 91.00 93.00 97.00 105.00
GROUP 7Group ID : Monocr, triflu,Dwell Per Ion : 30 msec.Low Resolution : YesGroup Start Time : 12.15Plot 1 Ion : 90.90Ions In Group :127.00 192.00 193.00 306.00 264.00
290.00 90.90 93.00 97.00
GROUP 8Group ID : atraz,simazDwell Per Ion : 50 msec.Low Resolution : YesGroup Start Time : 13.40Plot 1 Ion : 199.90Ions In Group :199.90 201.00 202.00 217.00 215.00
Method: PESTSIM.M Mon Apr 21 11:26:55 1997
GROUP 9Group ID : TerbufosDwell Per Ion : 60 msec.Low Resolution : YesGroup Start Time : 14.00Plot 1 Ion : 231.00Ions In Group : 97.00 153.00 231.00 288.00
GROUP 10Group ID : DiazinonDwell Per Ion : 60 msec.Low Resolution : YesGroup Start Time : 15.10Plot 1 Ion : 137.00Ions In Group :137.00 179.00 199.00 304.00
GROUP 11Group IDDwell Per Ion
: fenchlor, propa: 60 msec.
Low Resolution : YesGroup Start Time : 17.00Plot 1 Ion : 284.70Ions In Group :125.00 284.70 287.00 161.00 163.00
217.00
GROUP 12Group ID : bromac, thioDwell Per Ion : 50 msec.Low Resolution : YesGroup Start Time : 19.15Plot 1 Ion : 257.00Ions In Group :257.00 125.00 127.00 188.00 190.00
100.00
GROUP 13Group ID : linuron,mal,meDwell Per Ion : 30 msec.Low Resolution : YesGroup Start Time : 19.40Plot 1 Ion : 173.00Ions In Group :173.00 146.00 238.00 162.00 248.00
160.00 61.00 125.00 127.00
GROUP 14Group ID : chlorpyrifosDwell Per Ion : 70 msec.Low Resolution : YesGroup Start Time : 19.90Plot 1 Ion : 196.70Ions In Group :196.70 199.00 314.00
GROUP 15Group ID : endol,methidatDwell Per Ion : 40 msec.Low Resolution : YesGroup Start Time : 22.50Plot 1 Ion : 170.00Ions In Group :170.00 195.00 237.00 241.00 85.00
125.00 145.00 302.00
Method: PESTSIM.M Mon Apr 21 11:26:55 1997
21
GROUP 16Group ID : PRO,Dwell Per Ion
DDE,DIEL: 30 msec.
Low Resolution : YesGroup Start Time : 24.00Plot 1 Ion : 139.00Ions In Group :139.00 97.00 208.00 246.00 176.00
318.00 79.00 108.00 263.00
GROUP 17Group ID : endo2,FluazDwell Per Ion : 40 msec.Low Resolution : YesGroup Start Time : 25.15Plot 1 Ion : 170.00Ions In Group :170.00 195.00 146.00 254.00 282.00
237.00
GROUP 18Group ID : endo sulfateDwell Per Ion : 60 msec.Low Resolution : YesGroup Start Time : 26.60Plot 1 Ion : 229.00Ions In Group :229.00 272.00 274.00 387.00
GROUP 19Group ID : bifen, dicofolDwell Per Ion : 40 msec.Low Resolution : YesGroup Start Time : 28.00Plot 1 Ion : 181.00Ions In Group :181.00 166.00 165.00 139.00 111.00
251.00
GROUP 20Group ID : L-CyhalomethrinDwell Per Ion : 60 msec.Low Resolution : YesGroup Start Time : 29.00Plot 1 Ion : 181.00Ions In Group :181.00 197.00 208.00 449.00
GROUP 21Group ID : cypermethrinsDwell Per Ion : 70 msec.Low Resolution : YesGroup Start Time : 31.00Plot 1 Ion : 181.00Ions In Group :163.00 181.00 209.00
GROUP 22Group ID : Delta-MethrinDwell Per Ion : 40 msec.Low Resolution : YesGroup Start Time : 33.00Plot 1 Ion : 180.80Ions In Group :180.80 297.00 174.00 172.00 93.00
Method: PESTSIM.M Mon Apr 21 11:26:55 1997
22
91.00
[Real Time Plot Parameters]
Time Window : 14 minIconize Real Time Display : TruePlot 1 type : Single ionScale minimum : 0Scale maximum : 2000000Plot 2 type : No plot
GC Inlet Information-- ----- -----------
[Inlet A Temperature Program Information]
Oven Track : OffInitial Temp. : 250 CInitial Time : 480.00 min
Level Rate (C/min) Final Temp. (C) Final Time (min)1 0
Total Program Time: 480.00 min
[Inlet B Temperature Program Information]
Oven Track : OffInitial Temp. : 200 CInitial Time : 480.00 min
Level Rate (C/min) Final Temp. (C) Final Time (min)1 0
Total Program Time: 480.00 min
[Inlet A Pressure Program Information]
Constant Flow : OffInitial Pres. : 83 kPaInitial Time : 480.00 min
Level Rate(kPa/min) Final Pres.(kPa) Final Time (min)1 0
Total Program Time: 480.00 minPressure Units : kPa
[Inlet A Flow Settings]
Column length 25.00 m:Column diameter : 0.220 mmGas : HeVacuum compensation : OnPressure : 21 kPaFlow : 0.5 ml/minLinear velocity : 26.7 cm/sec
Method: PESTSIM.M Mon Apr 21 11:26:55 1997
23
Split flowSplit ratio
: 30 ml/min: 66.3
[Inlet B Pressure Program Information]
Constant Flow : OffInitial Pres. : 21 kPaInitial Time : 480.00 min
Level Rate(kPa/min) Final Pres.(kPa)1 0
Final Time (min)
Total Program Time: 480.00 minPressure Units : kPa
[Inlet B Flow Settings]
Column length : 30.00 mColumn diameter : 0.530 mmGas : HeVacuum compensation : OnPressure : 0 kPaFlow : 0.0 ml/minLinear velocity : 0.0 cm/sec
[Auxiliary Channel C Information]
Comment:
Pressure Program:Initial Pres. : 0 kPaInitial Time : 480.00 min
Level Rate(kPa/min) Final Pres.(kPa) Final Time (min)1 0
Total Program Time: 480.00 min
[Auxiliary Channel D Information]
Comment:
Pressure Program:Initial Pres. : 0 kPaInitial Time : 480.00 min
Level Rate(kPa/min) Final Pres.(kPa) Final Time (min)1 0
Total Program Time: 480.00 min
[Auxiliary Channel E Information]
Comment:
Method: PESTSIM.M Mon Apr 21 11:26:55 1997
24
Pressure Program:Initial Pres. : 0 kPaInitial Time : 480.00 min
Level Rate(kPa/min) Final Pres.(kPa) 1 0
Total Program Time: 480.00 min
Final Time (min)
[Auxiliary Channel F Information]
Comment:
Pressure Program:Initial Pres. : 0 kPaInitial Time : 480.00 min
Level Rate(kPa/min) Final Pres.(kPa1 0
Total Program Time: 480.00 min
) Final Time (min)
GC Temperature Information-- ----------- -----------
[GC Zone Temperatures]
Inj. A : 250 CInj. B : 200 CDet. A : 50 C OffDet. B : 290 CAux. : 290 C
[Oven Parameters]
Oven Equib Time : 0.50 minOven Max : 325 COven : OnCryo : OffAmbient : 25 CCryo Blast : Off
[Oven Program]
Initial Temp. : 50 CInitial Time : 1.00 min
Level Rate (C/min) Final Temp. (C) Final Time (min)1 20.00 150 1.002 3.00 190 1.003 10.00 310 3.00
Next Run Time : 36.33 min
Method: PESTSIM.M Mon Apr 21 11:26:55 1997
25
Injector Information-------- -----------
Injection Source : AutoInjection Location : Front
Sample Washes : 1Sample Pumps : 2Sample Volume : 2 stop(s)Viscosity Delay : 1 secSolvent A Washes : 5Solvent B Washes : 5On Column : No
[Purge Information]
Purge A/B Init. Value On Time Off TimeA Off 1.00 0.00B Off 1.00 0.00
END OF ACQUISITION PARAMETERS
Method Name: C:\HPCHEM\1\METHODS\PESTSIM.M
DATA ANALYSIS PARAMETERS-------------------------
Percent Report Settings-----------------------
Sort By: Retention Time
Output DestinationScreen: NoPrinter: YesFile: No
Integration Events: Meth Default
Generate Report During Run Method: No
Signal Correlation Window: 0.020
Qualitative Report Settings---------------------------
Peak Location of Unknown: Apex
Method: PESTSIM.M Mon Apr 21 11:26:55 1997
26
Library to Searchnbs75k
Minimum Quality0
Integration Events: Meth Default
Report Type: Summary
Output DestinationScreen: NoPrinter: YesFile: No
Generate Report During Run Method: No
Quantitative Report Settings-----------------------------
Report Type: Detailed (text only)
Output DestinationScreen: YesPrinter: NoFile: No
Generate Report During Run Method.. Yes
pesticidesCalibration Last Updated: Mon May 27 08:49:51 1996
Reference Window: 10.00 PercentNon-Reference Window: 5.00 PercentCorrelation Window: 0.02 minutesDefault Multiplier: 1.00Default Sample Concentration: 0.00
Compound Information--------------------
------------------------------------------------------------
1) Methomyl b/d 2 ( )
Ret. Time 3.78 min., Extract & Integrate from 3.28 to 4.28 min.
Signal Rel Resp. Pct. Unc.(rel) IntegrationTgt 105.00 *** METH DEFAULT ***Q1 58.00 120.00 20.0 *** METH DEFAULT ***Q2 88.00 40.00 20.0 *** METH DEFAULT ***Q3 71.00 10.00 20.0 *** METH DEFAULT ***
Lvl ID Conc ( ) Response1 not used for this compound2 not used for this compound3 not used for this compound4 not used for this compound
Method: PESTSIM.M Mon Apr 21 11:26:55 1997
27
5 not used for this compound
Qualifier Peak Analysis ONCurve Fit: Quadratic----------------------------------------------------------------------------
2) Methomyl b/d 1 ( )
Ret. Time 4.92 min., Extract & Integrate from 4.42 to 5.42 min.
Signal Rel Resp. Pct. Unc.(rel)Tgt 105.00
Integration*** METH DEFAULT ***
Ql 58.00 100.00 20.0 *** METH DEFAULT ***Q2 88.00 40.00 20.0 *** METH DEFAULT ***Q3 71.00 10.00 20.0 *** METH DEFAULT ***
Lvl ID Conc ( ) Response1 not used for this compound2 not used for this compound3 not used for this compound4 not used for this compound5 not used for this compound
Qualifier Peak Analysis ONCurve Fit: Quadratic------------------- ---------------------------------------------------------
3) Diuron ( )
Ret. Time 6.74 min., Extract & Integrate from 6.24 to 7.24 min.
Signal Rel Resp. Pct. Unc.(rel) IntegrationTgt 186.90 *** METH DEFAULT ***Ql 189.00 98.20 20.0 *** METH DEFAULT ***Q2 159.00 50.40 20.0 *** METH DEFAULT ***
Lvl ID Conc ( ) Response1 0.770 543402 1.790 1593763 4.280 3006024 8.530 4973925 20.980 1047873
Qualifier Peak Analysis ONCurve Fit: Linear----------------------------------------------------------------------------
4) Bensulfuron b/d ( )
Ret. Time 6.91 min., Extract & Integrate from 6.41 to 7.41 min.
Signal Rel Resp. Pct. Unc.(rel) IntegrationTgt 154.00 *** METH DEFAULT ***Ql 155.00 83.00 20.0 *** METH DEFAULT ***Q2 68.00 90.00 20.0 *** METH DEFAULT ***Q3 187.00 0.40 20.0 *** METH DEFAULT ***
Lvl ID Conc ( ) Response1 not used for this compound
Method: PESTSIM.M Mon Apr 21 11:26:55 1997
28
2 not used for this compound3 not used for this compound4 not used for this compound5 not used for this compound
Qualifier Peak Analysis ONCurve Fit: Quadratic-------------------------------------------------------------------------
5) Molinate ( )
Ret. Time 9.56 min., Extract & Integrate from 9.06 to 10.06 min.
Signal Rel Resp. Pct. Unc.(rel) IntegrationTgt 125.90 *** METH DEFAULT ***Ql 187.00 16.50 20.0 *** METH DEFAULT ***Q2 98.00 14.20 20.0 *** METH DEFAULT ***
Lvl ID Conc ( ) Response1 0.870 1523412 2.020 4234063 4.800 9025314 9.600 14836385 23.600 4755734
Qualifier Peak Analysis ONCurve Fit: Linear----------------------------------------------------------------------------
6 ) Methomyl ( )
Ret. Time 10.13 min., Extract & Integrate from 9.63 to 10.63 min.
Signal Rel Resp. Pct. Unc.(rel) IntegrationTgt 105.00 *** METH DEFAULT ***Q1 58.00 95.00 20.0 *** METH DEFAULT ***Q2 88.00 40.00 20.0 *** METH DEFAULT ***Q3 162.00 3.00 20.0 *** METH DEFAULT ***
Lvl ID Conc ( ) Response1 not used for this compound2 not used for this compound3 not used for this compound4 not used for this compound5 not used for this compound
Qualifier Peak Analysis ONCurve Fit: Quadratic----------------------------------------------------------------------------
7) Dicamba ( )
Ret. Time 10.25 min., Extract & Integrate from 9.75 to 10.75 min.
Signal Rel Resp. Pct. Unc.(rel) IntegrationTgt 173.00 *** METH DEFAULT ***Q1 175.00 80.00 20.0 *** METH DEFAULT ***Q2 220.00 80.00 20.0 *** METH DEFAULT ***Q3 222.00 50.00 20.0 *** METH DEFAULT ***
Method: PESTSIM.M Mon Apr 21 11:26:55 1997
29
Lvl ID Conc ( ) Response1 not used for this compound2 not used for this compound3 not used for this compound4 not used for this compound5 not used for this compound
Qualifier Peak Analysis ONCurve Fit: Quadratic----------------------------------------------------------------------------
12.51 min
8 ) 1-Chlorotetradecane ( )
Ret. Time 12.01 min., Extract & Integrate from 11.51 to
Signal Rel Resp. Pct. Unc.(rel) IntegrationTgt 90.90 *** METH DEFAULTQl 93.00 34.20 20.0 *** METH DEFAULTQ2 97.00 20.60 20.0 *** METH DEFAULT
Lvl ID Conc ( ) Response1 1.200 14780112 1.200 1955613 1.200 1644414 1.200 1284025 1.200 187341
Qualifier Peak Analysis ONCurve Fit: Linear
*********
9) trifluralin ( )
Ret. Time 12.26 min., Extract & Integrate from 11.76 to 12.76 min.
Signal Rel Resp. Pct. Unc.(rel) IntegrationTgt 306.00 *** METH DEFAULT ***Q1 264.00 94.30 20.0 *** METH DEFAULT ***Q2 290.00 23.10 20.0 *** METH DEFAULT ***
Lvl ID Conc ( ) Response1 not used for this compound2 not used for this compound3 not used for this compound4 not used for this compound5 not used for this compound
Qualifier Peak Analysis ONCurve Fit: Quadratic----------------------------------------------------------------------------
10) Monocrotophos ( )
Ret. Time 12.47 min., Extract & Integrate from 11.97 to 12.97 min.
Signal Rel Resp. Pct. Unc.(rel) IntegrationTgt 127.00 *** METH DEFAULT ***Q1 192.00 15.00 20.0 *** METH DEFAULT ***
Method: PESTSIM.M Mon Apr 21 11:26:55 1997
30
Signal Rel Resp. Pct. Unc.(rel) IntegrationTgt 231.00 *** METH DEFAULT ***Q1 97.00 50.00 20.0 *** METH DEFAULT ***Q2 153.00 45.00 20.0 *** METH DEFAULT ***Q3 288.00 10.00 20.0 *** METH DEFAULT ***
Lvl ID Conc ( ) Response1 not used for this compound2 not used for this compound3 not used for this compound4 not used for this compound5 not used for this compound
Qualifier Peak Analysis ONCurve Fit: Quadratic----------------------------------------------------------------------------
14) Diazinon ( )
Ret. Time 15.23 min., Extract & Integrate from 14.73 to
Signal Rel Resp. Pct. Unc.(rel) Integration
15.73 min.
Tgt 137.00 *** METH DEFAULT ***Ql 179.00 75.00 20.0 *** METH DEFAULT ***Q2 199.00 60.00 20.0 *** METH DEFAULT ***Q3 304.00 50.00 20.0 *** METH DEFAULT ***
Lvl ID Conc ( ) Response1 not used for this compound2 not used for this compound3 not used for this compound4 not used for this compound5 not used for this compound
Qualifier Peak Analysis ONCurve Fit: Quadratic
15) propanil ( )
Ret. Time 17.23 min., Extract & Integrate from 16.73 to 17.73 min.
Signal Rel Resp. Pct. Unc.(rel) IntegrationTgt 161.00 *** METH DEFAULT ***Ql 163.00 70.00 20.0 *** METH DEFAULT ***Q2 217.00 30.00 20.0 *** METH DEFAULT ***
Lvl ID Conc ( ) Response1 not used for this compound2 not used for this compound3 not used for this compound4 not used for this compound5 not used for this compound
Qualifier Peak Analysis ONCurve Fit: Quadratic-----------------------------------------------------------------------------------
16) Fenchlorphos
Method: PESTSIM.M Mon Apr 21
(ISTD)
11:26:55 1997
31
Ret. Time 18.02 min., Extract & Integrate from 17.52 to 18.52 min.
Signal Rel Resp. Pct. Unc.(rel) IntegrationTgt 284.70 *** METH DEFAULT ***Ql 287.00 84.90 20.0 *** METH DEFAULT ***Q2 125.00 112.10 20.0 *** METH DEFAULT ***
Lvl ID Conc ( ) Response1 1.260 1267022 1.260 1754253 1.260 1578934 1.260 1254115 1.260 157401
Qualifier Peak Analysis ON ISTD conc: 0.000Curve Fit: Linear--------------------------------------------------------------------
17) Linuron ( )
Ret. Time 19.43 min., Extract & Integrate from 18.93 to 19.93 min.
Signal Rel Resp. Pct. Unc.(rel) IntegrationTgt 248.00 *** METH DEFAULT ***Q1 160.00 100.00 20.0 *** METH DEFAULT ***Q2 61.00 1000.00 20.0 *** METH DEFAULT ***
Lvl ID Conc ( ) Response1 not used for this compound2 not used for this compound3 not used for this compound4 not used for this compound5 not used for this compound
Qualifier Peak Analysis ONCurve Fit: Quadratic--------------------------------------------------------------------------
18) Bromacil ( )
Ret. Time 19.25 min., Extract & Integrate from 18.75 to 19.75 min.
Signal Rel Resp. Pct. Unc.(rel) IntegrationTgt 190.00 *** METH DEFAULT ***Q1 188.00 100.00 20.0 *** METH DEFAULT ***
Lvl ID Conc ( ) Response1 1.110 150672 2.580 498443 6.150 1070644 12.250 1763325 27.700 605796
Qualifier Peak Analysis ONCurve Fit: Linear----------------------------------------------------------------------------
19) Thiobencarb ( )
Method: P E S T S IM.M Mon Apr 21 11:26:55 1997
32
Ret. Time 19.34 min., Extract & Integrate from 18.84 to 19.84 min.
Signal Rel Resp. Pct. Unc.(rel) IntegrationTgt 257.00 *** METH DEFAULT ***Ql 125.00 265.00 20.0 *** METH DEFAULT ***Q2 127.00 110.00 20.0 *** METH DEFAULT ***Q3 257.00 1200.00 20.0 *** METH DEFAULT ***
Lvl ID Conc ( ) Response1 0.510 1407932 1.450 5235053 3.170 9800474 6.150 15153715 16.000 5809845
Qualifier Peak Analysis ONCurve Fit: Linear----------------------------------------------------------------------
20) Malathion ( )
Ret. Time 19.60 min., Extract & Integrate from 19.10 to 20.10 min.
Signal Rel Resp. Pct. Unc.(rel) IntegrationTgt 172.90 *** METH DEFAULT ***Q1 125.00 150.50 20.0 *** METH DEFAULT ***Q2 127.00 136.80 20.0 *** METH DEFAULT ***
Lvl ID Conc ( ) Response1 1.350 964312 3.140 3154543 7.480 6768294 14.900 11069695 36.700 3844661
Qualifier Peak Analysis ONCurve Fit: Linear-----------------------------------------------------------------------------
21) Metolachlor ( )
Ret. Time 19.66 min., Extract & Integrate from 19.16 to 20.16 min.
Signal Rel Resp. Pct. Unc.(rel) IntegrationTgt 162.00 *** METH DEFAULT ***Q1 238.00 42.00 20.0 *** METH DEFAULT ***Q2 146.00 14.00 20.0 *** METH DEFAULT ***
Lvl ID Conc ( ) Response1 0.550 796222 1.570 3412213 3.430 7055404 6.670 12246375 17.300 5223449
Qualifier Peak Analysis ONCurve Fit: Linear-----------------------------------------------------------------------------
Method : PESTSIM.M Mon Apr 21 11:26:55 1997
33
22) Chlorpyrifos ( )
Ret. Time 19.99 min., Extract & Integrate from 19.49 to 20.49 min.
Signal Rel Resp. Pct. Unc.(rel) IntegrationTgt 196.70 *** METH DEFAULT ***Ql 199.00 119.50 20.0 *** METH DEFAULT ***Q2 314.00 54.20 20.0 *** METH DEFAULT ***
Lvl ID Conc ( ) Response1 0.670 321942 1.550 966583 3.690 2189184 7.360 3614965 18.100 1110307
Qualifier Peak Analysis ONCurve Fit: Linear----------------------------------------------------------------------------
23) Methidathion ( )
Ret. Time 22.68 min., Extract & Integrate from 22.18 to 23.18 min.
Signal Rel Resp. Pct. Unc.(rel) IntegrationTgt 145.00 *** METH DEFAULT ***Ql 85.00 80.00 20.0 *** METH DEFAULT ***Q2 125.00 20.00 20.0 *** METH DEFAULT ***Q3 302.00 5.00 20.0 *** METH DEFAULT ***
Lvl ID Conc ( ) Response1 not used for this compound2 not used for this compound3 not used for this compound4 not used for this compound5 not used for this compound
Qualifier Peak Analysis ONCurve Fit: Quadratic----------------------------------------------------------------------------
24) endosulfan I ( )
Ret. Time 23.23 min., Extract & Integrate from 22.73 to 23.73 min.
Signal Rel Resp. Pct. Unc.(rel) IntegrationTgt 195.00 *** METH DEFAULT ***Ql 237.00 81.30 20.0 *** METH DEFAULT ***Q2 241.00 84.10 20.0 *** METH DEFAULT ***Q3 170.00 91.00 20.0 *** METH DEFAULT ***
Lvl ID Conc ( ) Response1 not used for this compound2 not used for this compound3 not used for this compound4 not used for this compound5 not used for this compound
Method: PESTSIM.M Mon Apr 21 11:26:55 1997
34
Qualifier Peak Analysis ONCurve Fit: Quadratic--------------------------------------------------------------------------------------
25) Profenofos ( )
Ret. Time 24.19 min., Extract & Integrate from 23.69 to 24.69 min.
Signal Rel Resp. Pct. Unc.(rel) IntegrationTgt 139.00 *** METH DEFAULT ***Ql 97.00 95.00 20.0 *** METH DEFAULT ***Q2 208.00 60.00 20.0 *** METH DEFAULT ***
Lvl ID Conc ( ) Response1 not used for this compound2 not used for this compound3 not used for this compound4 not used for this compound5 not used for this compound
Qualifier Peak Analysis ONCurve Fit: Quadratic------------------------------------------------------------------------------
26) Dieldrin ( )
Ret. Time 24.33 min., Extract & Integrate from 23.83 to 24.83 min.
Signal Rel Resp. Pct. Unc.(rel) IntegrationTgt 79.00 *** METH DEFAULT ***Ql 108.00 15.00 20.0 *** METH DEFAULT ***Q2 263.00 10.00 20.0 *** METH DEFAULT ***
Lvl ID Conc ( ) Response1 not used for this compound2 not used for this compound3 not used for this compound4 not used for this compound5 not used for this compound
Qualifier Peak Analysis ONCurve Fit: Quadratic-------------------------------------------------------------------------------
27) DDE ( )
Ret. Time 24.42 min., Extract & Integrate from 23.92 to 24.92 min.
Signal Rel Resp. Pct. Unc.(rel) IntegrationTgt 246.00 *** METH DEFAULT ***Ql 176.00 50.00 20.0 *** METH DEFAULT ***Q2 318.00 55.00 20.0 *** METH DEFAULT ***
Lvl ID Conc ( ) Response1 not used for this compound2 not used for this compound3 not used for this compound4 not used for this compound5 not used for this compound
Method: PESTSIM.M Mon Apr 21 11:26:55 1997
36
Qualifier Peak Analysis ONCurve Fit: Quadratic-----------------------------------------------------------------------------------
28) Fluazifop ( )
Ret. Time 25.25 min., Extract & Integrate from 24.75 to 25.75 min.
Signal Rel Resp. Pct. Unc.(rel) IntegrationTgt 282.00 *** METH DEFAULT ***Q1 254.00 60.00 20.0 *** METH DEFAULT ***Q2 146.00 45.00 20.0 *** METH DEFAULT ***
Lvl ID Conc ( ) Response1 not used for this compound2 not used for this compound3 not used for this compound4 not used for this compound5 not used for this compound
Qualifier Peak Analysis ONCurve Fit: Quadratic-----------------------------------------------------------------------------
29) endosulfan II ( )
Ret. Time 25.39 min., Extract & Integrate from 24.89 to 25.89 min.
Signal Rel Resp. Pct. Unc.(rel) IntegrationTgt 195.00 *** METH DEFAULT ***Ql 170.00 74.20 20.0 *** METH DEFAULT ***Q2 237.00 70.70 20.0 *** METH DEFAULT ***
Lvl ID Conc ( ) Response1 not used for this compound2 not used for this compound3 not used for this compound4 not used for this compound5 not used for this compound
Qualifier Peak Analysis ONCurve Fit: Quadratic----------------------------------------------------------------------------
30) endosulfan sulfate ( )
Ret. Time 26.71 min., Extract & Integrate from 26.21 to 27.21 min.
Signal Rel Resp. Pct. Unc.(rel) IntegrationTgt 272.00 *** METH DEFAULT ***Ql 229.00 71.90 20.0 *** METH DEFAULT ***Q2 274.00 79.00 20.0 *** METH DEFAULT ***Q3 387.00 28.60 20.0 *** METH DEFAULT ***
Lvl ID Conc ( ) Response1 not used for this compound2 not used for this compound3 not used for this compound
Method: PESTSIM.M Mon Apr 21 11:26:55 1997
37
45
not used for this compoundnot used for this compound
Qualifier Peak Analysis ONCurve Fit: Quadratic-----------------------------------------------------------------------------
31) Bifenthrin ( )
Ret. Time 28.18 min., Extract & Integrate from 27.68 to 28.68 min.
Signal Rel Resp. Pct. Unc.(rel) IntegrationTgt 181.00 *** METH DEFAULT ***Ql 166.00 0.00 20.0 *** METH DEFAULT ***Q2 165.00 0.00 20.0 *** METH DEFAULT ***
Lvl ID Conc ( ) Response1 not used for this compound2 not used for this compound3 not used for this compound4 not used for this compound5 not used for this compound
Qualifier Peak Analysis ONCurve Fit: Quadratic------------------------------------------------------------------------------
32) Dicofol ( )
Ret. Time 28.38 min., Extract & Integrate from 27.88 to 28.88 min.
Signal Rel Resp. Pct. Unc.(rel) IntegrationTgt 139.00 *** METH DEFAULT ***Ql 111.00 40.00 2 0 . 0 *** METH DEFAULT ***Q2 251.00 75.00 2 0 . 0 *** METH DEFAULT ***
Lvl ID Conc ( ) Response1 not used for this compound2 not used for this compound3 not used for this compound4 not used for this compound5 not used for this compound
Qualifier Peak Analysis ONCurve Fit: Quadratic----------------------------------------------------------------------------
33) Lambda-Cyhalomethrin ( )
Ret. Time 29.63 min., Extract & Integrate from 29.13 to 30.13 min.
Signal Rel Resp. Pct. Unc.(rel) IntegrationTgt 181.00 *** METH DEFAULT ***Ql 197.00 90.00 2 0 . 0 *** METH DEFAULT ***Q2 208.00 60.00 2 0 . 0 *** METH DEFAULT ***Q3 449.00 10.00 2 0 . 0 *** METH DEFAULT ***
Lvl ID Conc ( ) Response1 not used for this compound
Method: PESTSIM.M Mon Apr 21 11:26:55 1997
38
2 not used for this compound3 not used for this compound4 not used for this compound5 not used for this compound
Qualifier Peak Analysis ONCurve Fit: Quadratic----------------------------------------------------------------------------
34) cypermethrin ( )
Ret. Time 31.57 min., Extract & Integrate from 31.07 to 32.07 min.
Signal Rel Resp. Pct. Unc.(rel) IntegrationTgt 163.00 *** METH DEFAULT ***Ql 181.00 68.30 20.0 *** METH DEFAULT ***Q2 209.00 25.60 20.0 *** METH DEFAULT ***
Lvl ID Conc ( ) Response1 not used for this compound2 not used for this compound3 not used for this compound4 not used for this compound5 not used for this compound
Qualifier Peak Analysis ONCurve Fit: Quadratic----------------------------------------------------------------------------
35) Delta-Methrin ( )
Ret. Time 33.23 min., Extract & Integrate from 32.73 to 33.73 min.
Signal Rel Resp. Pct. Unc.(rel) IntegrationTgt 181.00 *** METH DEFAULT ***Ql 209.00 40.00 20.0 *** METH DEFAULT ***Q2 253.00 80.00 20.0 *** METH DEFAULT ***Q3 172.00 30.00 20.0 *** METH DEFAULT ***
Lvl ID Conc ( ) Response1 not used for this compound2 not used for this compound3 not used for this compound4 not used for this compound5 not used for this compound
Qualifier Peak Analysis ONCurve Fit: Quadratic----------------------------------------------------------------------------
END OF DATA ANALYSIS PARAMETERS-------------------------------
Method: PESTSIM.M Mon Apr 21 11:26:55 1997
39
40
Appendix 2. Table used to record area count values from the GC-MS (MID) trace.
Area count:
SAMPLE ID LU 13 LUG 13 LU 14 LUG 14 LD 13 LD 14 STD 2 STD 3 STD 4 STD 5 LM 13 LM 14FILE NAME EUW 700 EUW 701 EUW 702 EUW 703 EUW 704 EUW 705 EUW 706 EUW 707 EUW 708 EUW 709 EUW 710 EUW 711diuron b/d 5392 1447 2747 7052 2699 2017 167 735 7272 18049 3871 1806bensulfuronmolinate 57967 14067 21378 43366 27737 29738 1122 4663 42270 101492 31878 147061-Cl-C14* 44497 27973 29528 27399 23081 29626 13603 18174 23010 11186 28836 28928trifluralinsimazine 9703 1627 3589 9947 8469 3245 327 1632 12031 34007 10983 2143atrazine 140 59 90 102 90 69 449 2029 19584 114 80fenchlorphos** 40720 26392 27584 24794 22650 28305 11332 16067 16688 9503 26995 28053bromacil 832 36 471 1861 566 258 117 1810 5338 773 329thiobencarbmalathion 2214 1556 754 3557 484 699 406 1729 19727 516 581metolachlorchlorpyrifosα-endosulfanβ-endosulfanendosulfan-SO4dicofollambda-cyhalothrincypermethrin(variousisomers)deltamethrin
* internal standard** surrogate/internal standard
41
Appendix 3. Table used to express area ratio of analytes detected to fenchlorfos.
Area ratio to fenchlorphos:
SAMPLE ID LU 13 LUG 13 LU 14 LUG 14 LD 13 LD 14 STD 2 STD 3 STD 4 STD 5 LM 13 LM 14FILE NAME EUW 700 EUW 701 EUW 702 EUW 703 EUW 704 EUW 705 EUW 706 EUW 707 EUW 708 EUW 709 EUW 710 EUW 711diuron b/d 0.132 0.055 0.10 0.284 0.119 0.071 0.0147 0.046 0.436 1.9 0.14 0.064bensulfuronmolinate 1.42 0.533 0.775 1.75 1.22 1.05 0.099 0.29 2.53 10.68 1.18 0.521-Cl-C14* 1.1 1.06 1.07 1.10 1.01 1.05 1.2 1.13 1.38 1.18 1.07 1.03trifluralinsimazine 0.238 0.062 0.130 0.40 0.374 0.115 0.029 0.10 0.72 3.58 0.406 0.086atrazine 0.003 0.002 0.003 0.004 0.004 0.002 0.040 0.126 0.004 0.003fenchlorphos**bromacil 0.020 0.0014 0.017 0.075 0.025 0.009 0.007 0.108 0.56 0.029 0.0117thiobencarbmalathion 0.054 0.059 0.027 0.143 0.021 0.025 0.036 0.108 1.18 0.019 0.021metolachlorchlorpyrifosα-endosulfanβ-endosulfanendosulfan-SO4dicofollambda-cyhalothrincypermethrin(variousisomers)deltamethrin
* internal standard** surrogate/internal standard
42
Appendix 4. Form used to calculate the concentration of malathion ineach sample.
Malathion
Sample VolumeExtracted(mL)
Area Ratio vFenchlorfos
µg/Vol. µg/L
LU 13 400 0.054 0.105 0.25*LUG 13 400 0.059 0.11 0.27*LU 14 400 0.027 0.05 0.13*LUG 14 400 0.143 0.25 0.62*LD 13 400 0.021 0.039 0.10*LD 14 400 0.025 0.046 0.12*
STD 2 400 0.036 0.067 STDSTD 3 400 0.108 0.188 STD
LM 13 400 0.019 0.005 0.09*LM 14 400 0.021 0.039 0.10*
* calculated using area ration of standards and sampleconcentration of standards (see example)
Calculation example: LU13
malathion (µg/L) = 0.054 x 0.067 x 1 = 0.25_________ __ 0.036 0.4
44
Key:
1. diuron
2. bensulfuron
3. molinate
4. 1-chlorotetradecane
5. trifluralin
6. simazine
7. atrazine
8. fenchlorfos
9. bromacil
10. thiobencarb
11. malathion
12. metolachlor
13. chlorpyrifos
14. α-endosulfan
15. β-endosulfan
16. endosulfan-SO4
17. dicofol
18. lambda cyhalothrin
19. cypermethrins
20. deltamethrin
45
Appendix 6. Limit of Reporting (LOR) for pesticides analysed for in the1995/96 Irrigation season.
Pesticide LOR (µµg/L)
atrazine 0.03
bensulfuron 0.10
bromacil 0.30
chlorpyrifos 0.03
cypermthrin 0.15
deltamethrin 0.15
dicofol 0.40
diuron 0.03
αα-endosulfan 0.03
ββ-endosulfan 0.03
endosulfan -SO4 0.03
lambdacyhalothrin 0.03
malathion 0.03
metolachlor 0.03
molinate 0.03
simazine 0.03
thiobencarb 0.03
trifluralin 0.03