Portland State University PDXScholar Civil and Environmental Engineering Master's Project Reports Civil and Environmental Engineering 2015 A Microsimulation of Novel Intersection Designs Aman K. Woldetinsae Portland State University, [email protected]Let us know how access to this document benefits you. Follow this and additional works at: hp://pdxscholar.library.pdx.edu/cengin_gradprojects Part of the Civil and Environmental Engineering Commons is Project is brought to you for free and open access. It has been accepted for inclusion in Civil and Environmental Engineering Master's Project Reports by an authorized administrator of PDXScholar. For more information, please contact [email protected]. Recommended Citation Woldetinsae, Aman K., "A Microsimulation of Novel Intersection Designs" (2015). Civil and Environmental Engineering Master's Project Reports. 14. hp://pdxscholar.library.pdx.edu/cengin_gradprojects/14
Transcript
Portland State UniversityPDXScholarCivil and Environmental Engineering Master'sProject Reports Civil and Environmental Engineering
2015
A Microsimulation of Novel Intersection DesignsAman K. WoldetinsaePortland State University, [email protected]
Let us know how access to this document benefits you.Follow this and additional works at: http://pdxscholar.library.pdx.edu/cengin_gradprojects
Part of the Civil and Environmental Engineering Commons
This Project is brought to you for free and open access. It has been accepted for inclusion in Civil and Environmental Engineering Master's ProjectReports by an authorized administrator of PDXScholar. For more information, please contact [email protected].
Recommended CitationWoldetinsae, Aman K., "A Microsimulation of Novel Intersection Designs" (2015). Civil and Environmental Engineering Master's ProjectReports. 14.http://pdxscholar.library.pdx.edu/cengin_gradprojects/14
4.1.1. Links and connectors ...................................................................................................... 25
4.1.2. Signal heads and signal timing .................................................................................... 30
4.1.3. Speed limits and reduced speed areas ......................................................................... 32
4.2.Base data ....................................................................................................................................... 35
4.2.1. Vehicle type and vehicle class ...................................................................................... 36
Appendix B: Available data and data used ................................................................................ 59
vii
LIST OF TABLES
Table-1 Strengths and weaknesses of PTV VISSIM ................................................................... 24
Table-2 Summary of the application areas of selected models................................................. 24
Table-3 Vehicle compositions for study site-I VISSM model development ........................ 37
Table-4 Vehicle compositions for study site-II VISSM model development ...................... 37
viii
LIST OF FIGURES
Figure-1 Study sites................................................................................................................................. 3
Figure-2 Intersection designs chosen for study ............................................................................... 4
Figure-3 Rotary circular intersection. Fort Worth, Texas. ........................................................... 8
Figure-4 Signalized traffic circle. Cape Town, Western Cape, South Africa ........................ 8
Figure-17 Corner Island, the highlighted region .......................................................................... 20
Figure-18 The sightlines in the conflict zone of a "right hook" ............................................... 22
Figure-19 Two phase left turn for bicyclists. ................................................................................. 22
Figure-20 Links and connectors of the existing signalized intersection. .......................... 26
Figure-21 Links and connectors of the turbo roundabout design ............................................ 27
Figure-22 Links and connectors of the existing signalized intersection design, at study
site- II ......................................................................................................................................................... 28
Figure-23 Links and connectors of the protected intersection design, at study site II ....... 28
Figure-24 Links and connectors of the protected intersection which is incorporated with a
turbo roundabout, at study site II ........................................................................................................ 29
Figure-25 Positions of signal heads and signal groups of site-I.”NW 23 Ave & NW
Figure-26 Positions of signal heads and signal groups of site-II. Existing design on the left
hand side and the Dutch’s bike friendly design on the right hand side. SE 92nd Ave & SE
Flavel St ..................................................................................................................................................... 31
Figure-27 Signal timing distribution for each signal group. Site-I - NW 23 Ave & NW
Vaughn St .................................................................................................................................................. 31
Figure-28 Signal timing distribution for each signal group. Site-II. SE 92nd Ave & SE
Flavel St ..................................................................................................................................................... 32
Figure-29 Reduce speed areas on the turbo roundabout design. .............................................. 33
ix
Figure-30 Reduce speed areas on the existing design. ................................................................ 33
Figure-31 Reduce speed areas on the existing design. ................................................................ 34
Figure-32 Reduce speed areas on the protected intersection design. ...................................... 34
Figure-33 Reduce speed areas on the protected intersection that is incorporated with the
Figure-R1 Average delay comparison on the existing volume condition. Site-I ................ 41
Figure-R2 Average delay comparison by progressive increment in volume. Site-I .......... 41
Figure-R3 Average speed comparison on the existing volume condition. Site-I ............... 42
Figure-R4 Average speed comparison by progressively increasing the volume. Site-I ... 43
Figure-R5 Total travel time comparison on the existing volume condition. Site-I ............ 43
Figure-R6 Total travel time comparison by progressively increasing the volume.Site-I . 44
Figure-R7 Average delay comparison on the existing volume condition. Site-II .............. 45
Figure-R8 Average delay comparison by progressive increment in volume. Site-II ......... 45
Figure-R9 Average speed comparison on the existing volume condition. Site-II .............. 47
Figure-R10 Average speed comparison by progressively increasing the volume. Site-II 47
Figure-R11 Total travel time comparison on the existing volume condition. Site-II ........ 48
Figure-R12 Total travel time comparison by progressive increment in volume. Site-II .. 48
Figure-R13 Bicyclists making a left turn on the existing intersection. Site-II .................... 50
Figure-R14 A path that a left turning bicyclists have to take on the protected intersection.
Study site-II .............................................................................................................................................. 51
Figure-R15 Right hook issue at the existing signalized intersection. Site-II ....................... 52
Figure-R16 Right hook issue addressed on the newly adopted protected intersection that is
incorporated with a turbo roundabout Site-II ................................................................................. 52
1
1.0 Introduction
The subject of the project described in this document is regarding intersection
improvements. In particular, this project aims to indicate the usefulness of adopting a well-
practiced intersection design approach from other part of world and study how they perform
here in the United State at a typical signalized intersection.
For this project, a turbo roundabout and a protected intersection design (Dutch’s bike
friendly intersection) were chosen for study. These intersection designs were modeled and
simulated using PTV VISSM traffic simulation software. Simulation results were compared
with the simulation results of a typical signalized intersection that is widely used here in the
United States with respect to average delay, average speed and total travel time.
The concept of roundabouts and their hierarchical relationship with other intersection
solutions will be addressed on chapter 2 of this paper. This introduction will address the
initiative of improving intersection and intersection approaches, the problem statement, the
methodologies used, the research questions, and finally, the structure for the remainder of
this report will be introduced, logically following from the research questions.
2
1.1. Motivations And Objectives
Roundabouts have gained attention in the US in recent years, while other countries like
Europe have already benefited from their use for a long time. Moreover, most of the United
States transportation infrastructure was initially designed to accommodate and serve
motorized vehicles only, but in recent years, people’s way of life and transportation mode
choice have begun to change rapidly. Studies show that one of the fastest growing choice of
transportation modes is bicycle. Bicyclists are also one of the most vulnerable road users to
any hazards. And unlike motorized vehicles, most of the bicycles are energized by the rider
itself.
The other reason for doing this intersection improvement project is because, most traffic
crashes happens at intersections and intersection approaches. According to the “US
intersection accident statistics-2012” done by Hardwick & Pendergast from the University
of Kentucky, about 35 percent of all crashes take place at intersections (4). So these factors
forced transportation engineers and planners including me to come up with a safer and most
energy efficient transportation infrastructure especially intersections.
This project aims to contribute to this need by adopting and examining the performance of
the turbo roundabout and the protected intersection designs at two intersections in
Portland, OR: “NW 23 Ave & NW Vaughn St” and “SE 92nd Ave & SE Flavel St”. The overview
of the study sites and the chosen intersection designs will be discussed in the following
figures. Figure-1 will illustrate the study sites and Figure-2 will illustrate the intersection
designs that are chosen for study.
3
Study site-I: NW 23 Ave & NW Vaughn St Study site-II: SE 92nd Ave & SE Flavel St
Figure-1 Study sites
The above pictures show the study sites in Portland, Oregon. At “NW 23 Ave & NW Vaughn
St” intersection there is no bicycle facilities or bicycle traffic. So, in this study site the turbo
roundabout will be simulated and the results will be compared with the simulation results
of the existing intersection. However, on the “SE 92nd Ave & SE Flavel St” intersection, there
are bicycle facilities and bicycle traffic. The protected intersection will be simulated and
performance comparison will be made with the existing intersection. Then, the turbo
roundabout will be incorporated with the protected intersection and the performance of the
new intersection will be evaluated at this intersection.
4
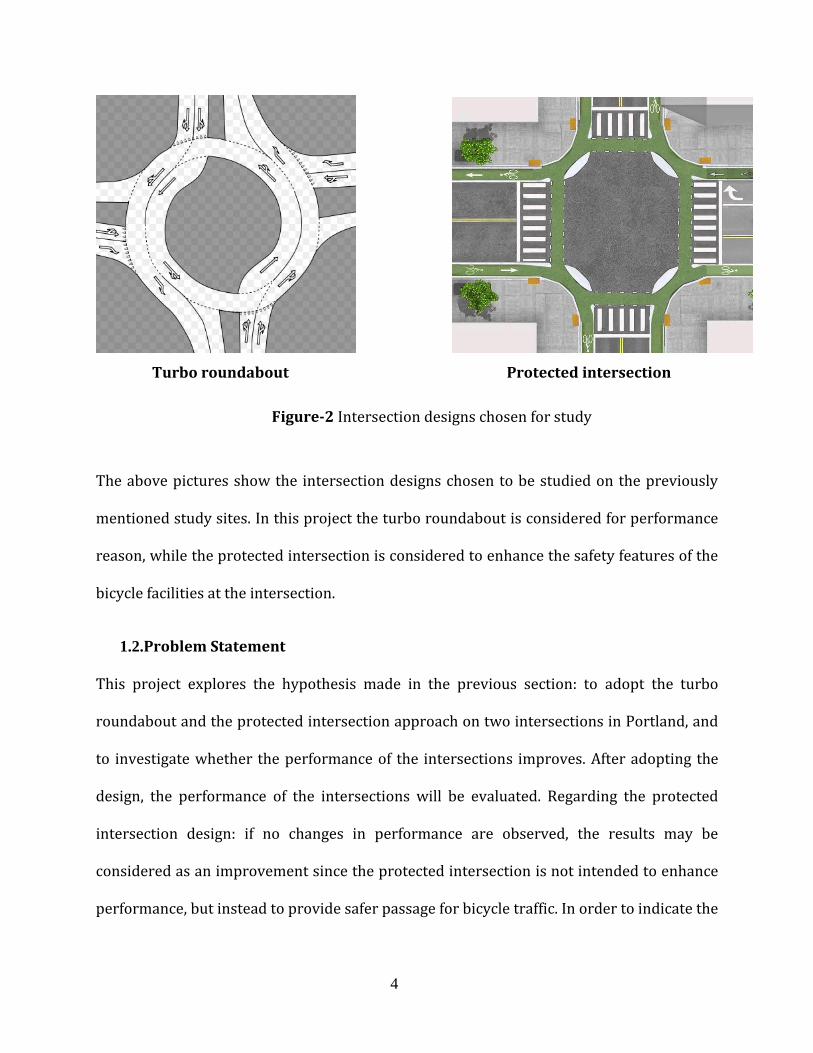
Turbo roundabout Protected intersection
Figure-2 Intersection designs chosen for study
The above pictures show the intersection designs chosen to be studied on the previously
mentioned study sites. In this project the turbo roundabout is considered for performance
reason, while the protected intersection is considered to enhance the safety features of the
bicycle facilities at the intersection.
1.2.Problem Statement
This project explores the hypothesis made in the previous section: to adopt the turbo
roundabout and the protected intersection approach on two intersections in Portland, and
to investigate whether the performance of the intersections improves. After adopting the
design, the performance of the intersections will be evaluated. Regarding the protected
intersection design: if no changes in performance are observed, the results may be
considered as an improvement since the protected intersection is not intended to enhance
performance, but instead to provide safer passage for bicycle traffic. In order to indicate the
5
influence of adopting turbo roundabout and the protected intersection approach, the
existing conditions and the newly adopted designs will be compared by means of PTV VISSM
simulation models.
1.3.Methodology
First, two study sites were selected in Portland, Oregon. One that has bicycle facilities and
another without. Then for both study sites PTV VISSM traffic simulation software was used
to model and simulate the experimental designs, and study their results.
At “NW 23 Ave & NW Vaughn St” intersection, since there are no bicycle facilities or bicycle
traffic in this study site, the performance of the turbo roundabout was studied without the
addition of bicycle traffic. However, on “SE 92nd Ave & SE Flavel St” intersection, since there
are bicyclists and bicycle facilities at the intersection, the study in this site also involves the
safety of bicyclists.
Second, the intersections were modeled, first by just adopting the protected intersection and
comparing the performance with the existing intersection. Then, the protected intersection
was incorporated with the turbo roundabout and again the performance of the new design
was compare with the existing signalized intersection.
Finally, the results were analyzed and discussions were made based on the results regarding
which features are improved and which features failed to improve based on the performance
parameters. The performance parameters used in this project to compare intersection
performances were: total travel time, average delay and average speed.
6
1.4.Research Question
The aim of this research questions is to structure all the research needed to be done in order
to accomplish the main goal of this project. The first main research question that will be
addressed is, whether or not the adopted intersection designs perform better than the
conventional signalized intersection? To answer this question, the new intersection designs
were modeled and simulated on PTV VISSM for both study sites, and results were analyzed
and compared with the existing infrastructures based on the performance parameters
considered in this project.
The second research question that will be addressed in this project is, which infrastructure
performs better in case of multimodal transportation system? Could we enhance the safety
features of the bicycle facilities at the intersection without affecting the performance of the
intersection? To answer these important research questions, the study site with the bicycle
facility, study site-II, was considered for study. Again PTV VISSM traffic simulation software
was used to model and simulate the protected intersection design and the protected
intersection design that is incorporated with the turbo roundabout. The simulation results
will be compared again based on the same performance parameters.
1.5.Report Structure
This paper starts with a brief introduction and overview of the study sites and the proposed
designs. Chapter-2 will give a general background regarding roundabouts. Chapter-3 deals
with literature review. In Chapter-4 the model development will be discussed briefly. In
Chapter-5 the evaluation results will be presented and discussions will be made based on
those results. Finally in Chapter-6, an overall brief discussion and conclusion will be made
based on simulation results.
7
2. Background
For several years due to lack of sufficient information on roundabout operation and design
under local U.S. agencies, roundabout intersections have seen only sporadic implementation
in the U.S road networks. However, in the past few years the applications of roundabouts in
the United States has received an increased attention by both the public and transportation
professionals. On the other hand, roundabouts have been in widespread use in other
countries for a number of years especially in the Europe countries.
A roundabout is a form of circular intersection in which traffic circulate around a
central non-mountable island and in which entering traffic must yield to circulating traffic
that is already inside the roundabout (2). Figure-7 shows a typical circular intersection with
a single lane approach. It consists of a circulatory roadway containing one lane, around a
non-mountable middle island.
In the early 1960s the single-lane roundabout was introduced, it was an innovative design
with many social and economic benefits. The single-lane roundabout offers a capacity of
2000 - 2500 PCU (PCE)/h, which is similar to the conventional non-circular intersection (see
Figure-11), which was the most common intersection(2).
2.1.Types of circular intersections
There are at least four distinct types of circulatory intersections (NCHRP report 672, 2010).
Rotary: This
type of circular intersection was common to the United States prior to the 1960s, and
it is characterized by a large diameter, often greater than 300 ft. (100 m) (2). The large
diameter in the rotary traffic circle allows traffic to weave on the road stretches
8
between two legs. Lane changes within the rotary are also required for some turning
Are one of the oldest type of circular intersections which are used in some cities in the
United States where traffic signals are used to control one or more entry. See Figure-4
Figure-4 Signalized traffic circle. Cape Town, Western Cape, South Africa. (Source: NCHRP REPORT 672, 2010)
9
Neighborhood traffic circles:
These are usually built for traffic calming and for aesthetics at intersections of local
streets. The intersection approaches may be uncontrolled or stop sign controlled. See
Figure-5
Figure-5 Neighborhood Traffic circle.
Roundabouts:
Roundabouts are types of circular intersections that have specific designs and traffic
control features. These features may include yield control of all entering traffic,
channelized approaches, and geometric curvature and features to induce desirable
vehicular speeds (2).
2.2.Categories of roundabouts
According to NCHRP report 672, roundabouts are categorized into three basic categories
according to size and number of lanes to facilitate discussion of specific performance or
design issues. These are mini-roundabouts, single-lane roundabouts, and multilane
10
roundabouts. However, according to Lambertus G.H. Fortuijn, 2013 TRB report, a turbo
roundabout is also mentioned as one of the classification.
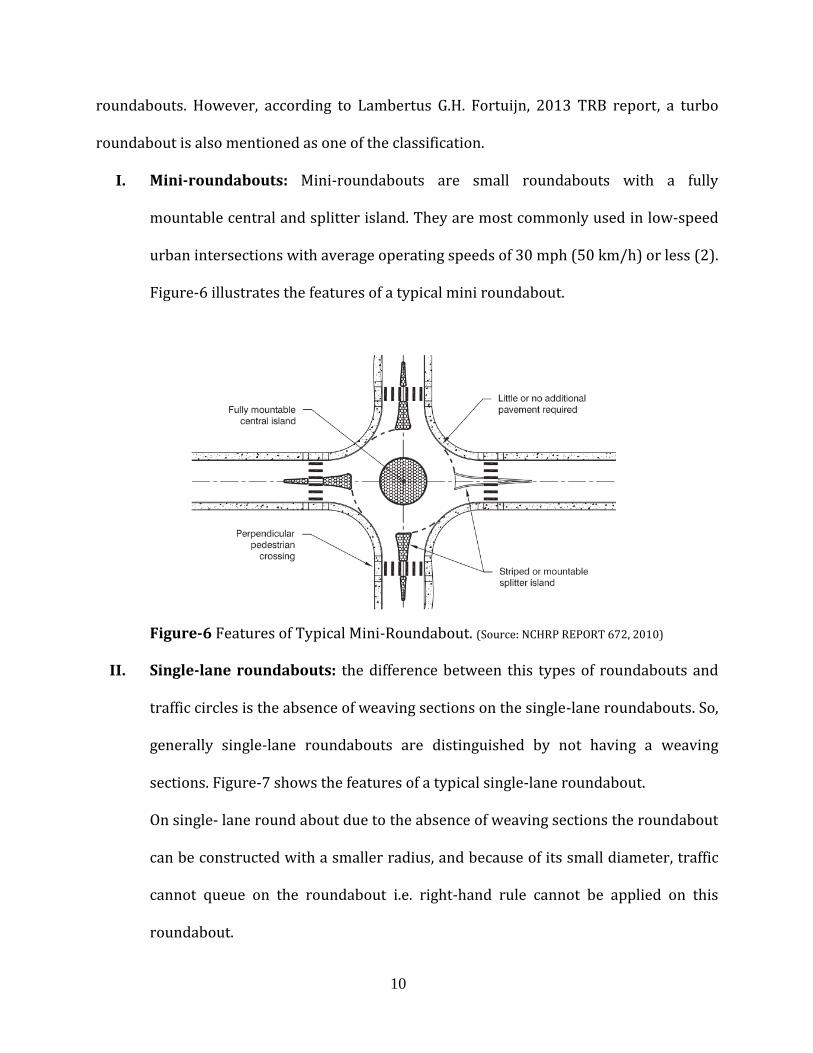
I. Mini-roundabouts: Mini-roundabouts are small roundabouts with a fully
mountable central and splitter island. They are most commonly used in low-speed
urban intersections with average operating speeds of 30 mph (50 km/h) or less (2).
Figure-6 illustrates the features of a typical mini roundabout.
Figure-6 Features of Typical Mini-Roundabout. (Source: NCHRP REPORT 672, 2010)
II. Single-lane roundabouts: the difference between this types of roundabouts and
traffic circles is the absence of weaving sections on the single-lane roundabouts. So,
generally single-lane roundabouts are distinguished by not having a weaving
sections. Figure-7 shows the features of a typical single-lane roundabout.
On single- lane round about due to the absence of weaving sections the roundabout
can be constructed with a smaller radius, and because of its small diameter, traffic
cannot queue on the roundabout i.e. right-hand rule cannot be applied on this
roundabout.
11
Figure-7 Features of a typical single lane roundabout
III. Multilane roundabouts: Multilane roundabouts have at least one entry with two or
more lanes. In some cases, the roundabout may have a different number of lanes on
one or more approaches. The multi-lane roundabout was implemented for
intersections on which the traffic demand was so high, that the single-lane
roundabout could not offer enough capacity. Figure-8 illustrates features of a typical
two lane roundabout.
Figure-8 Features of a typical two-lane roundabout (Source: NCHRP REPORT 672, 2010)
12
IV. Turbo roundabout: this specific kind of spiraled round about is invented by Dr.ir.
L.G.H. Fortuijn. It is an innovative arrangement of the two lane roundabout that has
revolutionized roundabout design in the Netherlands by having about 25 – 35%
higher capacity than a standard two lane roundabout. On the Turbo roundabout,
many conflict points were removed by configuring the circulatory lanes in such a
way that lane changes on the roundabout are not necessary (3). The figure below
Figure-9 illustrates the typical characteristic features of a turbo roundabout.
Figure-9 Characteristic features of a turbo roundabout. (Source: Fortuijn TRB Paper #09-2476)
Different Variants of the Turbo Roundabout
According to L.G.H. Fortuijn, Different variants of the turbo roundabout are
obtained by varying the number of lanes on the access and exit legs. The following
figure illustrates the different variants of the turbo roundabout (see Figure-10).
13
Figure-10 Different variant forms of turbo roundabout. (Source: Fortuijn TRB Paper #09-2476)
2.3. Non-circular intersection
Non-circular intersections were the most commonly used intersection solution until
circular intersections gained popularity in 1960’s. The figure below illustrates a typical
non-circular intersection features (see Figure-11).
Figure-11 A typical non-circular intersection.
14
3. Literature Review
In this chapter all the knowledge already developed related to the topic of this project will
be addressed. The first review is aimed at characteristic features of turbo roundabouts. In
the second section, a study about the protected intersection approach is reviewed. Finally
the third section presents the fundamentals of the model to be applied in this study: PTV
VISSIM.
3.1.Characteristic features of turbo roundabouts
According Fortuijn, the basic characteristics of a turbo roundabout is classified into seven. In
this section, the significance of the basic characteristics of the turbo roundabout will be
discussed based on Fortuijin’s TRB Paper #09-2476.
3.1.1. Pre-emption of traffic flows: is closely related to turbo roundabout
features. Which are: traffic approaching the roundabout on at least one leg
must yield to traffic in two and no more than two lanes on the roundabout;
and smooth flow on roundabout by well applied spiral alignment.
3.1.2. Limited number of circulatory lanes: vehicles at approach yield to no more
than two lanes. Studies have been done for expanding the roundabout from
two lanes to three. However, results show that only a lesser capacity benefit
can be achieved from expanding the turbo roundabout from two lane to
three lane than expanding the roundabout from one lane to two lanes.
3.1.3. Smooth flow on roundabout by well applied spiral alignment: Figure-12
illustrates the difference in the number of conflicts between two-lane and
turbo roundabout. In the figure we can observe that the concentric two-lane
15
roundabout has 16 conflict points, and the turbo roundabout 10. The spiral
alignment offers benefits as regards not only safety but also driving comfort.
Figure-13 will illustrate that the turbo roundabout requires fewer steering
movements than a concentric roundabout with spiral road markings.
Figure-12 Differences in conflict types between two-lane and turbo roundabouts (Source: Fortuijn TRB Paper #09-2476)
Figure-13 Difference in steering movements. Concentric roundabout markings (on left hand side) and spiral road “turbo roundabout (on right hand side)”. (Source: Fortuijn TRB Paper #09-2476)
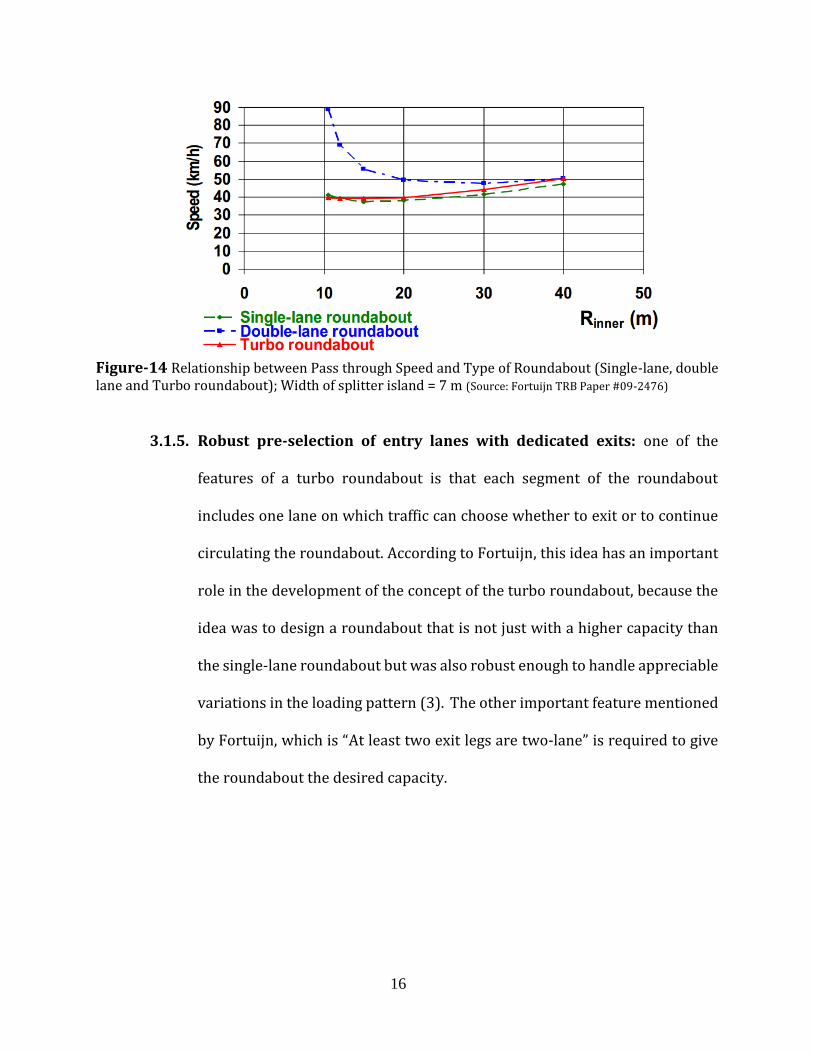
3.1.4. Division of lanes: Mainly the safety of a roundabout is largely determined by
the speed at which vehicles pass through it. Figure-14 shows the relationship
between speed through the roundabout and its internal diameter for three
types of roundabouts. Usually in concentric two-lane roundabouts, drivers
are strongly tempted to cut in the bends at times when traffic is low. One of
the key features of turbo roundabout which is the raised lane dividers, plays
an important role in curbing this behavior (3).
16
Figure-14 Relationship between Pass through Speed and Type of Roundabout (Single-lane, double lane and Turbo roundabout); Width of splitter island = 7 m (Source: Fortuijn TRB Paper #09-2476)
3.1.5. Robust pre-selection of entry lanes with dedicated exits: one of the
features of a turbo roundabout is that each segment of the roundabout
includes one lane on which traffic can choose whether to exit or to continue
circulating the roundabout. According to Fortuijn, this idea has an important
role in the development of the concept of the turbo roundabout, because the
idea was to design a roundabout that is not just with a higher capacity than
the single-lane roundabout but was also robust enough to handle appreciable
variations in the loading pattern (3). The other important feature mentioned
by Fortuijn, which is “At least two exit legs are two-lane” is required to give
the roundabout the desired capacity.
17
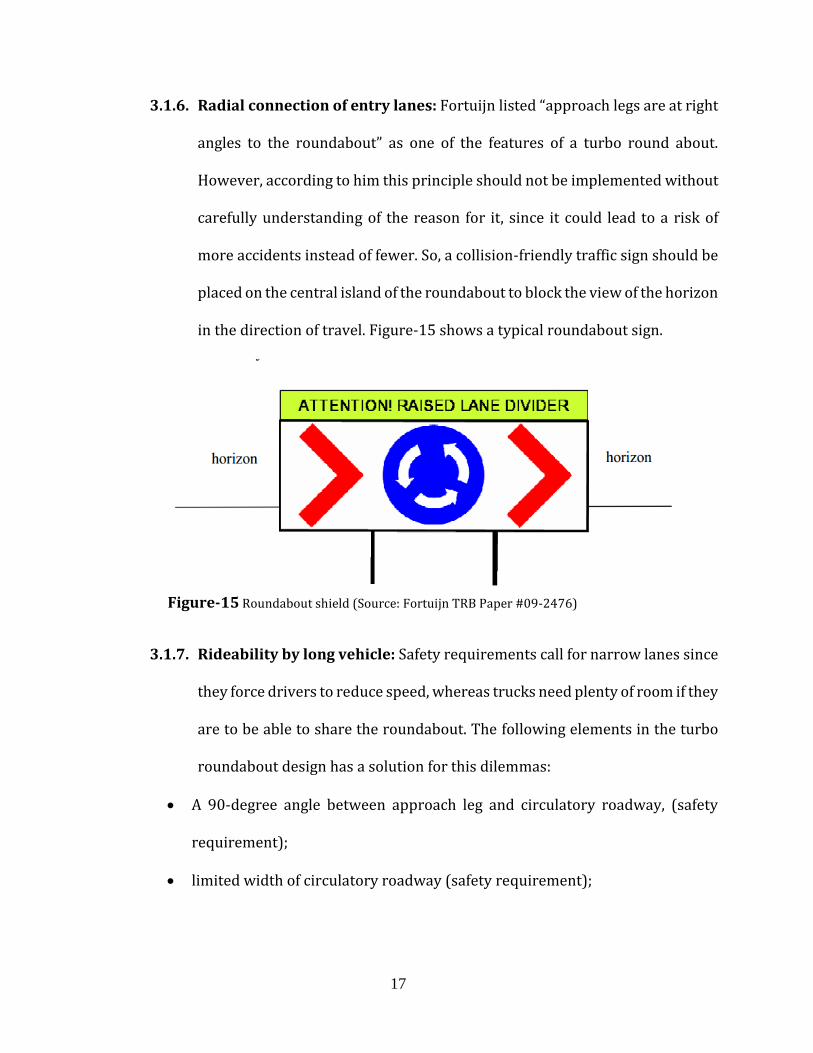
3.1.6. Radial connection of entry lanes: Fortuijn listed “approach legs are at right
angles to the roundabout” as one of the features of a turbo round about.
However, according to him this principle should not be implemented without
carefully understanding of the reason for it, since it could lead to a risk of
more accidents instead of fewer. So, a collision-friendly traffic sign should be
placed on the central island of the roundabout to block the view of the horizon
in the direction of travel. Figure-15 shows a typical roundabout sign.
Figure-15 Roundabout shield (Source: Fortuijn TRB Paper #09-2476)
3.1.7. Rideability by long vehicle: Safety requirements call for narrow lanes since
they force drivers to reduce speed, whereas trucks need plenty of room if they
are to be able to share the roundabout. The following elements in the turbo
roundabout design has a solution for this dilemmas:
A 90-degree angle between approach leg and circulatory roadway, (safety
requirement);
limited width of circulatory roadway (safety requirement);
18
central apron offering additional room for trucks using the inner lane
(accessibility requirement);
Aprons in the armpits between entrance and roundabout and exit and
roundabout, which also offer additional room for trucks using the outer lane
(accessibility requirement).
3.2.Protected intersection (Dutch Intersection Design with Cycle Tracks)
According to McIntyre and Murphy, the Dutch’s and the US intersections have similar
features except for the addition of cycle tracks at their intersections. Figure-16 illustrates
both the US and the Dutch intersections.
Figure-16 Figure on the left hand side shows a typical Intersection with Bicycle Lanes in the US. And the figure on the right hand side shows Typical Dutch Intersection Design. (Source: reference5)
The differences in intersection design approach that include bicycle traffic is summarized in
the following:
On the protected intersection the cycle track is separated from the travel lane of
motorized vehicles at all times. This differs from the American bicycle lanes since they
19
are not physically separated from motorized vehicle traffic, but are just located on the
sides of the road (5).
From the above picture on Figure-16, we can observe the pavement markings that
each intersection design approach receive across their intersection. In the
Netherlands, when a cycle track reaches an intersection, the markings indicating the
cycle track continue through the intersection to the cycle track on the far side of the
intersection (see the figure on the right hand side). In the United States, when a bike
lane reaches an intersection, typically the bike lane ends at the stop line and begins
again at the far side of the intersection (5) (refer to the above picture on the left hand
side).
So, according to McIntyre and Murphy, the protected intersection design offers various
tools to make the intersection safer and more accessible for bicyclists than the US typical
intersection.
3.2.1. Important design features of the protected intersection approach
Corner islands: in Netherlands, corner islands are very common at intersections
between the street and the cycle tracks. They provide additional physical barrier
between where motorized vehicles will be traveling and where bicycles will be riding in
the cycle tracks through raised islands (5). Figure-17 illustrates this feature.
20
Figure-17 Corner Island, the highlighted region. (5)
Stop line location: one reason why automobiles and bicycles are able to operate
together without much problem is their separation at intersections. Since the speed of
bicycles is slower and also accelerate at a much slower rate from a stopped position
compared to automobiles, many protected intersections push the stop line of
automobiles behind cycle track crossings. So when the traffic signal light changes to
green at the intersection, by the time an automobile arrives to the intersection, bicyclists
have already passed through and are traveling at their desired speed (5).
Colored cycle tracks: the color of motorized vehicle traffic lane is different from the
bicycle path at the intersection. This helps to make operators of automobiles more aware
of their surroundings and what modes of transportation are traveling around them. In
Netherlands bicycle paths are usually painted red, but some other countries like the US
use green paint to distinguish their bike lane. There are different ways to do this: paving
the road with colored asphalt, painting the road, or using colored brick. The idea behind
making the cycle tracks colored is so that they are easily distinguishable.
21
3.2.2. Conflicts within intersections
Conflicts between bicycles and automobiles: at a four way intersection, a bicycle can
make three possible moves; they can continue straight, turn right, or turn left. The easiest
of these moves is to turn right while on the cycle track. As long as the cycle track remains
off of the street, then there should be no conflict with automobiles. The real conflicts arise
with continuing straight and making a left turn (5).
Right Hook: is a very common conflict between motorized vehicle and bicycles at an
intersection. This conflict happens when a bicyclist going straight through an
intersection is side swiped by a motor vehicle turning right. This can occur when a
bicycle lane crosses through an intersection where very little to no visibility is
provided between the automobile and a bicyclist (5). The Dutch’s on their protected
intersection design addressed this issue by increasing the distance between the stop
bar of motorized vehicles and the bicyclist. This distance gives a bicyclist enough
time to move through the intersection before a right turning car could come in
contact with it. So, during a steady green, the distance allows for both the bicyclist
and the automobile to be able to see each other when looking straight ahead in the
conflict zone, plus the corner islands also provide a physical barrier. Motorized
vehicles must travel around when making a right turn, which allows bicyclists to be
removed from automobiles at intersections. Additionally, corner islands push the
bicyclists out farther from the curb. This also increases the visibility between the
automobile and the bicyclist (5). Refer Figure-18 for visual illustration of the above
statement.
22
Figure-18 The sightlines in the conflict zone of a "right hook" (5).
Left Turn: according to the MUTCD typical signalized intersection with bicycle
lanes, for the bicyclists in order to make a left turn either they have to merge the
through automobile traffic or need to get off their bike and walk it across as a
pedestrian. Neither one is immensely desirable, especially merging left into traffic,
which can give rise to automobile and bicycle points of conflicts (5). On the other
hand the Dutch’s came up with a solution by two-phase left turn. Figure-19 shows a
path that a bicyclist had to take to make a two phase left turn.
Figure-19 Two phase Left Turn for Bicyclists. (5)
23
3.3.Simulation model
There are several microscopic simulation tools available for evaluating the traffic flow on a
random infrastructural network. PTV VISSIM, Paramics and Aimsun are some of the
simulation tool that are widely used on microscopic modeling. In this project PTV VISSM is
used for modeling and simulation. However, most microscopic simulation tools including
PTV VISSM have similarities when it comes to the main input parameters to evaluate traffic
flow. These are the infrastructural network, the traffic demand and microscopic behavioral
models.
PTV VISSIM offers a graphical user interface that allows a user to input traffic and signal data
on to the existing base maps of intersections and road layouts. Besides reducing the
workload required for inputting data to the model, the quality of animation of traffic and
transit operations has also been improved due to this unique capability of VISSM. In contrast
to other traffic simulation software, VISSIM allows users to accurately model and analyze
sophisticated traffic interactions such as weaving sections and merges (6).
A disadvantage of PTV VISSM simulation model is the computation time, which depends on
the magnitude of the network, the desired output and the amount of random seeds to be
applied. Coding the input data to the model also requires a fairly significant amount of time.
The summary of strengths and weaknesses of PTV VISSM according to ‘Boxill and Yu, 2000’
is tabulated below (see Table-1).
24
Table-1. Strengths and weaknesses of PTV VISSIM. (Source: Sharon A. Boxill and Lei Yu, 2000)
The table below, Table-2, summarizes the important areas of applications of different traffic
simulation models within the ITS framework.
Table-2 Summary of the application areas of selected models. (Source: Sharon A. Boxill and Lei Yu, 2000)
Traffic simulation models Areas of applications
AIMSUN 2 Traffic control systems; evaluation of roadway alternatives; and route
guidance.
CONTRAM Traffic demand time series analysis; and design of urban traffic
management options.
CORSIM Assessment of advanced traffic control scenarios such as: adaptive traffic
signal control and demand responsive ramp metering.
HUTSIM Evaluation and testing of different signal control strategies and traffic
arrangements; development of new traffic control systems; and evaluation
of ITS applications.
INTEGRATION Assessment of real time rout information and guidance; and corridor
improvement strategies for HOV.
PARAMICS For simulating: traffic signal impacts; ramp metering; in-vehicle route
guidance; and in-vehicle network state display devices.
VISSM Intersection design and operation; and Transit signal priority studies.
PTV VISSM traffic simulation software
Strength Weakness
Covers a wide range of traffic situations
Can be run on any personal computers
Continuously upgraded and hotline
supported
No assessment algorithms
Coding of input data is tedious and time
consuming
25
4. Model development
This chapter addresses the models made by means of a traffic simulation software called PTV
VISSIM 6. This section is written in such a way, that a reader with basic knowledge of VISSIM
should be able to reproduce the models used in this project.
The first section illustrates the elements within the network, such as links, nodes, priority
rules, speed limit, and reduced speed areas and so on. The second section discusses about
some basic features in the Base Data. Here, the behavior of vehicles in the network can be
manipulated and customized. However in this project, the default setting of PTV VISSM is
used. The third section explains how the traffic demand can be added to the simulation by
means of a static assignment. And finally on the fourth section, the evaluation methods will
be summarized.
4.1.Network
4.1.1. Links and connectors
In PTV VISSM 5 and earlier versions, before designing, the designer should load a graphic file
into the VISSIM model on which one can draw the network. However, in this project since
PTV VISSM6 is used and the graphic files are incorporated with the software, there is no need
for loading graphical files. This file ensures that the geometrical dimensions of the
roundabout are correctly modelled.
26
Study site-I: NW 23 Ave & NW Vaughn St
I. Existing design: Figure-20 shows a drawing of the existing signalized intersection,
the links are the solid gray lanes and the connectors are the lanes with an atomic
green border line. The connectors at the intersection are set to have a lane changing
behavior that vehicles are supposed to change lane 200m from the connector. The
cross walks are the lanes drown by white color.
Figure-20 links and connectors of the existing signalized intersection design.
II. Turbo roundabout: Figure-21 shows a drawing of the turbo roundabout with the
links and connectors forming the structure of the roundabout. The circulatory
roadways are modelled by means of links, connected by short connectors at each of
the decision points. The connectors at the entrance approaching legs of the
roundabout are set to have a lane changing behavior that vehicles are supposed to
change lane 200m from the connector. The divided segment entrance legs
accommodate each direction on a separate lane. The links are the solid gray lanes and
the connectors are the lanes with an atomic green border line.
27
Figure-21 links and connectors of the turbo roundabout design.
Study site-II: SE 92nd Ave & SE Flavel St
I. Existing design: Figure-22 shows a drawing of the existing signalized intersection at
the study site-II, the links are the solid gray lanes and the connectors are the lanes
within the red border line. The connectors at the intersection are set to have a lane
changing behavior that vehicles are supposed to change lane 200m from the
connector. In this study site there are also a bicycle facilities which are drawn in the
green lane color. Even though it is a single lane bike track, the connectors have the
same lane changing behavior as the road way connectors.
28
Figure-22 links and connectors of the existing signalized intersection design, at study site II.
II. Dutch’s protected intersection: Figure-23 shows a drawing of the protected
intersection at the study site-II, the links are the solid gray lanes and green lanes, and
the connectors are the lanes within the red border line. The connectors at the
intersection are set to have a lane changing behavior that vehicles are supposed to
change lane 200m from the connector. As mentioned earlier the connectors
connecting the bike lane links have the same lane changing behavior as the road way
connectors.
Figure-23 links and connectors of the protected intersection design, at study site II
29
III. The Dutch’s protected intersection which is incorporated with a turbo
roundabout: Figure-24 shows a drawing of the turbo roundabout with the links and
connectors forming the structure of the roundabout. The circulatory roadways are
modelled by means of links, connected by short connectors at each of the decision
points. The connectors at the entrance approaching legs of the roundabout are set to
have a lane changing behavior that vehicles are supposed to change lane 200m from
the connector. The divided segment entrance legs accommodate each direction on a
separate lane. The links are the solid gray and green lanes, and the connectors are the
lanes within a red border line.
Figure-24 links and connectors of the protected intersection which is incorporated with a
turbo roundabout, at study site II
30
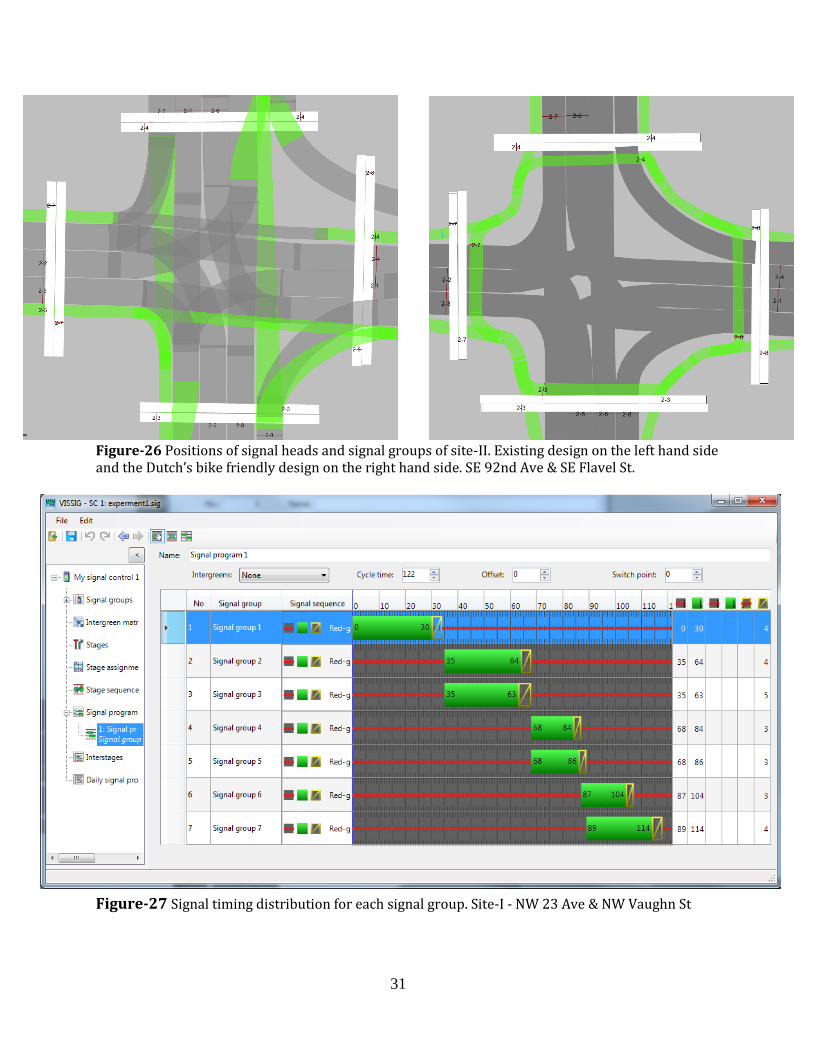
4.1.2. Signal heads and signal timing
Figure-25 & 26 illustrates the position and signal group of each signal heads for study site I
and II consecutively. In the picture the first number indicates the study site and the second
number indicates signal group (for example: 1-2 means study site-I, signal group-2). Figure-
27 and Figure-28 shows the signal timing distribution for each phases (signal groups). Since
in the turbo roundabout traffic signals are not used, only the existing and the protected
intersection designs are illustrated on the following figures.
Figure-25 Positions of signal heads and signal groups of site-I. NW 23 Ave & NW Vaughn St.
31
Figure-26 Positions of signal heads and signal groups of site-II. Existing design on the left hand side and the Dutch’s bike friendly design on the right hand side. SE 92nd Ave & SE Flavel St.
Figure-27 Signal timing distribution for each signal group. Site-I - NW 23 Ave & NW Vaughn St
32
Figure-28 Signal timing distribution for each signal group. Site-II. SE 92nd Ave & SE Flavel St
4.1.3. Speed limits and reduced speed areas
The desired speeds for the links are copied from Portland maps data base. All vehicles arrive
at the intersection with the desired speed of the link. However, the vehicles do not cross the
intersection at that desired speed due to road curvature, priority, traffic signals, traffic
calming, and several other factors. The following figures will illustrate the reduced speed
areas and the reduced speeds. The reduced speed areas indicate the road stretches on which
the desired speed is lower.
Study Site-I. NW 23 Ave & NW Vaughn St
Figure-29 shows the turbo roundabout on study site-I. In this design, on the right turning
lanes the reduced speed is 20 km/hr. on the approaching legs and inside the turbo
roundabout the speed is reduce to 25 Km/hr.
33
Figure-29 Reduce speed areas on the turbo roundabout design.
Figure-30 shows the reduced speed areas on the existing intersection. Here the right turning
lanes have a reduced speed of 15 km/hr. and the left turning vehicle have a reduced speed
of 20 Km/hr.
Figure-30 Reduce speed areas on the existing design.
34
Site-II. SE 92nd Ave & SE Flavel St Figure -31 shows the reduced speed area on the existing signalized intersection at study site-
II. Here the right turning lanes have a reduced speed of 15 km/hr and the left turning vehicle
have a reduced speed of 20 Km/hr.
Figure-31 Reduce speed areas on the existing design.
Like the existing design, the right turning lanes on the protected intersection have a reduced
speed of 15 km/hr and the left turning vehicle have a reduced speed of 20 Km/hr. Figure-32
shows the reduced speed area on the protected intersection at study site-II.
Figure-32 Reduce speed areas on the protected intersection design.
35
The figure below Figure-33 shows the reduced speed area on the protected intersection that
is incorporated with the turbo roundabout. In this design, on the approaching legs and on
the right turning lanes the reduced speed is 15 km/hr. And inside the turbo roundabout the
speed is reduce to 25 Km/hr.
Figure-33 Reduce speed areas on the protected intersection that is incorporated with the Turbo roundabout intersection design.
4.2.Base data
On PTV VISSM tool bar from the drop down menu “Base data”, the most important input
variables with respect to the microscopic driving behavior can be defined in the form of
functions and distributions. Since in this project the default settings are used, in this section
only some of the important default setting features will be discussed. The online PTV Group
web also offers some important description regarding this topic.
36
4.2.1. Vehicle type and vehicle class
In this dropdown menu, we can define the vehicles characteristics. In the VISSIM models of
this project, the only relevant vehicle types used are Car, HGV, pedestrians and bikes. A
vehicle class is a selection of the vehicle types, which together form a class. These classes can
be assigned characteristics in a static assignment.
4.2.2. Distributions
In the dropdown menu under base data - Distributions, there are important parameters that
influence the behavior of drivers in the model, and its output. One of the parameters is the
desired speed distribution. The desired Speed distributions used in this project are: 15, 20,
25, 30, 40, and 60 Km/hr, which are applied in the reduced speed areas, on right turn and
left turn lanes on the signalize intersections ,and on the approach links.
4.2.3. Link behavior types
In this menu, the driving behavior explained in the previous section can be applied to the
road types in the model. In this project road type urban, cycle track and pedestrian area are
used.
37
4.3.Traffic demand
The PTV VISSIM software offers two ways to generate traffic on a network, these are static
and dynamic assignment. This project applies a static assignment.
4.3.1. Vehicle composition
There were no data regarding vehicle composition for the study sites. However, in this
project a new vehicle composition is defined for cars, bikes and pedestrians unique to both
study sites.
Site-I. NW 23 Ave & NW Vaughn St
Table-3 Vehicle compositions for study site-I VISSM model development
Site-II. SE 92nd Ave & SE Flavel St
Name Vehicle type Desired speed Relative flows
CAR
1001: Car 60: 60 km/h 0.98
1002: HGV 40: 40 km/h 0.01
1003: Bus 40: 40 km/h 0.01
BIKE 1007: Bike 25: 25 km/h 1.00
PEDESTRIAN 1005: Man 5: 5 km/h 0.50
1006: Woman 5: 5 km/h 0.50
Table-4 Vehicle compositions for study site-II VISSM model development
Name Vehicle type Desired speed Relative flows
CAR 1001: Car 60: 60 km/h 0.999
1002: HGV 50: 50 km/h 0.001
PEDESTRIAN 1005: Man 5: 5 km/h 0.50
1006: Woman 5: 5 km/h 0.50
38
4.4.Evaluations
The evaluation of the intersection performance will be based on; travel time, average delay
and average speed. PTV VISSM-6 offers all the above performance criteria to be measured
from the model. A gradual increment in volume is done every 15 simulation minute to
observe the performance of each intersection designs in different volume scenarios. The
increment is done on the total volume of all legs that are feeding the intersection (in other
words the in-volume) and then distributed to each intersection legs on their percentage
contribution to the intersection which is driven from the existing condition that is obtained
from Portland Maps. The following figure illustrates the volume distribution for the both
study sites.
Figure-34 Percentage volume contribution of each approaches to their intersection.
100 %
8%
23
%
23%
Site-I. NW 23 Ave & NW Vaughn St
100 %
35%
42%
13
%
10
%
Site-II. SE 92nd Ave & SE Flavel St
39
Figure-35 Percentage volume distribution of all turning movements on each leg. For motor
vehicles
Figure-36 Percentage volume distribution of all turning movements on each leg. For bike
traffic
40
4.4.1. Evaluation parameters
As mentioned earlier in this project the evaluation parameters used are total travel time,
average delay and average speed. PTV VISSM-6 allows these performance criteria’s to be
measured from the model. In this project identical networks are used with the identical
dimensions, volumes and, traffic and route behavior. Only the intersection designs are
different for evaluation.
The travel time can be measured by defining starting and ending point on segments. By doing
so, we can measure the time a vehicle on the link travel for the defined distance from the
starting to the ending point. We can do this for all individual turning movements, inside and
outside of interchanges. But studying the travel time on the individual link is not the
intention of this project. That by itself can be a whole new project. The intent of this project
is to study the impact of the different design types on a given network. So the total travel
time is the travel time of all active and arrived vehicles in the network. The average speed
is: the total distance / total travel time, where the total distance is the distance traveled by
active and arrived vehicles in the network. The average delay per vehicle is: the total delay
time / (active + arrived vehicles), where the total delay time of all active and arrived vehicles.
The delay time is calculated by subtracting the quotient of the actual distance traveled and
the desired speed from the length of the time step.
41
5. Evaluation results and discussions
5.1. Study site –I: NW 23 Ave & NW Vaughn St
5.1.1. Average delay
Figure-R1 Average delay comparison on the existing volume condition.
Figure-R2 Average delay comparison by progressive increment in volume.
42
Average delay is one of the performance parameters used in this study site. From Figure-R1
on the existing volume condition, we can clearly see that the turbo roundabout has a very
low delay per car “average delay” compared to the existing signalized intersection. The turbo
roundabout in this condition is significantly better than the existing design. There is around
a 34 seconds average delay difference between the two designs. From Figure-R2, we can also
see that the turbo roundabout is performing better than the existing signalized intersection
even when the volume on the intersection is increased progressively until the point where
the volume increment passed 75%. After that point the average delay on the turbo
roundabout is greater. However, such volume conditions are highly unlikely to happen in the
real world, since the existing volume used in this study is already the PM peak hour volume.
5.1.2. Average speed
Figure-R3 Average speed comparison on the existing volume condition.
43
Figure-R4 Average speed comparison by progressively increasing the volume.
Average speed is another important comparison parameter use in this project. From the
chart given on Figure-R3, we can see a comparison between the turbo roundabout and the
existing signalized intersection by average speed using the existing volume condition. From
the chart we can observe that the average speed on the turbo roundabout is significantly
greater for the given scenario. Again on Figure-R4 we can also observe that the average
speed on the turbo roundabout is greater than the existing signalized intersection in all
different volume scenarios.
5.1.3. Total travel time
Figure-R5 Total travel time comparison on the existing volume condition.
44
Figure-R6 Total travel time comparison by progressively increasing the volume.
The final performance comparison parameter used in this study site is the total travel time.
The chart given on Figure-R5 shows a comparison of the turbo roundabout and the existing
signalized intersection based on total travel time with the existing volume condition. From
the chart we can observe that the total travel time under the turbo roundabout is much less
than the existing signalized intersection. Again the charts given on Figure-R6 also show that
the total travel time in the turbo roundabout under different volume scenarios is also less
than the existing design at all time.
5.1.4. Results summary
Based on the simulation results given in this section and the above discussions, overall the
turbo roundabout has shown a significant performance superiority over the existing
intersection on different volume scenarios. The following summary shows the improved
performances on the existing volume condition by transforming the existing signalized
intersection into a turbo roundabout.
↓ Average delay is reduced by 85.43% for the existing volume condition.
↑ Average speed is increased by 52.5% for the existing volume condition.
↓ Total travel time is reduced by 31.68% for the existing volume condition.
45
5.2. Study Site-II: SE 92nd Ave & SE Flavel St
As mentioned on the earlier sections of this paper, in this study site there are bike facility.
So, the study in this site is not just only performance improvement but also a safety
improvement. The Dutch’s protected intersection design is adopted for the reason of safety
only and then incorporated with turbo roundabout to improve its performance. First the
performance of the different intersection design approaches will be discussed based on
VISSM simulation results provided, then the safety improvement will be discussed in detail.
5.2.1. Average delay
Figure-R7 Average delay comparison on the existing volume condition.
Figure-R8 Average delay comparison by progressive increment in volume.
46
The same as study site-I, average delay is also one of the performance comparison
parameters used in this study site. Figure-R7 shows a comparison of the three intersection
approaches (existing signalized intersection, the protected intersection and the turbo
roundabout) on the existing volume condition. From the chart we can observe that the
existing design has the highest average delay and the turbo roundabout has the lowest
average delay at the intersection. In this results we can observe that the protected
intersection is also performing better than the existing signalized intersection. Again the
charts on Figure-R8 shows how these three intersections perform on different volume
scenarios. From the charts, we can observe that the existing signalized intersection has the
highest average delay on all scenarios. However, the turbo roundabout had the lowest
average delay until the volume increment reach 75%. After that point the protected
intersection has the lowest average delay. Another important observation in this chart is,
unlike the existing signalized intersection and the turbo roundabout, on the protected
intersection approach the average delay is rather decreasing as the traffic volume increases.
47
5.2.2. Average speed
Figure-R9 Average speed comparison on the existing volume condition.
Figure-R10 Average speed comparison by progressively increasing the volume.
Average speed is also the other similar performance comparison parameter used in this
study site. On Figure-R9, we can see that the turbo roundabout is performing better than the
rest of the two intersection designs on the existing volume condition. The existing signalized
intersection is still the lowest performing intersection in this scenario. In Figure-10, we can
observe again that the existing signalized intersection has the lowest average speed at
intersection on all volume scenarios. Regarding the turbo roundabout, it has the highest
48
average speed until the volume increment reach right before 75%. After that point the
protected intersection has the highest average speed at the intersection. Similarly here on
the protected intersection, the average speed has shown increment as the volume at the
intersection increases.
5.2.3. Total travel time
Figure-R11 Total travel time comparison on the existing volume condition.
Figure-R12 Total travel time comparison by progressive increment in volume.
49
Finally, the total travel time is also the other similar performance parameter used in this
study site. The charts in Figure-R11 and Figure-R12 shows the total travel time comparison
between the three intersection approaches. In this performance parameter, the turbo
roundabout has the all-time lowest total travel time and the protected intersection has the
all-time highest total travel time at intersection on all volume scenarios.
5.2.4. Results summary
From the previous discussions and simulation results, the protected intersection with the
turbo roundabout approach seems to have an overall greater performance. However, we
have seen that the protected intersection design also perform very well on all performance
parameters on all volume scenarios. More interestingly, the protected intersection approach
seems to perform better on scenarios where the traffic volume is higher.
The following summary shows the improved performances on the existing volume condition
by transforming the existing signalized intersection into a protected intersection design and
into a protected intersection that is incorporated with the turbo roundabout consecutively.
On the protected intersection
↓ Average delay is reduced by 10.11% for the existing volume condition.
↑ Average speed is increased by 3.09% for the existing volume condition.
↑ Total travel time has increased by 10.05% for the existing volume condition.
50
On the protected intersection that is incorporated with turbo roundabout
↓ Average delay is reduced by 32.69% for the existing volume condition.
↑ Average speed is increased by 24.72% for the existing volume condition.
↓ Total travel time is reduced by 26.02% for the existing volume condition.
5.2.5. Discussion on safety improvement
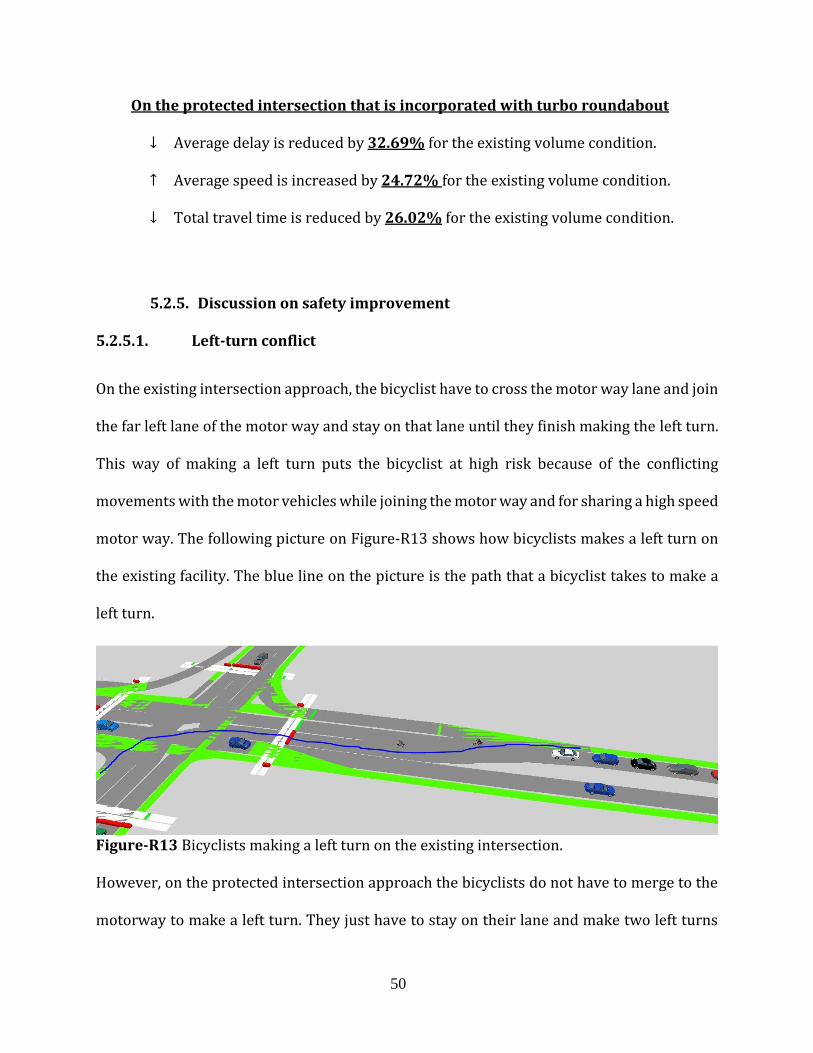
5.2.5.1. Left-turn conflict
On the existing intersection approach, the bicyclist have to cross the motor way lane and join
the far left lane of the motor way and stay on that lane until they finish making the left turn.
This way of making a left turn puts the bicyclist at high risk because of the conflicting
movements with the motor vehicles while joining the motor way and for sharing a high speed
motor way. The following picture on Figure-R13 shows how bicyclists makes a left turn on
the existing facility. The blue line on the picture is the path that a bicyclist takes to make a
left turn.
Figure-R13 Bicyclists making a left turn on the existing intersection.
However, on the protected intersection approach the bicyclists do not have to merge to the
motorway to make a left turn. They just have to stay on their lane and make two left turns
51
using the pedestrian phase. The following picture Figure-R14 illustrates how bicyclists make
a left turn on the protected intersection approach. The blue line on the picture shows the
path that bicyclists have to take to make a left turn on the protected intersection approach.
Figure-R14 A path that a left turning bicyclists have to take on the protected intersection.
So, in the protected intersection approach, the conflict between bicyclist and motor vehicles
on merging zone to make a left turn is eliminated since, the bicyclist always stay on the
bicycle lane.
5.2.5.2. Right-hook
As mentioned in the earlier sections, the protected intersection approach addresses the
right-hook crash issue by increasing the visibility of bicyclists and increasing the sight
distance at the intersection. The protected intersection design also provides a physical
separation between motorway and bicycle way at intersection. The following pictures
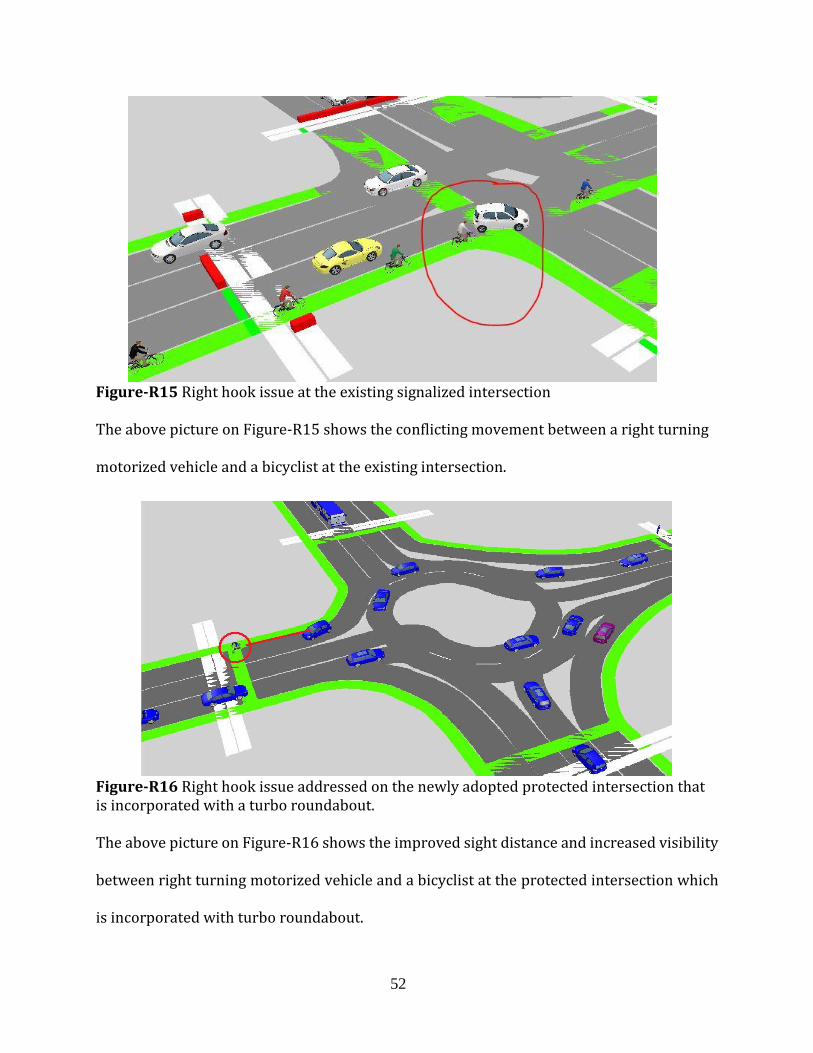
Figure-R15 and Figure-R16 will illustrates the above statement.
52
Figure-R15 Right hook issue at the existing signalized intersection The above picture on Figure-R15 shows the conflicting movement between a right turning
motorized vehicle and a bicyclist at the existing intersection.
Figure-R16 Right hook issue addressed on the newly adopted protected intersection that is incorporated with a turbo roundabout. The above picture on Figure-R16 shows the improved sight distance and increased visibility
between right turning motorized vehicle and a bicyclist at the protected intersection which
is incorporated with turbo roundabout.
53
6. CONCLUSIONS
From the simulation results, the turbo roundabout has shown a good potential in
intersection performance improvement. However, it is debated by different academicians
and professional that turbo roundabout is one of the intersection design approach that list
accommodate pedestrians and bicyclists. The effort of incorporating the turbo roundabout
with the protected intersection design in this project has raised from this point of view. On
study site-II we have seen such a design performing well and even better than the existing
infrastructure.
In this project we have learned that we can improve the safety features of intersections and
intersection approaches without compromising their performance. And we have also seen
that a better intersection design can be achieved by combining the best features of different
intersection designs. On study site-I, which is the NW 23 Ave & NW Vaughn St Intersection,
by transforming the existing signalized intersection into a turbo roundabout: the average
delay has reduced by 85.43%; the average speed has increased by 52.5%; and the total travel
time has reduced by 31.68%. On study site-II, which is the SE 92nd Ave & SE Flavel St
Intersection, by transforming the existing signalized intersection into a protected
intersection design: the average delay has reduced by 10.11%; the average speed has
increased by 3.09%; and the total travel time has increased by 10.05%. Again on study site-
II, by transforming the existing intersection in to the turbo roundabout which is incorporated
with a protected intersection: the average delay has reduced by 32.69%; the average speed
has increased by 24.72%; and the total travel time has reduced by 26.02%. However, these
are just a PTV VISSM simulation results, further studies with different performance
54
parameters and simulation tools should be done in the future since, there are indications
from this project’s simulation results that we can benefit from adopting this design
approaches.
55
7. REFERENCES
1. Roundabouts: An Informal Guide. US department of Transportation, Federal Highway