Page 1
ORIGINAL RESEARCH
A multi-product green supply chain under government supervisionwith price and demand uncertainty
Ashkan Hafezalkotob1 • Soma Zamani1
Received: 15 February 2016 / Accepted: 18 April 2018 / Published online: 5 May 2018� The Author(s) 2018
AbstractIn this paper, a bi-level game-theoretic model is proposed to investigate the effects of governmental financial intervention
on green supply chain. This problem is formulated as a bi-level program for a green supply chain that produces various
products with different environmental pollution levels. The problem is also regard uncertainties in market demand and sale
price of raw materials and products. The model is further transformed into a single-level nonlinear programming problem
by replacing the lower-level optimization problem with its Karush–Kuhn–Tucker optimality conditions. Genetic algorithm
is applied as a solution methodology to solve nonlinear programming model. Finally, to investigate the validity of the
proposed method, the computational results obtained through genetic algorithm are compared with global optimal solution
attained by enumerative method. Analytical results indicate that the proposed GA offers better solutions in large size
problems. Also, we conclude that financial intervention by government consists of green taxation and subsidization is an
effective method to stabilize green supply chain members’ performance.
Keywords Green supply chain � Bi-level programming problem � Uncertainty � Game theory � Genetic algorithm
Introduction
Environmental pollution, especially air pollution, is one of
the obvious environmental health threats in different
countries, contributing to a number of illnesses, such as
asthma, and in some cases leading to premature death
(Ilyas et al. 2010). Also, many of these environmental
impacts have been studied by researchers (Sokolova and
Caballero 2012, 2009). Concerns about the impact of
environmental pollution on health and the economy have
resulted in measures to mitigate emissions of the most
harmful pollutants, such as particle pollution (acids,
organic chemicals, metals, and soil or dust particles) and
ozone (O3), which affects the respiratory system. Despite
national and international interventions and reductions in
major pollutant emissions, the health impacts of environ-
mental pollution are not likely to decrease in the years
ahead, unless proper and drastic action is taken.
However, governments have various policy options for
the aim of recovering environmental condition (water, soil,
and especially air quality), such as imposing strict stan-
dards on air pollutant emissions or managing and super-
vising fuel quality. Many of these policy options have been
studied and analyzed to see whether they are effective in
decreasing environmental pollution (Tolga Kaya and
Kahraman 2011; Roberts 2013; Chen et al. 2013). It is
obvious that in the years to come, the prices of health care
from environmental pollution will become considerable
without adequate efforts. Hence, proper and opportune
environmental policies should be performed in order to
manage and control the environmental issues that cause
harmful effects on human health.
With due attention to the evident facts regarding the
green supply chain (GSC) and green supply chain man-
agement (GSCM) concepts, and its many elements, there
have been various definitions over the years. We will use
& Ashkan Hafezalkotob
[email protected] ; [email protected] ;
[email protected]
Soma Zamani
[email protected]
1 Department of Industrial Engineering, Industrial Engineering
College, Islamic Azad University, South Tehran Branch,
Entezari Alley, Oskoui Alley, Choobi Bridge,
Tehran 1151863411, Iran
123
Journal of Industrial Engineering International (2019) 15:193–206https://doi.org/10.1007/s40092-018-0271-9(0123456789().,-volV)(0123456789().,-volV)
Page 2
the term GSCM in this paper and can define it as a series of
regulations and interventions in the supply chain achieved
by attempting to minimize the environmental impact from
the suppliers to the end users (Basu and Wright 2008). It is
also stated as a win–win strategy, through which economic
benefits can be increased by reducing environmental
impact (Zhu and Cote 2004; Zhu et al. 2008).
In recent years, the field of GSCM has been growing
with an interest from both academia and industry, and
therefore, the literature on this field in various applications
is very diverse. An important point of view in GSCM is
that it is not just about being environment-friendly. It is
also about good business sense and increasing profits. In
other words, the green point of view can serve as a pow-
erful cost reduction tool by eliminating waste. For instance,
in transportation, decreasing vehicle fuel consumption cuts
emissions and saves on fuel costs. Managers of supply
chain (SC) can improve the performance of SC’s processes
while minimizing adverse environmental effects when they
collaborate with environmental managers to improve these
processes. Combining the views of environmental and SC
managers is a natural fit. Indeed, a number of organizations
have been doing it for some time (Wilkerson 2005).
GSCM has an important role in improving global
environments and industrial ecology, but despite this sig-
nificant role, integration of chain member operations stays
challenging and a great part of this problem is a result of
economic motivation deficiency. Though, without govern-
ment supervision and legislation-based enforcement, SC
members, such as manufacturers and suppliers, may only
attempt to reach their business intentions to satisfying end-
customer demands. To these manufacturers and suppliers,
increasing benefits obtained from supplying and producing
green products are negligible.
Accordingly, this work investigates how GSC members
such as manufacturer and supplier act under governmental
intervention with tariff legislation consisting of taxes and
subsidies for both raw materials and final products. In our
model, with the assumption of government financial
supervision to reduce environmental pollution, the supplier
provides raw materials and sales it to the manufacturer,
who produces various products with different levels of
environmental pollution and then sales products to the
market. The market demand for products is assumed to be
uncertain, while the price of raw material and product is
uncertain, too.
The remainder of this paper is organized as follows. The
‘‘Literature review’’ section briefly expresses the related
literature. The ‘‘Mathematical formulation’’ section pre-
sents the proposed problem scope, assumptions, and bi-
level game-based GSCM model. The ‘‘Solution method-
ology’’ section describes steps of genetic algorithm (GA) as
a proposed solution methodology used in this study to
solve the problem. The ‘‘Results and discussion’’ section
deals with the solving procedure of the proposed model and
derives equilibrium solutions to characterize chain member
actions under government financial intervention. Finally,
the ‘‘Conclusions and further study’’ section gives con-
clusions and suggestions for the future research.
Literature review
In this section, we will introduce the literature review of
concepts in this paper, including GSC and GSCM, game
theory and its application to GSC, uncertainties in demand
and price, BLP, and also GA which will be expressed
subsequently.
GSCM has been introduced when issues of improving
long-term economic profits and global environmental
performance have been discussed among researchers in
this field (Sheu et al. 2005). GSCM can be defined as a
combination of environmental and supply chain man-
agement (SCM) activities, including product design,
material selection, manufacturing processes, final product
delivery, and end-of-life product management (Srivastava
2007).
GSC literatures have expressed this fact that GSCM
concentrate on all of SC participants involves from sup-
pliers to manufacturers, customers, and reverse logistics
throughout the so-called closed-loop SC. So, more green
operations, materials, or products might be attained
(Bowen et al. 2001; Zhu and Sarkis 2004; Kumar et al.
2013). The main goal of GSCM is to reduce and hopefully
minimize the global environmental impacts of SC pro-
cesses generated by the whole SC participants from the
suppliers to the end users. It is an effective strategy in
which through decreasing environmental impacts, eco-
nomic benefits can be increased (Zhu and Cote 2004; Zhu
et al. 2008).
Adequate literature exists about a variety of aspects of
GSCM (Carter and Ellram 1998; Srivastava 2007; Seuring
and Muller 2008; Hafezalkotob 2015, 2017). The early
literature focuses on the necessity, exigency, and impor-
tance of GSCM. GSCM began with an emphasis on some
aspects of SCM that were more managerial instead of
technological and not useful, such as logistics (Murphy
et al. 1994; Szymankiewicz 1993), purchasing (Drum-
wright 1994), and reverse logistics (Barnes 1982; Pohlen
and Farris 1992). Also, different kinds of methods and
techniques have been used for problem formulation in this
field, such as linear programming (Fleischmann 2001; Hu
et al. 2002) that is one of the most common methods used
for problem formulation, nonlinear programming (NLP)
(Richter and Dobos 1999; Sarkis and Cordeiro 2001), and
also dynamic programming (Klausner and Hendrickson
194 Journal of Industrial Engineering International (2019) 15:193–206
123
Page 3
2000; Inderfurth et al. 2001; Richter and Weber 2001;
Kiesmuller and Scherer 2003).
In addition, there has been a variety of studies that
investigate game theory application to GSC. Modern game
theory was introduced by Von Neumann and Morgenstern
(1944) when they published ‘‘The Theory of Games and
Economic Behavior.’’ After that, game theory has been
stated as a mathematical and logical methodology to use in
varying research fields, such as SCM, GSCM, economics
and business, marketing, political science, and psychology,
as well as logic and biology. This theory was developed
extensively in the 1950s by many scholars.
Most of the researches on decision-making procedures
of GSC are mainly based on the framework of game
theory (Barari et al. 2012; Katsaliaki et al. 2014). Game
theory has been used in SC problems; in particular,
coordination, economic stability, and the SC efficiency
have been discussed by different authors. In comparison
with SC, game theory applications to GSCM are still
under development.
Savaskan et al. (2004) investigated the game process of
three models that characterize three used product collection
procedures to investigate potential channel decisions and
profits that have been obtained by channel members under
product remanufacturing circumstances. Also, Savaskan
and Van Wassenhove (2006) extended their model for a
relatively more comprehensive closed-loop SC framework
that has one manufacturer and two competing retailers.
Rezaee et al. (2017) presented a model using multi-ob-
jective programming based on the integrated simultaneous
data envelopment analysis–Nash bargaining game. More-
over, Esmaeilzadeh and Taleizadeh (2016) studied the
optimal pricing decisions in a two-echelon supply chain
under two scenarios. Then, the relationships between the
manufacturers and the retailer were modeled by the MS-
Stackelberg and MS-Bertrand game-theoretic approach.
Various researchers have investigated the effects of gov-
ernment intervention on green supply chain. According to
Zhu and Dou (2007), the game model of their study pro-
poses that it would be better for government to increase the
environmental regulations to make organizations and firms
to implement environmental management. Also, Sheu
(2011) investigated the problem of negotiations between
producers and reverse logistics (RL) suppliers for cooper-
ative agreements under government intervention. The
author has concluded that over-intervention by a govern-
ment may result in adverse effects on chain members’
profits and social welfare. The other researches in this
subject can also be stated (Chen and Sheu 2009; Fenglan
2010; Liu et al. 2008; Yali 2010; Gong et al. 2007; Mitra
and Webster 2008; Zhu and Dou 2007; Xiao-xi and Wei-
qing 2012; Mahmoudi et al. 2014; Ghaffari et al. 2016;
Hafezalkotob and Mahmoudi 2017).
According to assumptions about uncertain price and
demand in this study, we introduce some of related studies
subsequently. Uncertainty is expressed as a known and
unknown confidence range of the imperfect information
available at the present state. A large number of literatures
exist about a variety of fields about uncertainties and
among all; demand and price uncertainties are the main
types of uncertainties that affect the operations of the SC.
Some of these studies are declared subsequently.
Li et al. (2009) considered a supply contracting problem
in which the buyer firm faces non-stationary stochastic
price and demand. This study indicated that the selection of
suppliers is particularly affected by price uncertainty.
Moreover, Awudu and Zhang (2013) proposed a stochastic
production planning model for a biofuel SC under demand
and price uncertainties. Demands of end products are
uncertain with known probability distributions, and the
prices of end products follow geometric Brownian motion
(GBM). Benders decomposition (BD) method with Monte
Carlo simulation technique is applied to solve the proposed
stochastic production planning model. In addition, Paul
et al. (2014) developed an EOQ model for a coordinated
two-level SC under energy (gasoline) price uncertainty and
defective items in transshipment. The authors show that as
the gasoline price uncertainty increases, both the total cost
and shipment size increase. So, this indicates that the
gasoline price influences the SC coordination.
To solve problems dealing with uncertainties,
researchers have suggested a number of methods, including
scenario programming (Wullink et al. 2004; Chang et al.
2007), robust optimization (Bertsimas and Thiele 2006;
Leung et al. 2007; Mulvey et al. 1999), stochastic pro-
gramming (Popescu 2007; Santoso et al. 2005), fuzzy
approach (Petrovic et al. 1999; Schultmann et al. 2006;
Liang 2008), and computer simulation and intelligent
algorithms (Kalyanmoy 2001; Coello 2005). No individual
algorithm dominates others, and different strategies are
suitable for different situations. In this study, we utilized
stochastic programming to deal with uncertainties in mar-
ket demand, raw material price, and product price.
Another related field utilized in this study is bi-level
programming problem (BLPP) that includes two players at
different levels that consist of the leader and the follower.
We can regard BLPP as a static version of the noncoop-
erative, two-player game called Stackelberg problem
introduced by Stackelberg (1952). BLP was introduced in
mathematical programming field by Bracken and Mcgill
(1973) in the 1970s and since then various studies have
been done to review the subject (Colson et al. 2007;
Vicente and Calamai 2004). Also, there are several meth-
ods to solve BLPPs that have been used by researchers
such as branch-and-bound method (Bard and Falk 1982),
penalty functions method (Aiyoshi and Shimizu 1981), and
Journal of Industrial Engineering International (2019) 15:193–206 195
123
Page 4
Karush–Kuhn–Tucker (KKT) conditions (Herskovits et al.
2000; Bianco et al. 2009; Li and Wang 2011). In addition,
there have been some evolutionary algorithm studies in this
field (Wang et al. 2005; Li and Wang 2007; Koh 2007;
Wang et al. 2008). In this study, we have transformed the
BLP model into a single-level NLP problem by replacing
the lower-level optimization problem with its KKT
conditions.
Also, a lot of numerical algorithms have been developed
by a number of authors to solve multi-level programming.
So, considering the NP-hardness of BLPP (Hansen et al.
1992), several authors proposed various algorithms to solve
it (Colson et al. 2005; Bard and Moore 1990; Maiti and
Roy 2016).
Candler and Townsley (1982) presented an implicit
enumeration scheme to solve the problem. Bard (1983)
offered a grid search algorithm which exhibits the desirable
property of monotonicity. The proposed algorithm is based
on two sets of necessary conditions developed and com-
bined to provide an operational check for stationarity and
local optimality.
Bard and Moore (1990) presented a branch-and-bound
algorithm based on Kuhn–Tucker conditions to solve the
problem. Gendreau et al. (1996) proposed an adaptive
search method related to the Tabu search meta-heuristic to
solve the linear BLPP. Esogbue (1999) proposed a GA for
a special nonlinear BLP. And Savard and Gauvin (1994)
gave the steepest descent direction for quadratic nonlinear
BLPPs. Several researches used meta-heuristics for BLPP,
such as Li et al. (2005) which developed a new algorithm
based on particle swarm optimization (PSO) to solve
BLPP, which combines two variants of PSO to solve the
upper-level and lower-level programming problems inter-
actively and cooperatively.
The effects of governmental financial intervention on
the cooperation green supply chain are rarely investigated
by pioneering researchers in GSCM and related areas. This
paper presents a multi-product multi-level game-theoretic
green supply chain model with uncertainties in market
demand, material, and product sale price formulated in a
BLPP. This paper considers a single decision variable
named tariff which takes the positive and negative values
to determine tax and subsides, respectively. Since it is not
possible to solve a multi-level model in mathematical terms
because of its NP-hardness, we propose an efficient meta-
heuristic algorithm to solve this problem.
Mathematical formulation
In the process of solving the problem, we regard a decen-
tralized noncooperative decision system in which one lea-
der (government) and two followers with equal position
(supplier and manufacturer) are involved. We assume that
the government and followers may have their own decision
variables and objective functions. Therefore, the followers
could control how to optimize their objective functions and
the government can only control the reactions of followers
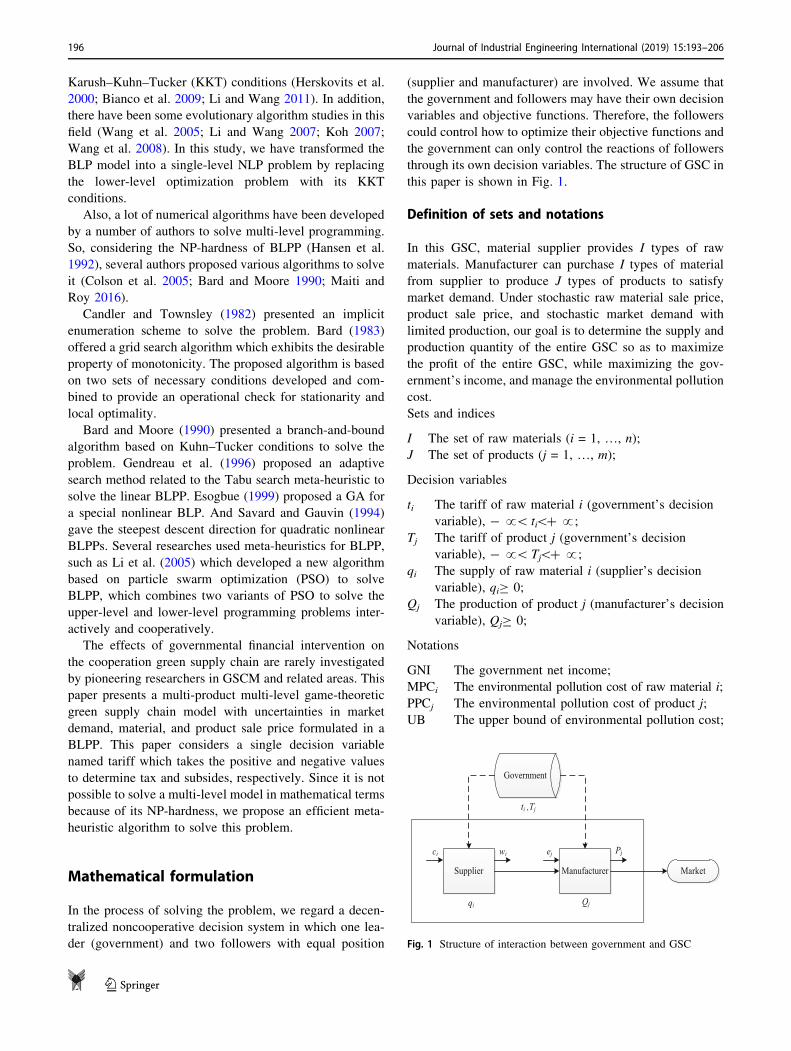
through its own decision variables. The structure of GSC in
this paper is shown in Fig. 1.
Definition of sets and notations
In this GSC, material supplier provides I types of raw
materials. Manufacturer can purchase I types of material
from supplier to produce J types of products to satisfy
market demand. Under stochastic raw material sale price,
product sale price, and stochastic market demand with
limited production, our goal is to determine the supply and
production quantity of the entire GSC so as to maximize
the profit of the entire GSC, while maximizing the gov-
ernment’s income, and manage the environmental pollution
cost.
Sets and indices
I The set of raw materials (i = 1, …, n);
J The set of products (j = 1, …, m);
Decision variables
ti The tariff of raw material i (government’s decision
variable), - !\ ti\? !;
Tj The tariff of product j (government’s decision
variable), - !\ Tj\? !;
qi The supply of raw material i (supplier’s decision
variable), qiC 0;
Qj The production of product j (manufacturer’s decision
variable), QjC 0;
Notations
GNI The government net income;
MPCi The environmental pollution cost of raw material i;
PPCj The environmental pollution cost of product j;
UB The upper bound of environmental pollution cost;
Supplier Manufacturer Market
Government
qi Qj
ti ,Tj
ci wi ej Pj
Fig. 1 Structure of interaction between government and GSC
196 Journal of Industrial Engineering International (2019) 15:193–206
123
Page 5
PS The supplier’s objective function;
~wi The stochastic sale price of raw material i;
ci The total supply expenses per unit for raw material i;
c The constant risk aversion coefficient of supplier;
capsi The supply capacity for raw material i;
PM The manufacturer’s objective function;~Pj The stochastic sale price of product j;
ej The total production expenses per unit for product j;
k The constant risk aversion coefficient of
manufacturer;
capmj The production capacity for product j;
aij The consumption coefficient of raw material i in
product j;~Dj The stochastic market demand of product j;
RS The minimum acceptable profit of supplier;
RM The minimum acceptable profit of manufacturer;
M A very large positive constant;
Assumptions
The goal of this work is to analyze the impact of govern-
mental intervention via green legislation and financial
instrument to persuade GSC members for green product
production. To achieve this goal, several assumptions
involved in this paper are described below.
• Market demand, raw material sale price, and product
sale price are uncertain.
• GSC produces various products with different pollution
levels.
• Model formulation is based on Stackelberg, monopoly
and vertical integration.
ti and Tj as tariff decision variables of government are
considered free decision variables for both raw materials
and final products, respectively. Therefore, we assume
that positive values of ti and Tj represent taxes for raw
materials and final products; similarly, the negative values
of ti and Tj denote subsidies for raw materials and final
products, respectively. Consequently, if the value of tariff
is positive, it works as a profit element for government
and a cost element for GSC members; on the other hand,
if the value of tariff is negative, it would be a cost ele-
ment for government and a profit element for GSC
members.
The MPCi and PPCj represent environmental pollution
cost of raw materials’ procurement and final products’
production, respectively. For generalization purpose of
the model, we do not restrict the environmental pollution
cost of raw materials and final products to specific ele-
ments. They may be all kinds of pollution costs caused
by industrial activities like economic and medical
expenses.
BLP formulation
A bi-level game-based model is constructed in this section
to formulate the problem of interaction between govern-
ment and SC. The optimization process consists of two
levels: (1) an upper-level optimization of the government
income and (2) a lower-level optimization of supplier and
manufacturer profit. First level maximizes the govern-
ment’s objective function to derive the solutions for ti and
Tj.
Second level maximizes the supplier’s profit under
uncertain raw material sale price and also maximizes the
manufacturer’s profit under uncertain product sale price
and market demand. Supplier decides about the amount of
raw material procurement (qi), and similarly, manufacturer
decides about the amount of final product production (Qj).
Now, let us consider government problem first. The
upper-level model is used to optimize the government’s
problem that is formulated as follows:
Max GNI ¼Xn
i¼1
tiqi þXm
j¼1
TjQj ð1Þ
Subject to:
Xn
i¼1
MPCiqi þXm
j¼1
PPCjQj �UBð2Þ
Xn
i¼1
ð �wi � ci � tiÞqi �RS ð3Þ
Xm
j¼1
�Pj � Tj � ej� �
Qj �RM ð4Þ
The government’s objective function is given as Eq. (1).
As described in assumptions, ti and Tj are free decision
variables for the government. Thus, if government assigns
taxes to raw materials and final products, it acts like a profit
element; and if government assigns subsidies to raw
materials and final products, it acts like a cost element.
Further, there are some constraints for the government.
Constraint (2) sets the limitation on environmental pollu-
tion cost. It shows that the environmental cost caused by
raw material procurement and final product manufacturing
cannot exceed a specified upper bound. This upper bound
may change depending on various legislations in different
countries considering their environmental and economic
conditions. Constraints (3) and (4) are individual rationality
constraint (IR) under which supplier and manufacturer
would like to supply raw materials and manufacture final
products, respectively; otherwise, they reject it and with-
draw from the market. These inequalities point out the
GSC members’ interest to have long-term relationships
with government. They express that a minimum profit
Journal of Industrial Engineering International (2019) 15:193–206 197
123
Page 6
should be considered for supplier and manufacturer in any
situation.
The lower-level optimization model of supplier can be
formulated as follows:
Max PS ¼Xn
i¼1
~wi � ci � tið Þqi ð5Þ
Subject to:
qi � capsi; 8ið6Þ
qi � 0; 8i ð7Þ
The supplier provide qi (i =1, 2, …, I) units of the ith
raw material at the cost of ci (i =1, 2, …, I), respectively.
The supplier’s decision variables are raw material pro-
curement qi, and his profit function is given by Eq. (5).
Furthermore, there are some constraints for the supplier,
which includes constraint (6) that indicates procurement
capacity, and constraint (7) that shows raw material pro-
duction’s value is a nonnegative number.
Now let us describe the lower-level optimization model
of manufacturer that can be formulated as follows:
Max PM ¼Xm
j¼1
~Pj � Tj � ej� �
Qj ð8Þ
Subject to:
Xm
j¼1
aijQj � qi; 8i ð9Þ
Qj � ~Dj; 8j ð10Þ
Qj � capmj; 8j ð11Þ
Qj � 0; 8j ð12Þ
The manufacturer purchases qi (i =1, 2, …, I) units of
the ith raw material at the price of wi (i =1, 2, …, I),
respectively, and she manufactures Qj (j =1, 2, …, J) units
of the jth material at the cost and price of ej and pj(j =1, 2, …, J), respectively. Therefore, the manufacturer
decides about production unit Qj to maximize his profit
which is given by Eq. (8). Moreover, manufacturer
encounters with some constraints in production proce-
dures. Constraint (9) indicates this fact that raw material’s
consumption in the process of manufacturing final prod-
ucts cannot be more than the available raw material
provided by the supplier. Constraint (10) states that the
amount of final product’s production must be more than
the uncertain market demand. Constraints (11) and (12)
assure that production quantities are feasible for the
manufacturer.
Product sale price, material sale price,and market demand uncertainties
Demand and price uncertainties are the main types of
uncertainties that affect the operations of the SC. Hence, it
is assumed that the market demand, product price, and raw
material price are uncertain parameters. Raw material price
uncertainty defines the probability that price of a material
might change during the planning horizon. We assume that
sale price of raw material i is represented by a normal
distribution considering mean ( �wi), and variance (ri2) as
follows:
~wi �N �wi; r2i
� �; 8i ð13Þ
Thus, considering the supplier’s risk sensitivity, we
assume that the supplier estimates her utility via the mean–
variance value function of her random profit as follows
(Tsay 2002; Gan et al. 2005; Lee and Schwarz 2007; Xiao
and Yang 2008):
uðPSÞ ¼ EðPSÞ � cVarðPSÞ ð14Þ
Equation (14) expresses that the supplier will make a
trade-off between the mean and the variance of her random
profit. The part cVar(PS) is the risk cost of supplier and cdenotes the attitude of supplier toward uncertainty. The
increscent of c results in an increase in conservativeness in
supplier’s actions. Therefore, we can rewrite Eq. (5) as
follows:
uðPSÞ ¼Xn
i¼1
ð �wi � ci � tiÞqi � cXn
i¼1
r2i q2i
" #ð15Þ
In a similar manner, we assume that sale price of pro-
duct j is represented by a normal distribution considering
mean (�Pj) and variance (rj2) as follows:
~Pj �N �Pj; r2j
� �; 8j ð16Þ
Thus, Eq. (8) can be rewritten as follows:
uðPMÞ ¼Xm
j¼1
ð�Pj � Tj � ejÞQj � kXm
j¼1
r2j Q2j
" #ð17Þ
The third uncertain parameter in this paper is market
demand of final products j. Market demand ~Dj for product j
is normally distributed with known means and variances,
lDjand r2Dj
where
~Dj �N �Dj; r2Dj
� �; 8j ð18Þ
Thus, constraint (10) is reformulated as follows:
Qj � �Dj þ F�1ðajÞrDj; 8j ð19Þ
198 Journal of Industrial Engineering International (2019) 15:193–206
123
Page 7
where aj is the confidence level. That is, if aj = 0.05, then
the manufacturer seeks to satisfy market demand at least
95% of the time and F-1(aj) is the cumulative distribution
function (cdf) of the standard normal distribution.
Reformulation the whole problem as a single-level NLP
As described before, the whole problem is a BLPP that
the government in upper level considered to be the lea-
der. Also, the supplier and manufacturer in second level
regarded as followers. To solve the bi-level programming
problem, a single-level NLP is obtained by replacing the
lower-level problem by its KKT optimality conditions
and further linearizing the complementary terms. It can
be shown that PS and PM are concave functions (refer
to the ‘‘Appendix’’). Such reformulations using KKT
optimality conditions have been well studied for solving
the problems, and after deriving KKT conditions for the
above problem we achieve a single-level nonlinear
problem. The reformulated optimization model is shown
as follows:
Max GNI ¼Xn
i¼1
tiqi þXm
j¼1
TjQj ð20Þ
Subject to:
Xn
i¼1
MPCiqiþXm
j¼1
PPCjQj �UBð21Þ
�Xn
i¼1
ð �wi � ci � tiÞqi � � RS ð22Þ
�Xm
j¼1
ð�Pj � Tj � ejÞQj þXn
i¼1
wiqi � � RM ð23Þ
�wi � ci � ti �Xn
i¼1
ui ¼ 0; 8i ð24Þ
�Pj � Tj � ej � 2k r2j Qj �Xn
i¼1
viaijþXm
j¼1
rj �Xm
j¼1
yj ¼ 0;
8jð25Þ
uiðcapsi � qiÞ ¼ 0; 8i ð26Þ
vi qi �Xm
j¼1
aijQj
!¼ 0; 8i ð27Þ
rj � �Dj � F�1j ðaÞrDj
þ Qj
� �¼ 0; 8j ð28Þ
yj capmj � Qj
� �¼ 0 8j ð29Þ
qi � capsi; 8i ð30ÞXm
j¼1
aijQj � qi; 8i ð31Þ
�Qj � � �Dj � F�1j ðaÞrDj
; 8j ð32Þ
Qj � capmj; 8j ð33Þ
qi � 0; ui; vi � 0; 8i ð34ÞQj � 0; rj; yj � 0; 8j ð35Þ
As the lower-level optimization problem given by (5)–
(11) is concave and continuous, we can replace it with its
KKT conditions and rewrite the proposed bi-level problem
as an NLP given in (20)–(35), where (20)–(23) are the part
corresponding to the former upper level, (24)–(25) are the
derivatives of the Lagrangian of the lower level, (26)–(29)
are the complementarity conditions, and (30)–(35) are the
constraints of the lower level. To simplify the mathemati-
cal model, we linearize Eqs. (26)–(29) by replacing each
one with two linear constraints as follows:
capsi � qi �Msi 8i ð36Þui �Mð1� siÞ 8i ð37Þ
qi �Xm
j¼1
aijQj �Mji 8i ð38Þ
vi �Mð1� jiÞ 8i ð39Þ
� �Dj � F�1j ðajÞrDj
þ Qj �Mfj 8j ð40Þ
rj �Mð1� fjÞ 8j ð41Þ
capmj � Qj �Mhj 8j ð42Þ
yj �Mð1� hjÞ 8j ð43Þ
si; ji 2 f0; 1g 8i ð44Þfj; hj 2 f0; 1g 8i ð45Þ
Solution methodology
Traditional and classical techniques of optimization for an
NLP are not efficient when the practical search space is too
large, and there are too many decision variables. Hence, we
chose a meta-heuristic method (GA) to solve the problem.
GA is a population-based search method that moves from
one set of points called population to another set of points
in a single iteration with probable improvement by using
set of control operators. GA is viewed as function opti-
mizer, though problem ranges to which GA is applied are
quite extensive features (Haupt and Haupt 2004). GA
simulates natural selection, using imitative processes of the
Journal of Industrial Engineering International (2019) 15:193–206 199
123
Page 8
nature such as crossover, mutation, or selection. The GA
begins with generating a random population of solutions to
research the problem’s solution space. This method pro-
duces sequential populations of alternative solutions, until
a solution is found with satisfactory results.
Each GA employs some basic components to solve a given
problem such as chromosome representation, initial popula-
tion production, fitness function, genetic operators, selection
strategy, and parameters values. These ingredients are
described in the following sections. In this study, all of the
parameters are adjusted based on experimental data. The
procedure followed for the GA is explained as follows:
Chromosome representation In the GA, each individual
solution is shown by a chromosome consists of genes. Each
chromosome is called a solution for the optimization
problem, and in this research, each chromosome consists of
I raw material tariff, J product tariff, I raw material pro-
curement, J product production, and four KKT variables,
respectively, as an array with the size of (4I ? 4J) sum-
marized as follows:
t1 … tn … y1 … ym
Initialization Initialization is an essential step for any
evolutionary algorithm. In this research, first we define the
parameters for the GA, including the population size and
the maximum number of iterations. Afterwards, we gen-
erate an initial random population of chromosomes.
Fitness function Fitness function is a function that
assigns a fitness value to the individual chromosome. It
quantifies the optimality of a chromosome so that a par-
ticular solution or chromosome can be ranked against all
other solutions. In this research, this function is same as the
objective function of government, i.e., Eq. (20). As a
result, first we evaluate the fitness value of each chromo-
some in the population and, then, order the fitness values
from the largest to the least.
Selection strategy The plan for selecting chromosomes
to create the next generation is described by selection
strategy. Generally, the beginning operator that applied on
population is selection strategy. There are different selec-
tion strategies that basically perform a same thing. They
choose some chromosomes from current population using
different mechanisms to be the parents of the new gener-
ation. These mechanisms include roulette wheel selection,
tournament selection, rank selection, and some others. In
this research, rank selection is employed. Therefore, we
first rank the population according to their fitness value and
afterwards the specific number of best answers will be
selected for a new generation.
Heuristic operator A proposed heuristic function is used
as an operator before crossover and mutation operators to
produce new offspring. In this operator for each column of
solution matrix (i.e., for each decision variable), we replace
each gene of the column with mean value of the genes in
the higher chromosomes.
Crossover One of the most important mechanisms of
GA is crossover. New offspring is produced by joining
genes of selected parents. If the new offspring gets the best
features from each parent, it may be better than the parents.
In this study, the crossover operates as follows: firstly, a
point (r) is randomly selected for each column of solution
matrix (i.e., for each decision variable); secondly, the genes
are written in reverse from the point (r ? 1) to the last
element in that column. The reason we choose and change
genes from one column is because we should compare
genes (decision variables) with similar ones due to the
different intervals for each decision variable. Afterward,
we check the feasibility of the new offspring; if the new
solution was feasible, we consider it as a part of new
generation.
Mutation Mutation operator makes a new mutated
chromosome by making a random modification. Mutation
operator is used from one generation of population to the
next, to avoid getting trapped in local optimum. In this
study, the mutation operates as follows: first, for each
column of solution matrix (i.e., for each decision variable),
two points (r1, r2) are randomly selected, and then, each
point is replaced by the other one. Subsequently, the fea-
sibility of the new offspring is checked; if the new solution
was feasible, we regard it as a part of new generation.
Termination criterion Termination is the criterion by
which the GA decides to continue searching or stop it. In
this paper, after a fixed number of iterations of the algo-
rithm, it will stop searching and the best produced solution
that has been recorded in the algorithm is reported as the
best solution to NLP by the proposed GA. The pseudocode
for the GA method is represented in Fig. 2.
0t =
( )Initialize G t
( )Evaluate G t
While not doterminate
( ) ( )G t Heuristic G t′ =
( ) ( )G t Crossover G t′′ ′=
( ) ( )G t Mutation G t′′′ ′′=
( )Evaluate G t′′′
( )( 1) )(G t select G t Z′′′= ∪+
1t t= +End of while
End.
Fig. 2 Pseudocode for the proposed GA
200 Journal of Industrial Engineering International (2019) 15:193–206
123
Page 9
In this algorithm, G(t) represents a population of chro-
mosomes in t-th generation, G0(t) displays the population ofchromosomes after implementing heuristic operator and so
on. Also, Z represents a set of chromosomes in the current
generation which is selected by the algorithm.
Results and discussion
In this section, some test problems with different sizes are
solved to show the application of the model as well as
efficiency of its solution algorithm. The sizes of the test
problems are presented in Table 1. The test problems are
solved with different GA parameters including Popsize and
iteration to test the quality of the solutions obtained
through the proposed GA. Moreover, to investigate the
validity and feasibility of the proposed method, small-sized
problems are solved by enumerative method. In this tech-
nique, given that all the decision variables are considered
to be discrete, the whole solution space has been searched
to find the optimal solution for the problem. For small size
problems, the enumerative method provides better results
but with worst computational time. Some larger-size
problems which cannot be solved by enumerative method
are only solved by the proposed GA. The computational
results acquired from the proposed GA with different
Popsize and iteration is displayed in Table 2. Additionally,
results obtained from enumerative method have been
compared with the average of solution values in each type
of problem in Table 3. The authors could not attain results
of enumerative method in problem type III, due to the
length of time. With the propose of summarizing the paper,
the data set used for the test problems in Tables 2 and 3 has
not been presented. But it is available with the authors if
needed. In addition, MATLAB 7.12 is used to implement
the proposed GA and also enumerative method. MATLAB
is a functional software and has been used in different
kinds of fields (Valipour 2014, 2016a, b; Valipour et al.
2013a, b, 2017).
The accuracy of the GA solutions is expressed by the value
of the error percentage in the last column of Table 3 This
error percentage is calculated by the following equation:
% Error ¼ EM solution� GA solution
EM solution� 100
Table 3 clearly indicates that the proposed GA offers
better solutions in large size problems according to com-
putational time. According to the results shown in Table 3,
solutions obtained from the proposed GA and enumerative
method in smaller sizes (2.2) are approximately equal
(* %1.2 error). However, by increasing the size of the
problem (3.3), difference between the solution values in
two different methods is increased at a low rate (* 1.7%).
Based on the solutions presented in Table 3, the proposed
GA can be effectively employed for the large size prob-
lems. As shown in the last column of Table 3, the error
percentage in size 2.2 and 3.3 is under 2%. Also, Fig. 3
compares the best solutions obtained by the proposed GA
and enumerative method in different sizes.
Numerical example
In this section, we solve a numerical example in the field of
gasoline production. In this example, a GSC is taken into
account, including a supplier and a manufacturer. The
supplier procures two raw materials for gasoline production
consisting of benzene and aromatics.
With the global phase out of leaded gasoline, different
additives have replaced the lead compounds. In order to
sustain octane levels in producing gasoline, oil companies
replaced lead with something almost as bad: aromatic
hydrocarbons, or simply aromatics, mainly comprised of
benzene, toluene, and xylene. However, concern over its
negative health effects have led to stringent regulation of
all gasoline’s aromatic compounds. In this study, we con-
sider benzene and aromatics in general, as two individual
gasoline’s raw materials.
Table 1 Test problem sizes
Type Size Number of raw materials Number of products
I 2–2 2 2
II 3–3 3 3
III 4–4 4 4
Table 2 Computational results for GA
Type Size GA
Popsize Iteration Solution values Time (min)
I 2.2 25 25 1325 3.28
I 2.2 25 45 1328 4.40
I 2.2 25 60 1333 5.47
I 2.2 25 70 1330 6.32
II 3.3 25 25 2353 7.02
II 3.3 25 45 2358 8.50
II 3.3 25 60 2375 10.70
II 3.3 25 70 2370 12.62
III 4.4 50 50 3345 13.30
III 4.4 50 60 3375 15.40
III 4.4 50 70 3408 18.78
III 4.4 50 80 3412 22.87
Journal of Industrial Engineering International (2019) 15:193–206 201
123
Page 10
Also, the manufacturer produces gasoline with Euro 2
and Euro 4 standards. European emission regulations for
light-duty and heavy-duty vehicles are commonly referred
to as Euro 2… Euro 6. The Euro standards require vehicle
producers to reduce the exiting polluting emission levels in
a more effective manner by making certain technical
changes in their vehicles. As gasoline quality was required
alongside Euro stages, government should make an attempt
to persuade SC’s members to raise the quality of their
products in order to meet air quality requirements. The goal
is to make GSC members achieve better emission standards
and improve public health. Consequently, in this study
gasoline with Euro 4 standard is considered to be a green
product. Default parameters for government, supplier, and
manufacturer as well as GA are listed below:
UB = 54,000
c = 0.1
k = 0.5
RS = 12,000
RM = 15,000
Iteration= 60
Popsize= 25
Furthermore, other data used for numerical example are
shown in Tables 4, 5, 6 and 7 as follows:
Table 3 Computational results
for GA and enumerative methodType Size GA Enumerative method % Error
Solution values Time (min) Solution values Time (min)
I 2.2 1329 4.87 1345 2136 1.19
II 3.3 2364 9.71 2405 2982 1.70
III 4.4 3385 17.59 – – –
0
500
1000
1500
2000
2500
3000
3500
4000
2,2 3,3 4,4
Obj
ectiv
e fu
nctio
n
Code
GAEnumerative method
Fig. 3 Comparison of objective function value obtained by GA and
enumerative method in different sizes
Table 4 Supply cost, pollution cost, and stochastic raw material sale
price
Raw material Supply cost Pollution cost Sale price
Mean SD
1 71 20 150 1
2 87 10 218 2
Table 5 Production cost, pollution cost, and stochastic product sale
price
Product Production cost Pollution cost Sale price
Mean SD
1 673 600 1000 2
2 894 100 1200 3
Table 6 Supply and production capacity
Supply Production
Raw material Capacity Product Capacity
1 100 1 80
2 90 2 35
Table 7 Consumption coefficient of raw material and product’s
market demand
Product Consumption coefficient of raw material Market demand
1 2 Mean SD
1 0.04 0.80 10 1
2 0.01 0.35 25 2
202 Journal of Industrial Engineering International (2019) 15:193–206
123
Page 11
Numerical analysis
We have implemented the proposed GA to solve the NLP
in the platform of MATLAB 7.12 using information in
Tables 4, 5, 6 and 7 which contain sample data. The best
solution obtained by proposed GA is shown in Table 8 and
its variable values in Table 9.
As expressed before, negative values of ti and Tj state
that government (leader) assigns subsidies to raw materials
procurement and final products production, respectively.
On the other hand, positive values of ti and Tj declare that
government levies green taxes on GSC members. As
shown in the highlighted cells in Table 9, raw material
tariff (t) values and the first product tariff (T) value are
positive and the second product tariff (T) value is negative.
Thus, in this example government should levy green taxes
on both raw materials (benzene and aromatics) and one of
the final products (i.e., gasoline with Euro 2 standard) and,
on the other hand, assigns subsidies to the other final
product (i.e., gasoline with Euro 4 standard).
From the obtained results, we conclude that the objec-
tive value (GNI) is dependent on the maximum permitted
value of environmental pollution cost (UB); therefore, it is
meaningful to examine the sensitivity of approximate
objective value with respect to UB. We choose five values
of UB for a same problem, that is, UB1= 54,000,
UB2= 50,000, UB3= 46,000, UB4= 42,000, and
UB5= 38,000, and calculate the approximate objective
values as shown in Fig. 4. It indicates that the objective
value will decrease with the reduction in the value of UB.
Also, the sensitivity of raw materials and products tariff
values has been examined with respect to UB. It implies
that when UB is decreased, the amount of taxes (i.e.,
positive values of tariff) assigned to regular raw materials
and final products is increased and also the amount of
subsides (i.e., negative values of tariff) assigned to green
ones is intensified by the government to persuade GSC
members to raise the quality of their products. These
results are displayed in Figs. 5 and 6. From the obtained
results, we conclude that the proposed GA offers better
solutions in large size problems according to computational
time. Also, the error percentage in all sizes is under 2%.
Therefore, the results obtained from the proposed method
are completely accurate.
Conclusions and further study
The modeling in this study focused on Stackelberg game
between the government as a leader and the GSC members
(supplier and manufacturer) as followers. To solve the bi-
level game-theoretic model, a GA was designed to resolve
the single-level model obtained from KKT conditions for
the lower level. Feasibility and validity of the proposed
method were evaluated by solving several test problems
using enumerative method and comparing them with
results of the proposed GA. In addition, the results indi-
cated that the computational time in the proposed GA is
considerably lesser than that in enumerative method. The
proposed method for bi-level GSC has attained its objec-
tives including the maximization of government net
income considering the environmental pollution cost, as
well as the maximization of supplier and manufacturer
income in the second level of the bi-level plan. Imple-
menting the proposed GA approach for bi-level Stackel-
berg game-based GSC model, we determined the values of
green taxes and subsides (using tariff decision variable) by
which government financial and environmental interven-
tion could be planned and also GSC members could decide
about procurement and production values for green and
non-green products.
There are many other aspects, which should be explored
in the future studies. For example, more than two members
can be considered for GSC such as retailer and distributer.
Also, we can utilize a multi-objective model with consid-
ering government net income and environmental pollution
cost as objectives and then solve the model by the use of
multi-objective GA or other suitable methods. Another
future study could be developing the model by considering
more than one GSC.
Open Access This article is distributed under the terms of the Creative
Commons Attribution 4.0 International License (http://creative
commons.org/licenses/by/4.0/), which permits unrestricted use, dis-
tribution, and reproduction in any medium, provided you give
appropriate credit to the original author(s) and the source, provide a
link to the Creative Commons license, and indicate if changes were
made.
Appendix
This appendix contains the proof of the concavity of PS
and PM. According to (Bazaraa et al. 2006), PS and PM
are concave if and only if their Hessian matrix is negative
semidefinite (NSD), that is, we have dtHPSd� 0 and
dtHPMd� 0 for all d 2 Rn; d 6¼ 0. Thus, we prove their
concavity as follows.
Table 8 Best solution
Government net
income (objective
value)
Environmental
pollution cost
Supplier and
manufacturer profit
Supplier Manufacturer
1333 53,700 14,500 18,170
Journal of Industrial Engineering International (2019) 15:193–206 203
123
Page 12
For supplier objective function we have:
dtHPSd ¼ d1 � � � dnð Þ
�2cr21 0 . . . 0
..
. . .. ..
.
0 � � � 0 �2cr2n
0
BB@
1
CCA
d1
..
.
dn
0
BB@
1
CCA
¼ �ð2cÞ r21d21 þ � � � þ r2nd
2n
� �� 0
It is obvious that dtHPSd� 0. So, supplier’s Hessian
matrix (HPS) is negative semidefinite. Therefore, PS is
concave. Similarly, for manufacturer objective function we
have:
dtHPMd ¼ d1 � � � dmð Þ
�2kr21 0 . . . 0
..
. . .. ..
.
0 � � � 0 �2kr2m
0
BB@
1
CCA
d1
..
.
dm
0
BB@
1
CCA
¼ �ð2kÞ r21d21 þ � � � þ r2md
2m
� �� 0
It is obvious that dtHPMd� 0. So, manufacturer’s Hes-
sian matrix (HPM) is negative semidefinite. Therefore, PM
is concave.
References
Aiyoshi E, Shimizu K (1981) Hierarchical decentralized systems and
its new solution by a barrier method. IEEE Tran Syst Man
Cybern 11:444–449
Awudu I, Zhang J (2013) Stochastic production planning for a biofuel
supply chain under demand and price uncertainties. Appl Energy
103:189–196
Barari S, Agarwal G, Zhang WJ, Mahanty B, Tiwari MK (2012) A
decision framework for the analysis of green supply chain
contracts: an evolutionary game approach. Expert Syst Appl
39(3):2965–2976
Bard JF (1983) An algorithm for solving the general bilevel
programming problem. Math Oper Res 8:260–272
Bard J, Falk J (1982) An explicit solution to the multi-level
programming problem. Comput Oper Res 9:77–100
Bard JT, Moore JT (1990) The mixed integer linear bilevel
programming problem. Oper Res 38:911–921
Barnes JH (1982) Recycling: a problem in reverse logistics.
J Macromark 2(2):31–37
Basu R, Wright JN (2008) Total supply chain management. Butter-
worth-Heinemann, London
Bazaraa MS, Sherali HD, Shetty CM (2006) Nonlinear programming:
theory and algorithms, 3rd edn. Wiley, Hoboken, pp 113–114
Bertsimas D, Thiele A (2006) A robust optimization approach to
inventory theory. Oper Res 54(1):150–168
Table 9 Variable values for the best solution
Raw material Raw material variables Product Product variables
Raw material supply (q) Raw material tariff (t) Product manufacture (Q) Product tariff (T)
1 100 5 1 79 7
2 90 5 2 34 - 5
1000
1100
1200
1300
1400
1500
UB1 UB2 UB3 UB4 UB5
obje
ctiv
e fu
nctio
n
UB
Fig. 4 Ssensitivity of objective value with different UB
0123456789
UB1 UB2 UB3 UB4 UB5
raw
mat
eria
l tar
iff
UB
t1t2
Fig. 5 Sensitivity of raw materials tariff with different UB
-10
-5
0
5
10
15
UB1 UB2 UB3 UB4 UB5prod
uct t
ariff
UB
T1T2
Fig. 6 Sensitivity of products tariff with different UB
204 Journal of Industrial Engineering International (2019) 15:193–206
123
Page 13
Bianco L, Caramia M, Giordani S (2009) A bilevel flow model for
hazmat transportation network design. Transp Res C Emerg
17(2):175–196
Bowen FE, Cousin PD, Lamming RC, Faruk AC (2001) The role of
supply management capabilities in green supply. Prod Oper
Manag 10(2):174–189
Bracken J, McGill J (1973) Mathematical programs with optimization
problems in the constraints. Oper Res 21:37–44
Candler W, Townsley R (1982) A linear two-level programming
problem. Comput Oper Res 9:59–76
Carter CR, Ellram LM (1998) Reverse logistics—a review of the
literature and framework for future investigation. Bus Logist
19(1):85–102
Chang MS, Tseng YL, Chen JW (2007) A scenario planning approach
for the flood emergency logistics preparation problem under
uncertainty. Transp Res E Logist 43(6):737–754
Chen YJ, Sheu JB (2009) Environmental-regulation pricing strategies
for green supply chain management. Transp Res E Logist
45(5):667–677
Chen Y, Jin GZ, Kumar N, Shi G (2013) The promise of Beijing:
evaluating the impact of the 2008 Olympic Games on air quality.
J Environ Econ Manag 66(3):424–443
Coello CAC (2005) An introduction to evolutionary algorithms and
their applications. Advanced distributed systems. Springer,
Berlin
Colson B, Marcotte P, Savard G (2005) Bilevel programming: a
survey. 4OR-Q J Oper Res 3:87–107
Colson B, Marcotte P, Savard G (2007) An overview of bilevel
optimization. Ann Oper Res 153:235–256
Drumwright M (1994) Socially responsible organisational buying:
environmental concern as a noneconomic buying criterion.
J Market 58(8):1–19
Esmaeilzadeh A, Taleizadeh AA (2016) Pricing in a two-echelon
supply chain with different market powers: game theory
approaches. J Ind Eng Int 12:119
Esogbue AO (1999) Cluster validity for fuzzy criterion clustering.
Comput Math Appl 37(11–12):95–100
Fenglan L (2010) An analysis of the dynamic game model between
government and enterprises of green supply chain. In: Interna-
tional conference on management and service science (MASS),
pp 1–4
Fleischmann M (2001) Quantitative models for reverse logistics.
Springer, Berlin
Gan XH, Sethi SP, Yan HM (2005) Channel coordination with a risk-
neutral supplier and a downside-risk-averse retailer. Prod Oper
Manag 14(1):80–89
Gendreau M, Marcotte P, Savard G (1996) A hybrid Tabu_Ascent
algorithm for the linear bilevel programming problem. J Global
Optim 9:1–14
Ghaffari M, Hafezalkotob A, Makui A (2016) Analysis of imple-
mentation of Tradable Green Certificates system in a competitive
electricity market: a game theory approach. J Ind Eng Int
12(2):185–197
Gong Y, Tang J, Chen J (2007) A dynamic game analysis on the
incomplete information in enterprises’ reverse logistics. In:
International conference on transportation engineering,
pp 533–538
Hafezalkotob A (2015) Competition of two green and regular supply
chains under environmental protection and revenue seeking
policies of government. Comput Ind Eng 82:103–114
Hafezalkotob A (2017) Competition, cooperation, and coopetition of
green supply chains under regulations on energy saving levels.
Transp Res Part E 97:228–250
Hafezalkotob A, Mahmoudi R (2017) Selection of energy source and
evolutionary stable strategies for power plants under financial
intervention of government. J Ind Eng Int 13(3):357–367
Hansen B, Jaumard B, Savard G (1992) New branch and bound rules
for linear bilevel programming. SIAM J Sci Stat Comput
13:1194–1217
Haupt RL, Haupt SE (2004) Practical GAs, 2nd edn. Wiley, New
Jersey
Herskovits J, Leontiev A, Dias G, Santos G (2000) Contact shape
optimization: a bilevel programming approach. Struct Multidis-
cip Optim 20:214–221
Hu L, Cao Y, Cheng C, Shao H (2002) Sampled-data control for time-
delay systems. J Franklin Inst 339:231–238
Ilyas SZ, Khattak AI, Nasir SM, Qurashi T, Durrani R (2010) Air
pollution assessment in urban areas and its impact on human
health in the city of Quetta, Pakistan. Clean Technol Environ
Policy 12:291–299
Inderfurth K, de Kok AG, Flapper SDP (2001) Product recovery in
stochastic remanufacturing system with multiple reuse options.
Eur J Oper Res 133:130–152
Kalyanmoy D (2001) Multi-objective optimization using evolutionary
algorithms. Wiley, New York
Katsaliaki K, Mustafee N, Kumar S (2014) A game-based approach
towards facilitating decision making for perishable products: an
example of blood supply chain. Expert Syst Appl
41(9):4043–4059
Kiesmuller GP, Scherer CW (2003) Computational issues in a
stochastic nite horizon one product recovery inventory model.
Eur J Oper Res 146(3):553–579
Klausner M, Hendrickson CT (2000) Reverse logistics strategy for
product take-back. Interfaces 30:156–165
Koh A (2007) Solving transportation bi-level programs with differ-
ential evolution. In: 2007 IEEE congress on evolutionary
computation (CEC-2007), pp 2243–2250
Kumar S, Luthra S, Haleem A (2013) Customer involvement in
greening the supply chain: an interpretive structural modeling
methodology. J Ind Eng Int 9:6
Lee JY, Schwarz LB (2007) Leadtime reduction in a (Q, r) inventory
system: an agency perspective. Int J Prod Econ 105:204–212
Leung SCH, Tsang SOS, Ng WL, Wu Y (2007) A robust optimization
model for multi-site production planning problem in an uncertain
environment. Eur J Oper Res 181(1):224–238
Li H, Wang Y (2007) A GA for solving a special class of nonlinear
bilevel programming problems. In: Shi Y, Albada G, Dongarra J,
Sloot P (eds) Computational science AI ICCS 2007, Lecture
notes in computer science, vol 4490, pp 1159–1162
Li H, Wang Y (2011) An evolutionary algorithm with local search for
convex quadratic bilevel programming problems. Appl Math Inf
Sci 5(2):139–146
Li H, Zhang A, Zhao M, Xu Q (2005) Particle swarm optimization
algorithm for FIR digital filters design. Acta Electron Sin
33(7):1338–1341
Li S, Murat A, Huang W (2009) Selection of contract suppliers under
price and demand uncertainty in a dynamic market. Eur J Oper
Res 198(3):830–884
Liang TF (2008) Integrating production-transportation planningdecision with fuzzy multiple goals in supply chains. Int J Prod
Res 46(6):1477–1494
Liu, M., Ye, H., Qi, X., Shui, W. (2008). Analysis on trilateral game
of green supply chain. In: Logistics: the emerging frontiers of
transportation and development in China, pp 575–581
Mahmoudi R, Hafezalkotob A, Makui A (2014) Source selection
problem of competitive power plants under government inter-
vention: a game theory approach. J Ind Eng Int 10:59
Maiti SK, Roy SK (2016) Multi-choice stochastic bi-level program-
ming problem in cooperative nature via fuzzy programming
approach. J Ind Eng Int 12:287
Mitra S, Webster S (2008) Competition in remanufacturing and the
effects of government subsidies. Int J Prod Econ 111(2):287–298
Journal of Industrial Engineering International (2019) 15:193–206 205
123
Page 14
Mulvey JM, Vanderbei RJ, Zenios SA (1999) Robust optimization of
large-scale systems. Oper Res 43(2):264–281
Murphy PR, Poist RF, Braunschweig CD (1994) Management of
environmental issues in logistics: current status and future
potential. Transp J 34(1):48–56
Paul S, Wahab MIM, Cao XF (2014) Supply chain coordination with
energy price uncertainty, carbon emission cost, and product
return. Int Ser Oper Res Manag Sci 197:179–199
Petrovic D, Roy R, Petrovic R (1999) Supply chain modeling using
fuzzy sets. Int J Prod Econ 59(1–3):443–453
Pohlen TL, Farris MT (1992) Reverse logistics in plastics recycling.
Int J Phys Distrib Logist Manag 22(7):35–47
Popescu I (2007) Robust mean–covariance solutions for stochastic
optimization. Oper Res 55(1):98–112
Rezaee MJ, Yousefi S, Hayati J (2017) A multi-objective model for
closed-loop supply chain optimization and efficient supplier
selection in a competitive environment considering quantity
discount policy. J Ind Eng Int 13:199
Richter K, Dobos I (1999) Analysis of EOQ repair and waste disposal
problem with integer setup. Int J Prod Econ 59:463–467
Richter K, Weber J (2001) The reverse Wagner/Whitin model with
variable manufacturing and remanufacturing cost. Int J Prod
Econ 71:447–456
Roberts S (2013) Have the short-term mortality effects of particulate
matter air pollution changed in Australia over the period
1993–2007? Environ Pollut 182:9–14
Santoso T, Ahmed S, Goetschalckx M, Shapiro A (2005) A stochastic
programming approach for supply chain network design under
uncertainty. Eur J Oper Res 167(1):96–115
Sarkis J, Cordeiro J (2001) An empirical evaluation of environmental
efficiencies and firm performance: pollution prevention versus
end-of pipe practice. Eur J Oper Res 135:102–113
Savard G, Gauvin J (1994) The steepest descent direction for
nonlinear bilevel programming problem. Oper Res Lett
15:265–270
Savaskan RC, Van Wassenhove LN (2006) Reverse channel design:
the case of competing retailers. Manage Sci 52(1):1–14
Savaskan RC, Bhattacharya A, Van Wassenhove LN (2004) Closed-
loop supply chain models with product remanufacturing. Man-
age Sci 50(2):239–252
Schultmann F, Frohling M, Rentz O (2006) Fuzzy approach for
production planning and detailed scheduling in paints manufac-
turing. Int J Prod Res 44(8):1589–1612
Seuring S, Muller M (2008) From a literature review to a conceptual
framework for sustainable supply chain management. J Clean
Prod 16(15):1699–1710
Sheu JB (2011) Bargaining framework for competitive green supply
chains under governmental financial intervention. Transp Res E
Logist 47:573–592
Sheu JB, Chou YH, Hu CC (2005) An integrated logistics operational
model for green-supply chain management. Transp Res E Logist
41(4):287–313
Sokolova MV, Caballero AF (2009) Modeling and implementing an
agent-based environmental health impact decision support
system. Expert Syst Appl Part 2 36(2):2603–2614
Sokolova MV, Caballero AF (2012) Evaluation of environmental
impact upon human health with DeciMaS framework. Expert
Syst Appl 39(3):3469–3483
Srivastava SK (2007) Green supply-chain management: a state-of-
the-art literature review. Int J Manag Rev 9(1):53–80
Stackelberg HV (1952) The theory of the market economy. Oxford
University Press, Oxford
Szymankiewicz J (1993) Going green: the logistics Dilemma. Logist
Inf Manag 6(3):36–43
Tolga Kaya T, Kahraman C (2011) An integrated fuzzy AHP-
ELECTRE methodology for environmental impact assessment.
Expert Syst Appl 38(7):8553–8562
Tsay AA (2002) Risk sensitivity in distribution channel partnerships:
implications for manufacturer return policies. J Retail 78:147–160
Valipour M (2014) Application of new mass transfer formulae for
computation of evapotranspiration. J Appl Water Eng Res
2(1):33–46
Valipour M (2016a) How much meteorological information is
necessary to achieve reliable accuracy for rainfall estimations?
Agriculture 6(4):53
Valipour M (2016b) Variations of land use and irrigation for next
decades under different scenarios. Irriga Braz J Irrig Drain
1(1):262–288
Valipour M, Banihabib ME, Behbahani MR (2013a) Comparison of
the ARMA, ARIMA, and the autoregressive artificial neural
network models in forecasting the monthly inflow of Dez dam
reservoir. J Hydrol 476:433–441
Valipour M, Mousavi M, Valipour R, Rezaei E (2013b) A new
approach for environmental crises and its solutions by computer
modeling. In: The 1st international conference on environmental
crises and its solutions, at Kish Island, Iran
Valipour M, Gholami Sefidkouhi MA, Raeini-Sarjaz M (2017)
Selecting the best model to estimate potential evapotranspiration
with respect to climate change and magnitudes of extreme
events. Agric Water Manag 180(A):50–60
Vicente LN, Calamai PH (2004) Bilevel and multilevel programming:
a bibliography review. J Global Optim 5(3):291–306
Von Neumann J, Morgenstern O (1944) Theory of games and
economic behavior. Princeton University Press, Princeton
Wang Y, Jiao YC, Li H (2005) An evolutionary algorithm for solving
nonlinear bilevel programming based on a new constraint-
handling scheme. IEEE Tran Syst Man Cybern C 35(2):221–232
Wang G, Wan Z, Wang X, Lv Y (2008) GA based on simplex method
for solving linear-quadratic bilevel programming problem.
Comput Math Appl 56(10):2550–2555
Wilkerson T (2005) Can one green deliver another? Harvard Business
School Publishing Corporation. http://www.supplychainstrategy.
org/. Accessed 15 Jan 2018
Wullink G, Gademann AJRM, Hans EW, Van Harten A (2004)
Scenario-based approach for flexible resource loading under
uncertainty. Int J Prod Res 42(24):5079–5098
Xiao T, Yang D (2008) Price and service competition of supply
chains with risk-averse retailers under demand uncertainty. Int J
Prod Econ 114:187–200
Xiao-xi W, Wei-qing X (2012) Evolutionary game analysis of the
reverse supply chain based on the government subsidy mecha-
nism. In: Second international conference on business computing
and global informatization (BCGIN), pp 99–102
Yali LU (2010) Research on evolutionary mechanisms of green
supply chain constraints by macro-environment. In: ICLEM,
pp 1009–1016
Zhu QH, Cote RP (2004) Integrating green supply chain management
into an embryonic eco industrial development: a case study of
the Guitang Group. J Clean Prod 12:1025–1035
Zhu Q, Sarkis J (2004) Relationships between operational practices
and performance among early adopters of green supply chain
management practices in Chinese manufacturing enterprises.
J Oper Manag 22(3):265–289
Zhu QH, Dou YJ (2007) Evolutionary game model between
governments and core enterprises in greening supply chains.
Syst Eng Theory Pract 27(12):85–89
Zhu QH, Sarkis J, Lai KH (2008) Confirmation of a measurement
model for green supply chain management practices implemen-
tation. Int J Prod Econ 111:261–273
206 Journal of Industrial Engineering International (2019) 15:193–206
123