A MODEL FOR BIOACCUMULATION OF HEAVY METAL IN THE AMERICAN OYSTER (Crassostrea virginica) FROM APALACHICOLA BAY Environmental Sciences Institute Florida A&M University, Tallahassee, Florida By Dennis A. Apeti Do not disseminate without author authorization
Transcript
A MODEL FOR BIOACCUMULATION OF HEAVY
METAL IN THE AMERICAN OYSTER (Crassostrea
virginica) FROM APALACHICOLA BAY
Environmental Sciences Institute
Florida A&M University, Tallahassee, Florida
By
Dennis A. Apeti
Do not
disse
minate
withou
t auth
or au
thoriz
ation
(NOAA ,2004)
APALACHICOLA, FL: Landings by Year
Year Millions of Pounds Millions of Dollars
2003 5.1 8.8
2002 5.6 9.2
2001 6.2 10.9
2000 10.3 11.4
1999 6.8 10.3
Background
Do not
disse
minate
withou
t auth
or au
thoriz
ation
• Oyster Bioaccumulation Model (OBM)
• Adapted from FGETS (Barber et al. 1991)
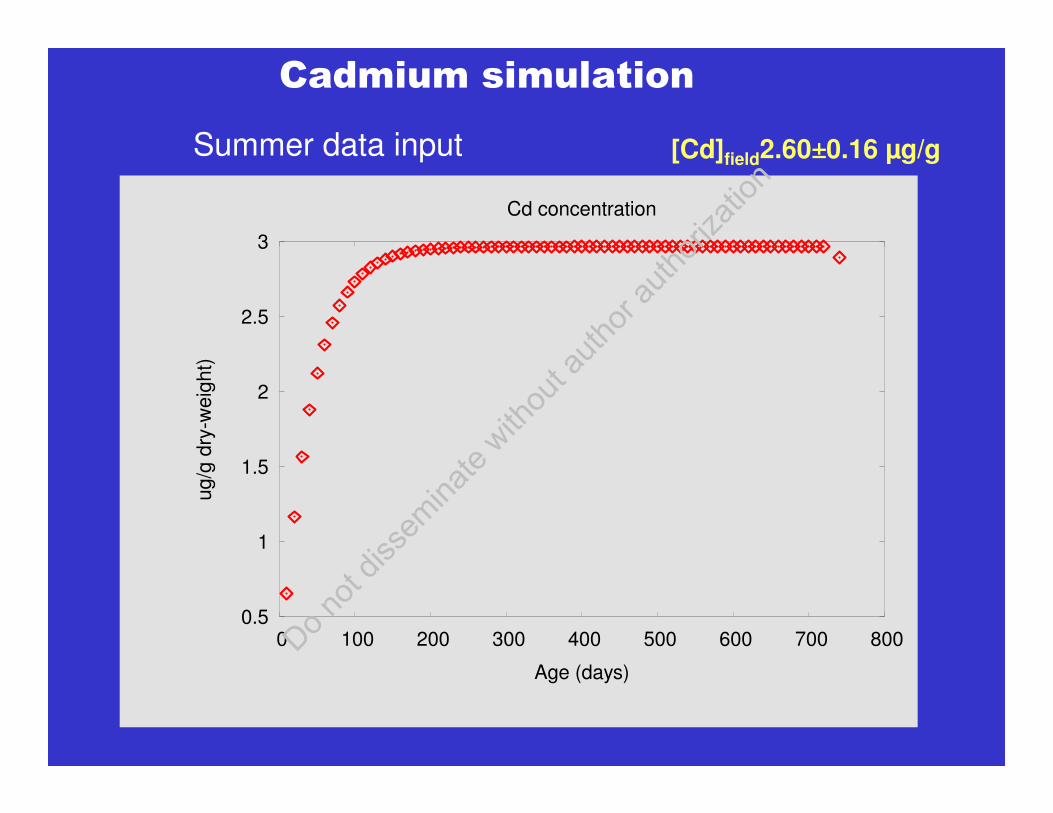
• The main objective: determine long-term BAF factor for Cd and Zn using Crassostrea virginica in Apalachicola Bay.
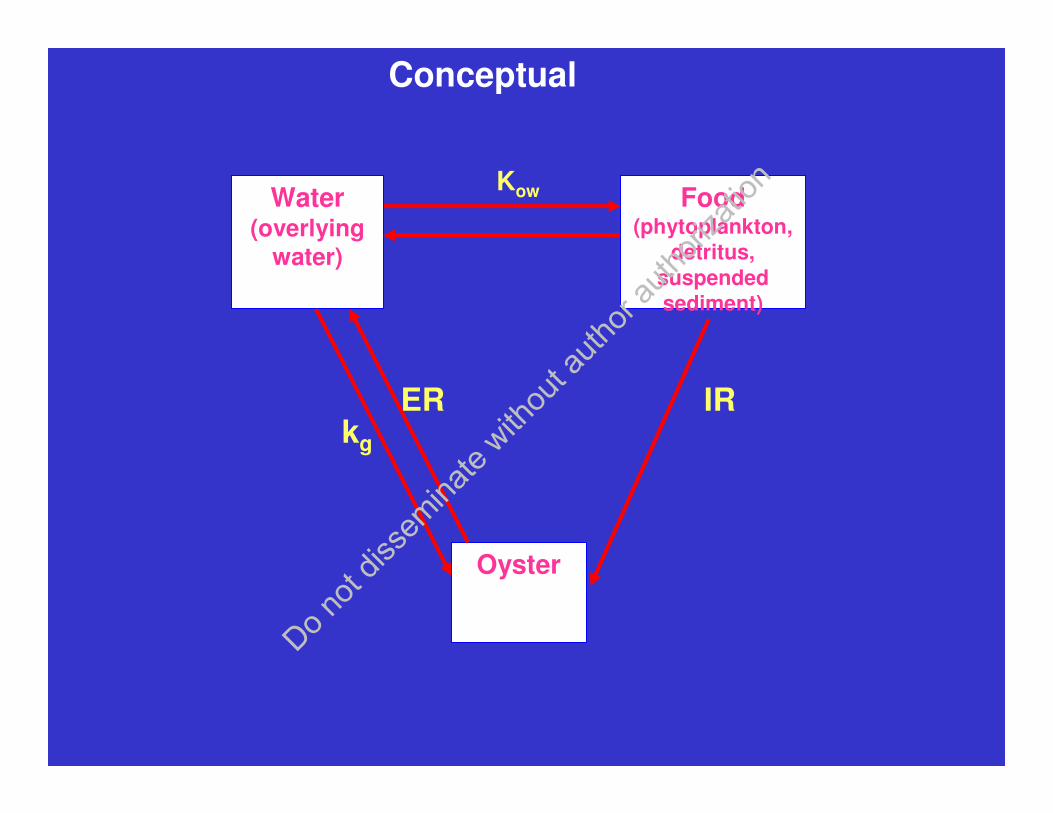
The ModelThe ModelThe ModelThe Model
Do not
disse
minate
withou
t auth
or au
thoriz
ation
IR
KowWater(overlying
water)
Food(phytoplankton,
detritus,
suspended
sediment)
Oyster
ERkg
Conceptual
Do not
disse
minate
withou
t auth
or au
thoriz
ation
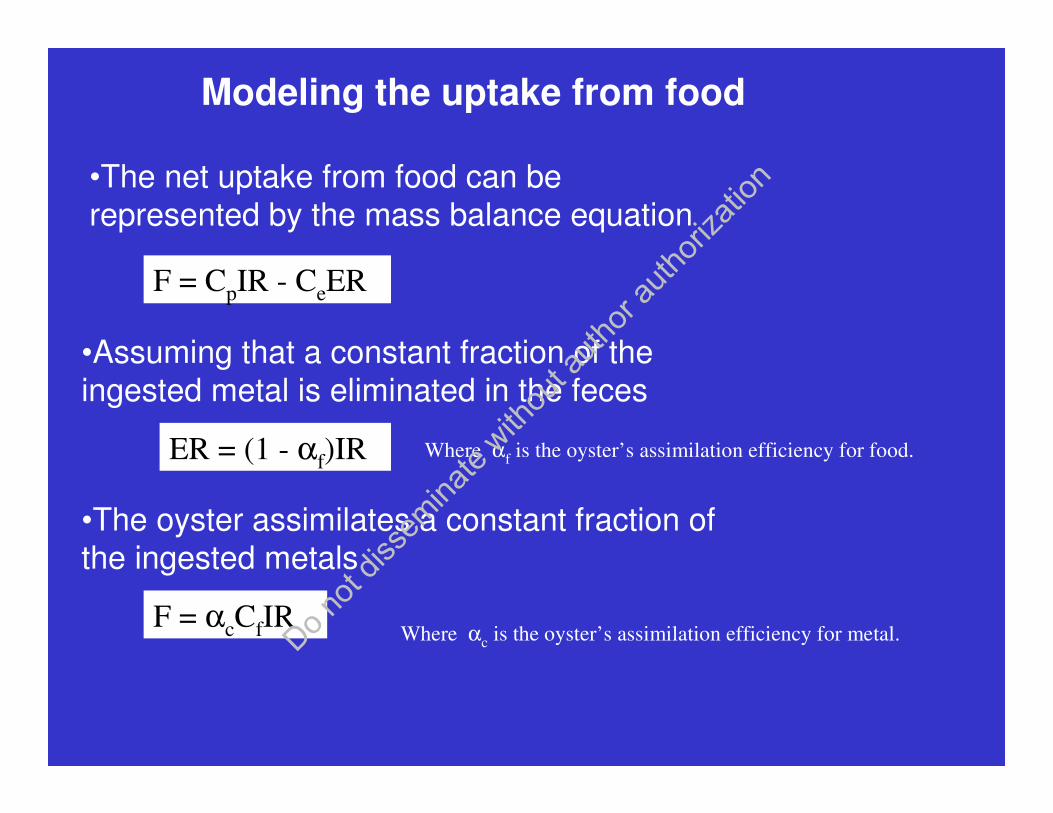
RERIRdt
dW−−=
W
BCi =
FGdt
dB+=
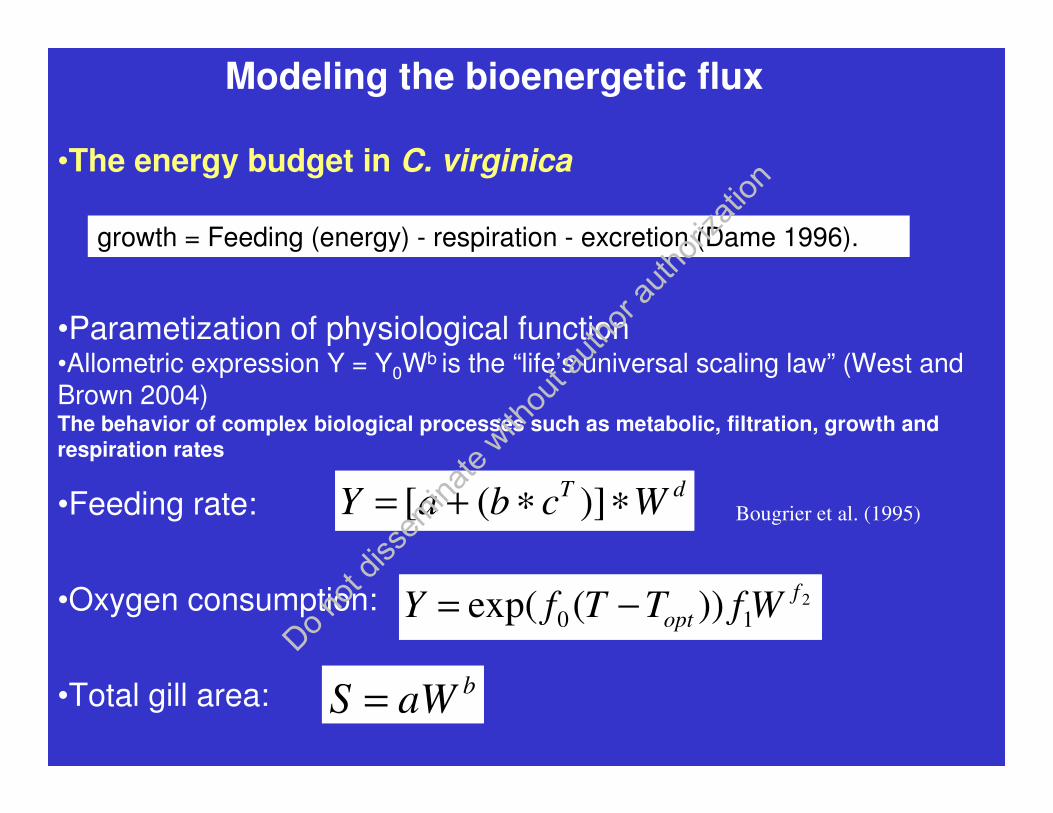
•The model is therefore composed of terms involving oyster weight, bioenergetics and
physiological parameters, metal physico-chemical characteristics
•Total body concentration
•Bioenergetics flux in C. virginica
•Total body burden of metal
Model Formulation
Do not
disse
minate
withou
t auth
or au
thoriz
ation
Modeling uptake from water
G = Sgkg (Cw – Ct)
•Exchange across the gill G: Fick’s first law of diffusion
• Assess seasonal fluctuations of heavy metals in bay
• Investigate the correlations between elemental
concentrations in the bivalve, in water column and in the sediment.
• Develop a computer model to simulate a long-term
bioaccumulation of metal in the oysterDo not
disse
minate
withou
t auth
or au
thoriz
ation
Work Outline
•Assessment of metal concentrations in water, sediment and oyster tissue
•Modeling Heavy Metals (Cd, Zn) Bioaccumulation in C. virginica
Do not
disse
minate
withou
t auth
or au
thoriz
ation
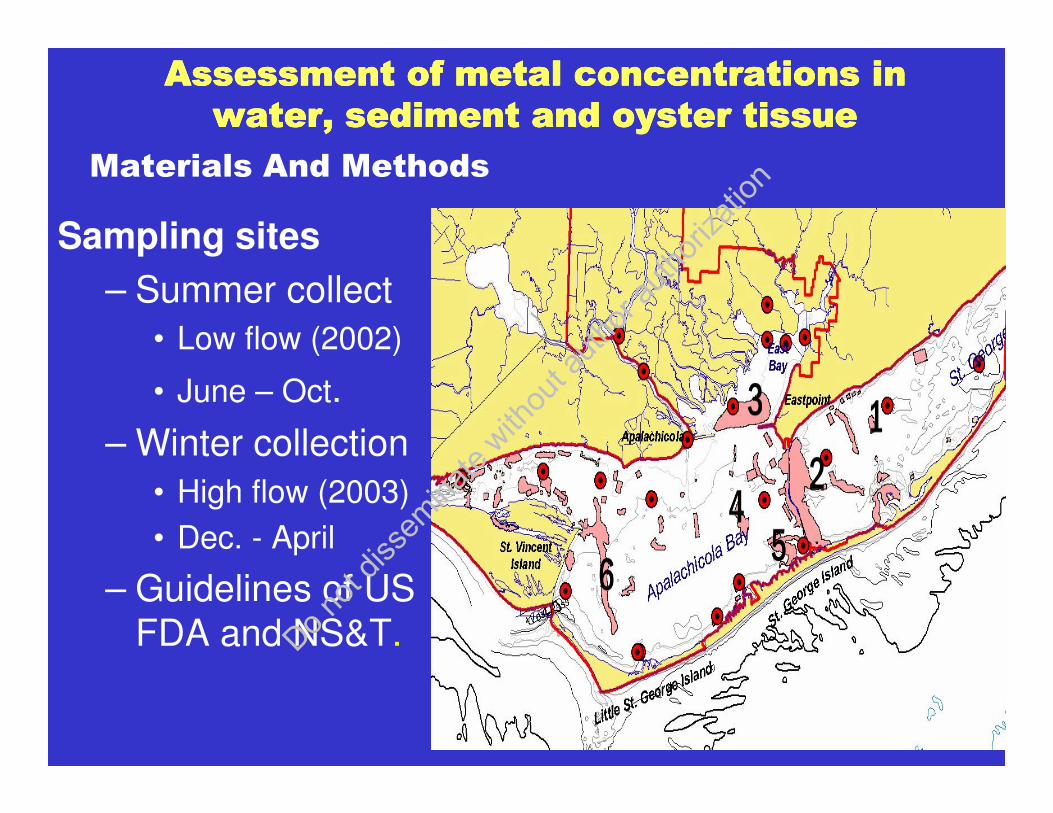
Materials And Methods
Sampling sites
– Summer collect
• Low flow (2002)
• June – Oct.
– Winter collection
• High flow (2003)
• Dec. - April
– Guidelines of US
FDA and NS&T.
Assessment of metal concentrations in Assessment of metal concentrations in Assessment of metal concentrations in Assessment of metal concentrations in
water, sediment and oyster tissuewater, sediment and oyster tissuewater, sediment and oyster tissuewater, sediment and oyster tissue
Do not
disse
minate
withou
t auth
or au
thoriz
ation
Sample collections and preparations• Water
– Vertical water sampler at depth of 3 feet
– Water quality
•Sediment
–Gravity corer
–Sediments (top 10 cm)
–Homogenized and freeze dried
•Oyster
–Oyster tong.
–Composite of 10 animals
shell length
3”-3.5”
Do not
disse
minate
withou
t auth
or au
thoriz
ation
Analysis
• Water/Particulate analysis
– Digestion: EPA Method 3020A
– Analysis GFAAS: EPA 200.12
– SRM: 3108 Cd, 3114 Cu, 3128 Pb and 3168 Zn
• Tissue/sediment analysis
– Digestion: EPA Method 3050B
– FAAS QC standards within 10%
– SRM: 1566b, 1646a
• Grain size analysis: Bouyoucos Hydrometer
• Organic Matter: Loss-On-Ignition (LOI)
Do not
disse
minate
withou
t auth
or au
thoriz
ation
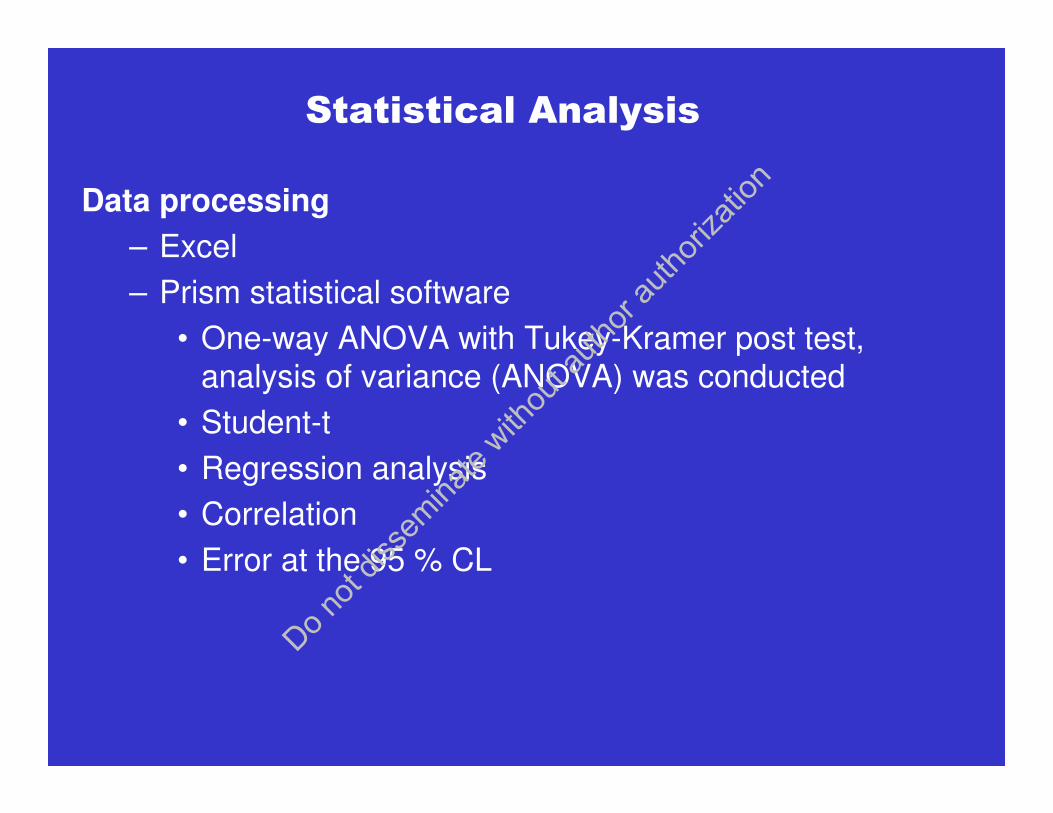
Statistical Analysis
Data processing
– Excel
– Prism statistical software
• One-way ANOVA with Tukey-Kramer post test,
analysis of variance (ANOVA) was conducted
• Student-t
• Regression analysis
• Correlation
• Error at the 95 % CL
Do not
disse
minate
withou
t auth
or au
thoriz
ation
Results
Physical parametersAverage chemical and physical parameters in Apalachicola Bay
Summer season Winter season
Sites pH Sal.
ppt
DOmg/L
T oC pH Sal.
ppt
DOmg/L
T oC
St-1 7.9
20.0 7.8 24.0 7.3 10.8 10.2 9.2
St-2 8.0 18.0 6.5 27.3 7.3 12.7 6.5 10.6
St-3 7.2 4.8 8.6 28.3 7.0 5.3 10.0 19.8
St-4 7.9 28.7 6.0 27.4 7.8 17.1 9.3 18.3
St-5 7.9 30 5.0 27.2 7.8 13.1 12.3 20.6
St-6 8.4 27.8 6.8 28.8 7.8 18.3 9.5 19.1
Do not
disse
minate
withou
t auth
or au
thoriz
ation
Quality assurance with NIST SRM
SRM 1566a
Cd Cr Pb0
1
2
3Measured
Certified
Elements
ug
/g d
ry w
t
SRM 1566b
Cu Zn0
500
1000
1500
Measured
Certified
Elements
ug
/g d
ry w
t
Do not
disse
minate
withou
t auth
or au
thoriz
ation
Liquid SRM
3114 Cu 3108 Cd 3128 Pb 3168 Zn0.0
0.5
1.0
1.5Measured
Certified
SRM
ug
/ml
SRM 1646a
Cd Cr Cu Pb Zn0
25
50
75Measured
Certified
Elements
ug
/g d
ry w
t
Do not
disse
minate
withou
t auth
or au
thoriz
ation
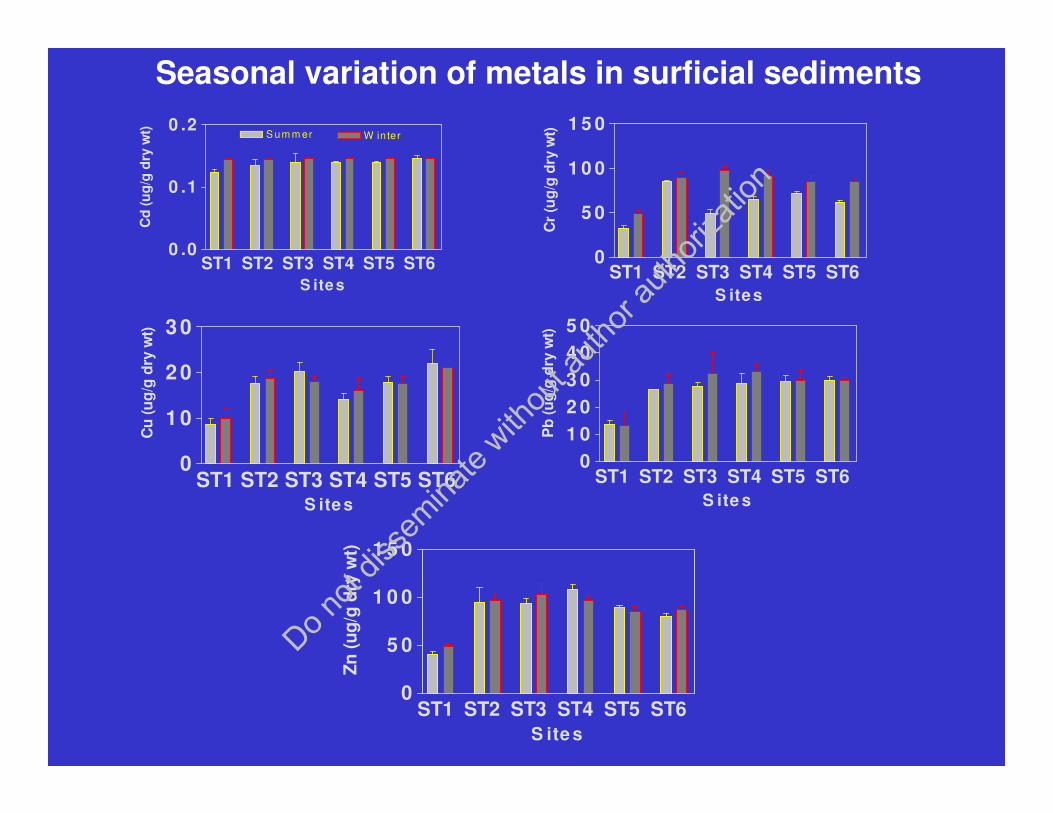
Mean seasonal variation of metal in dissolved phase (µµµµg L-1)
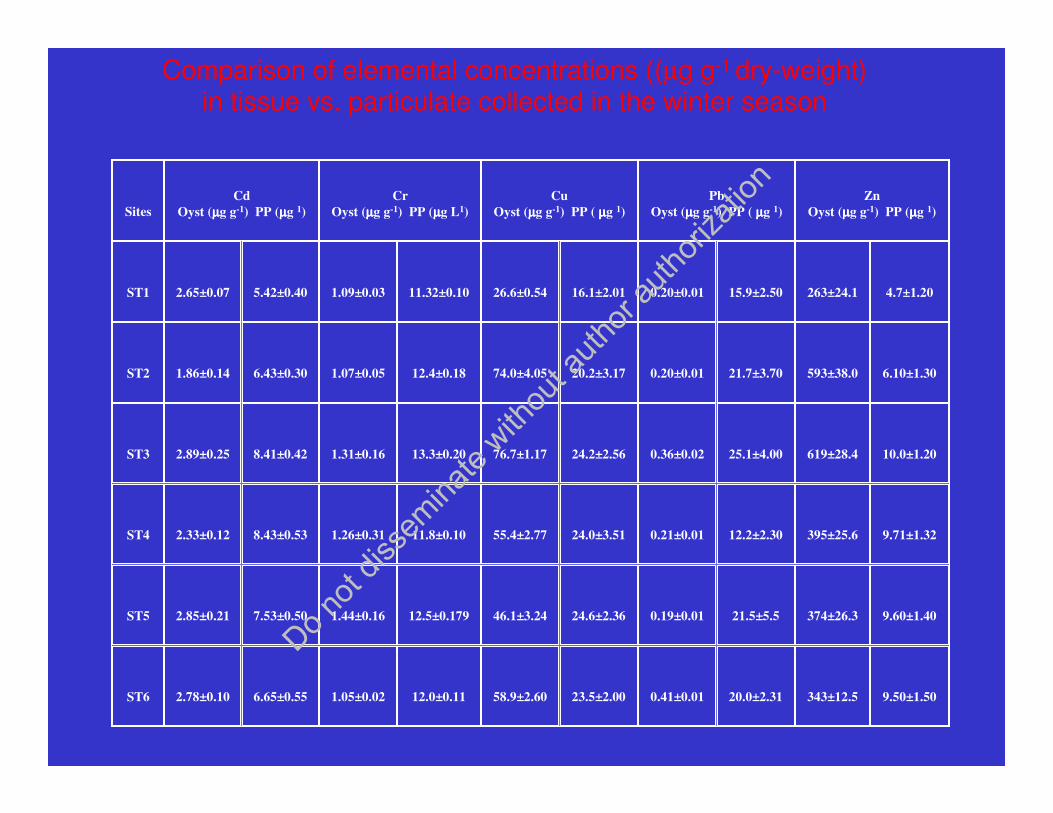
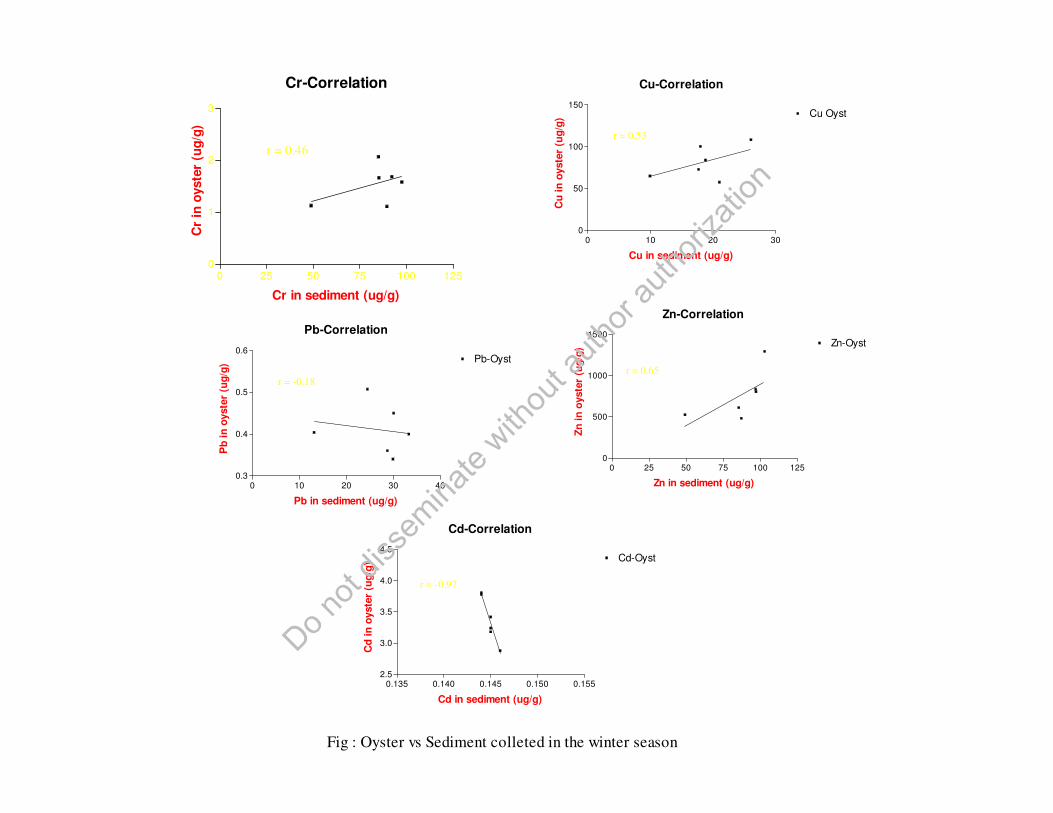
Comparison elemental concentrations ((µg g-1 dry-weight) in tissue vs. sediments collected in the winter season
Do not
disse
minate
withou
t auth
or au
thoriz
ation
Cr-Correlation
0 25 50 75 100 1250
1
2
3
r = 0.46
Cr in sediment (ug/g)
Cr
in o
yste
r (u
g/g
)
Cu-Correlation
0 10 20 300
50
100
150Cu Oyst
Cu in sediment (ug/g)
Cu
in
oyste
r (u
g/g
)
r = 0.53
Pb-Correlation
0 10 20 30 400.3
0.4
0.5
0.6Pb-Oyst
Pb in sediment (ug/g)
Pb
in
oyste
r (u
g/g
)
r = -0.18
Zn-Correlation
0 25 50 75 100 1250
500
1000
1500Zn-Oyst
r = 0.65
Zn in sediment (ug/g)
Zn
in
oyste
r (u
g/g
)
Cd-Correlation
0.135 0.140 0.145 0.150 0.1552.5
3.0
3.5
4.0
4.5Cd-Oyst
Cd in sediment (ug/g)
Cd
in
oyste
r (u
g/g
)
r = -0.97
Fig : Oyster vs Sediment colleted in the winter seasonDo n
ot dis
semina
te with
out a
uthor
autho
rizati
on
0 2 5 5 0 7 5 1 0 0 1 2 5
0 .1 4
0 .1 5
0 .1 6
r = 0 .4 5 6
C r ( u g /g )
Cd
(u
g/g
)
0 2 5 5 0 7 5 1 0 0 1 2 50
5 0
1 0 0
1 5 0
r = 0 .9 9 4
C r (u g /g )
Zn
(u
g/g
)
0 2 5 5 0 7 5 1 0 0 1 2 50
1 0
2 0
3 0
4 0
r = 0 .8 3 0
C r (u g /g )
Pb
(u
g/g
)
0 .1 3 5 0 .1 4 0 0 .1 4 5 0 .1 5 0 0 .1 5 50
1 0
2 0
3 0
4 0
r = 0 .5 4 1
C d ( u g /g )
Pb
(u
g/g
)
0 .1 3 5 0 .1 4 0 0 .1 4 5 0 .1 5 0 0 .1 5 50
5 0
1 0 0
1 5 0
r = 0 .3 8 0
C d (u g /g )
Zn
(u
g/g
)
Do not
disse
minate
withou
t auth
or au
thoriz
ation
ST-1 St-2 ST-3 ST-4 ST-5 ST-60
10
20% OM-1
% OM-2
Site
Org
an
ic m
att
er
(%)
Do not
disse
minate
withou
t auth
or au
thoriz
ation
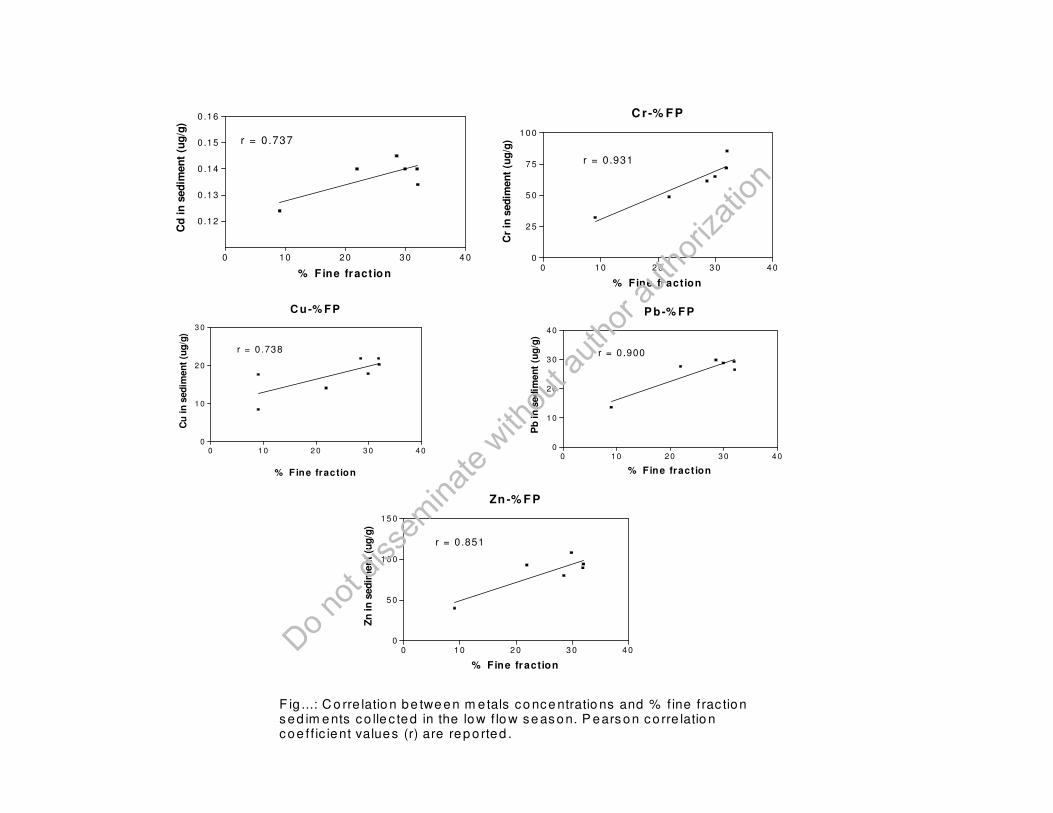
0 10 20 30 4 0
0 .12
0 .13
0 .14
0 .15
0 .16
r = 0.737
% Fine fract ion
Cd
in
sed
imen
t (u
g/g
)
C r-% F P
0 1 0 2 0 3 0 400
2 5
5 0
7 5
1 0 0
r = 0.931
% Fine fraction
Cr
in s
ed
imen
t (u
g/g
)
C u -% F P
0 1 0 2 0 3 0 4 00
1 0
2 0
3 0
r = 0 .738
% Fine fraction
Cu
in
sed
imen
t (u
g/g
)
P b-% FP
0 10 20 30 400
10
20
30
40
r = 0 .900
% Fine fract ion
Pb
in
sed
imen
t (u
g/g
)
Zn-% F P
0 1 0 2 0 3 0 4 00
5 0
1 0 0
1 5 0
r = 0.851
% Fine fraction
Zn
in
sed
imen
t (u
g/g
)
F ig ...: C o rre latio n be twe en m e tals co nce ntratio ns and % f ine f rac tions ed im ents c o lle c ted in the low f lo w se as on. P ears on c o rre latio nc oe f f ic ient values (r) are rep o rted .
Do not
disse
minate
withou
t auth
or au
thoriz
ation
0 5 1 0 1 5 2 0
0 .1 2
0 .1 3
0 .1 4
0 .1 5
0 .1 6
% O M -1
Cd
in
sed
imen
t u
gg
-10 5 1 0 1 5 2 0
0
2 5
5 0
7 5
1 0 0
% O M -1
Cr
in s
ed
imen
t u
gg
-1
0 5 1 0 1 5 2 00
1 0
2 0
3 0
% O M -1
Cu
in
sed
imen
t u
gg
-1
0 5 1 0 1 5 2 00
1 0
2 0
3 0
4 0
% O M -1
Pb
in
sed
imen
t u
gg
-1
0 5 1 0 1 5 2 00
5 0
1 0 0
1 5 0
% O M -1
Zn
in
sed
imen
t u
gg
-1
F ig: C o r r e lat io n be twe e n m e tal in s e d im e n t and % O M c o l le c te d in the s um m e r
Do not
disse
minate
withou
t auth
or au
thoriz
ation
ST-1 ST-2 ST-3 ST-4 ST-5 ST-60
1
2
3
Sites
Cd
(u
g/g
dry
wt)
ST-1 ST-2 ST-3 ST-4 ST-5 ST-60
1
2
Sites
CR
(u
g/g
dry
wt)
ST-1 ST-2 ST-3 ST-4 ST-5 ST-60
25
50
75
100
Sites
Cu
(u
g/g
dry
wt)
ST-1 ST-2 ST-3 ST-4 ST-5 ST-60 .0
0 .1
0 .2
0 .3
0 .4
0 .5
Site s
Pb
(u
g/g
dry
wt)
ST-1 ST-2 ST-3 ST-4 ST-5 ST-60
250
500
750
Sites
Zn
(u
g/g
dry
wt)
Fig. X: Metal conc entrations in C . virginic a collec ted in s um m er form differentsam pling s ites in Apalachic ola Bay. Values are m ean ± SDE at 95 % CL (n = 5) .
Do not
disse
minate
withou
t auth
or au
thoriz
ation
0 .9 1 .0 1 .1 1 .2 1 .3 1 .4 1 .5 1 .60
2 5
5 0
7 5
1 0 0
r = 0 .1 2P < 0 .0 5
C r in o ys t u g /g d r y w t
Cr
in s
ed
imen
t (u
g/g
)
0 2 5 5 0 7 5 1 0 00
1 0
2 0
3 0
r = 0 .7 5P < 0 .0 5
C d in o ys t u g /g d r y w t
Cu
in
sed
imen
t (u
g/g
)
0 .0 0 .1 0 .2 0 .3 0 .4 0 .50
1 0
2 0
3 0
4 0
r = 0 .4 4P < 0 .0 5
Pb in o ys t u g /g d r y w t
Pb
in
sed
imen
t (u
g/g
)
0 1 0 0 2 0 0 3 0 0 4 0 0 5 0 0 6 0 0 7 0 00
2 5
5 0
7 5
1 0 0
1 2 5
r = 0 .1 0P < 0 .0 5
Zn in o ys t u g /g d r y w t
Zn
in
sed
imen
t (u
g/g
)
Fig: C o r re lat io n be twe e n m e tal in o ys te r and s e dim e nt c o lle c te d in the s um m e r
F ig : C o r r e lat io n be tw e e n m e ta l in o y s te r an d s e d im e n t c o l le c te d in th e w i n te r
Do not
disse
minate
withou
t auth
or au
thoriz
ation
C d
St-1 St-2 St-3 St-4 St-5 St-60 .0
0 .1
0 .2
F ig . X : C ad m ium c o nc e n tra tion in s e d im e n t c o lle c te d fo rm d iffe ren ts am p ling s ite s in A pa la c h ic o la B a yVa lu es a re m ea n ± S E M a t 9 5 % C L (n = 5 ). P > 0 .0 5
S a m p lin g s t a t io n s[C
d]
ug
/g d
ry w
t
C r
SS-1 SS-2 SS-3 SS-4 SS-5 SS-60
2 5
5 0
7 5
1 0 0
F ig . X: C h rom iu m c o nc en tra tio n in s ed im en t c o llec ted fo rm d iffe ren ts am p lin g s ites in Ap a lac h ic o la B ay .Va lue s a re m ea n ± S E M a t 9 5 % C L (n = 5 ). P > 0 .0 5
S am p lin g s ta t io n s
[Cr]
ug
/g d
ry w
t
C u
SS-1 SS-2 SS-3 SS-4 SS-5 SS-60
1 0
2 0
3 0
S a m p lin g s t a t io n s
[Cu
] u
g/g
dry
wt
F ig . X: C o pp e r c on c en tra tio n in s ed im e n t c o lle c te d fo rm d iffe ren ts a m p lin g s ite s in Apa la c h ic o la B ayVa lue s a re m ea n ± S E M a t 9 5 % C L (n = 5 ). P > 0 . 0 5
P b
SS-1 SS-2 SS-3 SS-4 SS-5 SS-60
1 0
2 0
3 0
4 0
S a m p lin g s t a t io n s
[Pb
] u
g/g
dry
wt
F ig . X: Lead c onc en tra tion in s ed im ent c o llec ted fo rm d iffe ren ts am p ling s ites in Apa lac h ic o la B ayVa lues are m ean ± S E M a t 9 5 % C L (n = 5 ). P > 0 .0 5
Zn
SS-1 SS-2 SS-3 SS-4 SS-5 SS-60
5 0
1 0 0
1 5 0
S a m p lin g s ta t io n s
[Zn
] u
g/g
dry
wt
F ig . X: Zinc c o nc en tra t ion in s e d im e n t c o lle c ted fo rm d iffe re n ts a m p ling s ite s in Apa la c h ic o la B a yVa lu es a re m e an ± S E M a t 9 5 % C L (n = 5 ). P > 0 . 0 5
F ig : M e a n c o n c e n tr a tio n ( ± u n c e r ta in ty a t 9 5 % c o n f id e n c e le ve l) o f tr a c e m e ta l in r e c e n tse d im e n ts f r o m A p a la c h ic o la B a y
U
SS-1 SS-2 SS-3 SS-4 SS-5 SS-60 .0
2 .5
5 .0
7 .5
S a m p lin g s ite s
[U]
ug
/g d
ry w
t
F ig . X : U ra n ium c on c e n tra tio n in s ed im en t c o lle c ted fo rm d iffe ren ts am p lin g s ite s in Apa la c h ic o la B ayVa lue s a re m ea n ± S E M a t 9 5 % C L (n = 5 ). P > 0 .0 5Do not
disse
minate
withou
t auth
or au
thoriz
ation
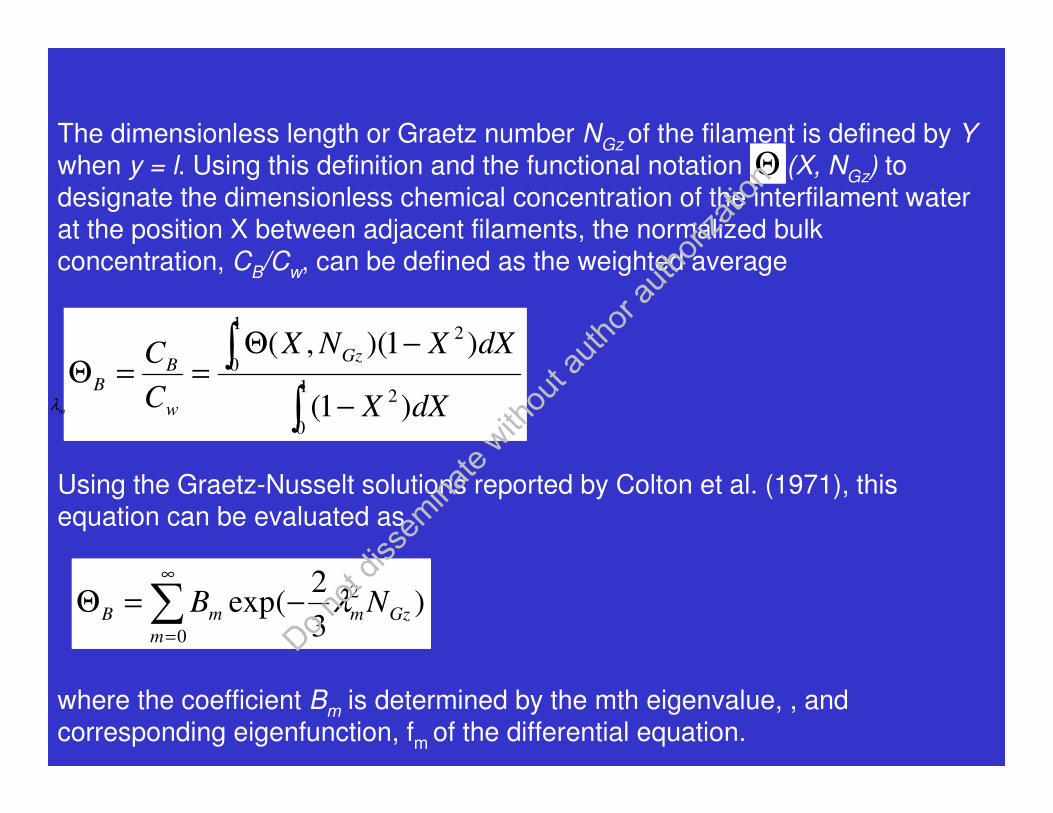
Assuming a laminar flow, chemical transport between filaments can be modeled as
2
22 )1(
2
3
XYX
∂
Θ∂=
∂
Θ∂−
where is the chemical dimensionless concentration, X is the dimensionless distance normal to the surface of the filament such that X=0 denote the centerline, and Y is the dimensionless distance along the length of the filament.
Θ
wC
yxC ),(=Θ
h
xX =
Vh
yDY
2=
where C(x,y) is the chemical concentration between the filament at the distance x from the filament surface and y along the length of the filament and D (cm2 /s) is the diffusivity of the chemical.
Do not
disse
minate
withou
t auth
or au
thoriz
ation
The dimensionless length or Graetz number NGz of the filament is defined by Ywhen y = l. Using this definition and the functional notation (X, NGz) to designate the dimensionless chemical concentration of the interfilament water at the position X between adjacent filaments, the normalized bulk concentration, CB/Cw, can be defined as the weighted average
Θ
∫
∫−
−Θ==Θ
1
0
2
1
0
2
)1(
)1)(,(
dXX
dXXNX
C
C Gz
w
BB
Using the Graetz-Nusselt solutions reported by Colton et al. (1971), this equation can be evaluated as
)3
2(exp 2
0
Gzm
m
mB NB λ−=Θ ∑∞
=
where the coefficient Bm is determined by the mth eigenvalue, , and corresponding eigenfunction, fm of the differential equation.