Nazanin Azizian 1 , Dr. Mazzuchi 2 , Dr. Sarkani 2 , Dr. Rico 2 NDIA Systems Engineering Conference San Diego, CA 25 Oct. – 28 Oct 2011 1 A Model for Measuring the Correlation Between TRA and Enabling Engineering Activities, Cost, schedule, and System Quality for U.S. DoD Acquisition Programs
Transcript
Nazanin Azizian1, Dr. Mazzuchi2, Dr. Sarkani2, Dr. Rico2
13th NDIA Systems Engineering Conference
San Diego, CA25 Oct. – 28 Oct 2011
1
A Model for Measuring the Correlation Between TRA and Enabling Engineering Activities, Cost, schedule, and System Quality for U.S. DoD Acquisition Programs
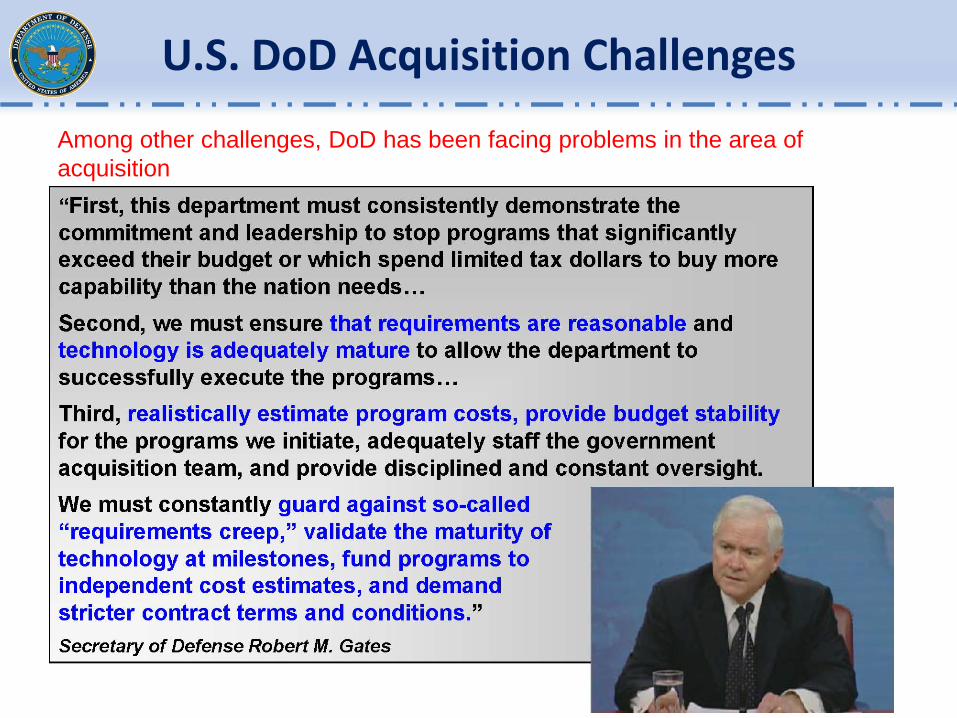
Among other challenges, DoD has been facing problems in the area of acquisition
Background
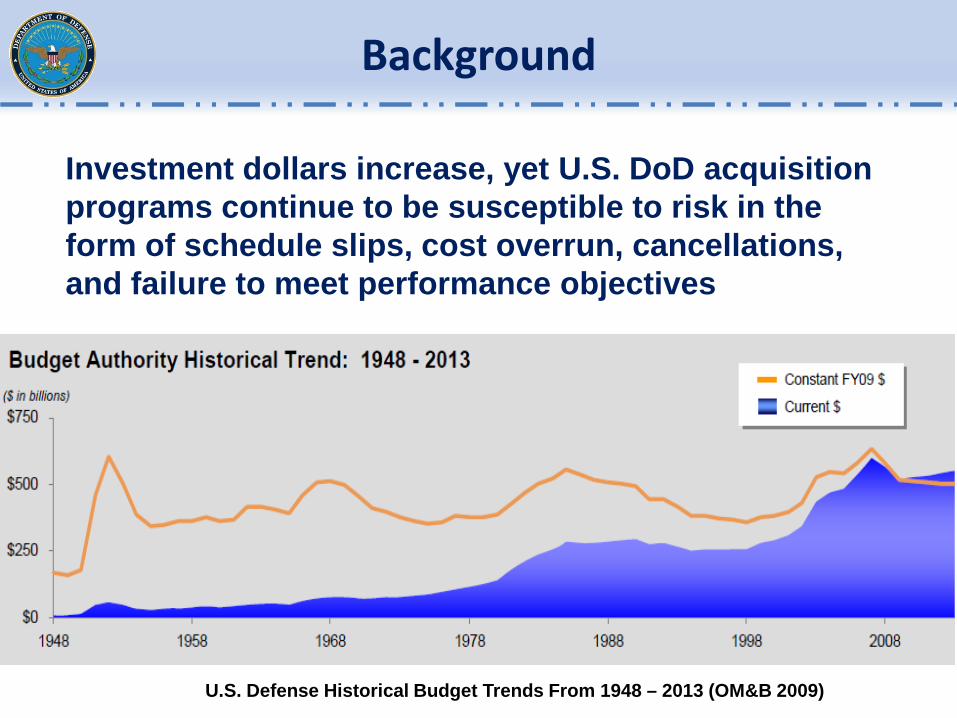
Investment dollars increase, yet U.S. DoD acquisition programs continue to be susceptible to risk in the form of schedule slips, cost overrun, cancellations, and failure to meet performance objectives
U.S. Defense Historical Budget Trends From 1948 – 2013 (OM&B 2009)
5/14/2009 4
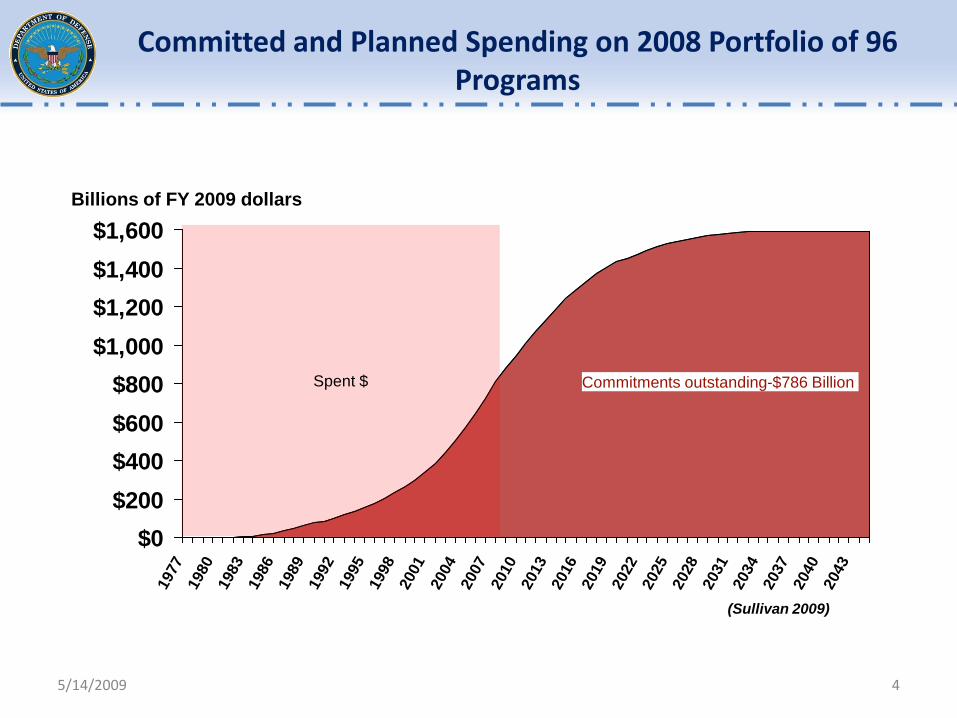
Committed and Planned Spending on 2008 Portfolio of 96 Programs
$0$200$400$600$800
$1,000$1,200$1,400$1,600
1977
1980
1983
1986
1989
1992
1995
1998
2001
2004
2007
2010
2013
2016
2019
2022
2025
2028
2031
2034
2037
2040
2043
Spent $
Billions of FY 2009 dollars
Commitments outstanding-$786 Billion
(Sullivan 2009)
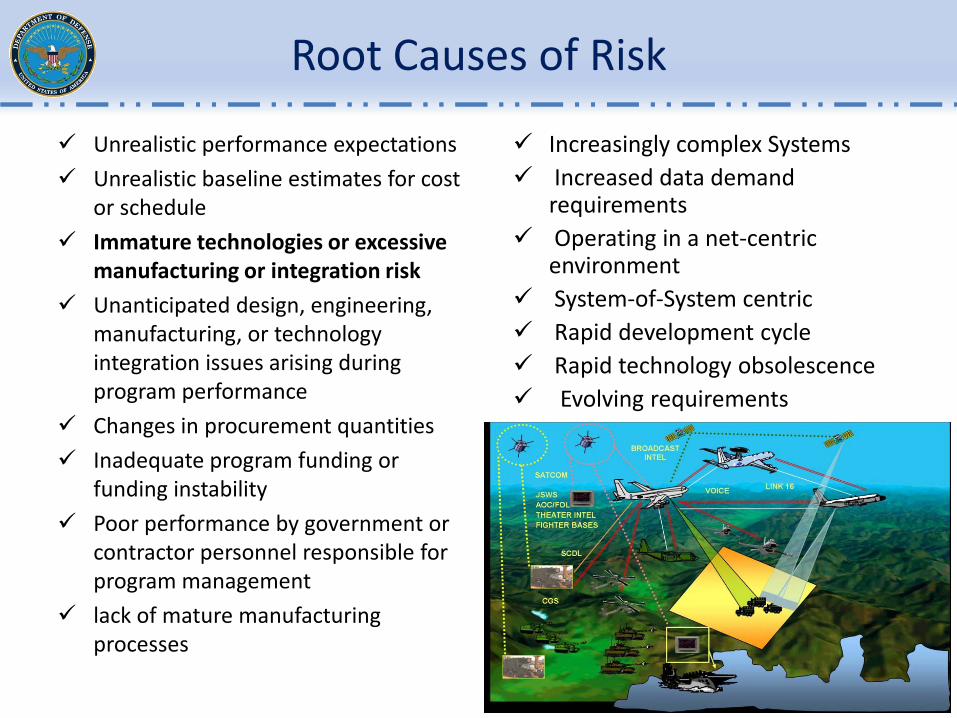
Root Causes of Risk
Unrealistic performance expectations
Unrealistic baseline estimates for cost or schedule
Immature technologies or excessive manufacturing or integration risk
Unanticipated design, engineering, manufacturing, or technology integration issues arising during program performance
Changes in procurement quantities
Inadequate program funding or funding instability
Poor performance by government or contractor personnel responsible for program management
lack of mature manufacturing processes
Increasingly complex Systems Increased data demand
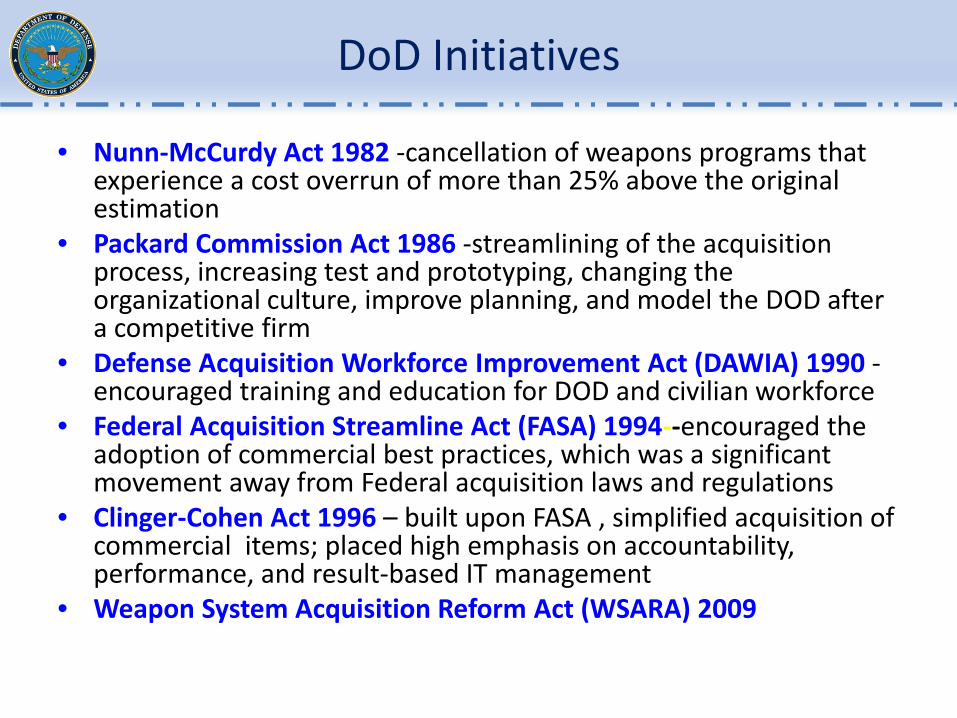
• Nunn-McCurdy Act 1982 -cancellation of weapons programs that experience a cost overrun of more than 25% above the original estimation
• Packard Commission Act 1986 -streamlining of the acquisition process, increasing test and prototyping, changing the organizational culture, improve planning, and model the DOD after a competitive firm
• Defense Acquisition Workforce Improvement Act (DAWIA) 1990 -encouraged training and education for DOD and civilian workforce
• Federal Acquisition Streamline Act (FASA) 1994--encouraged the adoption of commercial best practices, which was a significant movement away from Federal acquisition laws and regulations
• Clinger-Cohen Act 1996 – built upon FASA , simplified acquisition of commercial items; placed high emphasis on accountability, performance, and result-based IT management
• Weapon System Acquisition Reform Act (WSARA) 2009
WSARA 2009
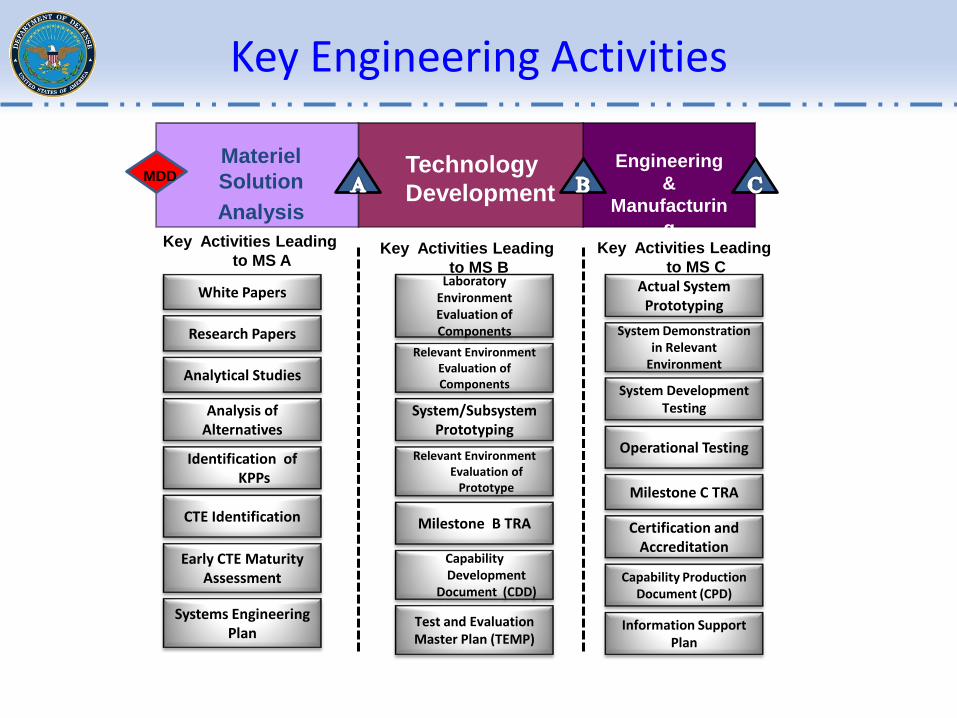
MDD
A B
Material Development Decision – Mandatory Process Entry Point
MDA Certification
– MS A
MDA Certification
– MS B
Technology Development
Material SolutionAnalysis
Engineering & Manufacturing Development
CDDPDR CDRPrototype
Increased Emphasis on Milestone A• Mandatory for MDAPs withTechnology Development Programs• Likely for Most Programs
Enhanced Emphasis on:• Technology Maturity• Systems Engineering• Integrated Testing and Test Planning• Manufacturing and Producibility• Logistics and Sustainment Planning
FOCUS OF MAJOR CHANGES
MDA Certification
– MS C
CProduction & Deployment
Operation & Support
CPD
Mandatory Preliminary Design Review (PDR)before Milestone B
Post-PDR
Acquisition Outcomes Per GAO
weapon system programs are
initiated without:
1. Sufficiently mature technologies
2. Stable designs
3. Sufficiently mature manufacturing processes
Portfolio status Fiscal year 2003 Fiscal year 2007 Fiscal year 2008
Number of programs 77 95 96
Total planned commitments $1.2 trillion $1.6 trillion $1.6 trillion
Share of programs with 25 percent or more increase in program acquisition unit cost 41 percent 44 percent 42 percent
Average delay in delivering initial capabilities 18 months 21 months 22 months
Strategy to Improve AcquisitionOutcome
• 1999 - GAO stated in report that “Maturing new technology before it is included in a product is perhaps the most determinant of the success of the eventual product or weapon system” GAO/NSIAD-99-162
• 2001- In a memorandum DUSD(S&T) endorsed assessing technology maturity using the TRL metrics
• 2003 - DoDI 5000.02 (2003), para3.7.2.2 required the inspection of technology maturity by stating “Objective assessment of technology maturity and risk shall be a routine aspect of DoD acquisition.”
• 2006 – Congressional legislation (Title 10, section)Technology maturity must be assessed and certified to be adequate prior to MS B&C
Defining Technology Readiness Assessment (TRA) and Technology Readiness Level (TRL)
• A TRA is a systematic, metrics-based process and accompanying report
• The TRA assesses the Maturity of Critical Technology Elements (CTEs)
• Critical Technology Elements (CTEs) are…– The system depends on this element to meet operational requirements
– The element or its application is either new or novel.
– Element poses major technological risk during detailed design or demonstration
• DoD standard tool for performing TRAs is Technology Readiness Level (TRL) metric– Technology Readiness Level (TRL) is a 9 tier metric that systematically assess
the maturity of a technology with respect to a particular use
Technology maturity has been linked to cost and schedule, however little emperical studies have been conducted to evaluate the degree of its correlation to the quality of DoD products and weapon systems.
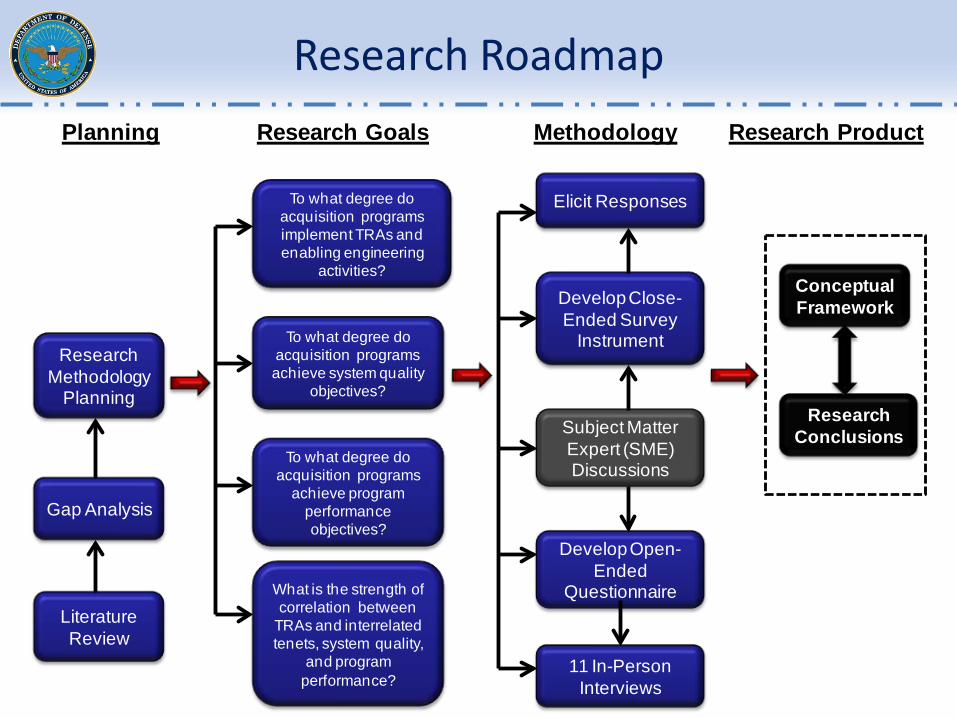
Research Roadmap
Literature Review
Gap Analysis
Elicit Responses
Develop Close-Ended Survey
Instrument
Develop Open-Ended
Questionnaire
11 In-Person Interviews
Subject Matter Expert (SME) Discussions
To what degree do acquisition programs implement TRAs and enabling engineering
activities?
To what degree do acquisition programs achieve system quality
objectives?
To what degree do acquisition programs
achieve program performance objectives?
What is the strength of correlation between
TRAs and interrelated tenets, system quality,
and program performance?
Conceptual Framework
Research Conclusions
Planning Research Goals Methodology Research Product
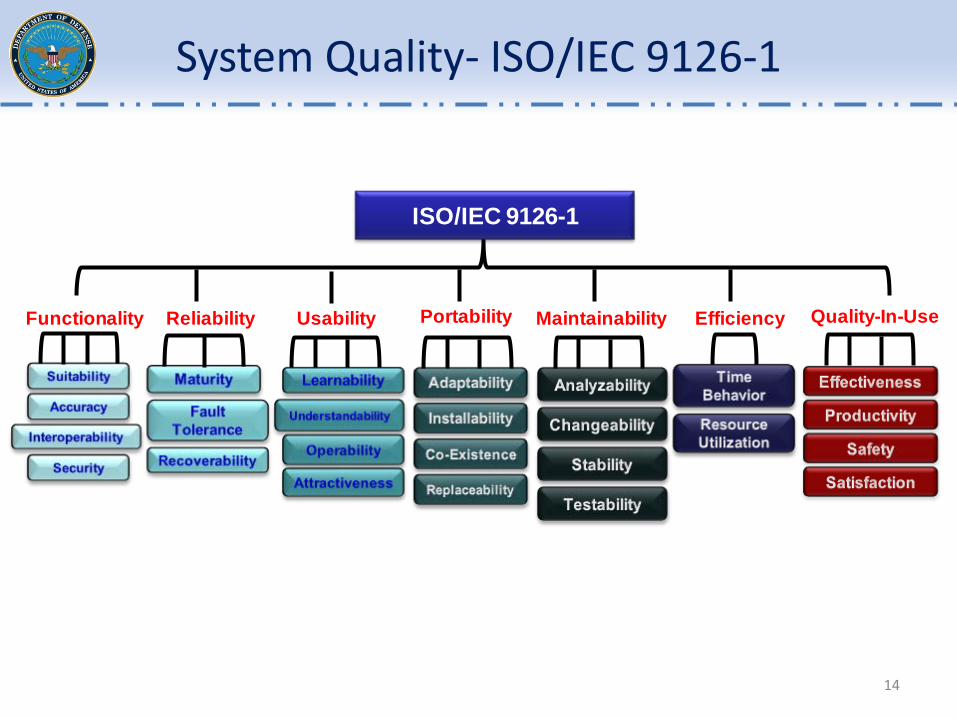
H1 -There is no correlation between TRAs and enabling engineering activities and the quality of military systems as measured by ISO/IEC 9126-1.
H2 -There is no correlation between TRAs and enabling engineering activities and acquisition performance
H2a -There is no correlation between TRAs and engineering activities and acquisition cost
H2b -There is no correlation between TRAs and enabling engineering activities and acquisition schedule
H2c -There is no correlation between TRAs and enabling engineering activities and customer satisfaction
H2d -There is no correlation between TRAs and enabling systems engineering activities and acquisition productivity
H3 -There is no correlation between the quality of military systems as measured by ISO/IEC 9126-1 and acquisition performance measured by cost, schedule, customer satisfaction, and productivity
Hypotheses
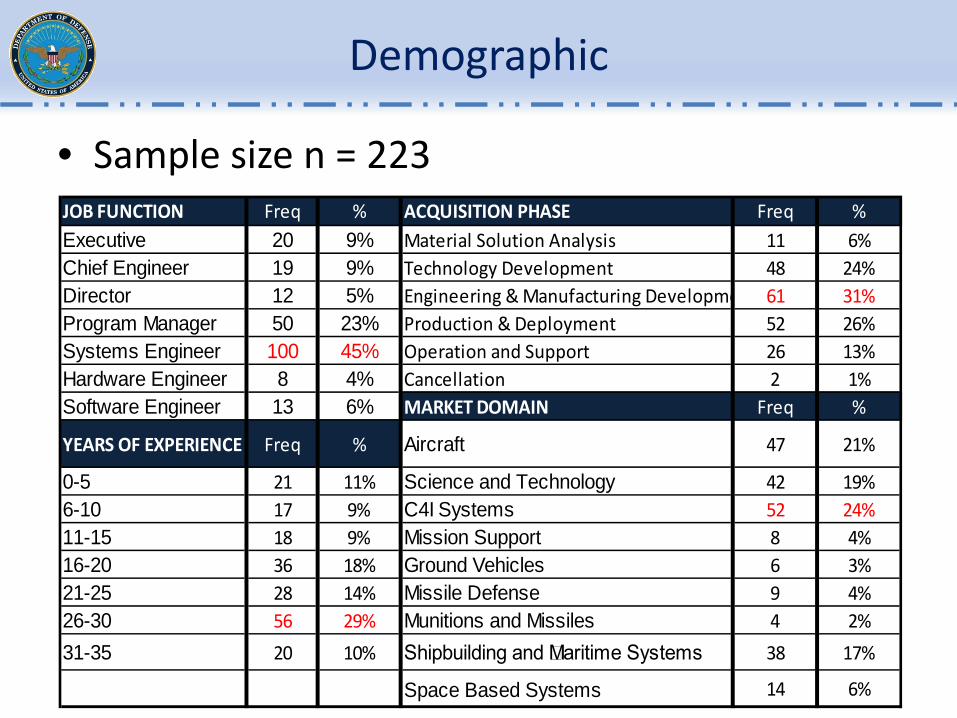
• Sample size n = 223
Demographic
JOB FUNCTION Freq % ACQUISITION PHASE Freq %Executive 20 9% Material Solution Analysis 11 6%Chief Engineer 19 9% Technology Development 48 24%Director 12 5% Engineering & Manufacturing Developme 61 31%Program Manager 50 23% Production & Deployment 52 26%Systems Engineer 100 45% Operation and Support 26 13%Hardware Engineer 8 4% Cancellation 2 1%Software Engineer 13 6% MARKET DOMAIN Freq %
YEARS OF EXPERIENCE Freq % Aircraft 47 21%
0-5 21 11% Science and Technology 42 19%6-10 17 9% C4I Systems 52 24%11-15 18 9% Mission Support 8 4%16-20 36 18% Ground Vehicles 6 3%21-25 28 14% Missile Defense 9 4%26-30 56 29% Munitions and Missiles 4 2%
31-35 20 10% Shipbuilding and Maritime Systems 38 17%
• Finding One: assessing technology maturity is ineffective if other recommended systems engineering activities are not implemented in parallel (i.e documentation and planning)
• Finding Two: Most did not use the TRL metric to assess technology maturity - technology readiness and maturity were assessed by test and integration of components to determine the number of requirements and specifications that are met
• Finding Three: Many acquisition programs did not develop prototypes or perform operational environment testing because they claim that it is impossible to replicate the environments and it costs too much to prototype the actual system
• Finding Four: It was determined that many acquisition programs do not implement TRA enabling systems engineering activities in the order suggested by DoD 5000. Therefore, they may be advancing through the stages of the acquisition lifecycle with knowledge gaps
Interview Findings
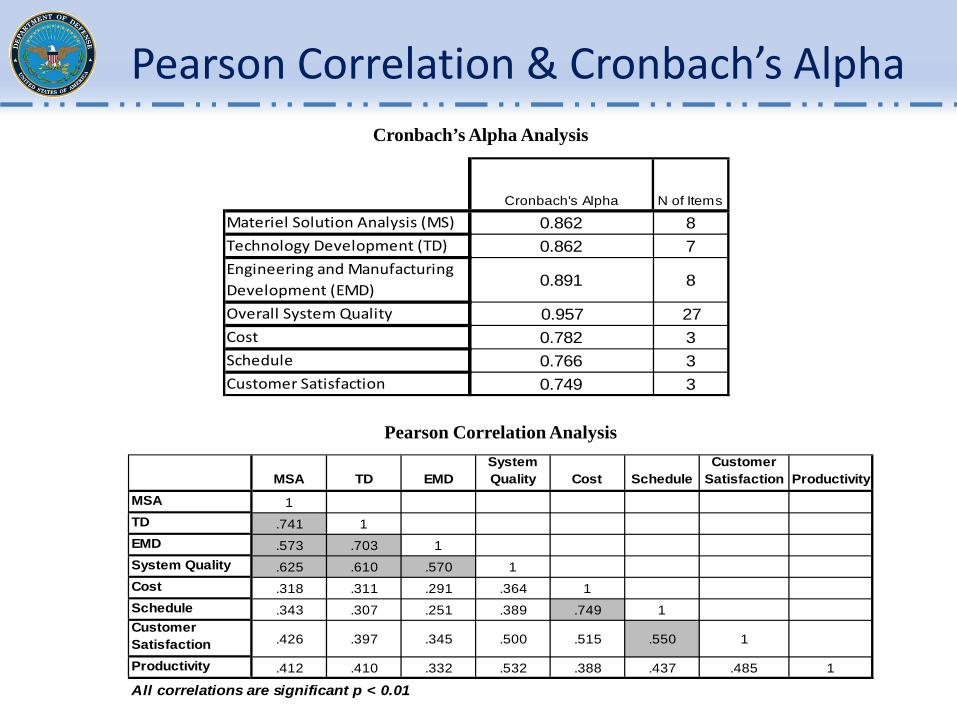
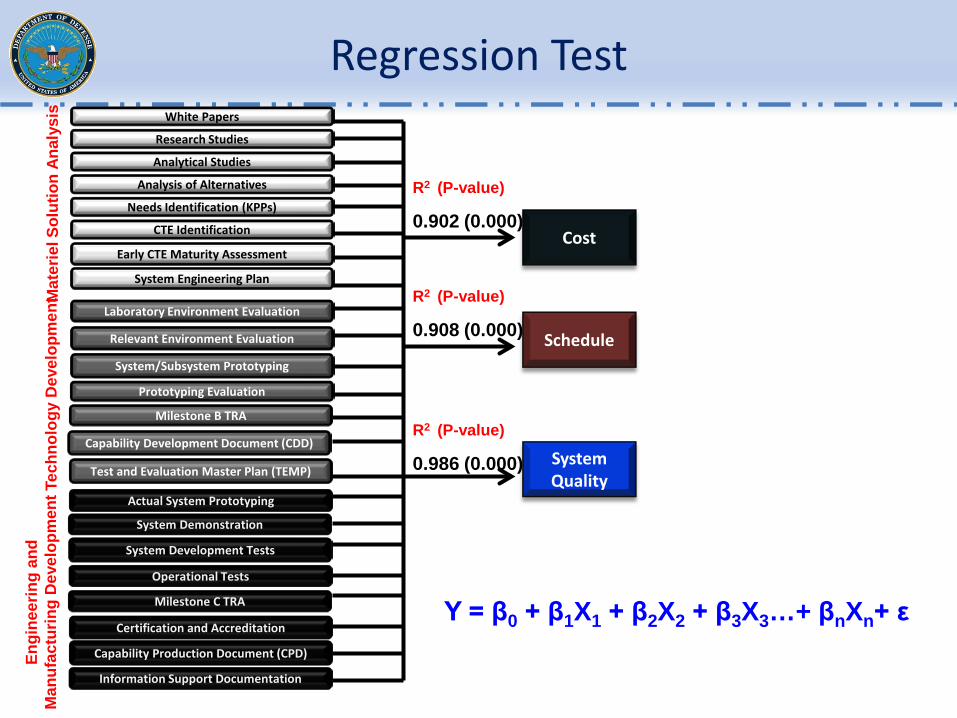
• Rejected all null hypotheses at the 0.01 significance level and showed that TRA enabling engineering activities are strongly correlated to system quality and program performance.
– Although Milestones B and C TRAs did not show significance on system quality, cost, schedule, and productivity, the results showed that numerous enabling systems engineering activities that support the TRA process were significant at ≤ 0.01 α ≤ 0.05
• Quality of U.S. military systems exhibited strong correlations to cost, schedule, customer satisfaction, and productivity of acquisition
• There is evidence to show that adhering to many of the U.S. DoD engineering activities related to acquisitoin that are called for in a TRA process may have a positive effect on the quality of U.S. DoD systems, as well as the cost and schedule of acquisition programs
Conclusions
“Executable programs should be the natural outgrowth of a disciplined, knowledge-based