+ All Categories
Home > Documents > A Model of Choice for Public Policy - University of North...

A Model of Choice for Public Policy - University of North...

Date post: 03-Jun-2018
Category:
Upload: vanliem
View: 213 times
Download: 0 times
Share this document with a friend
27
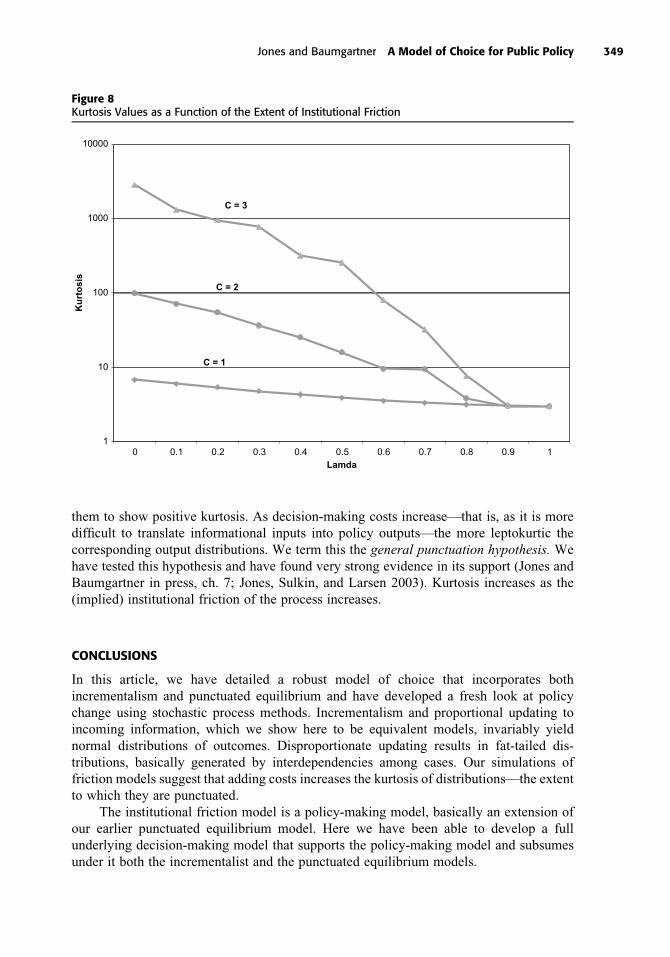
ARTICLES A Model of Choice for Public Policy Bryan D. Jones University of Washington Frank R. Baumgartner Pennsylvania State University ABSTRACT Punctuated equilibrium is supposed to be a viable alternative to incrementalism, and, indeed, the authors of the model have sometimes made such claims. But punctuated equilibrium was developed to explain change in policy subsystems and does not serve as a complete model of policy choice in the same way that incrementalism has served. This article develops a full-blown and viable model of choice for public policy based on disproportionate information processing. Its dynamics are based in the allocation of political attention to policy topics and the manner in which political systems process information. The model leads directly to outcomes that are consistent with punctuated equilibrium and are not generally consistent with incrementalism. Incrementalism, however, may be deduced from the model as a special case. The model is best tested using stochastic process approaches. Incrementalism logically must yield a normal distribution of outcomes, but disproportionate information processing yields leptokurtic outcomes. Adding institutional constraints only makes the stochastic process implications more severe. To support our arguments, we present both static and dynamic simulations of these processes. We also show that these simulations are consistent with observations of U.S. government budgets. Incrementalism implies that policy choice at a particular time is a marginal adjustment from a previous policy choice. The model has been thoroughly discredited by theoretical, methodological, and empirical critiques, but it survives because no convincing alternative has been offered. It is the purpose of this article to offer such an alternative, one that shows how incrementalism is a special case of a generalized updating model we term disproportionate information processing. It is also the foundation for punctuated equilibrium, so it unifies incrementalism and punctuated equilibrium within a single decision-making model. Incrementalism failed because it had no underlying theory of information processing; once one is specified, the rest is easy. Models of policy choice are best tested using stochastic process methods that focus on full distributions of choices rather than single choices. We examine the stochastic process implications of disproportionate information processing and compare these implications to This article expands on material in Jones and Baumgartner (2005). We gratefully acknowledge Jim Stimson for his insight and programming skills that allowed us to produce the dynamic simulations presented here. Address correspondence to Bryan D. Jones at [email protected]. doi:10.1093/jopart/mui018 Advance Access publication on December 16, 2004 Journal of Public Administration Research and Theory, Vol. 15, no. 3 ª 2005 Journal of Public Administration Research and Theory, Inc.; all rights reserved. JPART 15:325–351
Transcript

ARTICLES

A Model of Choice for Public Policy

Bryan D. JonesUniversity of Washington

Frank R. BaumgartnerPennsylvania State University

ABSTRACT

Punctuated equilibrium is supposed to be a viable alternative to incrementalism, and, indeed,

the authors of the model have sometimes made such claims. But punctuated equilibrium

was developed to explain change in policy subsystems and does not serve as a complete

model of policy choice in the same way that incrementalism has served. This article develops

a full-blown and viable model of choice for public policy based on disproportionate

information processing. Its dynamics are based in the allocation of political attention to policy

topics and the manner in which political systems process information. The model leads

directly to outcomes that are consistent with punctuated equilibrium and are not generally

consistent with incrementalism. Incrementalism, however, may be deduced from the model

as a special case. The model is best tested using stochastic process approaches.

Incrementalism logically must yield a normal distribution of outcomes, but disproportionate

information processing yields leptokurtic outcomes. Adding institutional constraints only

makes the stochastic process implications more severe. To support our arguments, we

present both static and dynamic simulations of these processes. We also show that these

simulations are consistent with observations of U.S. government budgets.

Incrementalism implies that policy choice at a particular time is a marginal adjustment

from a previous policy choice. The model has been thoroughly discredited by theoretical,

methodological, and empirical critiques, but it survives because no convincing alternative

has been offered. It is the purpose of this article to offer such an alternative, one that shows

how incrementalism is a special case of a generalized updating model we term

disproportionate information processing. It is also the foundation for punctuated

equilibrium, so it unifies incrementalism and punctuated equilibrium within a single

decision-making model. Incrementalism failed because it had no underlying theory of

information processing; once one is specified, the rest is easy.

Models of policy choice are best tested using stochastic process methods that focus on

full distributions of choices rather than single choices. We examine the stochastic process

implications of disproportionate information processing and compare these implications to

This article expands on material in Jones and Baumgartner (2005). We gratefully acknowledge Jim Stimson for his

insight and programming skills that allowed us to produce the dynamic simulations presented here. Address

correspondence to Bryan D. Jones at [email protected].

doi:10.1093/jopart/mui018Advance Access publication on December 16, 2004Journal of Public Administration Research and Theory, Vol. 15, no. 3ª 2005 Journal of Public Administration Research and Theory, Inc.; all rights reserved.

JPART 15:325–351

incrementalism, and we present some simulations that indicate how robust these results are.

Finally, by comparing the results from our simulations with actual budget distributions, we

show that disproportionate information processing is consistent with these distributions but

incrementalism is not.

THE INCREMENTAL MODEL

The notion that decision makers make incremental course corrections from the status quo

has dominated thinking about policy change since the late 1950s. While the concept is

general, it has been applied with particular success in the study of public budgets. Scholars

drawing on Lindblom (1959), Wildavsky (1964), and others have argued that annual

budget results tend to drift rather than to shift abruptly. Budgets were powerfully affected

by the concepts of ‘‘base’’ and ‘‘fair share,’’ which assume that each year’s budget should

be based on the previous allocation and that any increment should be shared relatively

equally across categories and agencies.

The incremental model as a descriptive model of policy choice has been subject to

withering fire on theoretical, methodological, and empirical grounds, all profound

criticisms that it did not survive. Critics have noted problems in the models used by Davis,

Dempster, and Wildavsky (Gist 1982; Natchez and Bupp 1973), in the measures used

(Wanat 1974), in the conceptual clarity of terms (Berry 1990; Hayes 1992), and in the

nature of the underlying decision-making model (Padgett 1980, 1981). Others have

complained of problems in capturing the complexities with simple theories of budgeting,

particularly the incremental model (Kiel and Elliott 1992; Rubin 1988; Schick 1998).

While the incremental model was discredited by these critiques, it was never replaced by

a viable alternative.

The incrementalists based their approach to budget behavior on models of decision

making featuring ‘‘considerations of limited rationality in the face of complexity and

uncertainty’’ (Davis, Dempster, and Wildavsky 1974, 421). In that framework, outputs are

governed by standard operating procedures, and these SOPs are incremental in nature.

Participants have been expected to use incremental decision rules for three reasons. The

first involves the relative ease of reversing mistakes following incremental changes. The

second concerns the desire of participants to establish stable expectations in a complex and

uncertain environment. The third concerns the nature of overlapping, conflicting, and

interacting institutions in American politics, which push participants toward compromise

(Davis, Dempster, and Wildavsky 1966, 1974; Fenno 1966; Lindblom 1959; Wildavsky

1964).

All of this does a fine job of explaining where the drag comes from—why decision

makers might rely on the status quo and adjust policy from that point. But it does not offer

much of a guide concerning how decision makers arrive at these adjustments. It turns out

that this is the Achilles heel of the incremental model. A wrongheaded updating model is

why the incremental model is so demonstrably wrong when it comes to empirical testing. It

is also the key to developing a decision-making model that avoids the difficulties of the

incremental model while allowing that model to be deduced as a special case.

Incrementalism in its pure form implies that a decision path will be a random walk

through time. This is the case because today’s decision is an adjustment from yesterday’s.

Since we do not know exactly how incremental adjustments are made at any one point in

time, we commonly assume that the adjustment is random. The central limit theorem is

326 Journal of Public Administration Research and Theory

a strong buttress for assuming that changes from the status quo are drawn from a normal

distribution. Hence we can write (Padgett 1980):

Pt ¼ Pt�1 þ et ½1�or

Pt � Pt�1 ¼ et

Policy today (Pt) is policy yesterday (Pt�1) plus or minus a random component. This

implies directly that any period-to-period policy change is simply a random component. If

we sum up all these changes or first differences, then the resulting frequency distribution

would be approximately normal. The reason is because of our standard assumptions about

the error term of the model and the central limit theorem. If we add up all these error terms,

each of which is drawn from an unknown distribution with finite variance, then the sum of

these terms will be a normal distribution.

Considerable debate, much of it based on misunderstandings, has characterized the

notion of incrementalism. Much of the debate has centered on ‘‘how large’’ a policy change

would need to be to qualify as ‘‘nonincremental.’’ Any particular policy change in the eye of

one beholder can be trivial; in the eye of another, it can be huge. In the absence of an agreed-

upon standard, the question of policy change versus continued policy stability is

unanswerable. That argument is needless in the distributional perspective, where any change

is judged relative to the overall pattern of policy stability and change. If incrementalism

holds, then the distribution of policy changes across timemust be normally distributed. If it is

not so distributed, incrementalism cannot be the right model for the decision process.

INCREMENTALISM AND UPWARD DRIFT

An important modification of the incrementalist model we call ‘‘incrementalism with

upward drift.’’ Government budgets in most developed democracies have moved upward

since World War II, a payoff from successful economic management. In such an

environment, incrementalist politics of mutual partisan adjustment and successive limited

comparisons (Lindblom 1959) is played out within a growing pie. Moreover, many

programs are funded by formulas that include the size of the target population or some sort

of poverty-level floor. These aspects of program funding can result in growth of budgets as

the economy grows.

This suggests that the year-to-year upward drift is proportional to last year’s budget.

Economists have faced a somewhat similar problem, the growth of firms over time. If the

factors influencing growth were similar for large and small firms, as they would be if

a growing economy lifts all boats, then the growth of firms over time would be proportional

to the size of the firm. This assumption is enshrined in economics as the Gibrat thesis

(Cefis, Ciccarelli, and Orsenigo 2001).

Incrementalism with upward drift would imply a similar thesis with regard to

government budgets. The economywould lift all programs, leading to a proportional growth

increment rather than the additive growth increment postulated in the pure incremental

model of equation 1. If this stronger form of upward drift, the Gibrat thesis, were applied to

government budgets, it would imply that the annual percentage change (rather than the

annual dollar change) would be constant—up to the random component. In this formulation

the annual percentage change in budgetary commitments would follow a random walk, and

the annual proportional (or percentage) difference would follow a normal distribution.

Jones and Baumgartner A Model of Choice for Public Policy 327

Equation 2 says that the policy at time t equals the policy at the earlier time period t� 1

plus a component that is proportional to the policy at the earlier time period and a random

component:

Pt ¼ Pt�1 þ kPt�1 þ et ½2�(sometimes written as Pt 5 [1þ k]Pt�1þ et)We can express this as

Pt � Pt�1 ¼ kPt�1 þ et

and

ðPt � Pt�1Þ=Pt�1 ¼ k þ vt

where

vt ¼ et=Pt�1

This shows that the proportional change—the change in policy positions between time 1

and time 2 divided by the policy position at time 1—is a constant. That is, the proportional

(or percentage, if we just multiply by 100) change is a constant, k. This proportional growth

increment is constant across time.

The pure incremental model predicts a normal distribution for first differences; the

Gibrat model applied to government budgets implies that the percentage change distribution

will be normal. The constant, k, just augments each value of the frequency distribution and

hencewill not affect the shape of the distribution.Whatwewould observe is a location of the

center of the distribution at some positive number rather than the 0 predicted by the pure

incremental model. Of course, punctuated change can coexist with upward drift. In the

United States, the typical program has grown at 4 percent or so since 1947. The Gibrat form

of the incremental model, however, predicts that the 4 percent growth is the whole story and

that all the other changes would just fall in a normal distribution around this value.

It is critical to understand that a straightforward incremental policy process will

invariably lead to an outcome change distribution that is normal. And vice versa: any

normal distribution of policy outcome changes must have been generated by an

incremental policy process. Any time we observe any nonnormal distribution of policy

change, we must conclude that incrementalism cannot alone be responsible for policy

change. That is why distributional analyses are so critical to policy studies.

EMPIRICAL EVIDENCE ON BUDGET DISTRIBUTIONS

An examination of empirical budget distributions shows that they are never normally

distributed. The typical pattern is clearly leptokurtic. Figure 1 shows the classic pattern. It

is a pooled frequency distribution of inflation-adjusted annual percentage changes of U.S.

Office of Management and Budget subfunctions for 1947 through 2003. Pooling across

subcategories is necessary because of the relative short length of the time series.

A normal distribution with standard deviation approximately equal to the standard

deviation of the frequency distribution is added to the figure for comparison purposes.1 It is

1 The standard deviation for the raw distribution is 343; for the pooled distribution it is approximately 35.

This is due to the extreme positive values for some categories of expenditure. We have used a standard deviation

of 30 to plot the normal distribution on the graph.

328 Journal of Public Administration Research and Theory

clear from this heuristic comparison, and it is clear from more exacting statistical tests, that

the distribution is not normal.

This ‘‘shape of change’’ is familiar to many students of public policy (Jones, Sulkin,

and Larsen 2003; True, Jones, and Baumgartner 1999). But the distribution of budget

changes for the U.S. national government is not unique; other studies have found similar

distributions in U.S. municipalities (Jordan 2003), British and German national budgets

(Breunig 2003; John and Margetts 2003), Danish local budgets (Mortensen 2003), and

Texas school district expenditures (Robinson 2004). The pattern is general, and the

implication is clear: public budgeting is not incremental. What is to be explained is the

leptokurtic distribution of changes.

Punctuated equilibrium (Baumgartner and Jones 1993) predicts outcomes consistent

with budgetary leptokurtosis, with long periods of policy stasis interrupted episodically

with bursts of rapid policy change. But punctuated equilibrium is narrower than

incrementalism; it is a policy-making model but not fundamentally a decision-making

model. In important ways, incrementalism is both, because it predicts a path of policy

outcomes (‘‘product incrementalism’’) and a decision-making style (‘‘process incremen-

talism’’). However, underlying punctuated equilibrium is a decision-making model,

attention-driven choice (Jones 2001; Jones and Baumgartner 2005). Attention at the

individual and collective levels governs the shift from stasis to the positive feedback

processes that define rapid change. By providing a model of choice that is consistent with

both incrementalism and punctuated equilibrium, we hope to put to rest the confusion that

has characterized discussions about decision making and public policy.

Figure 1Pooled Frequency Distribution of Annual Percentage Changes in U.S. Congressional Budget Authority,Fy1947–2003, in Constant 2003 Million Dollars

0

20

40

60

80

100

120

140

-100 -90 -80 -70 -60 -50 -40 -30 -20 -10 0 10 20 30 40 50 60 70 80 90 100 110 120 130 140 150

Category of Annual Percentage Change, Constant $2003mil

Fre

qu

en

cy

Jones and Baumgartner A Model of Choice for Public Policy 329

IMPLICIT INDICATORS AS UPDATING

Two different perspectives have guided studies of information processing in politics. In one,

information is viewed as a scarce good, and a decision maker must pay search costs of some

form or another to update his or her beliefs about the world (Downs 1957; Krehbiel 1991).

Information is supplied only when it is paid for (the search costs). In the second perspective,

information is freely supplied, but it is of varying reliability, and the decision maker must

prioritize the competing messages. Our model is based in this second perspective, which is

more relevant for policy choice. Simon (1996) writes of an ‘‘information-rich’’ world where

attention, not information, is the scarce good, and Rick Hall notes that ‘‘policy relevant

information is abundant, perhaps embarrassingly rich, on Capitol Hill’’ (1996, 90). The

reasons for such information oversupply are twofold. The first is that the incentives for

interest groups, think tanks, and administrative agencies are to produce rather than to

withhold information; otherwise your competitor will supply the information. So in politics,

unlike economics, the incentives are to produce rather than withhold information. Second,

Congress has established in the past many agencies whose primary or even sole duty is to

produce information—reports, analyses, testimony, and so on.

So in politics a good starting point is to ask how policy makers attend to and prioritize

information.2 We actually have good theories about what to do if we have lots of noisy

information about the state of the world. The simple, basic weighted average is the

workhorse in information-rich situations. In educational testing, we weight items by

reliability to produce a score, or index, across testing items. The worth of capital markets is

assessed by an index of stock prices weighted by market shares. Economies are judged by

weighted averages of goods and services. In political science, the positions of legislators

are judged by Poole-Rosenthal scores, which are based on roll-call votes weighted by their

relevance to an underlying dimensional structure.

In all of these and many more situations a decision maker explicitly forms an index

out of numerous, often noisy sources of information and keys future choices to the value of

the index. But decision makers invariably are producing implicit indicators on virtually

every choice they make. Probably the most vivid description of this process of implicit

index construction is Doug Arnold’s (1990) description of how legislators estimate the

potential preferences, which are preferences that are potentially evoked in an election

campaign. Arnold writes that legislators ‘‘talk with and listen to their constituents, they

read their mail, they watch how issues develop over time, they look for clues about salience

and intensity, they consider who might have an incentive to arouse public opinion, they

learn from others’ mistakes . . . legislators need only combine estimates from various

sources in order to estimate their own constituents’ potential preferences’’ (1990, 10).

The trick is in the combining. How are these diverse sources combined in a sensible

manner to reflect the changing state of the world? Combining messages means both getting

the sources right and getting the weights right. Not all sources in Arnold’s potential

preference study are equally valid and reliable. If one has good estimates of reliability, then

those can serve as weights, but this will not solve the salience problem. An indicator may

shift its relevance to political action rapidly in the political fray. Prior to the publishing of

photographs of prisoner abuse at Abu Ghraib Prison in Iraq, policy makers had treated this

2 This does not mean that searching is unimportant; clearly at some level it is critical, but search alone does not

solve the prioritization problem.

330 Journal of Public Administration Research and Theory

aspect of the occupation as irrelevant, even though there was plenty of information that

indicated problems. The vividness of the photographs shifted the salience of this issue.

RATIONAL UPDATING

The bestway to update one’s beliefs about theworldwhen information is plentiful and sources

are fallible is by keying action to an index made up of a weighted combination of indicators,

with the weights determined by relevance to the part of the world being monitored and the

reliability of the information. We leave the question of how weights are determined aside for

the present, but we note that there are standard ways in some circumstances for dealing with

them. For example, relevancemay be judged through interitem correlations (such as is done in

creating standardized tests), and reliability may be judged though repeated measures.

The implicit index model, simply a weighted average of indicators, can be written as

Lt ¼ v1tI1t þ v2tI2t þ . . .þ vktIkt þ gt ½3�where

Lt is the value of the index at time t,

Ikt is the kth indicator of the state of the world,

vkt is the weight for the kth indicator,

and gt is a random error component.

If the index is used to update prior beliefs about the world, we can write

Dt ¼ kLt � Dt�1 þ jt

Dt ¼ kðv1tI1t þ v2tI2t þ . . .þ vktIkt þ gtÞ � Dt�1 þ jt

or

ðDt � Dt�1Þ ¼ kðv1tI1t þ v2tI2t þ . . .þ vktIkt þ gtÞ þ jt ½4�where

Dt is the decision at time t,

Dt�1 is the decision at time t � 1,

jt is a random component,

and k is just a constant to adjust the units of the index to the units of the decision.

The change from last period’s decision is just keyed to the value of the index. That is,

a decision maker in a choice situation would examine an index comprising a weighted

combination of indicators and update his or her beliefs based on this index. The decision

would be a direct consequence of this updating.

STOCHASTIC PROCESS IMPLICATIONS OF THE IMPLICIT INDEX MODEL

What happens if we were to examine a frequency distribution of decision-to-decision first

differences where decision makers were using an implicit index model of the form of

Jones and Baumgartner A Model of Choice for Public Policy 331

equations 3 and 4? We know that a pure incremental model of decision making yields

a normal distribution of first differences. In the case of the implicit indicator approach, we

knownothing about the particular distributions of underlying indicators, but it would be very

difficult to assume that these indicators were normally distributed. Most indicators are

probably not normally distributed, since they could indicate the need for policy action due to

wars, natural disasters, financial crises, and so forth, none of which is likely to be distributed

normally. In the limit, however, a weighted combination of these distributions will be

normally distributed, so long as there is a sufficient number of indicators and the weights are

not radically different from one another. This is a result of the central limit theorem,which is

remarkably robust with respect to the form of the linear combination of the indicators.

As a consequence, the distribution of first differences under conditions of rational

updating will be normal. But we note that incremental decision making under the standard

assumptions yields a normal distribution. In fact, the standard incremental model has

a ‘‘hidden assumption’’ in it: that decision makers update in a fashion consistent with the

implicit indicator approach. That is, the incremental model will yield a normal distribution

of outcomes only if policy changes are keyed to a sum of external events.3 If incremental

decision makers do not update according to an approximation of the implicit indicator

approach as laid out here, the distribution of their decisions will not be normal.

It turns out that the central limit theorem is very robust with respect to the number of

variables that must be combined into an ‘‘index’’ in order to yield a normal distribution.

We may show this by using a simple simulation. We have drawn a sample of 10,000

random digits for five different variables.4 These will serve as the indicators of problems

facing government. We may think of these as various indicators of an underlying problem.

To take one example, we can think of intelligence analysis about the potential threat from

a potential enemy abroad. These indicators must be combined in order to make judgments

about the necessity of government action.

Some of these indicators may be subject to severe threshold effects—for example, an

indicator of the threat from North Korea could increase nonlinearly if a serious attempt at

acquiring nuclear arms is discovered. Others may not be. The central limit theorem implies

that if we weight and sum enough indicators, regardless of their distributions, so long as the

weights are not terribly different from one another, the sum will be normally distributed.

A simple simulation illustrates this property graphically. We have applied five

different nonlinear transformations to the five simulated random variables.5 Then we

summed the five variables and prepared a histogram similar to that diagrammed in figure 1,

the budget change histogram. The resulting diagram is presented in figure 2.

It is evident that the distribution approximates the normal distribution, and statistical

tests indicate that it does not differ significantly from the normal. This is in many ways an

astounding result, because of the limited number of variables we included and the very

nonnormal shapes of each of the underlying indicators. Rational adaptation, in the sense of

combining several indicators, each of which may be fallible and skewed itself, will lead

over time to a normal distribution of responses to the problems that government faces. In

3 The implicit index is a decision-making interpretation of how the various ‘‘causes’’ of a decision are

incorporated into the decision.

4 This was done using a uniform distribution with a mean of 0 and a standard deviation of 1.

5 The transformations were powers of 3, 5, and 7; the log of the absolute value; and the exponential of the

variable minus the mean.

332 Journal of Public Administration Research and Theory

general, if government makes policy according to equation 3, then the outcomes would be

normally distributed.

The fact that U.S. budget authority is definitely not normally distributed tells us

something very important. It must mean that adjustments in budgets (that is, changes in

budget allocations) are not simple sums of external challenges. That is, policy makers do

not just study the various sources of information that they have available to them,

combine them in some sort of index, and produce policy keyed to the index. Nor do they

incrementally adjust from the last period’s change with the adjustment keyed to

numerous additive causes, consciously (via index construction) or nonconsciously

(because whatever causes updating somehow mimics index construction). If they did that,

budget outcomes would be normally distributed. Figure 2 shows that this would be the

case even if they were facing a great range of different inputs, each being generated by

a widely different process (and even if none of these input series were normal). As long

as there were many inputs, the combination of many different ones would lead to

a normal distribution of outputs.

Incrementalism is updating from the last period’s policy decision. To make sense out

of the model, we must assume that the updating is random. Ironically, this randomness

occurs only when decision makers key their choices to numerous additive causes. This

could occur consciously, because decision makers construct indexes that they act upon, or

nonconsciously, because the mechanisms forcing choices mimic the index-construction

process. In either case, the process might be characterized as rational updating, because

index construction is a fully rational process in an information-rich world with fallible

Figure 2Frequency Distribution of the Sum of Five Nonnormally Distributed Random Variables

0

40

80

120

160

-0.6

3

-0.5

6

Category

Freq

uen

cy

K = 2.94 (Norm = 3.0)

-0.6

0

-0.5

3

-0.4

9

-0.4

5

-0.4

2

-0.3

8

-0.3

1

-0.2

8

-0.2

4

-0.2

1

-0.1

7

-0.1

3

-0.1

0

-0.0

6

-0.0

3

0.0

1

0.0

4

0.1

1

0.1

5

0.1

8

0.2

6

0.2

9

0.3

3

0.3

6

0.4

0

0.4

3

0.4

7

0.2

2

-0.3

5

0.0

8

Sum of Five Non-Normally Distributed

Variables (powers of 3,5,7, log(abs val)

and (exp - µ)).

Jones and Baumgartner A Model of Choice for Public Policy 333

indicators. If a policy distribution is not normal, then we are left with the conclusion that

incrementalism with index-type updating cannot have occurred, and the process is

something other than fully rational updating. Only additive, index-type updating will yield

normality.

HEURISTICS, BOUNDED RATIONALITY, AND ‘‘INDICATOR LOCK’’

Bounded rationality and attention-driven choice imply that people are unlikely to follow an

index-construction strategy in dealing with most of the choices they face. Rather, they are

more likely to hone in on one aspect of a complex situation and key decisions to that aspect.

They ‘‘lock on’’ to one indicator, which serves as a heuristic for future decision making.

Commonheuristics in politics include the positions of party leaders and interest groups but can

also include single-focus indicators summarized by catch phrases such as ‘‘the axis of evil’’ or

‘‘health care is a right.’’ Such symbolism leads us to judge the state of theworld by reference to

single indicators. Evenwhendecisionmakers relyon a basket of indicators, it is likely that they

shift weights as the context changes, fail to focus on many aspects of the world that may not

immediately be relevant but have serious long-term consequences, and otherwise compromise

the fully rational model of handling diverse signals in an information-rich world.

Unlike the balanced, proportional, and indeed rational updating that is a consequence

of index construction, this is disproportionate information processing (Jones 2001; Jones

and Baumgartner 2005). Some aspects of the world are unmonitored, unattended to; other

aspects are incorporated into the decision process beyond their intrinsic merit. Decisions of

course can be keyed only to those aspects of the world that are monitored. This works fine

unless the unmonitored aspects of the world turn out to be relevant to the decision. If they

are not incorporated in the decision, then errors in decisions—conceived of as the

difference between what a full index would imply for choice and what the incomplete

basket of monitored indicators implies—will cumulate over time. Such an error-

accumulation model (Larkey 1979) implies disjoint and episodic adjustments in decision

making that may or may not be keyed to episodes in the environment.

This is classic bounded rationality in the policy process. Because of the cognitive and

emotional constitutions of decision makers, decision making is cybernetic, continually

underadjusting and then overcorrecting in an erratic path. Suddenly decision makers

recognize that previously ignored facets of the environment are relevant and scramble to

incorporate them. Choice is attention driven because unmonitored aspects of reality must

be brought into the choice calculus as it becomes impossible to ignore them. Decisions are

always ‘‘catching up’’ to reality; generals are always fighting the last war.

The mistake, and maybe the only mistake, of the early incrementalists was the failure

to recognize the role that attention plays in information updating. They understood the role

of bounded rationality in forcing adjustments from the existing policy choice, but they did

not appreciate the full implications of bounded rationality for error accumulation in

incremental decision making and the consequent need to update episodically.

Institutions impose error correction by providing incentives to those who make course

corrections. The legislator who fails to estimate the ‘‘potential preferences’’ of his or her

constituents runs the risk of electoral defeat. The business executive who ignores market

trends may watch as the company’s value declines. The worker who shirks risks the loss of

a job. The more efficient the mechanisms that enforce error correction, the less erratic the

decision path will be.

334 Journal of Public Administration Research and Theory

STOCHASTIC PROCESS IMPLICATIONS

What are the distributional implications of attention-driven updating? Indicator lock

implies that the weights for the basket of indicators that the decision maker implicitly uses

to monitor the world are unequal, probably severely so. In this case, the central limit

theorem will not guarantee that the sum of a set of random variables will converge on

a normal distribution as the number of indicators in the basket increases.

We may simulate this disproportionate response process in a manner similar to our

simulation of proportionate information processing. We again generated 10,000 random

numbers each for five separate nonnormally distributed variables. This time, instead of

weighting each one equally, we gave one indicator a weight of 0.8, and the rest were

weighted at 0.05.6 Then we summed the weighted indicators and plotted the results as

shown in figure 3.

The distribution is not at all normal. It is leptokurtic, with a kurtosis of 5.65. This

distribution cannot have resulted from the nonnormality of indicators; it can only have

been generated by the weights. Mathematically, the central limit theorem does not hold

when the weights of the summed random variables differ from one another by a large

amount. They do not, however, need to be equal; they just cannot be as wildly dissimilar as

in our simulation.

Figure 3Frequency Distribution of the Sum of Five Nonnormally Distributed Random Variables with OneDisproportionately Weighted

0

100

200

300

400

-0.8

7

-0.8

1

-0.7

6

-0.7

0

-0.6

4

-0.5

9

-0.5

3

-0.4

8

-0.4

2

-0.3

7

-0.3

1

-0.2

5

-0.2

0

-0.1

4

-0.0

9

-0.0

3

0.0

2

0.0

8

0.1

4

0.1

9

0.2

5

0.3

0

0.3

6

0.4

1

0.4

7

0.5

3

0.5

8

0.6

4

0.6

9

0.7

5

0.8

1

Categories

Freq

uen

cy

Sum of Five Non-Normally Distributed Variables

(powers of 3,5,7, log(abs val) and (exp- µ)) with

cube function heavily weighted).

K = 5.65 (Norm = 3.0)

6 The overweighted indicator was the cube. Overweighting any of the other indicators yields similar results,

although the extent of the leptokurtosis changes.

Jones and Baumgartner A Model of Choice for Public Policy 335

If the weighted indicators were normally distributed, then the weighted series would be

closer to normal. But a decision maker relying on a single indicator whose distribution was

normal would be just ‘‘getting lucky,’’ because there is no statistical reason (or empirical

reason that we can discern) for assuming that an arbitrarily chosen input stream would be

normal. If a few indicators are simultaneously monitored, however, the result is a normal

distribution of information. In particular, no expectation about the distribution of outputs can

be asserted based on the happenstance that an arbitrarily chosen input distribution is normal.7

This is important to grasp. Even if each component part of informational input is

nonnormally distributed, the full input distribution will be, so long as decision makers

monitor a ‘‘basket’’ of indictors. If they produce policy responses that are proportional to

the basket of indicators, they will produce normally distributed outputs. If they ‘‘panic’’ in

response to one indicator, then the outputs will not be normal. They will be leptokurtic.

Leptokurtic distributions in policy choice are prime indicators of disproportionality in the

choice process.

Moreover, while any particular major change from the status quo can be explained

with reference to specific exogenous events, the distinct budgetary leptokurtosis so in

evidence cannot be explained with reference to the entire set of exogenous events. This

paradox is a direct and unavoidable result of the central limit theorem. Given enough time

and a few indicators, normality in outputs will prevail. Policy leptokurtosis is explicable

only through a model of choice centering on the internal dynamics of policy making. One

cannot find explanations of leptokurtic outputs in the input distributions alone.8

UPDATING AND ATTENTION-DRIVEN CHOICE

Decision makers are bombarded with information from many sources, and they may seek

out other sources to inform themselves. How do they prioritize the information from these

many sources, and how do they combine them in making decisions? How do they update

their beliefs about the world and incorporate these new beliefs into decisions? The best way

would be to weight the information streams by importance and add them to make an index.

If participants in an institution receive information from independent diverse streams and

weight and sum these diverse streams in an index, then the resulting distribution would be

normal by the central limit theorem, at least in the limit.

Let us now turn to less-than-perfect human systems. If individual decision makers rely

on a limited set of indicators to monitor their environments, and update them or include

newly salient aspects of the environment in the decision-making calculus episodically, the

result will be a flow of ‘‘news’’ (that is, the information flow that the decision maker

attends to) that is not normal. If decision makers act on the ‘‘news,’’ rather than a basket of

indicators, they will produce a distribution of outcomes that is not normal. Attention-driven

choice guarantees nonnormal distributions of policy outputs.

The cognitive architecture of the decision maker imposes a selective bias on the flow

of information. Of course, decision makers in politics will not cling forever to bad

information, but they undoubtedly believe it far beyond its utility. When the information is

7 This assumption is commonly made by researchers studying policy outputs using a regression framework

when they uncritically assume that the distribution of ‘‘errors’’ or ‘‘disturbances’’ is normal.

8 Attention-driven choice does not imply that decision making is disconnected from the flow of events, and

there surely can be circumstances when weights are shifted in a manner that matches event severity. That will not

change the powerful stochastic implications of the model, however.

336 Journal of Public Administration Research and Theory

exposed as faulty, the decision maker must shift to a new understanding of the situation. In

effect, the decision maker locks choice into a set of facts based in the past and must update

in a punctuated manner in the face of change that cannot be ignored. The ‘‘news’’—that

part of the information stream a decision maker attends to and interprets—is leptokurtic.

We have arrived at two very important results. First, pure incremental decision making

updated by proportional responses to incoming signals will result in a normal distribution of

policy changes. Proportional information processing, when there are multiple, fallible

indicators, implies a normal distribution of choices. Updating a choice from a prior standing

decision does not change this result. Incrementalism hinges completely on the pro-

portionality assumption, although mostly this has gone unrecognized. As a consequence,

proportionate updating in the incremental model is rational adaptation.

Incremental decision making updated by disproportional decision making, however,

seems to lead to leptokurtic output distributions. Our model of updating recognizes that

decision makers often overweight a single indicator among several. As a decision maker is

forced to update using other potential indicators, a pattern of stability and punctuations

occurs. This is boundedly rational updating.

We do not have any statistical theorems to justify this claim, but it is strongly

suggested by our simulation. Several of the indicators included in the model were upward

sloping, approximating threshold effects which suggest response only after a certain level

of severity is reached. Others were downward sloping, suggesting a rapid response, then

leveling off. In either situation, leptokurtic output distributions resulted from reliance on

a single indicator.

We have analyzed decisions on a single policy topic, but a similar model holds among

topics. Political leaders typically must juggle numerous policy topics, investing attention in

a one-at-a-time manner. This juggling involves overattention to one area as all are chang-

ing. The result is an outcome distribution across policy areas that is leptokurtic. The logic

is similar whether we focus on choices involved in a single decision or we focus on the

panoply of issues that the political system processes.

The converse of these propositions is also true: normal output distributions invariably

indicate incremental decision making with proportional updating, and leptokurtic output

distributions are characteristic indicators of disproportionality in the choice process. If we

observe such output distributions, we can conclude that disproportionate information

processing is occurring.

FRICTION IN POLITICAL INSTITUTIONS

We have concentrated thus far on human factors in decision making that generally lead to

disproportionate information processing. Even without the friction of formal institutional

arrangements, policy would be produced disproportionately. Add institutions into the mix,

and the disproportionality can be magnified. One advantage of the stochastic approach we

employ here is that we can examine theoretically these two sources of disproportionality

even though we have no idea of the particular combinations that might emerge in any

particular situation.

We need to be somewhat more precise about the idea that decision-making costs lead

to institutional friction. The payoff will be a very general framework for studying political,

economic, and social change where interactions among actors are structured by institutions.

An institution may be defined as a set of individuals acting according to common rules

Jones and Baumgartner A Model of Choice for Public Policy 337

resulting in collective outcomes. Institutional rules are not neutral, in the sense that

different rules often lead to different outcomes (Jackson 1990, 2). These aggregations of

individuals interacting according to rules react to information from the environment and

come to a collective response (even if the collective response is simply the sum of

individual actions, as it is for markets and elections and roll-call voting in legislatures).

Decision-making systems impose four kinds of costs inmaking decisions in response to

a changing environment: decision costs, transaction costs, information costs, and cognitive

costs. Decision costs are costs that actors trying to come to agreement incur. They include

bargaining costs and institutionally imposed costs, such as those built into a separation-of-

powers governing arrangement (Bish 1973; Buchanan and Tullock 1962). Transaction costs

are costs that parties incur after they come to agreement (North 1990). In market

transactions, these involve such items as the cost of insuring compliance to contractual

agreements and other payments to third parties to complete the transaction. It ought to be

clear that in advanced democracies decision costs in the policy-making process heavily

outweigh transaction costs. Bringing relevant parties to agreement in a system of separated

powers (decision costs) generally outweighs the costs of holding hearings, enacting statutes,

or changing budgetary allocations once agreement has been reached (transaction costs). In

any case, we combine these costs in our analysis, terming them together ‘‘decision costs.’’

Information costs are search costs—costs of obtaining information relevant to making

a decision. These are costs that exist when a person (or an organization) wants to make

a decision. Cognitive costs are costs associated with the limited processing capacity of any

social institution made up of human beings. These are costs that occur because people do

not know they need to make a decision. If one is not attending to a key component of the

environment, then he or she cannot decide to incur search or information costs. Information

and cognitive costs will be imposed in any decision-making system, but decision and

transaction costs are highly sensitive to the particular rules and procedures of institutions.

These are pure institutional costs.

Institutional costs in politics may approximate the manner in which friction operates

in physical models. How can we assess the level of friction that is present in a decision-

making institution? In essence, we will treat the cognitive architectures of decision makers

as part of a general ‘‘cost structure’’ that affects the processing of information. That will

allow us conceptually to integrate the formal institutional costs with the ‘‘cognitive costs’’

of boundedly rational decision makers.

The manner in which a policy-making system responds to information is critical in

assessing policy change. As we have seen, the major problem with the initial incremental

model of policy change is that it did not incorporate the flow of information from outside

the system. No matter what the external challenge, the system responded incrementally.

That is quite unrealistic and leads to models that are easily rejected. If we can understand

how decision-making systems respond to information in the absence of any institutionally

imposed costs, then that idealized model can serve as a basis of comparison for systems

that impose such costs.

A hypothetical fully efficient decision-making institution that imposed no costs would

respond seamlessly to the world around it. That is, it would incorporate all relevant aspects

of the information it encountered and would ‘‘use up’’ all the information in its decision-

making process. The outputs of such a system would perfectly reflect the information flows

coming from its environment (Simon 1996). If there were big changes in the environment,

the system would respond with big changes. Similarly, small changes would generate only

338 Journal of Public Administration Research and Theory

small changes. The major example of such a cost-free system is the classical model of

a competitive economy.

In such a pure system,

R ¼ bS ½5�

where

R 5 response 5 �O 5 change in output,

S 5 information (signal),

and b 5 benefits derived from the information flow (,1).

The system reacts directly to the input flow by changing its output. What happens in

real institutions in which decision-making costs are imposed? If costs are assumed to act

linearly on the system, then

R ¼ bS� C ½6�where

C 5 costs.

Our hypothetical system continues to respond directly to the input flow. Now,

however, it will not act until it recovers the costs that must be invested in reacting to the

flow of information. Where costs are low, signals of low power get reflected into public

policy. Where costs are high, only the strongest signals are translated into public policy.

But the addition of set decision costs would have no great impact on the classical model; it

simply generates a constant subtraction from the reaction of the system to the inputs—the

reaction remains proportionate. In any case, set costs are not realistic.

In politics costs are imposed only when actors take the trouble to use the system to

block action. For minimal changes, actors who would normally be opposed might not take

the trouble. For major changes, they can mobilize and make use of the system to try to

block changes, but they can also get on a bandwagon and push for even greater action than

the signal might indicate. Costs might be proportionately high for signals of low strength

(making the response less than the signal); but they might decline as the signal got stronger

(making the response potentially more powerful than the signal). This leads to a model in

which costs go down as the strength of the signal increases. While we cannot know exactly

the form of the equation translating inputs into outputs, we do know that it is multiplicative

rather than additive as in equation 6. The signal and institutional costs interact with each

other to magnify the effects of the signal. This severely complicates matters and generally

leads to leptokurtic output distributions:

R ¼ bS3C ½7�In this model, costs interact with the signal.

DISTRIBUTIONS

What would the different types of costs we just described generate in terms of distributions

of outputs, when dealing with the same series of inputs? Figure 4 depicts idealized

Jones and Baumgartner A Model of Choice for Public Policy 339

response functions to input flows for a frictionless cost-free policy system, a system with

fixed institutional costs, and an interactive system. The frictionless system is highly

sensitive to incoming information. For a hypothetical one-unit change in relevant

information, the system responds with a proportional level of outputs. (If b 5 1, then the

inputs and the reactions are equal; if b. 1, outputs are stronger than inputs; if b, 1, then

outputs are less than the inputs. But in any case the reactions are directly proportionate to

the size of the input; this is reflected in the straight line going up from the origin along the

45-degree angle; it reflects a hypothetical b of 1.)

Figure 4 shows three curves: the frictionless one just described, one with fixed costs

(also a straight line but to the right of the first one), and one with interactive costs (showing

responses being very low but curving sharply upward as the size of the signal grows). The

system with fixed institutional costs ignores signals of low intensity and then responds

proportionally to the strength of the signal after some threshold in signal strength is

reached. Like the first one, this model reacts proportionately but systematically at a lower

level of response than if there were no decision costs. But let us consider the third line in

some detail. This is the one where costs interact with the strength of the signal. In fact, the

way we have modeled it here, costs reduce action up to some threshold and then gradually

shift so that they amplify rather than reduce the reaction of the system to larger inputs. Such

a model will produce virtually no response when signals are low but massive reactions to

strong signals; leptokurtosis results from its disproportionality.

COMPLEXITY IN INFORMATION PROCESSING

The preceding discussion reflects the complexity of human decision-making systems. We

have here tried to simplify by analyzing institutional costs within a single framework. The

key question is how people interacting in political institutions process and respond to

signals from the environment. If institutions add friction to informational inputs, then

Figure 4Information-Processing Policy Systems with Institutional Costs

without costs

Response

with linear costs

with interactive costs

Signal

340 Journal of Public Administration Research and Theory

outputs will not be directly related to inputs. But how will inputs and outputs differ in

policy-making systems?We posit that whatever the input flow, the output flow will be both

more stable (ignoring many important signals) and more punctuated (reacting strongly to

some signals).

Lots of work in political science points toward an information-processing approach

with political institutions playing major roles in creating the friction and disjointedness

associated with this approach. Institutional analyses show that a ‘‘policy core’’ exists that is

not responsive to changes in preferences (for example, through replacement of legislators

in elections); but when preferences change enough to move the pivotal legislator’s

preferences outside the core, then major punctuations in policy can occur (Hammond and

Miller 1987; Krehbiel 1998). Policy process scholars have argued that policy agendas

change when attentiveness and mobilization are directed at particular aspects of a complex

environment, raising the probability of major policy innovations based on new ideas.

Again, stability (when attention is not directed at the issue) and punctuation (when it is)

occur in a single process (Baumgartner and Jones 1993). Similarly, in elections, first-past-

the-post voting systems and partisan identifications by voters operate together to add great

stability to election patterns that are nevertheless occasionally disrupted by realignments.

In general, then, institutional decision costs will add to the kurtosis of output distributions.9

SIMULATING GENERALIZED COST STRUCTURES

We now offer some simulations of the effects of generalized interactive cost structures on

the output distributions of decision-making systems. We present the results of two different

simulations. The first is a static simulation, in two stages. For the static simulation we think

of information processing as occurring in stages, one associated with cognitive costs and

one associated with institutional costs. At each stage, costs are assumed to be dis-

proportionate to the size of the input signal. Informational inputs are transformed first

because of the inevitable cognitive costs that would be there no matter what the

institutional setting. The resulting series is then transformed a second time to simulate the

institutional costs that may also be present. For the sake of simplicity, both transformations

are identical. This allows us to know whether a simple two-stage transformation can

generate leptokurtic output distributions of the form of figure 1. Then we turn to a more

complex but more realistic dynamic simulation and ask the same question.

Think of an input stream affecting a policy-making system. We may characterize the

input stream as a distribution. Because informational signals stem from numerous diverse

sources, it is a reasonable assumption that the underlying (but unobserved) input dis-

tribution is normal, as would be the case for the implicit index model. Then the system

imposes nonlinear transformations on the input stream, as in figure 4. This simulates the

case of delay in responding to input signals at low levels of intensity and then responding

with increasing intensity to the signal as it increases. For our static simulations, we use

a cubic transformation. The particular form of the transformation is arbitrary, but the

general logic is not:

9 Institutions can also simplify decisions and overcome information and cognitive costs, leading to less kurtosis

in outputs (Robinson 2004). But American national institutions were designed explicitly to impede overreacting

and hence should lead to more kurtosis. Federalism, however, ought to operate against kurtosis by undermining

veto coalitions (Baumgartner and Jones 1993).

Jones and Baumgartner A Model of Choice for Public Policy 341

R ¼ bS3 ½8�

Before we simulate the likely situation of a normal input distribution, we present in

figure 5 a simulation for the case of a uniform input distribution in order to get a firmer

understanding of just what the transformations do. This is a kind of limiting case in which

the world has some uncertainty but may be monitored by one indicator, and that indicator is

uniform and unchanging. We generated 10,000 random numbers drawn from a uniform

distribution with a mean of 0 and a standard deviation of 1. We cubed these numbers once

and cubed the resulting numbers once again. Then we made frequency distributions for all

three sets of 10,000 numbers. The input series, being uniform random, has a strongly

negative kurtosis value (e.g., it is platykurtic rather than leptokurtic). The first cube law

transformation yields a kurtosis of 3.70, slightly more than the normal, while the second’s

kurtosis is 9.73 and is leptokurtic. Even in a hypothetical uniform world, nonlinear

cognitive and institutional costs will yield leptokurtic output distributions.

Now we turn to a more realistic distribution of inputs in a complex world. The central

limit theorem and the associated implicit index model dictate that the input distribution

would be normal if diverse input streams are combined to yield an index or sum of the

indicator values. Figure 6 simulates this situation, again with the two sequential cube

transformations. Again the distributions are highly leptokurtic, with the first transformation

producing a kurtosis of 36.30, and the second, 977.44. In both of these two important cases

for the distribution of information coming into a policy-making system, outputs will be

leptokurtic when costs are nonlinear.

Figure 5Frequency Distributions of a Uniform Information Input with Two Cube Law Transformations AppliedSequentially. (The y-axis is truncated to illustrate the differences between the bodies of thedistributions.)

0

20

40

60

80

100

120

140

160

180

200

-1.00-0.92-0.84-0.77-0.69-0.61-0.53-0.45-0.37

-0.30

-0.22-0.14-0.06 0.0

20.090.170.250.330.410.480.560.640.720.800.870.95

Uniform input distribution

k = 1.79

First cube law transformation:

k = 3.70

Second cube law transformation:

k = 9.73

342 Journal of Public Administration Research and Theory

Much more important, however, is the fact that the leptokurtosis increases

disproportionately as the costs move from cognitive costs alone (the first cube law

transformation) to cognitive costs and institutional costs (the second transformation). This

happens regardless of the input distribution—the ordering of the distribution by

extensiveness of cost imposed leads to a parallel ordering of the magnitude of kurtosis.

Remember that an informationally efficient institution (or, for that matter, decision maker)

would translate information into policy outputs in a proportional manner. As costs are

imposed, either by the cognitive ‘‘stickiness’’ of the decision maker or by the formal

‘‘stickiness’’ of the political institution, the result is increasing kurtosis in the distribution

of outputs.

FURTHER OBSERVATIONS ON THE TRANSFORMATIONS

We have reason to expect that cognitive costs will be added in a convex curve relationship

like the cube law represents. Attention allocation and the general bias toward the status quo

in most systems of decision making work to delay responses; but then internal dynamics

can operate to respond increasingly intensely to the stimulus via positive feedback effects.

The cube law and other upward-turning, convex curves model this kind of general process.

It is also possible that cognitive costs act to cause immediate overreaction and then

a dampening down of response. This would be modeled by a concave curve, such as the

Figure 6Frequency Distributions of a Normal Information Input with Two Cube Law Transformations AppliedSequentially. (The y-axis is truncated to illustrate the differences between the bodies of thedistributions.)

0

100

200

300

400

500

600

700

800

900

1000

-10

-8.7

5

-7.5

-6.2

5-5

-3.7

5

-2.5

-1.2

5 0

1.2

52.5

3.7

5 5

6.2

57.5

8.7

510

Category

Fre

qu

en

cy

Normal Input Distribution

k = 2.998

First cube law transformation

k = 36.3

Second cube law transformation

k = 977.44

Heavy tails are truncated

Second cube law

First cube law

Jones and Baumgartner A Model of Choice for Public Policy 343

logarithm or a power function under 1.0. But based on our understanding of the structures

of American government, we are pretty sure that the institutional costs of the Madisonian

variety operate to cause delays in responses. These institutional facets can be overcome,

but they generally operate in a single direction: toward more delay. Therefore, we can

imagine the two sets of costs in our model to operate differently; we assess that possibility

below.

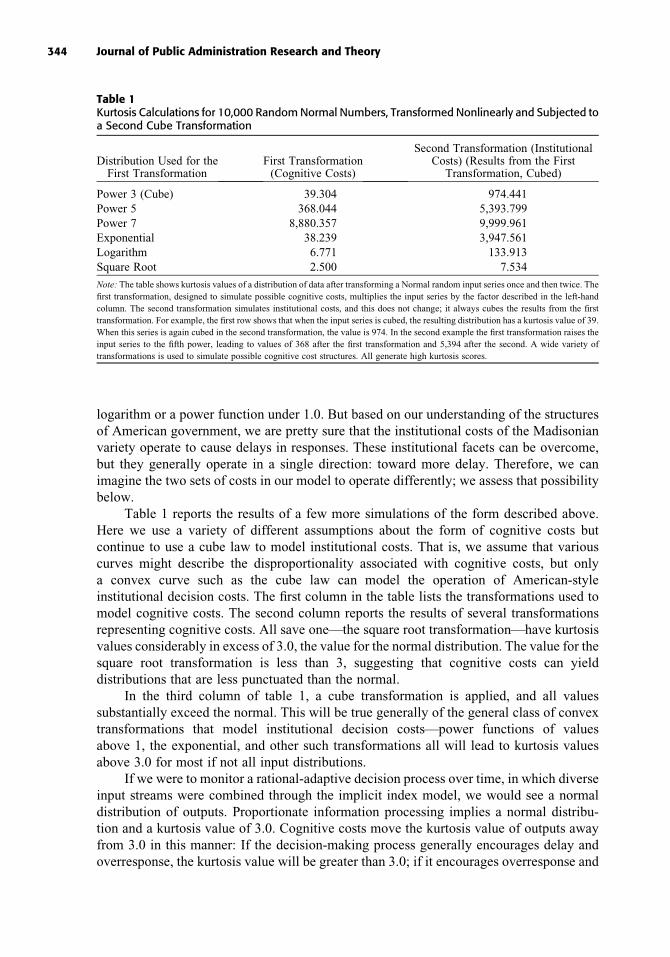
Table 1 reports the results of a few more simulations of the form described above.

Here we use a variety of different assumptions about the form of cognitive costs but

continue to use a cube law to model institutional costs. That is, we assume that various

curves might describe the disproportionality associated with cognitive costs, but only

a convex curve such as the cube law can model the operation of American-style

institutional decision costs. The first column in the table lists the transformations used to

model cognitive costs. The second column reports the results of several transformations

representing cognitive costs. All save one—the square root transformation—have kurtosis

values considerably in excess of 3.0, the value for the normal distribution. The value for the

square root transformation is less than 3, suggesting that cognitive costs can yield

distributions that are less punctuated than the normal.

In the third column of table 1, a cube transformation is applied, and all values

substantially exceed the normal. This will be true generally of the general class of convex

transformations that model institutional decision costs—power functions of values

above 1, the exponential, and other such transformations all will lead to kurtosis values

above 3.0 for most if not all input distributions.

If we were to monitor a rational-adaptive decision process over time, in which diverse

input streams were combined through the implicit index model, we would see a normal

distribution of outputs. Proportionate information processing implies a normal distribu-

tion and a kurtosis value of 3.0. Cognitive costs move the kurtosis value of outputs away

from 3.0 in this manner: If the decision-making process generally encourages delay and

overresponse, the kurtosis value will be greater than 3.0; if it encourages overresponse and

Table 1Kurtosis Calculations for 10,000 RandomNormal Numbers, Transformed Nonlinearly and Subjected toa Second Cube Transformation

Distribution Used for theFirst Transformation

First Transformation(Cognitive Costs)

Second Transformation (InstitutionalCosts) (Results from the First

Transformation, Cubed)

Power 3 (Cube) 39.304 974.441

Power 5 368.044 5,393.799

Power 7 8,880.357 9,999.961

Exponential 38.239 3,947.561

Logarithm 6.771 133.913

Square Root 2.500 7.534

Note: The table shows kurtosis values of a distribution of data after transforming a Normal random input series once and then twice. The

first transformation, designed to simulate possible cognitive costs, multiplies the input series by the factor described in the left-hand

column. The second transformation simulates institutional costs, and this does not change; it always cubes the results from the first

transformation. For example, the first row shows that when the input series is cubed, the resulting distribution has a kurtosis value of 39.

When this series is again cubed in the second transformation, the value is 974. In the second example the first transformation raises the

input series to the fifth power, leading to values of 368 after the first transformation and 5,394 after the second. A wide variety of

transformations is used to simulate possible cognitive cost structures. All generate high kurtosis scores.

344 Journal of Public Administration Research and Theory

then dampening down, the value will be less than 3.0. Because of the manner in which

attention must be allocated, we expect that generally the former will be true, but there is no

way to be absolutely certain. We can say with certainty, however, that decision-making

costs, such as those imposed by formal American governing institutions, will work to

increase kurtosis values, because they build in delay. This institutional delay implies that

no response occurs for low input values. The accumulated delay, however, has a corollary:

overresponse when response finally does occur.

DYNAMIC SIMULATIONS OF INSTITUTIONAL FRICTION

Now we turn to a dynamic simulation of institutional friction. In association with Professor

James Stimson of the University of North Carolina, we have designed a computer

simulation to study the effects of institutional friction on the distribution of policy

outputs.10 Our theory is dynamic, so the model is similarly dynamic, but it is more complex

than the simple transformations we discussed above. We ask the basic question of whether

a simple dynamic model of institutional friction can generate leptokurtic output dis-

tributions of the form of figure 1. If we can confirm our static simulations with a dynamic

one, we will be all the more confident that we are on the right track.

The model examines only the friction component of our theory; it does not

incorporate negative or positive feedback effects that can affect the policy process. It has

four fundamental components:

a signal that is input into a hypothetical policy-making system

a friction mechanism that sets a threshold below which the system responds only partially

an error accumulation feature that builds up pressure in the environment that may produce

subsequent policy action

a response that is dictated by the strength of the input signal and institutional friction that has

accumulated from previous periods

Basically we draw an input signal from a normal distribution and run it through

a system that adds friction. Friction is modeled by a parameter that operates as a threshold.

Above the threshold, the signal generates a response equivalent to the strength of the

signal—the signal has overcome the friction. Below the threshold, it generates a partial

response. Friction is slowing down the response. If the ‘‘partial’’ response is set to 0, then

below the threshold we have ‘‘gridlock’’—no response whatsoever. If the partial response

is positive, then the system responds to the input signal with some fraction of the signal

strength. The policy-making system has added friction by attenuating the response but not

entirely blocking it. The model also has an ‘‘error accumulation’’ feature by which partial

responses allow the system to get out of adjustment to its informational environment. That

part of the signal that is not responded to accumulates and can affect the policy-making

process in the future.

10 We are deeply indebted to Professor Stimson, who suggested the idea of a dynamic simulation and wrote the code.

The code is available from us at http://www.policyagendas.org.

Jones and Baumgartner A Model of Choice for Public Policy 345

The model has two variables, the information signal and the policy response, and it

has three parameters that model the institutional friction and govern the policy response.

The signal flows through the system, generating a policy output that is dependent on the

operation of this simulated institutional system.11 We simulate the input signal at time t by

a random draw from the standard normal distribution (that is, with a mean of 0 and

a standard deviation of 1). One might think of this as input from an implicit index with

‘‘rational adaptation,’’ so that the simulation will focus on institutional friction alone.

The friction parameter, C, acts as a threshold, and its level can be set by the user of the

simulation. Above the value of C, the signal generates a response proportional to the

strength of the signal. Below the value of C, the signal generates only a partial response.

The extensiveness of the response is governed by the efficiency parameter, l; if l5 1, then

there is essentially no threshold and no institutional friction. The signal passes through the

institutional frame unhindered, generating a response proportional to its strength. If l5 0,

then there is no partial response to the signal, and friction is at its maximum. The l

parameter is also user specified.

If the signal is hindered, that portion of the signal that does not generate a response

cumulates and is added to the next period’s signal strength. This simulates the buildup of

pressure when problems fester and are only partially addressed. But it is possible that the

whole situation will ‘‘blow over,’’ and that happens in the model when an input signal

receives a negative sign when the cumulated signal is positive (and vice versa). That is, the

model allows accumulated pressures both to build up and to dissipate.

Finally, b, the amplification parameter, is set by the user. b allows for the signal to be

magnified or attenuated in the translation process. It is linear only, whereas positive

feedback effects might be modeled in a more complex fashion. But at present we simply

want to examine whether a simple dynamic friction process can generate leptokurtic

outputs.

The simulation relies on repeated random draws that are run through the system.

These random draws are the St—that is, the hypothetical time series, and t is one million.

Results of our hypothetical policy-making system that has run for a million time periods

11 The model may be written as follows:

The variables:

Rt 5 response

St 5 input signal

The parameters:

C 5 friction parameter

l 5 efficiency parameter

b 5 amplification parameter

Rt ¼ bSt if St þ �S0,k.C; otherwise Rt ¼ lbSt

where

0 , l . 1 (l may vary between 0 and 1),

0 , t . k (the time series goes from period 0 to period k),

and St 5 N(0,1) (each input signal is drawn from a standard normal distribution).

346 Journal of Public Administration Research and Theory

are input into a frequency distribution. This allows us to study the shape of the distribution,

including its kurtosis. We can then alter the friction and other parameters of the system

(there are only three parameters, and each can be adjusted easily by the user) and observe

the results. On a portable computer, each simulation takes just a few seconds, even with

a million observations.

The primary finding from the simulation is clear and unambiguous: for appreciable

friction, output distributions are invariably leptokurtic. Numerous runs of this simulation

yield leptokurtic output distributions.12 A direct comparison between figure 1 and one of

our simulations gives some indication of the extent to which we have properly modeled the

friction process by our simulation. Figure 7 compares directly a simulation incorporating

a great amount of friction with a considerable partial response.13 A normal distribution

with similar standard deviation is presented for comparative purposes. The similarities

between the two are remarkable, with both having strong central peaks and very fat tails.

Clearly institutional friction is capable of producing policy output distributions consistent

with what we observe empirically. Nevertheless, there are some differences; the simulated

graph is not as leptokurtic as the actual data, which have both a more concentrated central

peak and fatter tails. In effect, institutional friction (at least the way in which we have

modeled it) cannot fully account for budget distributions. This is almost certainly due to the

exclusive focus on friction in the model, with no provisions for positive feedback and

cascades, and the assumption that cognitive costs are unimportant.

More complete results are presented in figure 8. There we graph the kurtosis of the

resulting output series against l, the parameter that captures partial response, for three levels

of the threshold parameter. (Recall that the input series are always the same.) The system

works entirely as expected. The stronger the friction, the more punctuated the policy output.

Kurtosis is a function of both the threshold C and the extent of partial response—leakage

through the threshold. As the threshold increases, kurtosis increases exponentially (note the

log scale).When little leakage occurswith a high threshold, kurtosis is exceptionally large—

most of the cases represent no change, but a small number of really big punctuations occur.

When the leakage around the institutional friction reaches amaximum (atl5 1), the level of

the threshold is irrelevant, and kurtosis for all values of the threshold equals 3, the value for

the normal input distribution. No friction, no leptokurtosis. It is that simple.

In general, the dynamic simulation supports our general argument here that the

interaction of cognitive factors with institutional friction invariably leads to a pattern

across time of general stability with episodic punctuations. And our simulations allow us to

show that with friction set to 0 or leakage set to its maximum, there is no punctuation at all.

So we believe there is something important in these parameters that explains the

punctuated equilibrium patterns that we observe in the real data.

THE GENERAL PUNCTUATION HYPOTHESIS

The results of our analyses and simulations lead to a testable hypothesis about the

interaction of boundedly rational decision makers and the institutions within which they

make choices. As all government institutions impose costs, we expect all outputs from

12 This is so for equations in which C 5 1 and greater. The friction parameter has standard deviation units, so

C 5 1 may be interpreted as a system that responds to about one-third of the signals it receives.

13 C 5 3; l 5 0.4; B 5 1.

Jones and Baumgartner A Model of Choice for Public Policy 347

Figure 7Budget Authority (A) and Simulated Institutional Friction Model (B) Note: C 5 3; l 5 0.4; b 5 1.

A

0

20

40

60

80

100

120

140-101 -94-87-80-73-66-59-52-45-38-31-24-17-10 -3 4 11 18 25 32 39 46 53 60 67 74 81 88 95 102

109

116

123

130

137

144

More

Category of Percentage Change

Freq

uen

cy

B

0

2500

5000

7500

10000

-5-4.7-4.4-4.2-3.9-3.6-3.3 -3-2.8-2.5-2.2-1.9-1.6-1.4-1.1-0.8-0.5-0.2

0.040.32 0.6

0.881.161.441.72 22.282.562.843.12 3.4

3.683.964.244.52 4.8

Category

Fre

qu

en

cy

Response:

C = 3, = 0.4, = 1.

K = 370.89

Signal:

K = 2.998

348 Journal of Public Administration Research and Theory

them to show positive kurtosis. As decision-making costs increase—that is, as it is more

difficult to translate informational inputs into policy outputs—the more leptokurtic the

corresponding output distributions. We term this the general punctuation hypothesis. We

have tested this hypothesis and have found very strong evidence in its support (Jones and

Baumgartner in press, ch. 7; Jones, Sulkin, and Larsen 2003). Kurtosis increases as the

(implied) institutional friction of the process increases.

CONCLUSIONS

In this article, we have detailed a robust model of choice that incorporates both

incrementalism and punctuated equilibrium and have developed a fresh look at policy

change using stochastic process methods. Incrementalism and proportional updating to

incoming information, which we show here to be equivalent models, invariably yield

normal distributions of outcomes. Disproportionate updating results in fat-tailed dis-

tributions, basically generated by interdependencies among cases. Our simulations of

friction models suggest that adding costs increases the kurtosis of distributions—the extent

to which they are punctuated.

The institutional friction model is a policy-making model, basically an extension of

our earlier punctuated equilibrium model. Here we have been able to develop a full

underlying decision-making model that supports the policy-making model and subsumes

under it both the incrementalist and the punctuated equilibrium models.

Figure 8Kurtosis Values as a Function of the Extent of Institutional Friction

1

10

100

1000

10000

0 0.1 0.2 0.3 0.4 0.5 0.6 0.7 0.8 0.9 1Lamda

Ku

rto

sis

C = 3

C = 2

C = 1

Jones and Baumgartner A Model of Choice for Public Policy 349

One irony in our study is that the early incrementalists may have erred partly by not

realizing just how right they were. Their model of boundedly rational information updating

clearly recognized that policy makers could not make systematically comprehensive

adjustments to changing environmental signals. The model that we have proposed here and

the empirical results from the U.S. federal budget presented in figure 1 show a tremendous

tendency toward incrementalism. The size of the central peak in these distributions is

enormous when compared to the normal distribution. This reflects the inability or

unwillingness of decision makers to react proportionately to moderate changes in the

environment; rather, they tend to underreact to these. What the incrementalists overlooked,

and what we add in this approach, is the direct corollary of the disproportionate response

that they incorporated in their early models: that information that is ignored will

accumulate over time, producing occasional lurches or policy punctuations. These produce

the ‘‘fat tails’’ characteristic of the leptokurtic distributions that we have shown empirically

and derived through simulations. The incrementalists got it right but told only half the

story. A more general approach, presented here, based on disproportionate response to

information both demonstrates the importance of the original insights of the

incrementalists and makes a more complete and realistic model of the policy process.

REFERENCES

Arnold, Douglas. 1990. The logic of congressional action. New Haven, CT: Yale University Press.

Baumgartner, Frank R., and Bryan D. Jones. 1993. Agendas and instability in American politics. Chicago,

IL: University of Chicago Press.

Berry, William D. 1990. The confusing case of budgetary incrementalism: Too many meanings for

a single concept. Journal of Politics 52:167–96.

Bish, Robert. 1973. The public economy of metropolitan areas. Chicago, IL: Markham.

Breunig, Christian. 2003. Distribution of budget changes in Germany, the United Kingdom, and the

United States. Paper presented at the Western Political Science Meetings, Portland, OR, March

11–13.

Buchanan, James M., and Gordon Tullock. 1962. The calculus of consent. Ann Arbor: University of

Michigan Press.

Cefis, Elena, Matteo Ciccarelli, and Luigi Orsenigo. 2001. The growth of firms: From Gibrat’s legacy to

Gibrat’s fallacy. European Pharmaceuticals Regulation and Innovation System Working Paper.

Davis, Otto A., M. A. H. Dempster, and Aaron Wildavsky. 1966. A theory of the budget process.

American Political Science Review 60:529–47.

———. 1974. Towards a predictive theory of government expenditure: US domestic appropriations.

British Journal of Political Science 4:419–52.

Downs, Anthony. 1957. An economic theory of democracy. New York: Harper-Row.

Fenno, Richard F., Jr. 1966. The power of the purse: Appropriations politics in Congress. Boston: Little,

Brown.

Gist, John R. 1982. ‘‘Stability’’ and ‘‘competition’’ in budgetary theory. American Political Science

Review 76:859–72.

Hall, Richard. 1996. Participation in Congress. New Haven, CT: Yale University Press.

Hammond, Thomas, and Gary J. Miller. 1987. The core of the Constitution. American Political Science

Review 81:1155–74.

Hayes, Michael T. 1992. Incrementalism and public policy. New York: Longman.

Jackson, John E., ed. 1990. Institutions in American Society. Ann Arbor: University of Michigan Press.

John, Peter, and Helen Margetts. 2003. Policy punctuations in the UK. Public Administration 81:411–32.

Jones, Bryan D. 2001. Politics and the architecture of choice. Chicago, IL: University of Chicago Press.

Jones, Bryan D., and Frank R. Baumgartner. 2005. The politics of attention: How government prioritizes

problems. Chicago, IL: University of Chicago Press.

350 Journal of Public Administration Research and Theory

Jones, Bryan D., Tracy Sulkin, and Heather Larsen. 2003. Policy punctuations in American political

institutions. American Political Science Review 97:151–70.

Jordan, Meagan. 2003. Punctuations and agendas. Journal of Policy Analysis and Management

22:345–60.

Kiel, Douglas, and Euel Elliott. 1992. Budgets as dynamic systems: Change, variation, time, and

budgetary heuristics. Journal of Public Administration Research and Theory 2:139–56.

Krehbiel, Keith. 1991. Information and legislative organization. Ann Arbor: University of Michigan

Press.

———. 1998. Pivotal politics: A theory of U.S. lawmaking. Chicago, IL: University of Chicago Press.

Larkey, Patrick. 1979. Evaluating public programs. Princeton, NJ: Princeton University Press.

Lindblom, Charles. 1959. The ‘‘science’’ of muddling through. Public Administration Review 19:79–88.

Mortensen, Peter. 2003. Policy punctuations in Danish local budgeting. Aarhus, Denmark: Institut for

Statkunskab, University of Aarhus.

Natchez, Peter B., and Irvin C. Bupp. 1973. Policy and priority in the budgetary process. American

Political Science Review 67:951–63.

North, Douglass. 1990. Institutions, institutional change, and economic performance. New York:

Cambridge.

Padgett, John F. 1980. Bounded rationality in budgetary research. American Political Science Review

74:354–72.

———. 1981. Hierarchy and ecological control in federal budgetary decision making. American Journal

of Sociology 87:75–128.

Robinson, Scott. 2004. Punctuated equilibrium, bureaucratization, and budgetary changes in schools.

Policy Studies Journal 32:25–39.

Rubin, Irene. 1988. New directions in budgetary theory. Albany: State University of New York Press.

Schick, Allen. 1995. The federal budget: Politics, policy, process. Washington, DC: Brookings.

Simon, Herbert A. 1996. The sciences of the artificial. 3d ed. Cambridge, MA: MIT Press.

True, James L., Bryan D. Jones, and Frank R. Baumgartner. 1999. Punctuated equilibrium theory. In

Theories of the policy process, ed. Paul Sabbatier, 97–115. Boulder, CO: Westview.

Wanat, John. 1974. Bases of budgetary incrementalism. American Political Science Review 68:1221–28.

Wildavsky, Aaron. 1964. The politics of the budgetary process. Boston: Little, Brown.

Jones and Baumgartner A Model of Choice for Public Policy 351


Recommended