http://circres.ahajournals.org/content/68/6/1501World Wide Web at:
The online version of this article, along with updated information and services, is located on the
http://circres.ahajournals.org//subscriptions/
is online at: Circulation Research Information about subscribing to Subscriptions:
http://www.lww.com/reprints Information about reprints can be found online at: Reprints:
document. Permissions and Rights Question and Answer about this process is available in the
located, click Request Permissions in the middle column of the Web page under Services. Further informationEditorial Office. Once the online version of the published article for which permission is being requested is
can be obtained via RightsLink, a service of the Copyright Clearance Center, not theCirculation Researchin Requests for permissions to reproduce figures, tables, or portions of articles originally publishedPermissions:
at Università degli Studi di Milano on March 21, 2013http://circres.ahajournals.org/Downloaded from
A Model of the Ventricular CardiacAction Potential
Depolarization, Repolarization, and Their Interaction
Ching-hsing Luo and Yoram Rudy
A mathematical model of the membrane action potential of the mammalian ventricular cell is
introduced. The model is based, whenever possible, on recent single-cell and single-channel dataand incorporates the possibility of changing extracellular potassium concentration [K].. The fastsodium current, 'Nap is characterized by fast upstroke velocity (Vma.=400 V/sec) and slow recovery
from inactivation. The time-independent potassium current, IKI, includes a negative-slope phaseand displays significant crossover phenomenon as [K], is varied. The time-dependent potassiumcurrent, IK, shows only a minimal degree of crossover. A novel potassium current that activatesat plateau potentials is included in the model. The simulated action potential duplicates theexperimentally observed effects of changes in [K], on action potential duration and rest potential.Physiological simulations focus on the interaction between depolarization and repolarization(i.e., premature stimulation). Results demonstrate the importance of the slow recovery of INa indetermining the response of the cell. Simulated responses to periodic stimulation includemonotonic Wenckebach patterns and alternans at normal [K]0, whereas at low [K]0 nonmono-
tonic Wenckebach periodicities, aperiodic patterns, and enhanced supernormal excitability thatresults in unstable responses ("chaotic activity") are observed. The results are consistent withrecent experimental observations, and the model simulations relate these phenomena to theunderlying ionic channel kinetics. (Circulation Research 1991;68:1501-1526)
In the late 1970s, two models of the electricalactivity of cardiac cells were formulated basedon the formalism introduced by Hodgkin and
Huxley.1 McAllister et a12 developed a model of thecardiac Purkinje fiber action potential. Subsequently,Beeler and Reuter3 published a model of the electri-cal activity of the mammalian ventricular myocyte(referred to as the B-R model in the present paper).The B-R model was based on experimental data thatwere available at the time from voltage-clamp stud-ies. These data were subject to limitations in avail-able voltage-clamp techniques and their applicationto multicellular preparations of cardiac muscle.4 Inaddition, the concentrations of ions in the extracel-lular clefts of the multicellular preparations wereunknown.With the development of single-cell and single-
channel recording techniques in the 1980s, the limi-
From the Department of Biomedical Engineering, Case West-ern Reserve University, Cleveland, Ohio.
Supported by grant HL-33343 from the National Heart, Lung,and Blood Institute, National Institutes of Health, and by afellowship from the Ministry of Education, Republic of China.Address for correspondence: Yoram Rudy, PhD, Department of
Biomedical Engineering, Case Western Reserve University, Wick-enden Building, Room 505, Cleveland, OH 44106.
Received July 10, 1990; accepted January 23, 1991.
tations of voltage-clamp measurements were over-come and the intracellular and extracellular ionicenvironments could be controlled. The data fromsingle-channel recordings provide the basis for aquantitative description of channel kinetics andmembrane ionic currents. In 1985, DiFrancesco andNoble5 developed a model of the Purkinje fiberaction potential based on available single-cell andsingle-channel data. Our goal is to incorporate,whenever possible, recent experimental informationthat have accumulated since the formulation of theB-R model into the formulation of a modified model(referred to as the L-R model in the text) of themammalian ventricular action potential. The workpresented here constitutes the first phase of thiseffort. In this paper we formulate the fast inwardsodium current and the outward potassium currents.We use the model to investigate phenomena that aredominated by these currents and are only minimallyinfluenced by the slow inward current. Therefore, weretain the B-R formulation of the slow inward cur-rent to support the plateau of the action potential.
This paper focuses on the depolarization and repo-larization phases of the action potential and on phe-nomena that involve interaction between these pro-cesses. These include supernormal excitability,
at Università degli Studi di Milano on March 21, 2013http://circres.ahajournals.org/Downloaded from
Wenckebach periodicity, and aperiodic response of thecell to periodic stimulation. These phenomena wereobserved recently in single ventricular cells and inPurkinje fibers.67 In the B-R model, the extracellularconcentrations of ions are fixed. Because changes inextracellular potassium concentration exert a strongeffect on the time course of repolarization,8 9 we intro-duce in the model the dependence of the potassiumcurrents on potassium concentration. We also incorpo-rate a negative-slope characteristic of the time-inde-pendent potassium current10'll and a novel potassiumchannel that activates at plateau potentials.'2 The fastsodium current is characterized by fast upstroke veloc-ity (Vm)13 and slow recovery from inactivation,'4 aproperty that strongly influences the response of thecell to premature stimulation.
In addition to the study of mechanisms thatdetermine the behavior of the single cell, an accu-rate model of the action potential is important tosimulation studies of propagation of excitation incardiac tissue. Our studies of propagation15x6 werelimited by the inability to simulate important situ-ations of physiological and clinical significance suchas the effects of elevated extracellular potassiumconcentration, an important aspect of ischemia. Inaddition, our model simulations of reentry'7 dem-onstrated the importance of the interaction be-tween depolarization and repolarization in the in-duction and maintenance of reentrant arrhythmias.The need for an accurate representation of thisinteraction to further elucidate mechanisms under-lying abnormal propagation and arrhythmogenesisprovided yet another motivation for the develop-ment of the action potential model presented here.
MethodsThe general approach is based on a numerical
reconstruction of the ventricular action potential byusing Hodgkin-Huxley-type formalism.' The rate ofchange of membrane potential (V) is given by
dV/dt= - (1/C) (Ii+Is,) (1)
where C is the membrane capacitance, 'St is a stimu-lus current, and Ii is the sum of six ionic currents: INa,a fast sodium current; Is,, a slow inward current; IK, atime-dependent potassium current; 1K1, a time-inde-pendent potassium current; 1Kp, a plateau potassiumcurrent; and lb, a time-independent background cur-rent. The ionic currents are determined by ionicgates, whose gating variables are obtained as a solu-tion to a coupled system of eight nonlinear ordinarydifferential equations. The ionic currents, in turn,change V, which subsequently affects the ionic gatesand currents. The differential equations are of theform
dy/dt= (yx -y)/ry (2)
where
and
y +=ac(a\+f3)y represents any gating variable, r, is its time con-stant, and y. is the steady-state value of y. a, and /3are voltage-dependent rate constants. In addition,aKI and I3K1 of the IK1 channel depend on extracellularpotassium concentration.The integration algorithm used to solve the differ-
ential equations is based on the hybrid methodsintroduced by Rush and Larsen'8 and Victorri et al. 9
Briefly, the algorithm uses an adaptive time step thatis always smaller than At = msec. For time inter-vals of relatively slow changes in V (AV.AVmin=0.2mV), At is set equal to AVmaxV, where AVVmsx=0.8mV. For time intervals of fast changes in V(AV.lAVmax), At is set equal to AVmin/V. If this Atresults in AV.AVmax, At is reduced until the condi-tion AV<AVmax is met. During the stimulus, a fixedtime step (0.05 or 0.01 msec) is used to minimizevariability in the stimulus duration caused by the timediscretization procedure.2t)
Rate constants of ionic gates were obtained byparameter estimation with an adaptive nonlinear least-squares algorithm developed by Dennis et ali2" Allcomputer programs were coded in FORTRAN 77 (Mi-crosoft, Seattle), and all simulations were implemented(double precision) on a Macintosh IIcx computer.
Fornulation of Equations for Ionic CurrentsAll ionic currents are computed for 1 cm- of
membrane. Membrane capacity is set at 1 ALF/cm.22The formulation is based on experimental dataadjusted to 37°C by using a Q1(, adjustment factor.Ionic concentrations for standard preparations are[K1.=5.4 mM, [K]i=145 mM,1' [Na]i=18 mM,1323[Na]o=140 mM, and [Ca]0=1.8 mM. [Ca]i variesduring the action potential; we set [Ca]i=2x 10⁴mMas an initial value under standard conditions. Weassume that a short-term stimulation does not appre-ciably affect the ionic environment of the cell undernormal conditions and, therefore, the ionic concen-trations (except [Ca]i) do not change dynamically inour simulations. The complete set of equations for allionic currents is provided in Table 1.
INa,: Fast sodium current. The model of the fastsodium channel incorporates both a slow process ofrecovery from inactivation and adequate maximumconductance that results in a realistic rate of mem-brane depolarization. We adopt the activation (m)and inactivation (h) parameters of Ebihara andJohnson4 (we refer to the Ebihara-Johnson model ofINa as the E-J model). The formulation of theseparameters is based on data from cardiac cells (chick-en embryo) and results in a realistic rate of depolar-ization (Vmax=300 V/sec). However, it does not in-clude the property of slow recovery. Following themethods of Beeler and Reuter,3 we incorporate aslow inactivation gate (j) to represent this slowprocess. As suggested by Haas et al,24 the steady-ry= l/(ay+ y)
at Università degli Studi di Milano on March 21, 2013http://circres.ahajournals.org/Downloaded from
IK=GK X * Xi * (V-EK), UK=0-.282 *jKJJ5.4Xj=2.837* {exp[O.04(V+77)]-1}/{(V+77) * exp[0.04(V+35)]} for V> -100 mV and Xj=1 for V<-100 mVax=0.0005* exp[0.083(V+50)]/{1+exp[0.057(V+50)]}13x=0.0013 exp[-0.06(V+20)]/{1+exp[-0.04(V+20)J}
IK, time-dependent potassium current (/uA/cm'); IK, fully activated potassium current (/LA/cm') (IK=IK/X); IK1,time-independent potassium current (pA/cm'); 1Kp, plateau potassium current (gA/cm'); 'b, background leakagecurrent (gA/cm'); IK1(T), total time-independent potassium current (gA/cm') (IK1(T)=IK1+IKP+Ib); INa, fast sodiumcurrent (gA/cm'); ILj, slow inward current (giA/cm'); V, membrane potential (mV); V, time derivative of V (V/sec);Vnax, maximum rate of rise of V (V/sec); Ei, reversal potential of ion i (mV); G,, maximum conductance of channel i(mS/cm2); [A]0, [A],, extracellular and intracellular concentrations of ion A, respectively (mM); m, h, j, activation gate,fast inactivation gate, and slow inactivation gate of INa; d, f, activation gate and inactivation gate of 1,j; X, Xi, activationgate and inactivation gate of IK; Kl, inactivation gate of IKI; Y0, steady-state value of activation (inactivation) gate y; ay,fly, opening and closing rate constants of gate y (msec-1); ry, time constant of gate y (msec).
state values of j (ja) are obtained by setting jmha,where ha is from the E-J model. The time constant ofj (t) is set equal to the rj of the B-R model. The rateconstants ac and ,B1 are obtained by using the param-eter estimation procedure mentioned above.21 Thesodium current is
INa=GNa* m3 h j (V-ENa) (3)where GNa is the maximum conductance of the so-dium channel (23 mS/cm2)425; ENa is the reversal
potential of sodium [ENa=(RT/F) iIn ([Na]0/[Na]l)];and m, h, and j are obtained as solutions to Equation2 with the appropriate rate constants. Note that ENacomputed with the E-J model is 29 mV since[Na]i=40 mM in chicken embryo heart cells.25 In ourmodel we set ENa=54.4 mV based on [Na]i=18 mMin mammalian ventricular cells.13'23
IA: Slow inward current. Representation of I1i is thesame as in the B-R model. The formulation isprovided in Table 1.
at Università degli Studi di Milano on March 21, 2013http://circres.ahajournals.org/Downloaded from
FIGURE 1. Current-voltage (I-V) curves of the fully acti-vated time-dependent potassium current (I) current (denotedIK in the figure) for [K] =5.4, 50, and 150 mM. Note minimalcrossover between curves of different [K]0 and strong inwardrectification.
IK: Time-dependentpotassium current. In patch-clampexperiments, Shibasaki26 showed that 1) the IK channelis controlled by a time-dependent activation gate (X)and a time-independent inactivation gate (Xi), neitherof which depends on [K]O; and 2) the single-channelconductance is proportional to [K]0. We use theequation suggested by Shibasaki:
1K=GK - X - Xi * (V-EK) (4)and introduce the [K]O dependence through
GK=0.282. [K]0/5.4and
EK= (RT/F) * In ([K]o+PRNaK [Na]0k[K]i+PRNaK' [Na]li
where PRNaK=0.01833 is the Na/K permeability ra-tio.27,28 For this value of PRNaK and [K])= 5.4 mM, thecomputed EK is -77 mV, a result that is consistentwith the measurements of Beeler and Reuter.3 Also,note that GK=0.282 mS/cm2 for [K]0=5.4 mM. Thisvalue is obtained from the fully activated currentIK=IK/X (B-R model,3 Figure 1) for V= -100 mV, apotential at which Xi= 1.
Xi introduces the inward rectification property ofIK. It is obtained from the B-R expression for IK byfactoring out GK- (V-EK) at [K]O=5.4 mM. Theformulation is provided in Table 1. To verify that thisformulation correctly introduces the [K]0 depen-dence of IK we plotted the computed fully activatedcurrent (!K) for [K]O=5.4, 50, and 150 mM (Figure 1).The behavior is consistent with the experimentalobservations of McDonald and Trautwein,29 Matsu-ura et al,27 and Shibasaki.26 Note the strong inwardrectification and the minimal crossover betweencurves of different [K]0.
IKI: Time-independent potassium current. Sakmannand Trube,1011 using patch-clamp techniques, dem-onstrated two important properties of IKI: 1) square
V (mV)
FIGURE 2. Current-voltage (I-V) curves of the time-inde-pendentpotassium current (IK1) for different [K], (indicated inthe figure in mM). Note the large degree of crossover betweencurves of different [K]O, strong inward rectification, negativeslope of the I-V curves, and zero-cuirrent contribution at highpotentials.
root dependence of single-channel conductance on[K]O; 2) high selectivity for potassium (i.e., EKI-Nernst potential of potassium). Kurachi30 identi-fied an inactivation gate (K1) of the IKI channel. Thisgate, in addition to its dependence on membranepotential, depends on EKI and therefore on [K]0 KIcloses at high potentials and therefore IK1 has nocontribution at this range. In addition, the timeconstant of KI is small (TKI=0.7 msec at V=-50 mVfor [K]0=5.4 mM), so it can be approximated by KI,(its steady-state value).Based on these findings, we formulate the IKI
current as follows:
1KI=GKI . KIX . (V-EKI) (5)where
EKI=(RT/F) . In ([K]0/[K]j)
KI x aKl/(aKI + 13K1)
GK1=0.6047 \[K]0/5.4
(GK1=0.6047 at [K]0=5.4 mM10,31)To verify that this formulation correctly introduces
the [K]O dependence of IKI we plotted the computedcurrent-voltage curve for [K]0= 10, 20, 40, 75, and 150mM (Figure 2). The results resemble the single-channel measurements of Kurachi (see Figure 12B ofReference 30). Note the strong inward rectification,the crossover between curves of different [K]o, thezero contribution at high potentials, and the negativeslope over a certain potential range. These charac-teristics reflect the voltage and [K]o dependence ofthe KI gate.
at Università degli Studi di Milano on March 21, 2013http://circres.ahajournals.org/Downloaded from
Luo and Rudy A Model of the Ventricular Cardiac Action Potential 1505
It should be emphasized that our definition of 1K1differs from lKl of the B-R model. The B-R IK1 includescontributions from other currents at plateau potentials.Recently, it was recognized that the current at plateaupotentials results from a time-independent, [K]O-insen-sitive channel (IKp)12 and a background current(Ib).32-34 We formulate IKP to simulate the behavior ofthe IKp current measured by Yue and Marban12:
IKp=GKp *Kp (V-EKp)
A 4-
3-
2
1 '-or
p-
(6)
where Gyp=0.0183, EKp=EKM, and Kp=l/{l+exp[(7.488-V)/5.98]}. In addition, Ib is a background cur-rent32-34 that can be formulated as
Ib=Gb (V-Eb)
Sakmann and Trube
2-2 .4 1 43
-3
-4-1 -8 -6 --1 00 -80 -60 -40 -20o 2'(0
V(mV)
(7)where Gb=0.03921 and Eb= -59.87 mV. We define thetotal time-independent potassium current, IK1(T), as
1K1(T)=IK1 +IKp+Ib
B(8)
The parameters (conductances, gates, and reversalpotentials) of 1K1, 1Kp, and lb are obtained by using aparameter estimation technique2' to fit the whole-cellIK1(T) measured by Sakmann and Trube (Figure 4A ofReference 11) for different values of [K],. A compari-son of the measured and simulated lK1(T) is shown inFigure 3 for different values of [K],. Note that thenegative slope (which is not a property of the B-R IKI)and crossover phenomena are well duplicated by themodel. Also, all curves for different values of [K],converge at plateau potentials. This is because 1K1,which depends on [K]0, has zero contribution at thispotential range, while IKp and lb are [K]0 insensitive.
ResultsIonic Currents and the Action PotentialThe goal of this paper is to investigate, at the ionic
channel level, the mechanisms of various electrophysi-ological phenomena related to depolarization, repolar-ization, and their interaction. We limit the simulationsto phenomena that are dominated by the fast inwardsodium current and the outward potassium currents.Figure 4A shows simulated action potentials for dif-ferent extracellular concentrations of potassium([K]0=3, 4, 5.4, and 7 mM). For the typical physiolog-ical concentration of potassium ([K]o,noral=5.4 mM),the following characteristics are observed: the thresh-old potential is at -60 mV, the membrane rate ofdepolarization (Vm.x) is 400 V/sec, the maximum pla-teau potential is 17.7 mV, action potential duration(APD) at 90% repolarization is 366 msec, restingpotential is -84 mV, and the overshoot potential is 41.7mV. Note that Vm; is more than three times that of theB-R model (VmaXBR=115 V/sec). The fast Vma,,LR re-flects the higher sodium channel conductance in ourmodel and is in good agreement with experimental datafrom mammalian ventricular cells.'3 Also, Vm&xLR isfaster than that of the E-J model (Vm,EJ=300 V/sec).This difference results from different reversal poten-tials for the sodium current (ENa,L R=54.4 mV, whereas
w-
V.
-100 -80 -60 -40 -20V (mV)
0 20
FIGURE 3. Current-voltage (I-V) curves of the total time-independent potassium current (IKJ(T)) for different [K], (in-dicated in the figure in mM). Panel A: Duplicated from theexperimental data of Sakmann and Trube.11 Panel B: Thenegative slope, crossover between curves, and overlap ofcurvesat high potentials are well simulated by the present (L-R)model.
ENa,EJ=29.0 mV) and, as a result, greater driving forcein the L-R model. The difference in the reversalpotential reflects different intracellular concentrationsof sodium in the mammalian ventricular cell ([Na]i= 18mM) and the chicken embryo ([Na]i=40 mM). Theovershoot is in good agreement with experimentalmeasurements in guinea pig ventricular cells.3' 35The major simulated effects of changes in extracel-
lular potassium concentration are on APD and restpotential (Vrest), whereas effects on plateau poten-tials are minimal. These results are in agreement withexperimental observations.8'9 As [K]O increases, Vrestbecomes less negative and APD decreases. For[K]0=3 mM, Vrest is -95.5 mV and APD is 485 msec;for [K]0=7 mM, Vrest is -78.2 mV and APD is 322.6msec. For the typical value [K]0=5.4 mM, APD is 366msec. This value is in the range of 305 msec with astandard deviation of 55 msec measured by Isenbergand Klockner3' in the guinea pig single ventricular
at Università degli Studi di Milano on March 21, 2013http://circres.ahajournals.org/Downloaded from
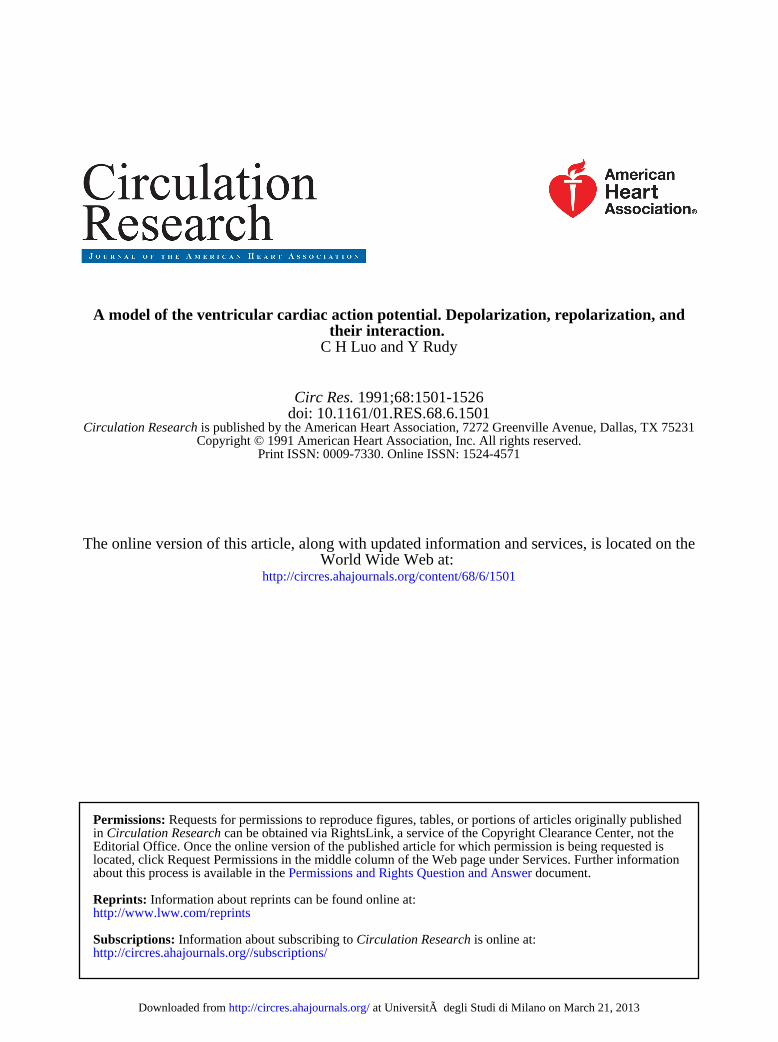
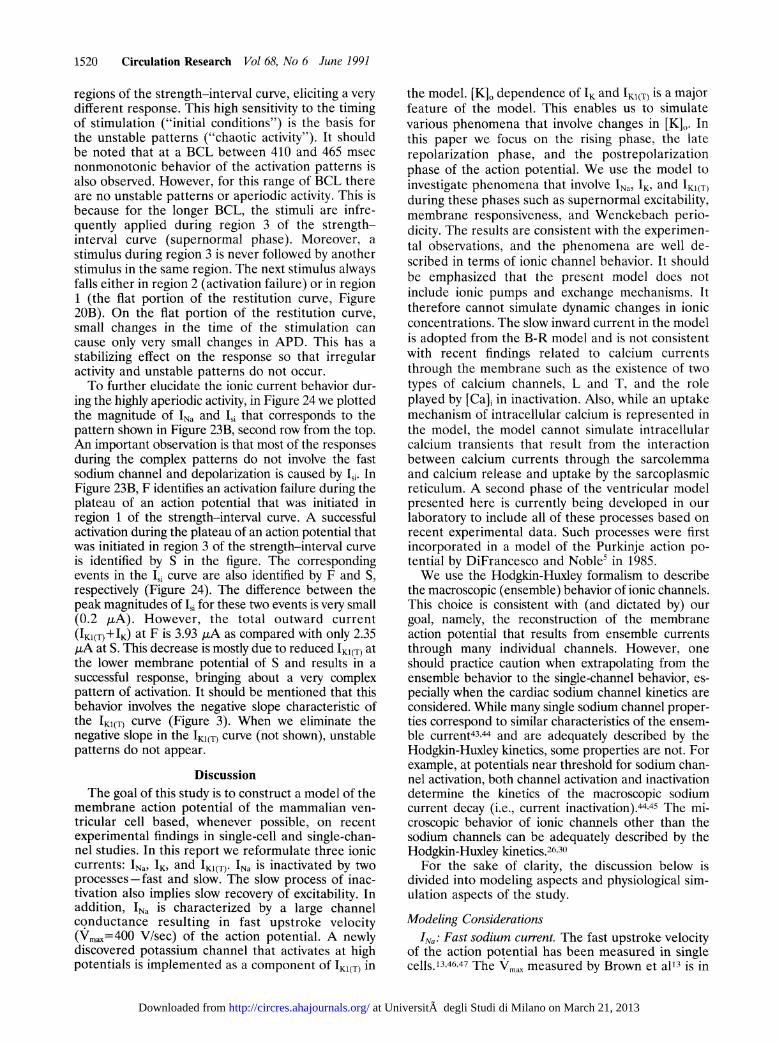
FIGURE 4. Action potentials and ionic currents for [K]O= 7,5.4, 4, and 3 mM. Panel A: As [K], decreases, actionpotential duration increases and resting potential becomesmore negative. Panel B: During repolarization the total time-independent potassium current (IKJ(T)) depends strongly on
[K], (arrows), while the time-dependent potassium current
(IK) and slow inward current (Isd) exhibit only weak depen-dence on [K],.
cell. Figure 4B shows the time course of IK1(T), IK, andISi during the action potential. Note the peak in IK1(T)during repolarization (arrows). For [K]0=7 mM theamplitude of this peak is 2.87 ALA/cm2, but for [K]o= 3mM it is only 1.0 ALA/cm2. This large difference inIK1(T) brings about a faster rate of repolarization (1.58V/sec at 7 mM, 1.1 V/sec at 3 mM) at higher [K]. Inaddition, the peak of IK1(T) occurs earlier (at more
positive membrane potential), reflecting an increaseof the reversal potential EK1. The result is a shorterAPD. Note that IK and Isi exhibit only small changesin amplitude during repolarization when [K]o is var-ied (although these currents deactivate earlier inresponse to the earlier decrease in membrane poten-tial). This is because I1i is independent of [K]0,whereas the IK dependence on [K]O is minimal atplateau potentials (inward rectification, Figure 1). Incontrast. IK1(T) shows strong dependence on [K]O atplateau potentials caused by the crossover phenom-enon of 'K1 (Figure 2). The changes in Vrest parallelchanges in the reversal potential of the IKI current(EKI) caused by changes in [K]0. In the followingsections we use this model of the action potential to
tth
j C-I p~~~~~~~~Ap-o
~ARDut4 L-APDuAPDU1tPD
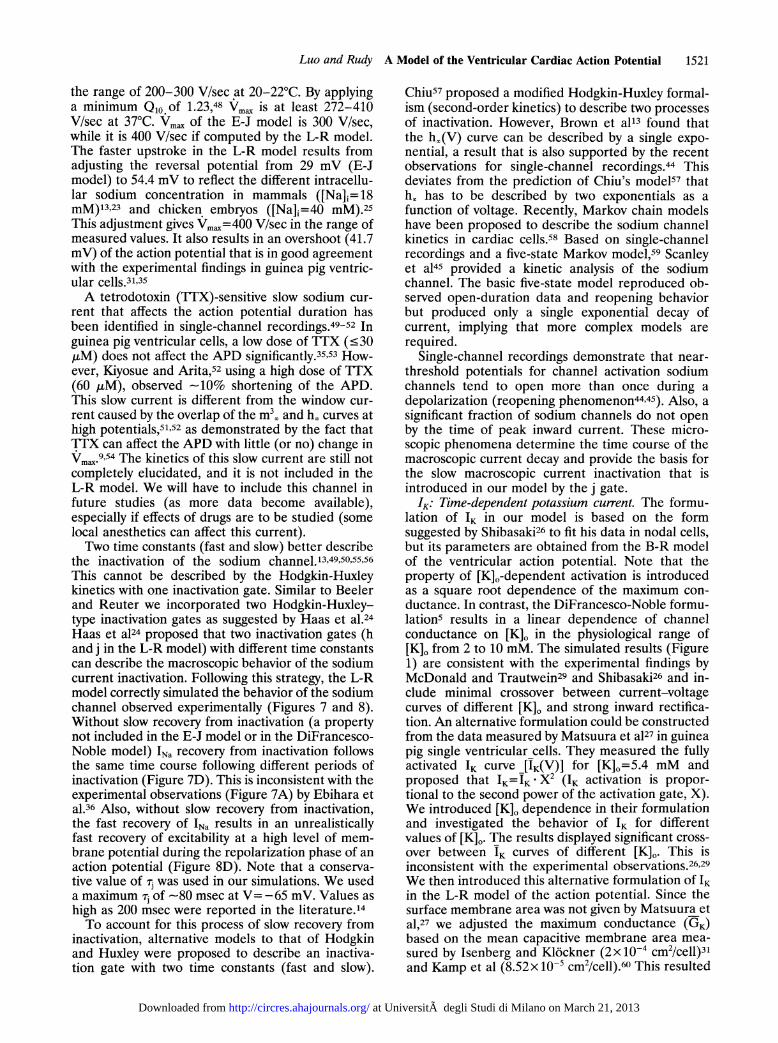
si S2FIGURE 5. The protocol for studying recovery of excitability.t, t,h, tu, APD, and APDu are shown in the figure. t, Recoverytime; t,h, latency from onset of stimulation to thresholdpotential; tu, latency from onset of stimulation to maximumupstroke velocity (Vmnx); APD, action potential duration fiomV,_, to 90% repolarization; APD, action potential durationfrom onset of stimulation to 90% repolarization, equal toAPD+tu. S, and S, are current stimuli.
simulate various physiological phenomena and eluci-date their mechanism.
Fast Depolarization and Slow Recovery of IkRecovery of excitability. As discussed above, INa in
the L-R model is characterized by a larger conduc-tance and a faster rate of depolarization (large Vm,x)than in the B-R model. Also, the L-R model incor-porates a fast process of inactivation and a muchslower process of recovery from inactivation. In thissection we demonstrate the importance of the fast(realistic) rate of depolarization caused by the kinet-ics of INa in determining membrane behavior. Recov-ery of excitability can be described in terms of tu andtth (defined below) by using the protocol of Figure 5.Test pulses (S2) 1.77 ALA in amplitude and 100 msecin duration are applied at various (SS2) intervalsfrom a brief suprathreshold stimulus (S,), whichexcites a conditioning action potential. BecauseS1S2>APDu, S2 is always applied during phase 4 ofthe action potential. The time from the onset of S tothreshold is tth (V=V,h- -60 mV). The time from theonset of S2 to the action potential upstroke as deter-mined from Vmax is tu. As the S1S2 interval decreases,tu and tth increase, providing a measure of theexcitability of the membrane; the longer tu and tth,the less excitable the membrane.
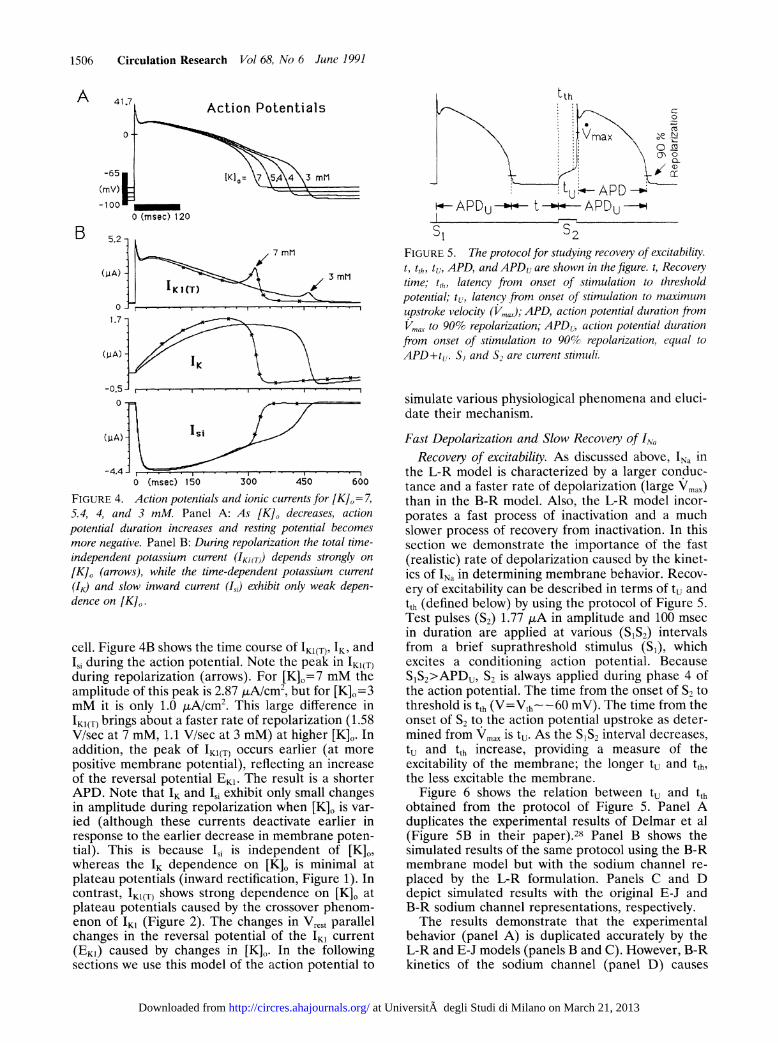
Figure 6 shows the relation between tu and tthobtained from the protocol of Figure 5. Panel Aduplicates the experimental results of Delmar et al(Figure SB in their paper).28 Panel B shows thesimulated results of the same protocol using the B-Rmembrane model but with the sodium channel re-placed by the L-R formulation. Panels C and Ddepict simulated results with the original E-J andB-R sodium channel representations, respectively.The results demonstrate that the experimental
behavior (panel A) is duplicated accurately by theL-R and E-J models (panels B and C). However, B-Rkinetics of the sodium channel (panel D) causes
. . . . 1
at Università degli Studi di Milano on March 21, 2013http://circres.ahajournals.org/Downloaded from
Luo and Rudy A Model of the Ventricular Cardiac Action Potential 1507
EXPERIMENTS1.3 (Delmar et al.)
t U = 1 .007.t th - 0.0073
1.2-
1 .1
1.01.0 1.1 1.2 1.:
1B 3L-RB1 t3tU=1.0107*tth -0.0111
1.2
tU1.1
1.01.0 1.1 1.2 1.3
t th3
t th
D
tu
1.3 E-Jtu =0.996t th + 0.0044
1.2
1.1
1.01.0 1.1 1.2 1.3
t th
FIGURE 6. The correlation between the la-tency from onset of stimulation to maximumupstroke velocity (tu) and the latency fromonset of stimulation to threshold potential (tth).Panel A: Experimental measurements of Del-mar et al.28 Panel B: Present (L-R) model.Panel C: Ebihara-Johnson (E-J) model. PanelD: Beeler-Reuter (B-R) model. Note that theexperimental behavior is simulated correctly bythe L-R and E-J models that incorporate real-istic kinetics of the fast sodium current (fastmaximum upstroke velocity), while the B-Rmodel simulation deviates from the experimen-tal behavior, especially for large values of tuand t,t (arrow). (Note that th is used here fortime to threshold and is equivalent to tF used byDelmar et a128). The tu and tth scales are bothnonnalized to a minimum value of 1.0.
1.0 -. -- ,.1.0 1,1 1,2 1.3
t Ih
significant deviations from the actual experimentalbehavior. These include a strong deviation from thelinear relation for larger tth (arrow) and a larger slope(-2.5 times, note different tu scale in panel D) of thelinear portion for smaller tth. The slope is close to 1.0for the L-R and E-J models, duplicating the experi-mental behavior well and indicating that the increasein tu is determined by the increase in tth (subthresh-old response). This is because the latency fromthreshold potential to Vma is very small (about 2msec) when the realistic conductance and kinetics ofthe cardiac sodium channel are incorporated in themodel (GNa,BR=4 mS, GNa,LR=23 mS). In contrast,the large slope of the B-R model indicates a signifi-cant latency from threshold potential to Vmax (greaterthan 25.5 msec), resulting from the unrealistic con-
ductance and kinetics of the sodium channel in thatmodel.
Time course of reactivation. The simulations in thissection demonstrate the importance of the slowrecovery property of INa in determining the mem-
brane reactivation. As mentioned in previous sec-
tions, the E-J model does not include the process ofslow recovery from inactivation represented by the jgate. Panel A of Figure 7 duplicates the experimentalreactivation data of Ebihara et al (Figure 3 of Ref-erence 36). Panel B shows the results of a simulationwith the L-R model. The protocol used both in theexperiment and in the model simulations is alsoillustrated in panel B. Panels C and D are simulationswith the B-R and E-J models, respectively. Theprotocol is as follows: two depolarizing voltage pulseswith 45-mV amplitude are applied after preclampingthe membrane at -65 mV for 300 msec. The firstpulse of duration T1 inactivates the sodium channel.T2, the interval between the depolarizing pulses, isvaried to provide different reactivation times beforethe second test pulse of a constant duration (65
msec) is applied. The membrane response to thesecond pulse in terms of the peak inward current isplotted as a function of T2.The experimental behavior (panel A) is well dupli-
cated by the L-R model (panel B). The individualcurves in panel A are obtained for T1 in the range1-200 msec, while in panel B the range is 1-50 msec.
This quantitative difference probably reflects thedifferent species (chicken embryo and guinea pig).The B-R model (panel C) deviates from the experi-mentally observed behavior, especially for T1= 1msec. As explained below, this is caused by theunrealistic INa kinetics of the B-R model. The E-Jmodel (panel D) completely fails to duplicate thedependence on T1, and the curves obtained fordifferent T1 values overlap.The E-J model (panel D) fails to separate the
curves for different T1 values because slow recovery(j gate) is not part of this model, so that inactivationand reactivation of the sodium channel are con-
trolled by the fast inactivation h gate. Because in thismodel h is almost completely inactivated in 1 msec
when the membrane potential is depolarized to -20mV (Th=0.33 msec at -20 mV), all curves for T1.1msec overlap. In contrast, the L-R model (panel B)generates different reactivation curves for differentvalues of T1, as observed experimentally. This isbecause the model incorporates a slow inactivation jgate (rj=4.34 msec at -20 mV). This implies that forT1=1 and 5 msec the j gate at the end of T1 isinactivated to a different degree, resulting in dif-ferent reactivation curves. For T1 .20 msec, the j gateis completely inactivated at a membrane potential of-20 mV, and all the curves overlap. In addition,since for T1> 1 msec the recovery process is con-
trolled by the j gate, all reactivation curves can be fitby a single exponential. In particular, for T1 .20 msecall curves are represented by the same time constant
A
tu
C
tU
at Università degli Studi di Milano on March 21, 2013http://circres.ahajournals.org/Downloaded from
FIGURE 7. Reactivation of the so-dium channel. The protocol is illus-trated in panel B. Peak inward cur-rent obtained during the secondpulse is nortnalized by the maxi-mum current measured duintg thefirst pulse and is plotted as a func-
mV tion of the interval between the de-polarizing pulses (TJ). Panel A: Ex-perimental results ofEbihara et a136for T-=1, 100, and 200 msec. PanelB: Present (L-R) model. Panel C:Beeler-Reuter (B-R) model. PanelD: Ebihara-Johnson (E-J) model.In each panel, the different curvesare obtained for different values ofT1 (1, 5, 20, and 50 msec). NVotethat all curves overlap in the E-fmodel simulation becautse of unre-alistically fast recoveiy (slow inacti-vation j gate is not included in thismodel).
200 250T2 (msec)
FIGURE 8. Membrane respon-siveness and sodium channel ki-netics. Maximum upstroke ve-locity (Vm,) values (normalizedby its maximum value) are indi-cated by discrete points. Curvesfor the fast (h) and slow (j)
_-i inactivation gates (or only h for50 the Ebihara-Johnson [E-f]
model) are plotted as solid lines.Both are shown as a function ofmembrane potential (V). Theprotocols are illustrated in panelA and are described in the text.Panel A: Experimental data ofGettes and Reuter (Figure 7 ofReference 14). Panel B: Present(L-R) model. Panel C: Beeler-Reuter (B-R) model. Panel D:E-J model.
V (mV)
A1.0
c0 0.83 o
- 0.6
C z 0.4
.20 0.2-
o.o0-0
C
(C.to0
c.z(6m-
EXPERIMENTS(Gettes & Router) L-RA
X
C
0
._
E
. >
V (mV)
B
J_0
0
E. >
D
E. >
B-R1.0
0.8B
0.6
0.4
V (mV)
E-J
(2)
0.00
V (MV)
at Università degli Studi di Milano on March 21, 2013http://circres.ahajournals.org/Downloaded from
Luo and Rudy A Model of the Ventricular Cardiac Action Potential 1509
(r=70 msec), which is very close to the rj value atV= -65 mV (rj=77.4 msec), as expected.Membrane responsiveness. This simulation demon-
strates the importance of the slow inactivation j gatein determining the membrane response during therepolarization phase of an action potential. Resultsare shown in Figure 8. Panel A is the experimentaldata of Gettes and Reuter (Figure 7 of Reference14). Panels B, C, and D are the L-R, B-R, and E-Jmodels, respectively. The protocols are illustrated inpanel A. Curve 1 is obtained from protocol 1 byapplying a suprathreshold stimulus that scans therepolarization phase of an action potential. Curve 2 isobtained from protocol 2 by stimulating the mem-brane after 500 msec of preclamping at differentpotential levels. For both curves Vmx is shown (dis-crete points) as a function of the membrane potentialat the onset of the stimulus. In panels B-D the solidcurves are h . j (or only h for the E-J model) com-puted for the same protocols.By using protocol 1, the range of membrane po-
tential over which Vmax drops from its maximum valueto 0.2 of the maximum is well simulated by the L-Rand B-R models. This normalized value (0.2) isobtained experimentally (panel A, curve 1) for amembrane potential of -76 mV. The correspondingsimulated values are -78 mV for both models. Incontrast, curve 1 in the E-J model (panel D) is shiftedto less negative potentials. This is because the E-Jmodel does not incorporate a slow recovery processof the sodium channel. An equivalent statement isthat in the E-J model j is always 1. However, the L-Rand B-R models incorporate a slow recovery j gatethat is not fully recovered during the repolarizationphase, shifting the curve to a more negative range ofmembrane potentials.
Curve 2 reflects steady-state behavior of the mem-brane since the stimulus was applied after a long(500-msec) preconditioning period. The L-R modelcorrectly simulates the behavior of Vmax for theseconditions (compare curve 2 in panels B and A). Incontrast, a shift of curve 2 to more negative potentialsis observed in the B-R model (panel C). This differ-ence reflects the different characteristics of h. and jcin the two models.Note that the Vmax behavior is closely approxi-
mated by the h - j curves (deviations are caused bycurrents other than INa). This implies that the mem-brane responsiveness is controlled by the h and jgates (because of its fast time constant, m obtains itsmaximum value of 1 within 0.2 msec and its effect isnegligible). Because curve 2 is obtained understeady-state conditions, it is closely approximated byh. * j,. The difference between curves 1 and 2 resultsfrom the fact that during repolarization (curve 1) hand j do not reach their steady-state values. The E-Jmodel does not incorporate a j gate. Therefore, thedifference between curves 1 and 2 in panel D impliesthat the rate of repolarization is too fast for h toreach steady state. Of course, the same is true for themuch slower j gate. Since during repolarization j is
almost completely inactivated and since rj> > rh, itfollows that the membrane responsiveness is mostlydetermined by the j gate.
Supemormal ExcitabilitySupernormality, which can be defined as greater
than normal excitability during or immediately afterthe action potential repolarization phase, is a knownproperty of cardiac preparations at low extracellularpotassium concentrations.737-39 The strength-inter-val curve, used to investigate supernormality, is ob-tained from the protocol shown in Figure 5 byapplying a test pulse, S2, after an action potentialexcited by a stimulus, S,. By varying the S1S2 intervaland the current amplitude of S2, the threshold cur-rent (Ith) is obtained as a function of the S1S2 interval.Based on such excitability measurements, Spear andMoore39 found that 1) supernormality disappearswhen [K]o is elevated above 5 mM and 2) thesupernormal period at fixed [K]O is independent ofthe APD and is determined by the characteristics ofthe membrane potential during repolarization. 'K1and IK of the L-R model can change their reversalpotentials and conductances in response to variationsin [K]O. We used the L-R model to simulate andinvestigate supernormality. Figure 9 shows the simu-lated strength-interval curves for [K]0=7, 4.6, 4, and3 mM, covering late phase 3 and early phase 4 of theaction potential. The simulated protocol followed theexperimental protocol described above (also see Fig-ure 5). lth is defined as the critical current amplitudefor which the peak sodium current is greater than 4,uA (1% of the maximum current for a fully recov-ered membrane and suprathreshold stimulus). Notethat test stimuli of very short duration (T=0.5 msec)were used to investigate the instantaneous mem-brane excitability at that S1S2 interval. The abscissa isnormalized by setting the 70% repolarization of theaction potential as time zero. Clearly, supernormalityis observed for [K]0.4.6 mM (but not for [K]0=7 or5.4 mM) as a notch (local minimum followed by alocal maximum) in the strength-interval curve. Withdecreasing [K]0, the peak-to-peak amplitude of thenotch increases and so does the width of the "super-normal window." This time window is defined as theinterval during which the threshold is lower than thelocal maximum that follows the notch. The supernor-mal window is indicated in the figures by two brokenvertical lines.
Plotting Ilh versus the potential difference(AV=Vth-V) for the membrane to reach the thresh-old potential (Vth), the linear relation of Figure 10 isobtained for all values of [K]0. This linear relationimplies that the membrane response during repolar-ization can be characterized in terms of the mem-brane potential and the threshold potential for allvalues of [K]O. It also implies that the thresholdcurrent does not depend on APD, as observed exper-imentally by Spear and Moore.39To explain the underlying mechanism of supernor-
mality in terms of membrane channel kinetics, the
at Università degli Studi di Milano on March 21, 2013http://circres.ahajournals.org/Downloaded from
FIGURE 9. Strength-interval curves (Ih) for [K],= 7, 4.6, 4,and 3 mM are plotted as a function of recovery time t. Timezero (t =0) is set at 70% repolarization. Panel A: [K]o= 7 and4.6 mM. Panel B: [K]0=4 and 3 mM max and min, Localmaximum and minimum of Ith, respectively. The superormalwindow (represented by two vertical broken lines for eachcurve) is defined as the time interval during which ith is smallerthan the local maximum.
following simulation was carried out for [K]0=7 mM.The j gate of the sodium channel was clamped at thevalue of 1 for all times and the strength-intervalcurve was computed (Figure llA). The unclampedstrength-interval curve is also plotted for compari-son. With j = 1, sodium channel recovery from inacti-vation is controlled by the h gate and its much fasterkinetics (h< <rj). Under these conditions, supernor-
mality is observed in Figure IIA even for [K]-=7mM. In contrast, when j is free to vary according to itsnormal kinetics, no supernormality is observed forthis concentration of K,,, in agreement with theexperimental behavior.739 In Figure llB, V and Vth
T=0.5 msec80-
th = 2.18 + 1.97 AV
70
60
[K10 =7 mM*[K]o=4.6 mM
a [K]l0=4 mM50 [K] 0 =3 mM
20 25 30 35 40
6M (mV)
FIGURE 10. The relation between threshold current (Ith) andchange in membrane potential (AV= Vth-V) for a brief stim-ulus of 0.5-msec duration. The linear relation is described byIth=2.18+1.97--WVand is independent of [/K,.
are plotted as a function of time during repolariza-tion. The curve for V is the same for both j =1 andj-unclamped conditions (because the sodium channeldoes not contribute to V during repolarization). Onthe other hand, the Vth curve is influenced by the jgate kinetics. For the clamped condition (j=1) Vthdecreases earlier in time, reflecting faster recovery ofmembrane excitability. Also, the value of Vth justafter the absolute refractory period (arrows) islarger, followed by a steep decrease (approximately3.5 V/sec) over a period of 6 msec. During the sameinterval, the membrane potential drops at a rate ofabout 1.33 V/sec. This implies that AV (defined asVth- V) is decreasing rapidly during this interval,bringing about a proportional decrease in lth (Figure10) that constitutes the descending portion of thenotch in the strength-interval curve (Figure lA,DES). Beyond this interval, the membrane potentialdrops faster than Vth, increasing AV and, therefore,lth (ascending portion of the notch, ASC in FigureHA). This nonmonotonic behavior of AV is the basisfor the notch in the strength-interval curve and,hence, for supernormality. For larger values of t, bothVth and V approach their steady-state values with AV(and hence Ith) approaching a constant. When the jgate is free to vary according to its normal kinetics (j-unclamped in Figure 1lB), the Vth curve is shifted tothe right toward later times. As a result, the drop inthe Vth curve occurs over an interval during which Vdecreases slowly and, in particular, always slowerthan Vth (0.5 and 1.4 V/sec, respectively). Conse-quently, AV (and Ith) is monotonically decreasing(j-unclamped in Figure HA), and no supernormalityis observed. It is clear that the nonmonotonic, super-normal behavior is determined by the shape of theVth curve, which in turn is determined by the recoveryof the sodium channel. As will be explained below,the sodium channel recovers faster at low [K],
at Università degli Studi di Milano on March 21, 2013http://circres.ahajournals.org/Downloaded from
Luo and Rudy A Model of the Ventricular Cardiac Action Potential
A
60
.9
50
40
30
[K]0=7mM
j-unctSmpe
DES;PAS
A-60
-65:
-70-
R-75.
-80
-85 -20 v -.. .-20 0 20 40 60 80 100
-90 -t (msec)
-95
B
E
[K]0=7mM
B
E
-20 0 20 40 60 80 100t (mssc)
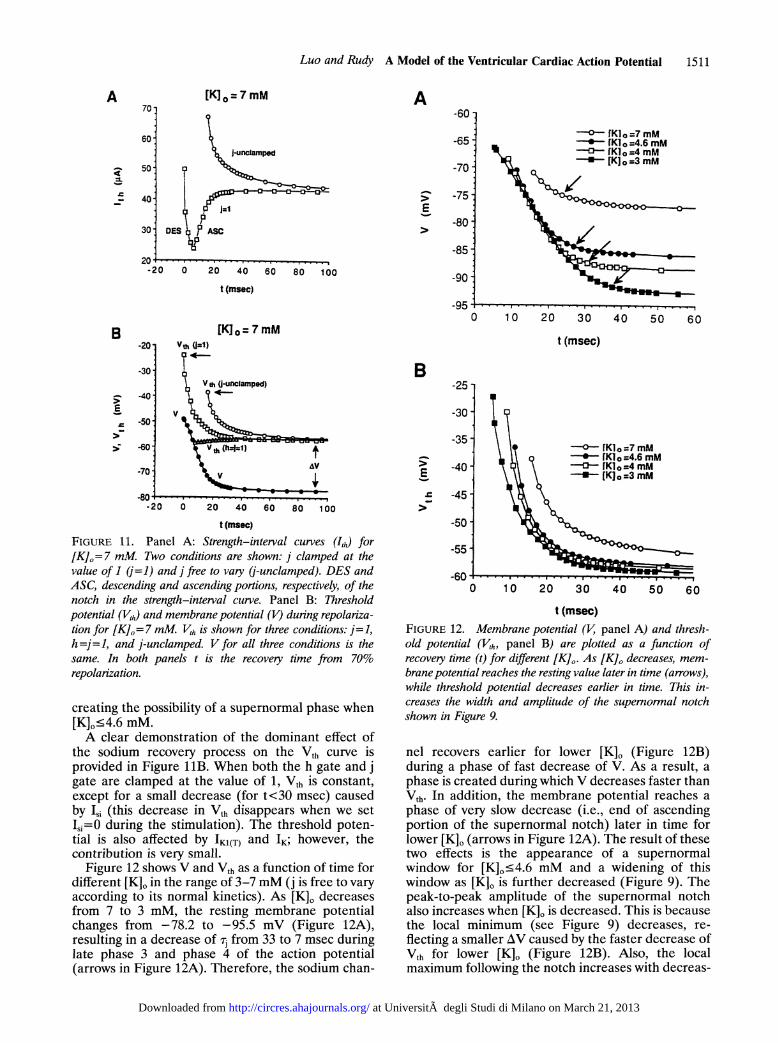
FIGURE 11. Panel A: Strength-interval curves (Ih) for[Kfl=7 mM. Two conditions are shown: j clamped at thevalue of 1 (f=1) and] free to vary (j-unclamped). DES andASC, descending and ascending portions, respectively, of thenotch in the strength-interval curve. Panel B: Thresholdpotential (Vth) and membrane potential (1V) during repolariza-tion for [K]o= 7 mM. Vh is shown for three conditions: j=1,h =j=1, and j-unclamped. V for all three conditions is thesame. In both panels t is the recovery time from 70%repolarization.
creating the possibility of a supernormal phase when[K]o.4.6 mM.A clear demonstration of the dominant effect of
the sodium recovery process on the Vth curve isprovided in Figure liB. When both the h gate and jgate are clamped at the value of 1, Vth is constant,except for a small decrease (for t<30 msec) causedby L,i (this decrease in Vth disappears when we setIs=O during the stimulation). The threshold poten-tial is also affected by IK1(T) and IK; however, thecontribution is very small.
Figure 12 shows V and Vth as a function of time fordifferent [K], in the range of 3-7 mM (j is free to varyaccording to its normal kinetics). As [K], decreasesfrom 7 to 3 mM, the resting membrane potentialchanges from -78.2 to -95.5 mV (Figure 12A),resulting in a decrease of ij from 33 to 7 msec duringlate phase 3 and phase 4 of the action potential(arrows in Figure 12A). Therefore, the sodium chan-
-25
-30
-35
-40
-45
-50
Kl o =7 mM-- [K1o =4.6 mM
fK10 =4 mM*- [K]0=3mM
-
10 20 30 40 50 60
t (msec)
-0--- [K1o =7 mM*- [Klo=4.6 mM
K1 =4 mM[K] o =3 mM
0 1 0 20 30
t (msec)FIGURE 12. Membrane potential (V, panel A) and thresh-old potential (V,h, panel B) are plotted as a function ofrecovery time (t) for different [K],. As [K], decreases, mem-brane potential reaches the resting value later in time (arrows),while threshold potential decreases earlier in time. This in-creases the width and amplitude of the superormal notchshown in Figure 9.
nel recovers earlier for lower [K]o (Figure 12B)during a phase of fast decrease of V. As a result, aphase is created during which V decreases faster thanVth. In addition, the membrane potential reaches aphase of very slow decrease (i.e., end of ascendingportion of the supernormal notch) later in time forlower [K]0 (arrows in Figure 12A). The result of thesetwo effects is the appearance of a supernormalwindow for [K]0.4.6 mM and a widening of thiswindow as [K]0 is further decreased (Figure 9). Thepeak-to-peak amplitude of the supernormal notchalso increases when [K]0 is decreased. This is becausethe local minimum (see Figure 9) decreases, re-flecting a smaller AV caused by the faster decrease ofVth for lower [K]O (Figure 12B). Also, the localmaximum following the notch increases with decreas-
v v E v v E
1511
)r
at Università degli Studi di Milano on March 21, 2013http://circres.ahajournals.org/Downloaded from
ing [K],, reflecting a larger AV caused by morenegative rest potentials.
It should be emphasized that the E-J representa-tion of the sodium channel does not include a slowinactivation j gate. Therefore, the E-I strength-interval curves are similar to the strength-intervalcurves obtained by the L-R model with j=1. Asshown above (Figure 11A), under these conditions,supernormality is a property of the model even forhigh extracellular concentrations ([K]0-=7 mM) incontradiction to experimental observations.7,39 This,of course, is a nonphysiological behavior that resultsfrom a nonphysiological fast recovery of the sodiumchannel.The simulations described above were performed
with a test stimulus, S2, of 0.5-msec duration. Exper-imentally, Chialvo et a17 used a stimulus of 20 msec.Our choice of a short stimulus was dictated by theresolution needed for scanning the supernormal win-dow whose minimum duration is 12 msec. Also, wewere interested in determining instantaneous mem-brane excitability without the influence of a longstimulus duration. To investigate the effects of thestimulus duration (T) on membrane excitability, weredefine the strength-interval curve in terms ofthreshold charge introduced by the stimulus(Qth=lth* T, Figure 13). In Figure 13A, Qth iS plottedfor an interval of 80 msec that includes the supernor-mal phase. Stimuli of two durations (T=0.5 and 20msec) are compared. For T=20 msec, Qth is larger(note different scales), the amplitude of the super-normal notch is twice as large, and the notch isshifted toward earlier time. Figure 13B covers a latertime interval that includes late phase 4 of the actionpotential. During this time interval, the behavior ofQth for T=0.5 and 20 msec is very different. ForT=0.5 msec, Qth displays a very small and slowincrease, while for T=20 msec, Qth displays a rela-tively large decrease. It should be commented thatsimilar results were obtained for all [K], values,except no supernormality was observed for [K]0>4.6mM ([K]0=4 mM is shown here as an example).
Figure 14 provides an explanation for these differ-ences between strength-interval curves constructedwith stimuli of different durations. Figure 14A showsthe total charge (Qtotal) carried by all ionic channelsduring critical subthreshold stimuli for a short(T=0.5 msec) and a long (T=20 msec) stimulusduration (note the different scales). For both dura-tions, Qtotal is positive, indicating a net positive chargeleaving the cell. For T=0.5 msec, Qtotal is negligiblecompared with the stimulus charge Qth (Figure 13).However, for T=20 msec, Qtotal is about half themagnitude of Qth (Figure 13, note the differentscales). This significant amount of charge that is lostto the extracellular medium during a long stimulus isthe basis for the difference between the strength-interval curves of Figure 13. The Qth supplied by avery short stimulus can be regarded as the amount ofcharge needed to bring the membrane to thresholdwith minimal charge losses to the extracellular me-
A (nC)(nC)401
20iE51
.fCY
t (msec)
B (nC)401
38
36-
34.
32
[K]o = 4 mM
-. T=20 msec
9.w..w,
(nC)64
-62
60
58
-56
30 9 'P-T v v -v w T-s i4_ _ 1
30 430 830 1230 1630
t (msec)FIGURE 13. Threshold charge Qh=Ith. T (Ih is thresholdcurrent and T is stimulus duration) for [K]0,=4 mM and twodifferent stimulus durations (T=0.5 and 20 msec). Panel A:Time interval (0-80 msec) covering the supemormal phase.Note that the peak-to-peak amplitude of the superormalnotch is about twice larger for T=20 msec than for T=0.5msec. Panel B: Phase 4 of an action potential. As timeincreases, Qth decreases significantly for T=20 msec but isalmost constant for T=0.5 msec.
dium. In contrast, the Qth supplied by a long stimuluscan be divided into two components: Qth supplied bya very short stimulus and the total charge (Ototal) lostto the extracellular medium during the duration ofthe stimulus. The fact that Qth includes Qtotal explainsthe large values of Qth, including the large amplitudeof the maximum that follows the supernormal notch(Figure 13A) when a long stimulus duration is used.Figure 14B shows the contributions of the differentionic channels to Qtotal for a stimulus of 20 msecapplied at different times, t, during phase 3 to phase4 of an action potential. For large t, all contributionsexcept QKI(T) approach very small values, identifyingIK1(T) as the reason for the large rheobase neededwhen long stimuli are used (Figure 13B). Duringphase 3 (t<20 msec), a large decrease in Ototal from
ht
at Università degli Studi di Milano on March 21, 2013http://circres.ahajournals.org/Downloaded from
Luo and Rudy A Model of the Ventricular Cardiac Action Potential 1513
rv l _A(nC)
L Ks JO=4 mMl 34
1\4 -32
30
28
_. T=0.5 msec
.26S.. T=20 msec
~~*,* T.'.*...2.f~, 24
0 400 800 1200
t (msec)
[K]o=4 mM and T=20 msec
QKl (T)
7QQs.
0 40 80 120 160 200
t (msec)FIGURE 14. Total charge (Qtota) lost to the extracellularmedium during the duration of stimulation ([KJ0=4 mM).Panel A: For short duration (T=0.5 msec), Q0tia, (left ordi-nate) is negligible in comparison to threshold charge (Qth) inFigure 13, while for long duration (T=20 msec), Qtotal (rightordinate) is significant (note scale difference). Panel B: Thecontribution of each ionic channel to Qtotal for T=20 msec: 1)the total time-independent potassium current charge (QK1(T))elevates the rheobase threshold charge at all phases, 2) thedecay of time-dependent potassium current charge (QK) re-
flects the deactivation kinetics of the time-dependent potas-sium current activation gate, and 3) the slow inward currentcontributes at late phase 3 and early phase 4 because ofincomplete inactivation. Qsi, slow inward current charge; QNa,sodium current charge.
its peak value is observed as the 20-msec stimulus isapplied earlier in time (Figure 14A, arrow). This iscaused by an increase in the magnitude of (thenegative) Qi and a decrease of QK1(T) as t decreases(Figure 14B). Qsi increases since, for a small t, thestimulus is applied during a phase when ISi is notcompletely inactivated. QK1(T) decreases because thestimulus is applied during the negative slope phase of1K1. This additional contribution of 2.3 nanocoulombsto the decrease in Qth is a substantial fraction of theamplitude of the supernormal notch (6 nC). Theresult is a supernormal notch of about twice theamplitude as compared with that for a 0.5-msec
U
0
a
E~0
0,
10
a,0
5.5.
5.0-
4.5-
4.0-
3.5-
An200
[K]0= 5.4mM
Restitution (b)
iStrenth-Intal
600 1000 1400
S1-S2 (msec)
-370
-310
250
190
0
0E0
1800
FIGURE 15. Strength-interval curve and action potentialduration (APD) restitution curve for [K],=5.4 mMand T=20msec. Lower arrow indicates the stimulus strength (3.06 piA)used to study rate-dependent block. See textfor defintions of aand b.
stimulus (Figure 13A). The relatively fast decrease ofQth during phase 4 (t=30-450 msec in Figure 13B,T=20 msec), when long stimuli are used, reflects asimilar behavior of QK (Figure 14B). Note thatcontributions from all other currents are constant dur-ing this phase; in particular, QK1(T) is constant sinceIK1(T) is time independent and the membrane potentialduring this phase is almost constant. Therefore, forlong stimuli, the membrane excitability during phase 4is determined by the kinetics of IK (the time-dependentX gate). In contrast, Qth is almost constant over theentire phase 4 when short stimuli are used (Figure 13B,T=0.5 msec). This is because for short stimuli Qth iSdetermined by VSh and V (negligible contribution fromQtotal) which do not change significantly during phase 4.As will become clear in the next section, the behavior ofthe strength-interval curve during phase 4 stronglyinfluences the response of the cell to repetitive stimu-lation. For short stimulus duration one expects minimaldependence of the response on the timing of stimula-tion during phase 4 (constant excitability, Figure 13B,T=0.5 msec). In contrast, for long stimuli, the responseis strongly influenced by the timing (Figure 13B, T=20msec). This implies that to investigate rate-dependentresponse patterns (e.g., Wenckebach periodicity), stim-uli of long duration should be used.
Wenckebach Periodicity and Channel BehaviorWenckebach periodicity is defined as a periodic,
rate-dependent activation failure in cardiac tissue.Recently, this phenomenon was observed in isolatedguinea pig6 or rabbit40 ventricular myocytes and insheep cardiac Purkinje fibers.7 In this section we
study the Wenckebach phenomenon by simulatingperiodic pacing of single myocytes with the use of theL-R membrane model. The response of the mem-brane to periodic stimulation can be analyzed interms of the strength-interval curve and the APD
A
U0
0
E
Ul}CS
1;"O
,R
B
0
(nC0.9-
0.8
0.7-
0.6-
0.5-
30 -
24;
18
12-
62
02
-6
-12 e - - -. - 1-
- n9 . ~ ~ ~ ~ ~ T.u
)
at Università degli Studi di Milano on March 21, 2013http://circres.ahajournals.org/Downloaded from
FIGURE 16. Periodic rate-dependent pattems for normal[K]0=5.4 mM Panel A: Examples of activation pattems(calibration bar, 52.5 mV). Numbers on the left indicate basiccycle length (BCL), whereas ratios on the right are the resultingstimulus-to-response (S:R) pattems. The train of stimuli isindicated below each pattem. Panel B: The staircase plot ofresponse-to-stimulus (R: S) ratios as a function of BCL. Thenumbers inside the panel indicate the S:R ratios.
restitution curve. During phases 3 and 4 of an actionpotential, the strength-interval curve describes therecovery of membrane excitability, whereas the res-titution curve describes the recovery of APD ofpremature responses.41,42 The simulated strength-interval and APD restitution curves for [K],=5.4 mMare shown in Figure 15. Both curves display a mono-tonic behavior that is determined by the time courseof deactivation of the IK X gate. In the followingsimulations, a stimulus strength of 3.06 ,uA thatcorresponds to threshold stimulation at S1S2=882msec was used (indicated by the lower arrow inFigure 15). Stimulus duration of 20 msec was used forreasons described above (conclusion of previous sec-
A
1j
XS3 = XS4
AA I I A~~~~~~~~~~~~~~~~~~~~~~~~~~~~~~~~~~~~~~~~~~~~~~~~~~~~~~~
B
18 26 (msec) 34
FIGURE 17. Rate-dependent block is studied by resetting theactivation (X) gate of the time-dependent potassium currentvalue at onset of stimulation (Xs). Panel A: Stimulus-to-response (S:R) ratio of 6:5 changes to 7:6 by settingXP4=XS3. The train of stimuli is shown below the pattem.Panel B: The action potentials for the pattem in panel A areredrawn with the onset of stimulation for all beats set at timezero. The superimposed third and fourth action potentials(indicated by *) clearly indicate that beat 4 is exactly the sameas beat 3 because of their equal values ofXs. Calibration barsfor action potentials are 35 mV in both panels.
tion) and to be consistent with the experimentalprotocols of Chialvo et a17 and Delmar et al.6 Stim-ulation was applied at a basic cycle length (BCL)ranging from 160 to 2,000 msec. Simulated activationpatterns for different BCLs are shown in Figure 16A.A staircase plot of response-to-stimulus (R: S) ratiosversus BCL is shown in Figure 16B (numbers in thefigure indicate stimulus-to-response [S: R] ratios).The staircase pattern demonstrates phase-locking atS: R ratios of integer values (1: 1, 2: 1, 3: 1, etc.) andsharp transitions between these values through manynoninteger S: R ratios. This pattern is in good agree-ment with the experimental observations of Chialvoet al.7 To elucidate the underlying mechanism of theWenckebach phenomenon observed in single cellsthe following simulations were performed.As we discussed in the previous section, the post-
refractory period (phase 4 of an action potential) isdominated by the X gate of 1K.6728 Therefore, theWenckebach phenomenon is likely to be related tothe value of X just before the stimulation is applied(Xs). To test this assumption, Xs of a given beat wasclamped to the value of Xs of the preceding beat.Independent of the particular beat where clampingwas applied the following behavior was observed: 1)S:R pattern always progressed to S+ 1:R+ 1 patternand 2) the superimposed action potentials of the twobeats with the same Xs overlapped because of equaltime latency from stimulus to response. An exampleof this procedure is shown in Figure 17 for an initial
A
880 3:2
1~~~~~~~~~l9
650 2:1
444 7:3
l0 l l--l l Al al l ll
B
U)
0
cr
1.0 -
0.8 -
0.6
0.4
0.2
11 11
v .U
at Università degli Studi di Milano on March 21, 2013http://circres.ahajournals.org/Downloaded from
Luo and Rudy A Model of the Ventricular Cardiac Action Potential 1515
A
La
0.
B
(nsec)389.5 -
fi
387.5- 1
/~APD u
385.5 \\
383.5 . .0 1 2 3 4 5 E
Beats
0.06
0.04-
Xs0.02-
nnol
t u
0 123456
(msec)366
364
362
360CLox
358
356
(mec
(msec)32
28
24
207
tu
Beats
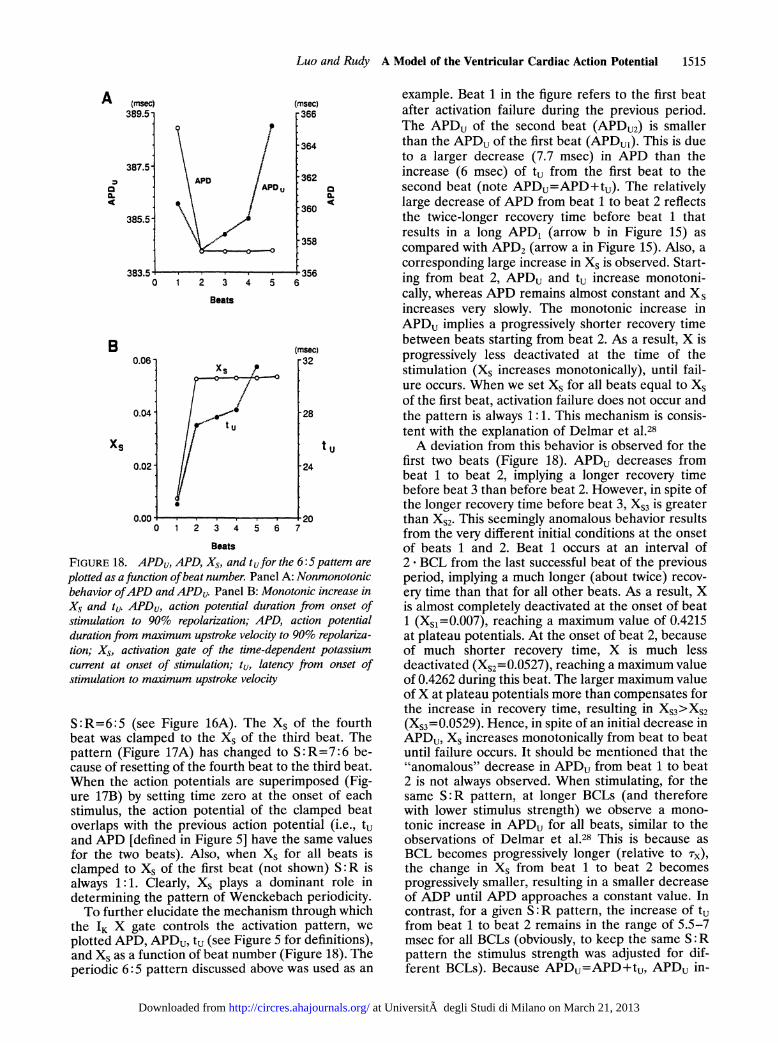
FIGURE 18. APD, APD, Xs, and tufor the 6:5 pattem are
plotted as a function ofbeat number. Panel A: Nonmonotonicbehavior ofAPD and APDu. Panel B: Monotonic increase inXs and tu. APDu, action potential duration from onset ofstimulation to 90% repolarization; APD, action potentialduration from maximum upstroke velocity to 90% repolariza-tion; Xs, activation gate of the time-dependent potassiumcurrent at onset of stimulation; tu, latency from onset ofstimulation to maximum upstroke velocity
S:R=6:5 (see Figure 16A). The Xs of the fourthbeat was clamped to the Xs of the third beat. Thepattern (Figure 17A) has changed to S:R=7:6 be-cause of resetting of the fourth beat to the third beat.When the action potentials are superimposed (Fig-ure 17B) by setting time zero at the onset of eachstimulus, the action potential of the clamped beatoverlaps with the previous action potential (i.e., tuand APD [defined in Figure 5] have the same valuesfor the two beats). Also, when Xs for all beats isclamped to Xs of the first beat (not shown) S: R isalways 1:1. Clearly, Xs plays a dominant role indetermining the pattern of Wenckebach periodicity.To further elucidate the mechanism through which
the IK X gate controls the activation pattern, we
plotted APD, APDu, tu (see Figure 5 for definitions),and Xs as a function of beat number (Figure 18). Theperiodic 6:5 pattern discussed above was used as an
example. Beat 1 in the figure refers to the first beatafter activation failure during the previous period.The APDU of the second beat (APDU2) is smallerthan the APDU of the first beat (APDu1). This is dueto a larger decrease (7.7 msec) in APD than theincrease (6 msec) of tu from the first beat to thesecond beat (note APDu=APD+tu). The relativelylarge decrease of APD from beat 1 to beat 2 reflectsthe twice-longer recovery time before beat 1 thatresults in a long APD1 (arrow b in Figure 15) ascompared with APD2 (arrow a in Figure 15). Also, acorresponding large increase in Xs is observed. Start-ing from beat 2, APDu and tu increase monotoni-cally, whereas APD remains almost constant and Xsincreases very slowly. The monotonic increase inAPDu implies a progressively shorter recovery timebetween beats starting from beat 2. As a result, X isprogressively less deactivated at the time of thestimulation (Xs increases monotonically), until fail-ure occurs. When we set Xs for all beats equal to Xsof the first beat, activation failure does not occur andthe pattern is always 1:1. This mechanism is consis-tent with the explanation of Delmar et al.28A deviation from this behavior is observed for the
first two beats (Figure 18). APDu decreases frombeat 1 to beat 2, implying a longer recovery timebefore beat 3 than before beat 2. However, in spite ofthe longer recovery time before beat 3, XS3 is greaterthan XS2. This seemingly anomalous behavior resultsfrom the very different initial conditions at the onsetof beats 1 and 2. Beat 1 occurs at an interval of2* BCL from the last successful beat of the previousperiod, implying a much longer (about twice) recov-ery time than that for all other beats. As a result, Xis almost completely deactivated at the onset of beat1 (XS1=0.007), reaching a maximum value of 0.4215at plateau potentials. At the onset of beat 2, becauseof much shorter recovery time, X is much lessdeactivated (XS2=0.0527), reaching a maximum valueof 0.4262 during this beat. The larger maximum valueofX at plateau potentials more than compensates forthe increase in recovery time, resulting in XS3 >XS2(XS3=0.0529). Hence, in spite of an initial decrease inAPDU, Xs increases monotonically from beat to beatuntil failure occurs. It should be mentioned that the"anomalous" decrease in APDu from beat 1 to beat2 is not always observed. When stimulating, for thesame S:R pattern, at longer BCLs (and thereforewith lower stimulus strength) we observe a mono-tonic increase in APDu for all beats, similar to theobservations of Delmar et al.28 This is because asBCL becomes progressively longer (relative to rx),the change in Xs from beat 1 to beat 2 becomesprogressively smaller, resulting in a smaller decreaseof ADP until APD approaches a constant value. Incontrast, for a given S :R pattern, the increase of tufrom beat 1 to beat 2 remains in the range of 5.5-7msec for all BCLs (obviously, to keep the same S:Rpattern the stimulus strength was adjusted for dif-ferent BCLs). Because APDu=APD+tu, APDU in-
at Università degli Studi di Milano on March 21, 2013http://circres.ahajournals.org/Downloaded from
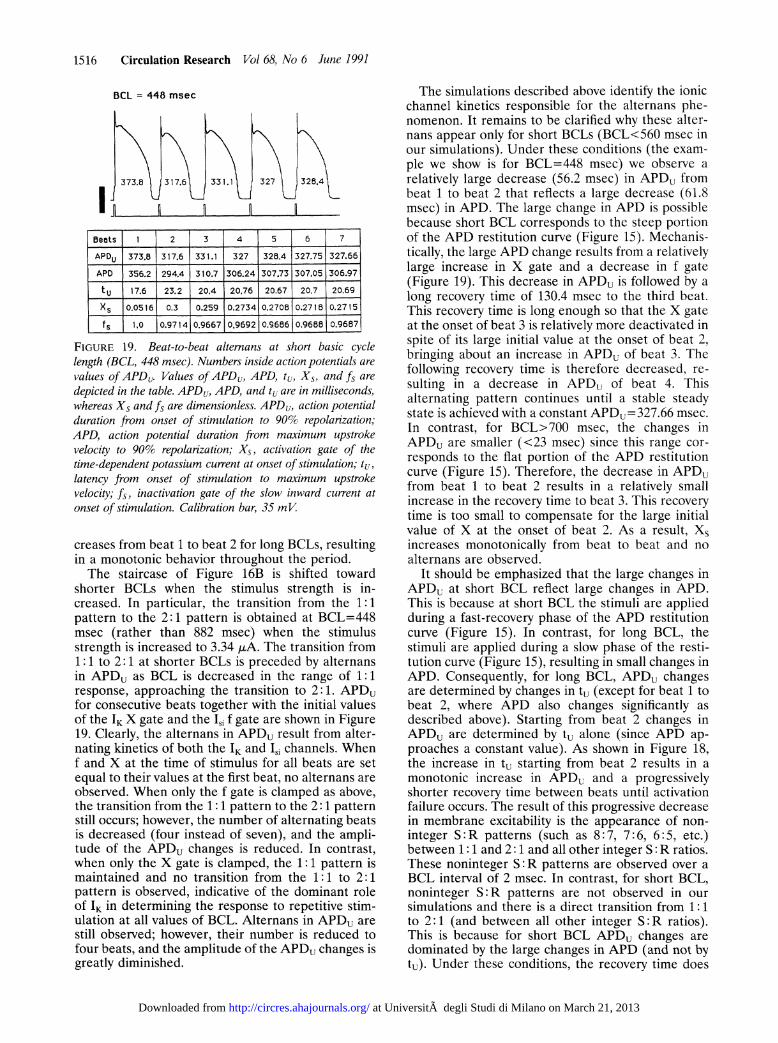
FIGURE 19. Beat-to-beat altemans at short basic cyclelength (BCL, 448 msec). Numbers inside action potentials arevalues ofAPDu. Values ofAPDu, APD, tu, Xs, and fs aredepicted in the table. APDu, APD, and tu are in milliseconds,whereas Xs and fs are dimensionless. APDu, action potentialduration from onset of stimulation to 90% repolarization;APD, action potential duration from maximum upstrokevelocity to 90% repolarization; Xs, activation gate of thetime-dependent potassium current at onset of stimulation; tu,latency from onset of stimulation to maximum upstrokevelocity; fs, inactivation gate of the slow inward current atonset of stimulation. Calibration bar, 35 mV
creases from beat 1 to beat 2 for long BCLs, resultingin a monotonic behavior throughout the period.The staircase of Figure 16B is shifted toward
shorter BCLs when the stimulus strength is in-creased. In particular, the transition from the 1: 1pattern to the 2:1 pattern is obtained at BCL=448msec (rather than 882 msec) when the stimulusstrength is increased to 3.34 ,uA. The transition from1: 1 to 2: 1 at shorter BCLs is preceded by alternansin APDU as BCL is decreased in the range of 1:1response, approaching the transition to 2:1. APDufor consecutive beats together with the initial valuesof the IK X gate and the I,i f gate are shown in Figure19. Clearly, the alternans in APDu result from alter-nating kinetics of both the IK and 'Si channels. Whenf and X at the time of stimulus for all beats are setequal to their values at the first beat, no alternans areobserved. When only the f gate is clamped as above,the transition from the 1: 1 pattern to the 2: 1 patternstill occurs; however, the number of alternating beatsis decreased (four instead of seven), and the ampli-tude of the APDU changes is reduced. In contrast,when only the X gate is clamped, the 1:1 pattern ismaintained and no transition from the 1:1 to 2:1pattern is observed, indicative of the dominant roleOf IK in determining the response to repetitive stim-ulation at all values of BCL. Alternans in APDU arestill observed; however, their number is reduced tofour beats, and the amplitude of the APDU changes isgreatly diminished.
The simulations described above identify the ionicchannel kinetics responsible for the alternans phe-nomenon. It remains to be clarified why these alter-nans appear only for short BCLs (BCL<560 msec inour simulations). Under these conditions (the exam-ple we show is for BCL=448 msec) we observe arelatively large decrease (56.2 msec) in APDU frombeat 1 to beat 2 that reflects a large decrease (61.8msec) in APD. The large change in APD is possiblebecause short BCL corresponds to the steep portionof the APD restitution curve (Figure 15). Mechanis-tically, the large APD change results from a relativelylarge increase in X gate and a decrease in f gate(Figure 19). This decrease in APDU is followed by along recovery time of 130.4 msec to the third beat.This recovery time is long enough so that the X gateat the onset of beat 3 is relatively more deactivated inspite of its large initial value at the onset of beat 2,bringing about an increase in APDu of beat 3. Thefollowing recovery time is therefore decreased, re-sulting in a decrease in APDU of beat 4. Thisalternating pattern continues until a stable steadystate is achieved with a constant APDu=327.66 msec.In contrast, for BCL>700 msec, the changes inAPDU are smaller (<23 msec) since this range cor-responds to the flat portion of the APD restitutioncurve (Figure 15). Therefore, the decrease in APDufrom beat 1 to beat 2 results in a relatively smallincrease in the recovery time to beat 3. This recoverytime is too small to compensate for the large initialvalue of X at the onset of beat 2. As a result, Xsincreases monotonically from beat to beat and noalternans are observed.
It should be emphasized that the large changes inAPDU at short BCL reflect large changes in APD.This is because at short BCL the stimuli are appliedduring a fast-recovery phase of the APD restitutioncurve (Figure 15). In contrast, for long BCL, thestimuli are applied during a slow phase of the resti-tution curve (Figure 15), resulting in small changes inAPD. Consequently, for long BCL, APDu changesare determined by changes in tu (except for beat 1 tobeat 2, where APD also changes significantly asdescribed above). Starting from beat 2 changes inAPDU are determined by tu alone (since APD ap-proaches a constant value). As shown in Figure 18,the increase in tu starting from beat 2 results in amonotonic increase in APDu and a progressivelyshorter recovery time between beats until activationfailure occurs. The result of this progressive decreasein membrane excitability is the appearance of non-integer S:R patterns (such as 8:7, 7:6, 6:5, etc.)between 1: 1 and 2: 1 and all other integer S: R ratios.These noninteger S: R patterns are observed over aBCL interval of 2 msec. In contrast, for short BCL,noninteger S:R patterns are not observed in oursimulations and there is a direct transition from 1: 1to 2: 1 (and between all other integer S:R ratios).This is because for short BCL APDU changes aredominated by the large changes in APD (and not bytu). Under these conditions, the recovery time does
at Università degli Studi di Milano on March 21, 2013http://circres.ahajournals.org/Downloaded from
Luo and Rudy A Model of the Ventricular Cardiac Action Potential 1517
A 3.5
3.3.
3 1-
2.9
4....-
8.380
B
E0
[K1O = 4 mM
2 1
0(U*
cc:
424 468 512
St - S2 (msec)556 600
450 -
4:3:2 1
350(bI (cl
2504- (b)
50
19 (c)50 _,, - 636 7380 444 508 572 636 700
S, - S2 (msec)
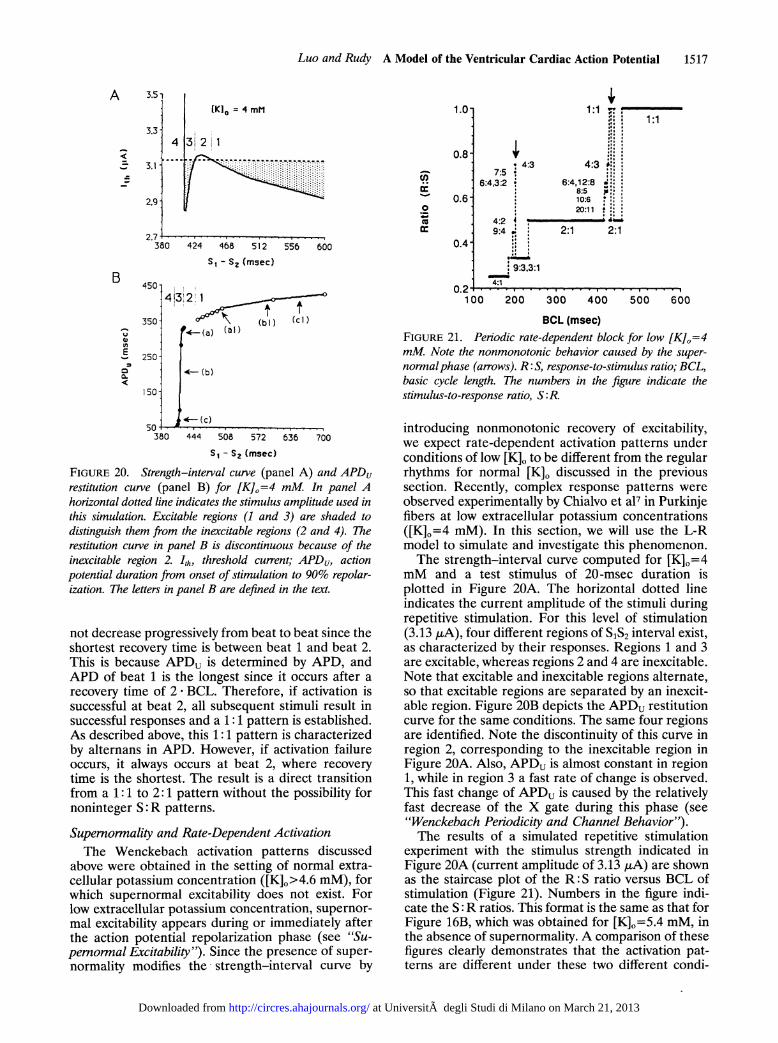
FIGURE 20. Strength-interval curve (panel A) and APDurestitution curve (panel B) for [K]0 =4 mM. In panel Ahorizontal dotted line indicates the stimulus amplitude used inthis simulation. Excitable regions (1 and 3) are shaded todistinguish them from the inexcitable regions (2 and 4). Therestitution curve in panel B is discontinuous because of theinexcitable region 2. Ith, threshold current; APDu, actionpotential duration from onset of stimulation to 90% repolar-ization. The letters in panel B are defined in the text.
not decrease progressively from beat to beat since theshortest recovery time is between beat 1 and beat 2.This is because APDu is determined by APD, andAPD of beat 1 is the longest since it occurs after a
recovery time of 2 BCL. Therefore, if activation issuccessful at beat 2, all subsequent stimuli result insuccessful responses and a 1:1 pattern is established.As described above, this 1:1 pattern is characterizedby alternans in APD. However, if activation failureoccurs, it always occurs at beat 2, where recoverytime is the shortest. The result is a direct transitionfrom a 1: 1 to 2: 1 pattern without the possibility fornoninteger S: R patterns.
Supernormality and Rate-Dependent ActivationThe Wenckebach activation patterns discussed
above were obtained in the setting of normal extra-cellular potassium concentration ([K]o>4.6 mM), forwhich supernormal excitability does not exist. Forlow extracellular potassium concentration, supernor-mal excitability appears during or immediately afterthe action potential repolarization phase (see "Su-pernornal Excitability"). Since the presence of super-normality modifies the- strength-interval curve by
1.0-
0.8-
0.6
0.4-
1:1 S.'.'.. 1:1
4:3 4:37:5~
6:4,3:2 64,12:8
2..
8:5 ::
10:6
20:11
4:2 4 49:4 : 2:1 2:1
993,3:14:1
..2A
0.2 m - ; V.VV
100 200 300 400 500 600
BCL (msec)FIGURE 21. Periodic rate-dependent block for low [K]0=4mM Note the nonmonotonic behavior caused by the super-normalphase (arrows). R S, response-to-stimulus ratio; BCL,basic cycle length. The numbers in the figure indicate thestimulus-to-response ratio, S :R.
introducing nonmonotonic recovery of excitability,we expect rate-dependent activation patterns underconditions of low [K]. to be different from the regularrhythms for normal [K]o discussed in the previoussection. Recently, complex response patterns wereobserved experimentally by Chialvo et a17 in Purkinjefibers at low extracellular potassium concentrations([K]0=4 mM). In this section, we will use the L-Rmodel to simulate and investigate this phenomenon.The strength-interval curve computed for [K]0=4
mM and a test stimulus of 20-msec duration isplotted in Figure 20A. The horizontal dotted lineindicates the current amplitude of the stimuli duringrepetitive stimulation. For this level of stimulation(3.13 ,A), four different regions of S1S2 interval exist,as characterized by their responses. Regions 1 and 3are excitable, whereas regions 2 and 4 are inexcitable.Note that excitable and inexcitable regions alternate,so that excitable regions are separated by an inexcit-able region. Figure 20B depicts the APDu restitutioncurve for the same conditions. The same four regionsare identified. Note the discontinuity of this curve inregion 2, corresponding to the inexcitable region inFigure 20A. Also, APDu is almost constant in region1, while in region 3 a fast rate of change is observed.This fast change of APDu is caused by the relativelyfast decrease of the X gate during this phase (see"Wenckebach Periodicity and Channel Behavior").The results of a simulated repetitive stimulation
experiment with the stimulus strength indicated inFigure 20A (current amplitude of 3.13 ,uA) are shownas the staircase plot of the R: S ratio versus BCL ofstimulation (Figure 21). Numbers in the figure indi-cate the S:R ratios. This format is the same as that forFigure 16B, which was obtained for [K]0=5.4 mM, inthe absence of supernormality. A comparison of thesefigures clearly demonstrates that the activation pat-terns are different under these two different condi-
2.7 ........
at Università degli Studi di Milano on March 21, 2013http://circres.ahajournals.org/Downloaded from
FIGURE 22. The first nonmonotonic range of Figure 21 isenlarged here by showing the range ofbasic cycle length (BCL)from 465 to 410 msec (panel A). Panel B: Related activationpatterns are plotted (calibration bar, 35 mV). R :S, response-to-stimulus ratio; S :R, stimulus-to-response ratio. Numbers inpanelA are S:R ratios. Arrows in panelA indicate a specificBCL.
tions. For normal [K], (no supernormality) a mono-tonic progression of the activation ratio is observed(Figure 16B). In contrast, nonmonotonic changes inthe activation ratio are observed for low [K], (super-normality present) (Figure 21). Under these condi-tions, a stable 1:1 pattern is followed by a region ofnonmonotonic behavior as BCL is decreased below458 msec (right arrow). This nonmonotonic regioncovers a range of BCLs from 458 to 415 msec. Below415 msec another regular region of a 2:1 pattern isobtained, followed by another region of nonmono-
FIGURE 23. The second nonmonotonic range ofFigure 21 isenlarged here by showing the range ofbasic cycle length (BCL)from 205 to 180 msec (panel A). Panel B: Highly aperiodicpattems that correspond to BCL =200.4 msec (arrow in panelA) are plotted (calibration bar, 35 mV). In the second row ofpanel B, * indicates complex pattems of consecutive actionpotentials; F and S indicate activation failure or success,respectively. R: S, response-to-stimulus ratio. Numbers inpanel A are stimulus-to-response (S:R) ratios. For actionpotentials with rapid sodium-dependent upstroke we definesuccess as peak INa greater than 1% of thepeak INa underfullyrecovered conditions. For slow response action potentials(upstroke depends on I,,) we define success as an actionpotential of duration greater than 50 msec (not including thestimulus duration).
tonic behavior (BCLs from 205 to 190 msec, leftarrow). Note that the same patterns repeat for dif-ferent regions of BCL. For example. a 1:1 pattern is
Luo and Rudy A Model of the Ventricular Cardiac Action Potential
observed for a BCL of 500, 438, and 428 msec. Theseregions are separated by regions of 2: 1 patterns.The nonmonotonic regions of Figure 21 are ampli-
fied in Figures 22A and 23A. In Figure 22A, as BCLis decreased from 465 msec the activation patternchanges from 1:1 to 2:1 at a BCL of 458 msec andthen returns to the 1:1 pattern at a BCL of 439 msec.
This nonmonotonic transition from 2: 1 to 1: 1 ispossible because of the nonmonotonic strength-in-terval curve (supernormality) of Figure 20A. The 2: 1pattern in Figure 22A occurs over a range of BCLs(between 458 and 440 msec) that corresponds toregion 2 of the strength-interval curve (Figure 20A).A stimulus at this region fails to elicit a response so
that the next stimulus occurs at 2 BCL in region 1 ofthe strength-interval curve, resulting in a successfulresponse. A 2:1 pattern is thus established (see thefirst row in Figure 22B). The 1:1 pattern of activationfor BCLs between 439 and 433 msec is also shown inFigure 22B (second row). The first action potential isof maximum duration because it is stimulated from afully recovered membrane. The second stimulus isapplied during the supernormal phase (region 3 inFigure 20A) and displays a shorter duration. This isbecause the stimulus is timed during the fast decreas-ing phase of the restitution curve (point a in Figure20B). As a result, a longer recovery time follows thisaction potential and the third stimulus is applied inregion 1 of the strength-interval curve (Figure 20A).However, the duration of the third action potential(point al in Figure 20B) is still shorter than that ofthe first action potential, obtained under fully recov-ered conditions. Consequently, the recovery time islonger and all subsequent stimuli are applied inregion 1 of the strength-interval curve, resulting in a1:1 pattern. For a further decrease in BCL, thepattern returns to 2:1 (BCL of 432 msec), and thenback to 1:1 (BCL of 428 msec). These two patternsare shown in Figure 22B (third and fourth rows,respectively). For a BCL of 432 msec, the secondaction potential is of short duration, corresponding topoint b on the restitution curve of Figure 20B (notethat the APDu at b is smaller than that at point a).The following stimulus elicits an action potential ofduration (bl) on the restitution curve (bl>al). As a
result, the next stimulus is timed during region 2 ofthe strength-interval curve and does not elicit a
successful response. A 2:1 pattern is thus estab-lished. For a BCL of 428 msec (see Figure 22B) thesecond response is of a very short duration, corre-sponding to point c in Figure 20B. The followingstimulus is applied after a long recovery time, result-ing in an action potential of long duration (point cl inFigure 20B). As a result, the next stimulus is appliedin region 2 of the strength-interval curve and fails toelicit an action potential. This event is followed by a
long recovery time and an action potential of longduration so that the next stimulus is timed during thesupernormal phase (region 3) of the strength-inter-val curve, resulting in a successful response of shortduration. After these transitional events the pattern
1 Na 170
(>A)0
2.3
(I A)0
Isi
II II1111111111 I11FIGURE 24. Sodium current (IN,a, upper panel) and cal-cium current (Ii,, lower panel) underlying the highly aperiodicpattems in the second row of Figure 23B. Note that theactivation success indicated by S results from a slow responsethat does not involve the sodium current. F, activation failure;*, complex pattems of Isi that correspond to the complexpattems of action potentials in Figure 23B. Calibration bars,35 mV For action potentials with rapid sodium-dependentupstroke we define success as peak INa greater than 1% of thepeak INa under fully recovered conditions. For slow responseaction potentials (upstroke depends on 1Is) we define successas an action potential of duration greater than 50 msec (notincluding the stimulus duration).
is similar to that obtained for a BCL of 436 msec (seeFigure 22B), and a ratio of 1:1 is established. Asimilar interplay between the excitability and APD atthe different regions defined in Figures 20A and 20Bdetermines the various patterns as BCL is furtherdecreased.
In Figure 23A, as the BCL is reduced below 205msec, irregular activation patterns are observed. Anexample is shown in Figure 23B for a BCL of 200.4msec (arrow in panel A). For this particular BCL,unstable patterns are observed and no regular peri-odicity is established for more than 250 consecutivestimuli. This behavior is consistent with the experi-mental findings of Chialvo et al,7 who observed highlyaperiodic activity (termed "chaotic activity") at aBCL of 200 msec with no repeated patterns forrecording periods that encompassed 100 or morestimuli. In our simulations, after a transient chaoticpattern that lasted more than 250 consecutive stimulia very complex pattern with very long periodicity ofabout 13 seconds (67 stimuli) was established.The highly aperiodic activity occurs at a BCL
below 205 msec. For this range of BCL, the stimuliare frequently applied during region 3 of thestrength-interval curve (supernormal phase). In thisregion, the APD depends very strongly on the time ofstimulation. In fact, APDu changes by 281 msec overan S1S2 interval of 15 msec (Figure 20B). As a result,a small change in the time of stimulation during thesupernormal phase can cause a very large change inthe duration of the elicited action potential and inthe timing of the next stimulus. Consequently, smallvariations in the time of stimulation in region 3 canshift the timing of the next stimulus between different
1519
at Università degli Studi di Milano on March 21, 2013http://circres.ahajournals.org/Downloaded from
regions of the strength-interval curve, eliciting a verydifferent response. This high sensitivity to the timingof stimulation ("initial conditions") is the basis forthe unstable patterns ("chaotic activity"). It shouldbe noted that at a BCL between 410 and 465 msecnonmonotonic behavior of the activation patterns isalso observed. However, for this range of BCL thereare no unstable patterns or aperiodic activity. This isbecause for the longer BCL, the stimuli are infre-quently applied during region 3 of the strength-interval curve (supernormal phase). Moreover, astimulus during region 3 is never followed by anotherstimulus in the same region. The next stimulus alwaysfalls either in region 2 (activation failure) or in region1 (the flat portion of the restitution curve, Figure20B). On the flat portion of the restitution curve,small changes in the time of the stimulation cancause only very small changes in APD. This has astabilizing effect on the response so that irregularactivity and unstable patterns do not occur.To further elucidate the ionic current behavior dur-
ing the highly aperiodic activity, in Figure 24 we plottedthe magnitude of INa and ISi that corresponds to thepattern shown in Figure 23B, second row from the top.An important observation is that most of the responsesduring the complex patterns do not involve the fastsodium channel and depolarization is caused by Isi. InFigure 23B, F identifies an activation failure during theplateau of an action potential that was initiated inregion 1 of the strength-interval curve. A successfulactivation during the plateau of an action potential thatwas initiated in region 3 of the strength-interval curveis identified by S in the figure. The correspondingevents in the Isi curve are also identified by F and S,respectively (Figure 24). The difference between thepeak magnitudes of Isi for these two events is very small(0.2 ,lA). However, the total outward current(IK1(T)+IK) at F is 3.93 gA as compared with only 2.35,uA at S. This decrease is mostly due to reduced 'Kl(T) atthe lower membrane potential of S and results in asuccessful response, bringing about a very complexpattern of activation. It should be mentioned that thisbehavior involves the negative slope characteristic ofthe IK1(T) curve (Figure 3). When we eliminate thenegative slope in the IK1(T) curve (not shown), unstablepatterns do not appear.
DiscussionThe goal of this study is to construct a model of the
membrane action potential of the mammalian ven-tricular cell based, whenever possible, on recentexperimental findings in single-cell and single-chan-nel studies. In this report we reformulate three ioniccurrents: INa, IK, and IKI(T). INa is inactivated by twoprocesses-fast and slow. The slow process of inac-tivation also implies slow recovery of excitability. Inaddition, INa is characterized by a large channelconductance resulting in fast upstroke velocity(Vmax=400 V/sec) of the action potential. A newlydiscovered potassium channel that activates at highpotentials is implemented as a component of IK1(T) in
the model. [K], dependence of 'K and IKI(T) is a majorfeature of the model. This enables us to simulatevarious phenomena that involve changes in [K],. Inthis paper we focus on the rising phase, the laterepolarization phase, and the postrepolarizationphase of the action potential. We use the model toinvestigate phenomena that involve INa, IK' and IK(T)during these phases such as supernormal excitability,membrane responsiveness, and Wenckebach perio-dicity. The results are consistent with the experimen-tal observations, and the phenomena are well de-scribed in terms of ionic channel behavior. It shouldbe emphasized that the present model does notinclude ionic pumps and exchange mechanisms. Ittherefore cannot simulate dynamic changes in ionicconcentrations. The slow inward current in the modelis adopted from the B-R model and is not consistentwith recent findings related to calcium currentsthrough the membrane such as the existence of twotypes of calcium channels, L and T, and the roleplayed by [Ca]i in inactivation. Also, while an uptakemechanism of intracellular calcium is represented inthe model, the model cannot simulate intracellularcalcium transients that result from the interactionbetween calcium currents through the sarcolemmaand calcium release and uptake by the sarcoplasmicreticulum. A second phase of the ventricular modelpresented here is currently being developed in ourlaboratory to include all of these processes based onrecent experimental data. Such processes were firstincorporated in a model of the Purkinje action po-tential by DiFrancesco and Nobles in 1985.We use the Hodgkin-Huxley formalism to describe
the macroscopic (ensemble) behavior of ionic channels.This choice is consistent with (and dictated by) ourgoal, namely, the reconstruction of the membraneaction potential that results from ensemble currentsthrough many individual channels. However, oneshould practice caution when extrapolating from theensemble behavior to the single-channel behavior, es-pecially when the cardiac sodium channel kinetics areconsidered. While many single sodium channel proper-ties correspond to similar characteristics of the ensem-ble current4344 and are adequately described by theHodgkin-Huxley kinetics, some properties are not. Forexample, at potentials near threshold for sodium chan-nel activation, both channel activation and inactivationdetermine the kinetics of the macroscopic sodiumcurrent decay (i.e., current inactivation).4445 The mi-croscopic behavior of ionic channels other than thesodium channels can be adequately described by theHodgkin-Huxley kinetics.26,30For the sake of clarity, the discussion below is
divided into modeling aspects and physiological sim-ulation aspects of the study.
Modeling ConsiderationsINa: Fast sodium current. The fast upstroke velocity
of the action potential has been measured in singlecells.13,46,47 The Vmax measured by Brown et al'3 is in
at Università degli Studi di Milano on March 21, 2013http://circres.ahajournals.org/Downloaded from
Lao and Rudy A Model of the Ventricular Cardiac Action Potential 1521
the range of 200-300 V/sec at 20-22°C. By applyinga minimum Qlo of 1.23,48 Vma is at least 272-410V/sec at 37°C. Vm. of the E-J model is 300 V/sec,while it is 400 V/sec if computed by the L-R model.The faster upstroke in the L-R model results fromadjusting the reversal potential from 29 mV (E-Imodel) to 54.4 mV to reflect the different intracellu-lar sodium concentration in mammals ([Na]i= 18mM)13'23 and chicken embryos ([Na]i=40 mM).25This adjustment gives Vma~x=400 V/sec in the range ofmeasured values. It also results in an overshoot (41.7mV) of the action potential that is in good agreementwith the experimental findings in guinea pig ventric-ular cells.31,35A tetrodotoxin (YTX)-sensitive slow sodium cur-
rent that affects the action potential duration hasbeen identified in single-channel recordings.49-52 Inguinea pig ventricular cells, a low dose of TTX (.30gM) does not affect the APD significantly.35,53 How-ever, Kiyosue and Arita,52 using a high dose of TTX(60 ,uM), observed -10% shortening of the APD.This slow current is different from the window cur-rent caused by the overlap of the M3n. and h. curves athigh potentials,51,52 as demonstrated by the fact thatTTX can affect the APD with little (or no) change inVmax.9,54 The kinetics of this slow current are still notcompletely elucidated, and it is not included in theL-R model. We will have to include this channel infuture studies (as more data become available),especially if effects of drugs are to be studied (somelocal anesthetics can affect this current).Two time constants (fast and slow) better describe
the inactivation of the sodium channel.13'49'50'55'56This cannot be described by the Hodgkin-Huxleykinetics with one inactivation gate. Similar to Beelerand Reuter we incorporated two Hodgkin-Huxley-type inactivation gates as suggested by Haas et al.24Haas et a124 proposed that two inactivation gates (hand j in the L-R model) with different time constantscan describe the macroscopic behavior of the sodiumcurrent inactivation. Following this strategy, the L-Rmodel correctly simulated the behavior of the sodiumchannel observed experimentally (Figures 7 and 8).Without slow recovery from inactivation (a propertynot included in the E-J model or in the DiFrancesco-Noble model) INa recovery from inactivation followsthe same time course following different periods ofinactivation (Figure 7D). This is inconsistent with theexperimental observations (Figure 7A) by Ebihara etal.36 Also, without slow recovery from inactivation,the fast recovery of INa results in an unrealisticallyfast recovery of excitability at a high level of mem-brane potential during the repolarization phase of anaction potential (Figure 8D). Note that a conserva-tive value of rj was used in our simulations. We useda maximum rj of -80 msec at V= -65 mV. Values ashigh as 200 msec were reported in the literature.14To account for this process of slow recovery from
inactivation, alternative models to that of Hodgkinand Huxley were proposed to describe an inactiva-tion gate with two time constants (fast and slow).
Chiu57 proposed a modified Hodgkin-Huxley formal-ism (second-order kinetics) to describe two processesof inactivation. However, Brown et al13 found thatthe h,(V) curve can be described by a single expo-nential, a result that is also supported by the recentobservations for single-channel recordings.44 Thisdeviates from the prediction of Chiu's model57 thath, has to be described by two exponentials as afunction of voltage. Recently, Markov chain modelshave been proposed to describe the sodium channelkinetics in cardiac cells.58 Based on single-channelrecordings and a five-state Markov model,59 Scanleyet a145 provided a kinetic analysis of the sodiumchannel. The basic five-state model reproduced ob-served open-duration data and reopening behaviorbut produced only a single exponential decay ofcurrent, implying that more complex models arerequired.
Single-channel recordings demonstrate that near-threshold potentials for channel activation sodiumchannels tend to open more than once during adepolarization (reopening phenomenon44'45). Also, asignificant fraction of sodium channels do not openby the time of peak inward current. These micro-scopic phenomena determine the time course of themacroscopic current decay and provide the basis forthe slow macroscopic current inactivation that isintroduced in our model by the j gate.
IK: Time-dependent potassium current. The formu-lation of IK in our model is based on the formsuggested by Shibasaki26 to fit his data in nodal cells,but its parameters are obtained from the B-R modelof the ventricular action potential. Note that theproperty of [K]O-dependent activation is introducedas a square root dependence of the maximum con-ductance. In contrast, the DiFrancesco-Noble formu-lation5 results in a linear dependence of channelconductance on [K]. in the physiological range of[K]O from 2 to 10 mM. The simulated results (Figure1) are consistent with the experimental findings byMcDonald and Trautwein29 and Shibasaki26 and in-clude minimal crossover between current-voltagecurves of different [K], and strong inward rectifica-tion. An alternative formulation could be constructedfrom the data measured by Matsuura et a127 in guineapig single ventricular cells. They measured the fullyactivated IK curve [IK(V)I for [K]0=5.4 mM andproposed that K='K@X2 (IK activation is propor-tional to the second power of the activation gate, X).We introduced [K]0 dependence in their formulationand investigated the behavior of IK for differentvalues of [K]O. The results displayed significant cross-over between IK curves of different [K]O. This isinconsistent with the experimental observations.26'29We then introduced this alternative formulation of IKin the L-R model of the action potential. Since thesurface membrane area was not given by Matsuura etal,27 we adjusted the maximum conductance (GK)based on the mean capacitive membrane area mea-sured by Isenberg and Klockner (2x 0-4 cm2/cell)3'and Kamp et al (8.52x 10`- cm2/cell).60 This resulted
at Università degli Studi di Milano on March 21, 2013http://circres.ahajournals.org/Downloaded from
in GK-0.143 mS/cm2 and GK=0.335 mS/cm2, respec-tively, in comparison with the L-R GK=0.282 mS/cm2.Note that specific capacitance of 1 bLF/cm~ is as-sumed. The (adjusted) alternative 'K failed to repo-larize the membrane when [K] '.4.5 mM (forGK=0.143 mS/cm2) and [K],.<2.2 mM (for GK=0.335mS/cm2), and the membrane potential stayed atabout -30 to -40 mV. This is inconsistent with theexperimental observations at low [K],. Tseng et a19observed repolarization at [K]0=2 mM but not at[KE0=1 mM. This behavior is simulated correctly bythe L-R IK in spite of its smaller conductance(GK<0.335 mS/cm2). This inability of the Matsuura eta127 IK to repolarize the membrane in spite of thelarge conductance results from the X2 dependence ofIK. For these reasons we formulated the L-R IK todepend on X (rather than X2), as suggested byShibasaki.26 It should be emphasized, however, thatthe behavior of IK was demonstrated in a model thatretains the slow inward current formulation of theB-R model. The Matsuura 'K will have to be reexam-fined once an accurate model of 'Ca is developed.
IK1(T) Total time-independent potassium current.This current is equivalent to IK' in the B-R model3and is renamed here IK1(T) based on the followingrecent findings. In single-channel recordings, Kura-chi30 found that 1) an inactivation gate (K1) of IKi isa function of membrane potential and of the potas-sium Nernst potential and 2) this gate completelyinactivates at plateau potentials, resulting in zero 'Icurrent at these potentials. The zero contribution ofIK1 at plateau potentials was also observed by Isen-berg32 and Shah et al.34 Therefore, the total (non-zero) time-independent potassium current (IK1(T)) athigh (plateau) potentials must result from currentthrough other channels. Kakei et a161 and Jijima andTaira62 found that the shortening of the APD causedby potassium channel agonists (nicorandil and pina-cidil) is a result of increasing the current only at highpotentials. This observation supports the Yue andMarban12 discovery of a plateau potassium channel(1KP) that activates only at high potentials. Thischannel is characterized by a much smaller timeconstant than 'K, no detectable inactivation for morethan 600 msec, and high selectivity to potassium ions.Also, the maximum conductance (GKP) is largely in-sensitive to changes in [K]O. This insensitivity is con-sistent with the experimental observations by Isenbergand Klockner (Figure 8 of Reference 8), Sakmann andTrube (Figure 4A of Reference 11), and Tseng et al(Figure 2A of Reference 9) in whole-cell recordings.They observed that the current-voltage curves of IK(T)for different values of [K]O (1-22 mM) overlap at highpotentials. This overlap implies that the plateau cur-rents are insensitive to changes in [K], According tothe observations described above, 1K1 contributes nocurrent at plateau potentials and 'Kp can be treated asa component of IK1(T) that is activated only at plateaupotentials. Also, a background current (1b) exists atnegative potentials after blocking IKI 32-34 Therefore,
IK1(T) consists of at least three currents (IK1, IKP, andIb). We represent the IKI(T) as the sum of these threecurrents to fit the data measured by Sakmann andTrube (Figure 4A of Reference 11) and obtain anexcellent fit for all values of [K],0 (Figure 3). It is ofinterest to note that the negative slope of the simu-lated IK1(T) is smaller than that measured by Kurachi30in single-channel recordings. However, the L-R re-sult is consistent with the experimental observationsin multicellular32,63 and single-cell8,9,34 recordings.Note that the property of [K]0-dependent activationis introduced as a square root dependence of themaximum conductance.10,11 This behavior is differentfrom the linear dependence on [K]0 over the physio-logical range in the DiFrancesco-Noble formulation([K]c< <Km,1 in their Equation 13).,-Physiological SimulationsMembrane response to premature stimulation. Pre-
mature stimulation can be used to investigate therecovery of membrane excitability during the repo-larization phase of an action potential. The simula-tions show that the premature membrane response,indicated by Vma measured in mammalian ventricu-lar cells,14 is well represented by the L-R model(Figure 8). We define the absolute refractory periodas the range of membrane potential for which stim-ulation will result in Vmax that is smaller than 20% ofthe fully recovered Vmaya The result (V> -78 mV) ofthe L-R model (Figure 8B) that incorporates theprocess of slow recovery from inactivation is veryclose to the experimental data (>-76 mV, Figure8A). In the absence of slow recovery from inactiva-tion (E-J model, Figure 8D), the simulation result(V> -69 mV) deviates significantly from the experi-mental data. Similar behavior is expected from allmodels of the sodium channel that do not incorpo-rate the process of slow recovery from inactivation(e.g., Drouhard and Roberge64). This comparisondemonstrates the importance of the process of slowrecovery from inactivation in determining the timecourse of recovery of membrane excitability duringrepolarization. Since during repolarization j is almostcompletely inactivated and since irj> > ih, it followsthat the membrane responsiveness is controlled bythe slow inactivation j gate. Our simulations alsodemonstrate the importance of incorporating thecorrect steady-state characteristics of INa inactivation[h.(V) and ja(V)] in the model. The steady-statebehavior predicted by the B-R model deviates fromthe experimental behavior of cardiac fibers (comparecurve 2 in Figures 8C and 8A), whereas the L-Rmodel (based on the INa data from mammalianventricular cells) simulates the experimental behav-ior correctly. It is also important to incorporate thecorrect GN,. The B-R model (GNa=4 mS/Cm2) pre-dicts a Vmax that is unrealistically slow (115 V/sec),while the L-R model (GNa=23 mS/cm2) predicts aV7. within the range of measured values (400 V/sec).Note that a GNa increase by a factor of almost 6results in a Vm.X increase by a factor of about 3. This
at Università degli Studi di Milano on March 21, 2013http://circres.ahajournals.org/Downloaded from
Luo and Rudy A Model of the Ventricular Cardiac Action Potential 1523
is because the actual rate of activation of the cardiacsodium channel (represented in the L-R model) isslower than the rate of activation used in the B-Rmodel (modified from squid-axon data). The unreal-istic low GNa of the B-R model also leads to anunrealistically long latency from threshold potentialto Vm, (Figure 6D) that is inconsistent with theexperimental findings.28So far, we have considered the membrane response
at a normal [K]0 ([K]0=5.4 mM). The L-R modelallows changes in extracellular potassium concentra-tion to be incorporated. We studied the membraneresponse to premature stimulation for different [K],.The strength-interval curve is determined by thecritical (minimum) strength of test stimuli needed toexcite the membrane during the repolarization phaseof an action potential. Experimentally, the stimulusstrength decreases monotonically with repolarizationat normal [K]O; however, supernormal excitability hasbeen identified as an interval in which nonmonotonicbehavior of the strength-interval curve occurs at low[K]0.7,39 The results (Figure 9) of the L-R modelsimulations are consistent with the experimental ob-servations. For [K]o>4.6 mM, the threshold potentialdecreases during repolarization at a rate that is fasterthan the rate of repolarization (Figure 12). As a result,membrane excitability increases monotonically duringrepolarization. For low [K]0 ([K]04.6 mM) there is arange during late repolarization at which the rate ofmembrane repolarization is faster than the decreaseof threshold potential (Figure 12).38 This results in adecrease of excitability over this range and, therefore,in a nonmonotonic recovery of membrane excitability(Figure 9). The presence of an interval during whichexcitability is higher than in the adjacent (previousand following) intervals is known as "supernormality."'At the level of channel kinetics, this behavior is aconsequence of different kinetics of slow recoveryfrom inactivation of INa at different values of [K]O. As[K]0 decreases from 7 to 3 mM, resting potential(primarily controlled by IK1), becomes more negative(from - 78.2 to - 95.5 mV) so that the time constant ofsodium channel recovery, dominated by the slowinactivation j gate, becomes smaller (ij decreases from33 to 7 msec). As a result, the sodium channel recoversearlier in the repolarization phase at a range for whichrepolarization is faster than the rate of decrease ofthreshold potential, and a supernormal window iscreated. The interaction between lKl and slow recov-ery from inactivation of INa in response to changes in[K]O determines the amplitude and width of the win-dow of supernormal excitability (Figure 9). Withoutthe process of slow recovery from inactivation, thesodium channel recovers unrealistically earlier so thatsupernormality is observed even when [K]0 is as highas 7 mM (Figure 1lA). This is inconsistent with theexperimental observations.7'39
Periodic stimulation at normal [K]0. Wenckebachrate-dependent block was originally characterized asa propagation-related process that involves decre-mental conduction. Wenckebach65 described this
phenomenon in the atrioventricular node. Wencke-bach periodicity was also demonstrated in cardiactissue that contained a region of depressed conduc-tion separating two regions of normal excitability.66Recently, Wenckebach periodicity was demonstratedin a single ventricular cell under periodic stimula-tion,6,40 indicating that the phenomenon is an intrin-sic property of the cell membrane. Using the L-Rmodel at normal [K]O (5.4 mM), we investigated thecellular mechanism of the periodic rate-dependentblock. The simulations demonstrate that this processis dominated by the kinetics of the X gate of IK. Thisis because membrane excitability is influenced to alarge extent by the loss of charge to the extracellularmedium through the IK channel during stimuli ofrelatively long duration (20 msec) (see Figures 13 and14).As the BCL of periodic stimulation decreases from
2,000 msec, a monotonic decrease of the R: S ratio isobserved (staircase in Figure 16B). In our simula-tions, noninteger patterns of S: R ratios are observedin the transition interval between integer S: R ratios.For example, noninteger Wenckebach patterns (8:7,7:6, 6:5, etc.) are found between 1: 1 and 2: 1 (Figure16B). These patterns are observed in a very narrowinterval of about 2 msec. The fact that these patternsoccur over such a narrow time interval might be thereason why these various Wenckebach patterns couldnot be sustained in single myocyte preparations2840since small perturbations (e.g., in temperature andpipette resistance) can cause large changes relativeto the narrow transition range. In multicellular prep-arations7,65,66 the transition intervals are longer (upto 100 msec) and stable noninteger Wenckebachpatterns are observed.The appearance of Wenckebach block patterns is
related to beat-to-beat changes in APD (measuredfrom Vma, to 90% repolarization) and the latencyfrom onset of stimulation to Vma. Both parametersare controlled by the degree of IK deactivation (ki-netics of the X gate). For long BCL (BCL>920msec), APD of all beats in a Wenckebach patternremains almost constant (see Figure 15), while thelatency increases progressively so that deactivationtime (BCL-APD-latency) of the X gate decreasesmonotonically, bringing about a progressive beat-to-beat decrease of membrane excitability. This processcontinues until activation failure occurs. This is thetypical (classical) Wenckebach rate-dependent blockobserved in cardiac Purkinje fibers7 and in singleventricular myocytes.640 When BCL decreases (920msec.BCL>700 msec), the pattern of beat-to-beatchanges becomes different from the typical behaviordescribed above. APD does not remain constant, andrecovery time first increases (from second to thirdbeat) and then decreases monotonically. However,membrane excitability still decreases monotonicallyfrom beat to beat until activation failure occurs. Thisis because the beat-to-beat increase in the value of
at Università degli Studi di Milano on March 21, 2013http://circres.ahajournals.org/Downloaded from
the X gate at the time of stimulation more thancompensates for the initial increase in recovery time(see Figure 18). This atypical (nonmonotonic) behav-ior of recovery time can be observed in the data ofDelmar et a16 for stimulation at BCL=910 msec. Acareful inspection of Figure lB in their paper dem-onstrates that total APD (APD+latency) of the firstbeat in a Wenckebach pattern is greater than that ofthe second beat; also, the value of plateau potential isdecreased. These experimental findings are consis-tent with the simulations presented here (Figures 17and 18).When BCL further decreases (<560 msec), the
increase in the value of the X gate (i.e., degree of IKactivation) does not compensate for the initial in-crease in recovery time. As a result, membrane excit-ability increases at the time of the next stimulus,resulting in an action potential of long duration. Thisimplies a shorter recovery time and lower membraneexcitability at the time of the following stimulus, sothat the following action potential is of short duration.A pattern of beat-to-beat alternans in APD is thusestablished. The amplitude of alternans (see Figure19) decreases monotonically until a stable activationpattern (1:1) with constant APD (smaller than that ofthe fully recovered action potential) is established.Noninteger Wenckebach patterns cannot be foundwhen alternans occur. This is consistent with theexperimental observations (at BCL=430 msec) inisolated rabbit ventricular myocytes.67 The reason isthat both phenomena (noninteger Wenckebach pat-terns and alternans) cannot occur simultaneously.Alternans occur at small BCL, at a range where thereis a strong dependence of APD on the time ofstimulation (Figure 15), reflecting a strong depen-dence of the X gate deactivation on the time ofstimulation. At this range, the changes in APD aremuch larger than changes in the latency from stimulusto Vmax, so that the recovery time is determined byAPD. Since the first beat is of the longest APD (a fullyrecovered action potential), the recovery time to thesecond beat is the shortest and all following stimula-tions will be successful. Hence, a 1: 1 pattern is alwaysestablished when alternans are present. In contrast,noninteger Wenckebach patterns are established at arange of BCL for which large beat-to-beat changes inthe latency from stimulus to Vmax and small changes inAPD are present. At this range, recovery time isdetermined by the latency from stimulus to Vmax,which increases monotonically from beat to beat. Theresult is a monotonically decreasing recovery timeleading to block. Delmar et a128 used the B-R modelwith modified IKI to investigate the Wenckebach phe-nomenon for long BCL. The simulated transitioninterval during which noninteger Wenckebach pat-terns were observed was longer than 20 msec. Withsuch a long interval, one expects that systematicmeasurements of Wenckebach patterns in single cellswill reveal persistent noninteger ratios. This is incon-sistent with experimental observations.6.28,40
Periodic stimulation at low [K],. The L-R modelincorporates the possibility of changing [K]0. Westudied the effects of changes in [K], on the cellresponse to periodic stimulation. At low [K]0 thenonmonotonic behavior of the strength-intervalcurve (Figure 20A) allows stimuli to excite the mem-brane during the supernormal phase but not atadjacent (earlier or later) intervals. This discontinu-ity in excitability together with the high sensitivity ofAPD to the time of stimulation (Figure 20B) duringthe supernormal phase brings about nonmonotonicbehavior of the R:S curve and unstable activationpatterns (Figure 21). This complex behavior wasobserved experimentally and described in a recentpaper by Chialvo et al.7 For long BCL (.410 msec),stimulation is seldom timed during the supernormalphase. As a result, stable but complex activationpatterns are observed (such as 10:6, 12:8, 6:4, and20:11). Also, the same activation patterns are re-peated at different ranges of BCL (nonmonotonicstaircase behavior, see Figure 22). For short BCL(<205 msec), stimulation is frequently timed duringthe supernormal phase. Consequently, highly aperi-odic patterns that do not stabilize for more than 250consecutive stimuli are observed (Figure 23). This isconsistent with the experimental findings of Chialvoet al.7 A very small change in BCL (from 200.4 to200.7 msec) results in very different patterns, indicat-ing very high sensitivity to initial conditions. Theunstable patterns are frequently characterized bysuccessful activations during the early repolarizationphase of an action potential. This action potentialwas initiated by a stimulus applied during the super-normal phase. It is characterized by low plateaupotentials, in the range where IKI(T) exhibits a nega-tive slope. The decrease of IK1(T) with depolarizationat this range results in higher membrane excitabilityand a possibility of successful activation during theearly repolarization phase of an action potential. Itshould be noted that when we eliminate the negativeslope in the current-voltage curve of IKI(T), the unsta-ble aperiodic patterns disappear. Also, the successfulactivation at this range is a "slow response" causedby activation of 'Si and not of INa. Similar unstableaperiodic patterns were predicted by an analytic(difference-differential) model formulated by Chi-alvo et al.7 Their model is based on the relationsbetween excitability, latency, and APD. They showthat the appearance of aperiodic patterns is relatedto the presence of supernormality and to the shape ofthe APD restitution curve at short diastolic intervals.These observations are consistent with the behaviorof our membrane model and, as elucidated by oursimulations, reflect both large changes in the state ofdeactivation of the IK channel (X gate) and thenegative slope characteristic of IK1I(T)
In summary, the membrane model developed herecorrectly simulates various phenomena that resultfrom the interaction of excitation and repolarization.This is an important property of the model sincereentrant arrhythmias involve this type of interaction
at Università degli Studi di Milano on March 21, 2013http://circres.ahajournals.org/Downloaded from
Lao and Rudy A Model of the Ventricular Cardiac Action Potential 1525
between head and tail of the reentrant action poten-tial.17 Another property of the model is the ability tointroduce changes in [K]. This is also an importantaspect of the model since elevated [K], is an impor-tant aspect of ischemia that influences propagationand arrhythmogenesis.The simulations of membrane response to prema-
ture stimulation predict a variety of rate-dependentphenomena. These include Wenckebach periodicity,beat-to-beat alternans of APD, and (because of super-normality at low [K]0) unstable aperiodic responsepatterns that display high sensitivity to initial condi-tions. The occurrence of Wenckebach periodicity inour simulations support other observations that thisphenomenon is an intrinsic property of single cardiaccells. This observation suggests that the single-cellresponse under a variety of conditions might play animportant role in arrhythmogenesis. The occurrenceof beat-to-beat alternans in the simulations is intrigu-ing. Beat-to-beat alternans in APD are a property ofreentrant action potentials.17,68 In a broader sense,electrical alternans are detected in many circum-stances that are associated with ventricular fibrillationand, as suggested by Guevara et al,67 may reflect thefirst in a cascade of period-doubling bifurcations thateventually result in chaos, that is, fibrillation.69 As withWenckebach periodicity, the observation that alter-nans can be generated at the level of the single cellpoints to the possible important role of the single-cellresponse in arrhythmogenesis. Finally, the appearanceof highly aperiodic patterns that are extremely sensi-tive to initial conditions might also be related toarrhythmogenesis since it implies that short propaga-tion delays (-1 msec) can initiate very differentresponses in neighboring cells (or multicellular fiberbundles). Note that propagation delays of this magni-tude can occur across gap junctions under a verymoderate degree of cell-to-cell uncoupling.1516 Weconclude with a word of caution. The behaviors de-scribed above are the responses of isolated cells. Inthe heart, the behavior of cells is modulated by loadingconditions and electrotonic interactions.70 The re-sponse of a cell in an ensemble may, therefore, bedifferent from its intrinsic response. Under conditionsof increased cell-to-cell uncoupling the individual re-
sponse of cells (or of a group of cells, i.e., fiberbundles) may become unmasked, bringing about con-ditions that favor arrhythmogenesis. Verification ofthese hypotheses awaits further experimentation inmulticellular preparations and simulations in a multi-cellular model of cardiac tissue.
AcknowledgmentsWe would like to thank Dr. Gerald Saidel for his
help with the parameter estimation procedure. We alsothank Dr. Weilun Quan for very helpful discussions.
References1. Hodgkin AL, Huxley AF: A quantitative description of mem-
brane current and its application to conduction and excitationin nerve. J Physiol (Lond) 1952;117:500-544
2. McAllister RE, Noble D, Tsien RW: Reconstruction of theelectrical activity of cardiac Purkinje fibres. J Physiol (Lond)1975;251:1-59
3. Beeler GW, Reuter H: Reconstruction of the action potentialof ventricular myocardial fibres. J Physiol (Lond) 1977;268:177-210
4. Ebihara L, Johnson EA: Fast sodium current in cardiacmuscle: A quantitative description. Biophys J 1980;32:779-790
5. DiFrancesco D, Noble D: A model of cardiac electrical activityincorporating ionic pumps and concentration changes. PhilosTrans R Soc Lond [Biol] 1985;307:353-398
6. Delmar M, Michaels DC, Jalife J: Slow recovery of excitabilityand the Wenckebach phenomenon in the single guinea pigventricular myocyte. Circ Res 1989;65:761-774
7. Chialvo DR, Michaels DC, Jalife J: Supernormal excitabilityas a mechanism of chaotic dynamics of activation in cardiacPurkinje fibers. Circ Res 1990;66:525-545
8. Isenberg G, Klockner U: Isolated bovine ventricular myocytes:Characterization of the action potential. Pflugers Arch 1982;395:19-29
11. Sakmann B, Trube G: Voltage-dependent inactivation ofinward-rectifying single-channel currents in the guinea-pigheart cell membrane. J Physiol (Lond) 1984;347:659-683
12. Yue DT, Marban E: A novel cardiac potassium channel that isactive and conductive at depolarized potentials. Pflugers Arch1988;413:127-133
13. Brown AM, Lee KS, Powell T: Sodium currents in single ratheart muscle cells. J Physiol (Lond) 1981;318:479-500
14. Gettes LS, Reuter H: Slow recovery from inactivation ofinward currents in mammalian myocardial fibres. J Physiol(Lond) 1974;240:703-724
15. Rudy Y, Quan W: A model study of the effects of the discretecellular structure on electrical propagation in cardiac tissue.Circ Res 1987;61:815-823
16. Rudy Y, Quan W: The effects of the discrete cellular structureon propagation of excitation in cardiac tissue: A model study,in Sperelakis N, Cole W (eds): Cell Interactions and GapJunctions. Boca Raton, Fla, CRC Press, 1989, pp 123-142
17. Quan W, Rudy Y: Unidirectional block and reentry of cardiacexcitation: A model study. Circ Res 1990;66:367-382
18. Rush S, Larsen H: A particular algorithm for solving dynamicmembrane equations. IEEE Trans Biomed Eng 1978;25:389-392
19. Victorri B, Vinet A, Roberge FA, Drouhard JP: Numericalintegration in the reconstruction of cardiac action potentialsusing Hodgkin-Huxley-type models. Comput Biomed Res 1985;18:10-23
20. Moore JW, Ramon F: On numerical integration of theHodgkin and Huxley equations for a membrane action poten-tial. J Theor Biol 1974;45:249-273
21. Dennis JE, Gay DM, Welsch RE: An adaptive nonlinearleast-squares algorithm. ACM Trans Math Softw 1981;7:348-368
23. Nilius B: Calcium block of guinea-pig heart sodium channelswith and without modification by the piperazinylindole DPI201-106. J Physiol (Lond) 1988;399:537-558
24. Haas HG, Kern R, Einwachter HM, Tarr M: Kinetics of Nainactivation in frog atria. Pflugers Arch 1971;323:141-157
25. Ebihara L, Shigeto N, Liberman M, Johnson EA: The initialinward current in spherical clusters of chick embryonic heartcells. J Gen Physiol 1980;75:437-456
26. Shibasaki T: Conductance and kinetics of delayed rectifierpotassium channels in nodal cells of the rabbit heart. J Physiol(Lond) 1987;387:227-250
at Università degli Studi di Milano on March 21, 2013http://circres.ahajournals.org/Downloaded from
27. Matsuura H, Ehara T, Imoto Y: An analysis of the delayedoutward current in single ventricular cells of the guinea pig.Pftugers Arch 1987;410:596-603
28. Delmar M, Glass L, Michaels DC, Jalife J: Ionic basis andanalytical solution of the Wenckebach phenomenon in guineapig ventricular myocytes. Circ Res 1989;65:775-788
29. McDonald TF, Trautwein W: The potassium current underly-ing delayed rectification in cat ventricular muscle. J Physiol(Lond) 1978;274:217-246
30. Kurachi Y: Voltage-dependent activation of the inward-rectifier potassium channel in the ventricular cell membraneof guinea-pig heart. J Physiol (Lond) 1985;366:365 -385
31. Isenberg G, Klockner U: Calcium tolerant ventricular myo-cytes prepared by preincubation in a "KB medium."' PflugersArch 1982;395:6-18
32. Isenberg G: Cardiac Purkinje fibers: Cesium as a tool to blockinward rectifying potassium currents. Pflugers Arch 1976;365:99-106
33. Hirano Y, Hiraoka M: Changes in K' currents induced byBa2+ in guinea pig ventricular muscles. Am J Physiol 1986;251:H24-H33
34. Shah AK, Cohen IS, Datyner NB: Background K' current inisolated canine cardiac Purkinje myocytes. Biophvs J 1987;52:519-525
35. Hume JR, Uehara A: Ionic basis of the different actionpotential configurations of single guinea-pig atrial and ventric-ular myocytes. J Physiol (Lond) 1985;368:525 -544
36. Ebihara L, Shigeto N, Lieberman M, Johnson EA: A note onthe reactivation of the fast sodium current in spherical clustersof embryonic chick heart cells. Biophys J 1983;42:191-194
37. Hoff HE, Nahum LH: The supernormal period in the mam-
malian ventricle. Am J Physiol 1938;124:591-59538. Weidmann S: Effects of calcium ions and local anaesthetics on
electrical properties of Purkinje fibers. J Phvsiol (Lond) 1955;129:568-582
39. Spear JF, Moore EL: The effect of changes in rate and rhythmon supernormal excitability in the isolated Purkinje system ofthe dog. Circulation 1974;50:1144-1149
40. Guevara MR, Jeandupeux D, Alonso F, Morissette N: Wencke-bach rhythms in isolated ventricular heart cells, in Pnevmati-kos S, Bountis T, Pnevmatikos S (eds): Singular Behavior andNonlinear Dynamics. London, World Scientific, 1989. vol 2, pp629-642
41. Elharrar V, Surawicz B: Cycle length effect on restitution ofaction potential duration in dog cardiac fibers. Am J Physiol1983;244(Heart Circ Physiol 13):H782-H792
42. Robinson RB, Boyden PA, Hoffman BF, Hewett KW: Elec-trical restitution process in dispersed canine cardiac Purkinjeand ventricular cells. Am J Physiol 1987;253(Heart Circ Physiol22):H1018-H1025
43. Yue DT, Lawrence JH, Marban E: Two molecular transitionsinfluence cardiac sodium channel gating. Science 1989;244:349-352
44. Berman MF, Camardo JS, Robinson RB, Siegelbaum SA:Single sodium channels from canine ventricular myocytes:Voltage dependence and relative rates of activation andinactivation. J Physiol (Lond) 1989;415:503-531
45. Scanley BE, Hanck DA, Chay T, Fozzard HA: Kinetic analysisof single sodium channels form canine cardiac Purkinje cells.J Gen Physiol 1990;95:411- 437
46. Bodewei R, Hering S, Lemke B, Rosenshtraukh LV, Undrov-inas AI, Wollenberger A: Characterization of the fast sodiumcurrent in isolated rat myocardial cells: Simulation of theclamped membrane potential. J Physiol (Lond) 1982;325:301-315
47. Zilberter YI, Timin EN, Bendukidze ZA, Burnashev NA:Patch-voltage-clamp method for measuring fast inward cur-
rent in single rat heart muscle cells. Pflugers Arch 1982;394:150-155
48. Colatsky TJ: Voltage clamp measurements of sodium channelproperties in rabbit cardiac Purkinje fibres. J Physiol (Lond)1980:305:215-234
49. Patlak JB, Ortiz M: Slow currents through single sodiumchannels of the adult rat heart. J Gen Physiol 1985;86:89-104
50. Kunze DL, Lacerda AE, Wilson DL, Brown AM: Cardiac Nacurrents and the inactivating, reopening, and waiting proper-ties of single cardiac Na channel. J Gen Physiol 1985:86:691-719
51. Grant AO, Starmer CF: Mechanisms of closure of cardiacsodium channels in rabbit ventricular myocytes: Single-channel analysis. Circ Res 1987;60:897-913
52. Kiyosue T, Arita M: Late sodium current and its contributionto action potential configuration in guinea pig ventricularmyocytes. Circ Res 1989;64:389-397
53. Leblanc N, Hume JR: Sodium current-induced release ofcalcium from cardiac sarcoplasmic reticulum. Science 1990;248:372-376
54. Coraboeuf E, Deroubaix E, Coulombe A: Effects of tetrodo-toxin on action potentials of the conducting system in the dogheart. Am J Physiol 1979;236:H561-H567
55. Makielski JC, Sheets MF, Hanck DA, January CT, FozzardHA: Sodium current in voltage clamped internally perfusedcanine cardiac Purkinje cells. Biophys J 1987;52:1-11
56. Kirsch GE, Brown AM: Kinetic properties of single sodiumchannels in rat heart and rat brain. J Gen Phvsiol 1989;93:85-99
57. Chiu SY: Inactivation of sodium channels: Second orderkinetics in myelinated nerve. J Phvsiol (Lond) 1977.273:573-596
58. French RJ, Horn R: Sodium channel gating: Models, mimicsand modifiers. Annu Rev Biophys Bioeng 1983;12:319-356
59. Horn R, Vandenberg CA: Statistical properties of singlesodium channels. J Gen Phvsiol 1984;84:505-534
60. Kamp TJ, Sanguinetti MC, Miller RJ: Voltage- and use-dependent modulation of cardiac calcium channels by thedihydropyridine (+)-202-791. Circ Res 1989;64:338-351
61. Kakei M, Yoshinaga M, Saito K, Tanaka H: The potassiumcurrent activated by 2-nicotinamidoethyl nitrate (nicorandil)in single ventricular cells of guinea pigs. Proc R Soc Lond[Biol] 1986;229:331-343
62. lijima T, Taira N: Pinacidil increases the background potas-sium current in single ventricular cells. Eur J Pharmacol1987;141:139-141
63. Cleemann L, Morad M: Potassium currents in frog ventricularmuscle: Evidence from voltage clamp currents and extracellu-lar K accumulation. J Physiol (Lond) 1979;286:113-143
64. Drouhard JP, Roberge FA: Revised formulation of theHodgkin-Huxley representation of the sodium current incardiac cells. Comput Biomed Res 1987;20:333-350
65. Wenckebach KF: Zur Analyse des unregelmassingen Pulses:II. Uber den regelmassig intermittirenden Puls. Z F Klin Med1899;37:475-488
66. Jalife J, Moe GK: Excitation, conduction and reflection ofimpulses in isolated bovine and canine cardiac Purkinje fibers.Circ Res 1981;49:233-247
67. Guevara MR, Alonso F, Jeandupeux D, Van Ginneken ACG:Alternans in periodically stimulated isolated ventricular myo-cytes: Experiment and model, in Goldbeter A (ed): Cell to CellSignalling: From Experments to Theoretical Models. New York,Academic Press, Inc, 1989, pp 551-563
68. Frame L, Simson M: Oscillations of conduction, action poten-tial duration, and refractoriness. Circulation 1988;78:1277-1287
69. Adam DR, Smith JM, Akselrod S, Nyberg S, Powell AO,Cohen RJ: Fluctuations in T-wave morphology and suscepti-bility to ventricular fibrillation. J Electrocardiol 1984;17:209-218
70. Lesh MD, Pring M, Spear JF: Cellular uncoupling can unmaskdispersion of action potential duration in ventricular myocar-dium: A computer modeling studv. Circ Res 1989;65:1426-1440
KEY WORDS * cardiac action potential model * fast sodiumchannel * potassium channels * supernormality * Wenckebachperiodicity * chaotic activity
at Università degli Studi di Milano on March 21, 2013http://circres.ahajournals.org/Downloaded from