PittCon 2010 March 3 rd , (2000-7) A Modified QuEChERS Approach to the Isolation and Determination of Drugs in Food Products Joan Stevens, Ph.D., Sample Preparation Applications Chemist, Agilent Technologies
Transcript
PittCon 2010March 3rd, (2000-7)
A Modified QuEChERS Approach to the Isolation and Determination of Drugs in
Food Products
Joan Stevens, Ph.D., Sample Preparation Applications Chemist, Agilent Technologies
Introduction
QuEChERS What, when, why, and how Basic procedure Detection approaches
Advancements in QuEChERS Extractions areas of investigation research and procedure analysis and data
PittCon 2010March 3rd, (2000-7)
QuEChERS
Quick, Easy, Cheap, Effective, Robust and Safe
Developed by the US FDA and EU Food Regulatory Agencies
Procedure was validated in 2003, “toddler stage” Extraction and analysis of pesticides in food product
PittCon 2010March 3rd, (2000-7)
QuEChERS
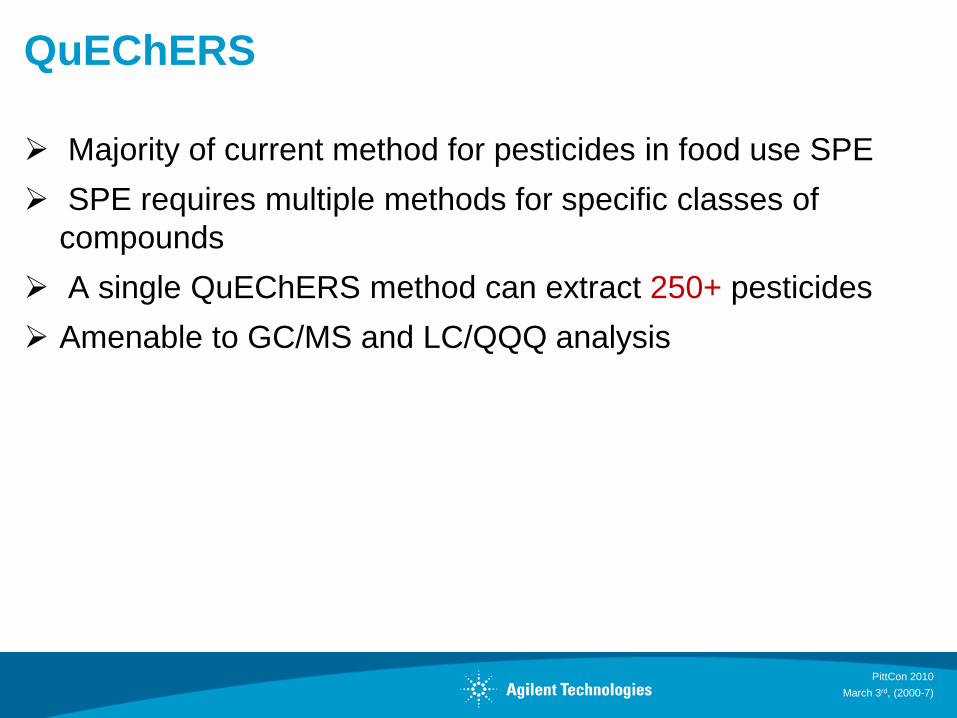
Majority of current method for pesticides in food use SPE SPE requires multiple methods for specific classes of
compounds A single QuEChERS method can extract 250+ pesticides Amenable to GC/MS and LC/QQQ analysis
PittCon 2010March 3rd, (2000-7)
Why is QuEChERS?• Reduced solvent, reduced labor, increased lab
productivity
Page 5
Standard SPE Methods QuEChERS Method
Sample Processing: 120 min. 30 min. 25% of the time
Solvent usage: 60-90 ml Solvent usage: 10-15 ml
Chlorinated Solvents: 20-30 ml Chlorinated Solvents: None
PittCon 2010
March 3rd, (2000-7)
First Step: QuEChERS Extraction
PittCon 2010March 3rd, (2000-7)
Second Step: Dispersive-SPE
PittCon 2010March 3rd, (2000-7)
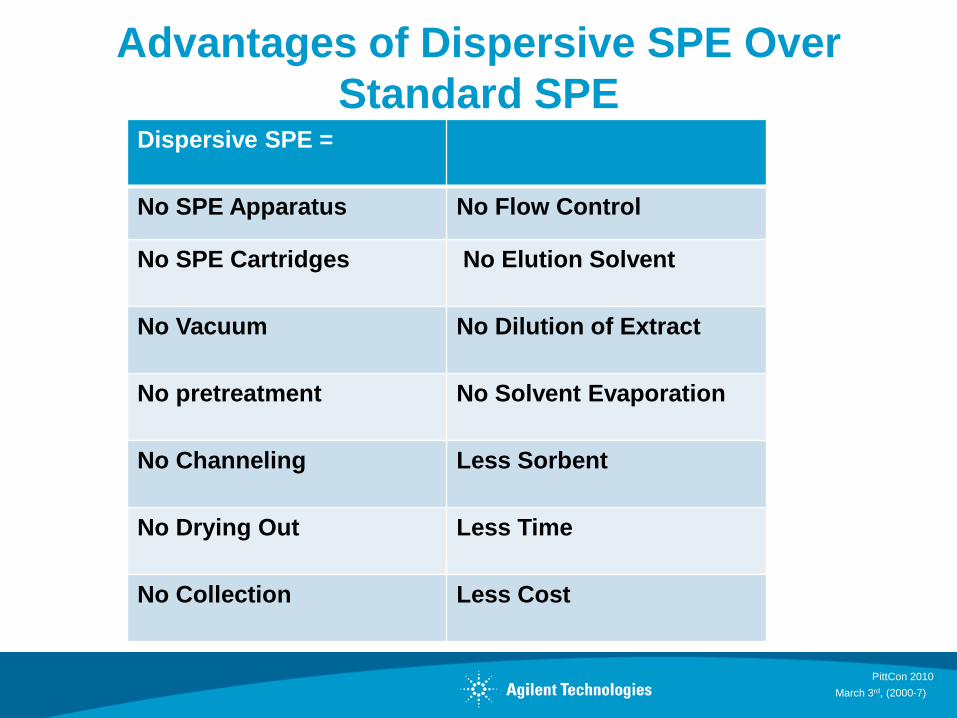
Advantages of Dispersive SPE Over Standard SPE
Dispersive SPE =
No SPE Apparatus No Flow Control
No SPE Cartridges No Elution Solvent
No Vacuum No Dilution of Extract
No pretreatment No Solvent Evaporation
No Channeling Less Sorbent
No Drying Out Less Time
No Collection Less Cost
PittCon 2010March 3rd, (2000-7)
Detection Methods
Past detection methods LC, GC possibly LC/MS Limited selectivity and sensitivity Required exhaustive sample preparation
Modern detection methods: LC/QQQ, GC/MS, GC/QQQ Exponential increase in selectivity and sensitivity Advancements in detector technology GC compound selective libraries Minimal sample preparation “JUST ENOUGH”
PittCon 2010March 3rd, (2000-7)
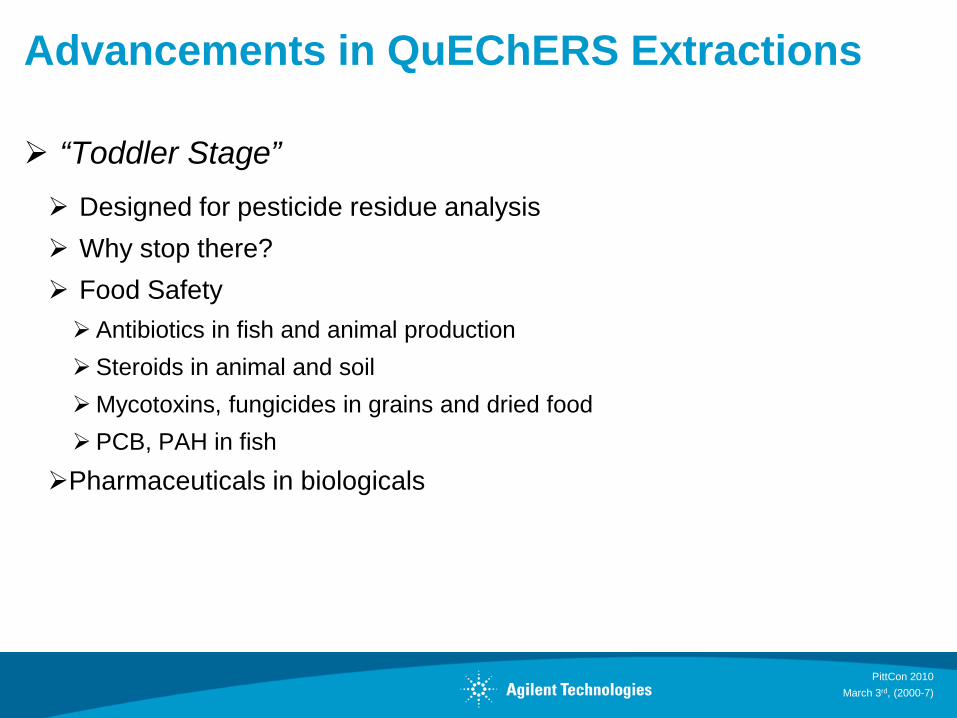
Advancements in QuEChERS Extractions
“Toddler Stage” Designed for pesticide residue analysis Why stop there? Food SafetyAntibiotics in fish and animal productionSteroids in animal and soilMycotoxins, fungicides in grains and dried foodPCB, PAH in fish
Pharmaceuticals in biologicals
PittCon 2010March 3rd, (2000-7)
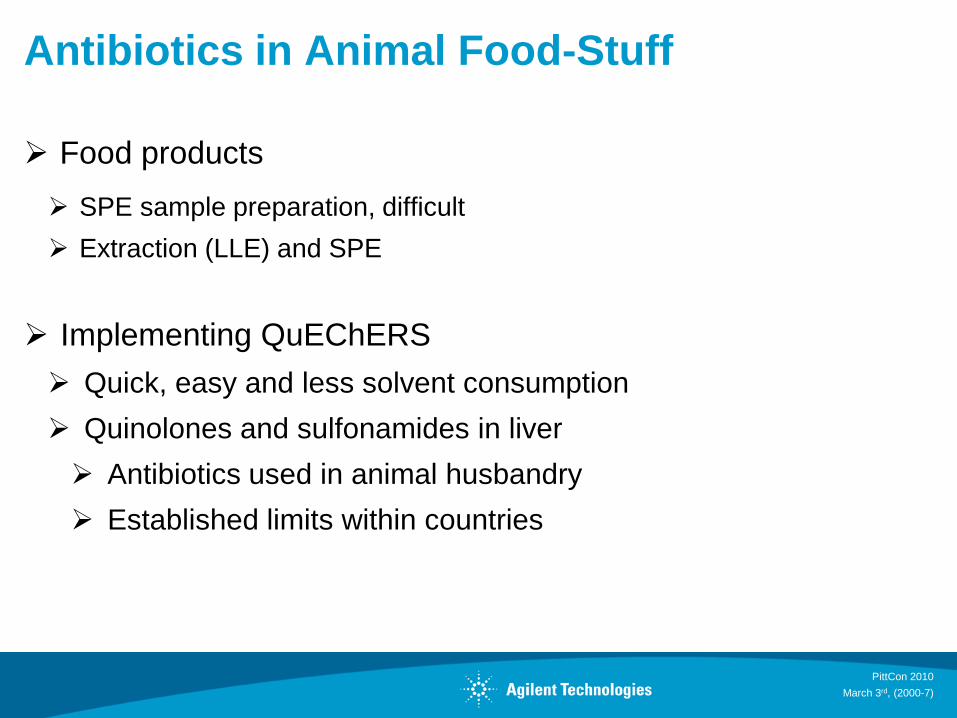
Antibiotics in Animal Food-Stuff
Food products SPE sample preparation, difficult Extraction (LLE) and SPE
Implementing QuEChERS Quick, easy and less solvent consumption Quinolones and sulfonamides in liver Antibiotics used in animal husbandry Established limits within countries
PittCon 2010March 3rd, (2000-7)
Weigh 2 g homogenized liver sample ( 0.05 g) in 50 mL centrifuge tube
Spike 50 µL of IS spike solution, 50 µL of QC spike solution if necessary, vortex 30 sec
Centrifuge @ 4000rpm for 5 min at 4 C
Transfer 1 mL of ACN layer to SampliQ QuEChERS dispersive-SPE 2 mL tube, drug residues in meat
Vortex 1 min, centrifuge @ 13000rpm for 3 min with micro-centrifuge
Add 10 mL of 5% FA in ACN, and shake vigorously for 30 sec
Add SampliQ EN QuEChERS extraction kit, and shake vigorously for 1 min
Transfer 800 µL extract to another tube, blow down @ 40 C with N2
Sample are ready for LC/MS/MS analysis
Add 8 mL of 30 mM KH2PO4, pH 7.0, vortex.
Reconstitute into 800 µL 1:9 MeOH/H2O w/ 0.1% FA, vortex and sonicate 10 min
Figure 1. Flow chart of QuEChERS procedure for the determination of quinolones in bovine liver
PittCon 2010March 3rd, (2000-7)
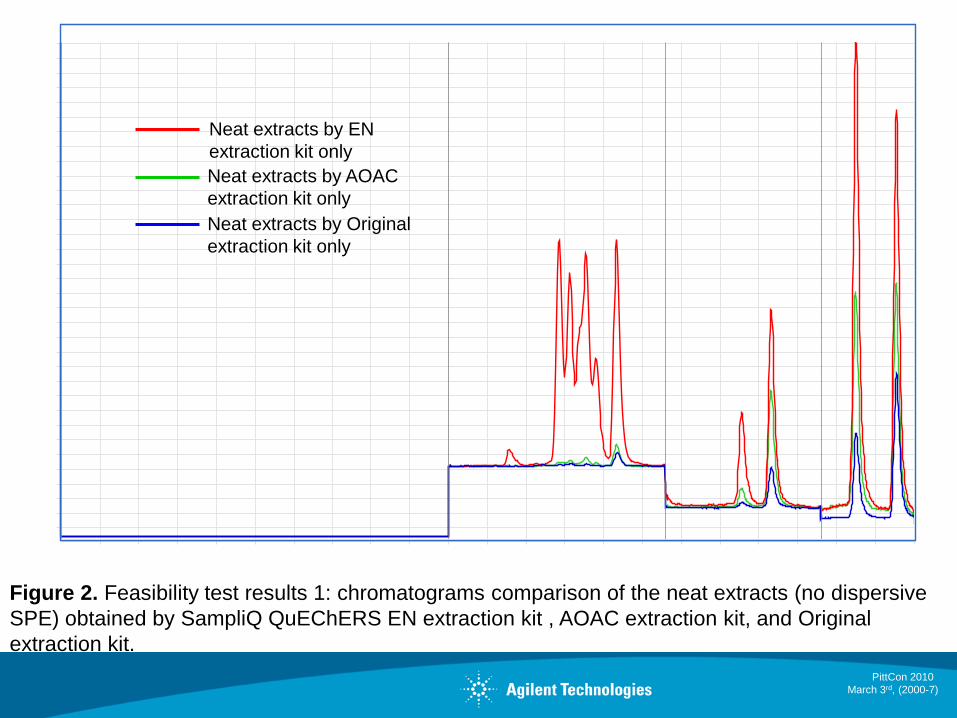
Neat extracts by EN extraction kit onlyNeat extracts by AOACextraction kit onlyNeat extracts by Originalextraction kit only
Figure 2. Feasibility test results 1: chromatograms comparison of the neat extracts (no dispersive SPE) obtained by SampliQ QuEChERS EN extraction kit , AOAC extraction kit, and Original extraction kit.
PittCon 2010March 3rd, (2000-7)
Figure 3. Feasibility test 2. Analytes peak area comparison for the neat extract processed by different Procedures. Comparisons include pure ACN and acidified ACN, with and without PSA dispersive SPE.
0
5000
10000
15000
20000
25000
30000 A) 5% FA ACN, No Dispersive SPEB) 5% FA ACN, C18 Dispersive SPEC) 5% FA ACN, C18 + PSA Dispersive SPED) ACN, No dispersiveE) ACN, C18 + PSA Dispersive SPE