Date post: | 20-Aug-2015 |
Category: |
Technology |
Upload: | salford-systems |
View: | 943 times |
Download: | 1 times |
Copyright © 2004-2012, Abbott Analytics, Inc. and Seer Analytics, Inc. All rights reserved.
1
Abbott - A More Transparent Interpretation of Health Club Surveys
Dean AbbottAbbott Analytics, Inc.
URL: http://www.abbottanalytics.comBlog: http://abbottanalytics.blogspot.comTwitter: @deanabb
Salford Analytics and Data Mining Conference 2012
San Diego, CAMay 24, 2012
Copyright © 2004-2012, Abbott Analytics, Inc. and Seer Analytics, Inc. All rights reserved.
2
About Seer Analytics
Seer Analytics, LLC– Founded in 2001, based in Tampa, FL– Produce actionable intelligence to help clients
make smarter decision and drive business performance.
– Reports embed sophisticated analytics yet are designed to be accessible and meaningful to a non-technical audience.
Bill Lazarus, Founder, President and CEO– BA from University of Wisconsin– MA from University of Toronto, – SM and PhD from Massachusetts Institute of
Technology.
Copyright © 2004-2012, Abbott Analytics, Inc. and Seer Analytics, Inc. All rights reserved.
3
About Abbott Analytics
Abbott Analytics– Founded in 1999, based in San Diego, CA– Dedicated to data mining consulting and training
Principal: Dean Abbott– Applied Data Mining for 22+ years in
Direct Marketing, CRM, Survey Analysis, Tax Compliance, Fraud Detection, Predictive Toxicology, Biological Risk Assessment
– Course Instruction Public 1-, 2-, and 3-day Data Mining Courses Conference Tutorials and Workshops (next: ACM Data Mining
Bootcamp, November 13th in San Francisco)– Customized Training and Knowledge Transfer
Data mining methodology (CRISP-DM) Training services for software products, including CART,
Clementine, Affinium Model, Insightful Miner
Copyright © 2004-2012, Abbott Analytics, Inc. and Seer Analytics, Inc. All rights reserved.
4
Talk Outline
Health Club Survey Analysis Problem Description– Overview of Survey Analysis and
Approaches Solution 1: traditional approach
– Statistical approach, fancy visualization Solution 2: solution aligning models to
business objectives Results and conclusions
Copyright © 2004-2012, Abbott Analytics, Inc. and Seer Analytics, Inc. All rights reserved.
5
Problem Setup: Member Survey
Question:– What are the characteristics of members who
indicated the highest overall satisfaction with their Y?
Data:– 32,811 records containing survey answers
– No demographic data except what was on survey (marital status, children, age, gender)
Approach:– Create supervised learning models with target
variable “overall_satisfaction = 1”
Copyright © 2004-2012, Abbott Analytics, Inc. and Seer Analytics, Inc. All rights reserved.
6
Some Notes
It is very unusual to have so many records– The 31K responses were for one year– Responses are collected from across the
country Seer tracks survey responses
longitudinally as well (not discussed in this talk)– Began collecting survey responses and
storing in a database in 2001 => 10 years of data
– Seer has moved beyond modeling satisfaction to include a more complete view of the YMCA member experience
Copyright © 2004-2012, Abbott Analytics, Inc. and Seer Analytics, Inc. All rights reserved.
7
Data Preparation
Begin with 57 candidate inputs to model– All survey questions are multiple choice
Treated as categories, not numbers Typically 6 categories per question (1-5) Unknown initially coded as “0”
– No text comments fields included as inputs to model
Create new column for target variable– If overall_satisfaction = 1, variable value = 1,
otherwise, variable value = 0 Data very clean with respect to NULLs
8
Member Survey Question Categories
Copyright © 2004-2012, Abbott Analytics, Inc. and Seer Analytics, Inc. All rights reserved.
Microsoft Excel Worksheet
Copyright © 2004-2012, Abbott Analytics, Inc. and Seer Analytics, Inc. All rights reserved.
9
Sampling and Target Populations
Begin with 32,811 responses Set aside about half for validation (not used during
modeling): 16,379 records– These records will be used to provide final summaries of
the segments Q1 - Satisfaction = 1: 31%
– 86% have Recommend to friends = 1 Q48 - Recommend to Friend = 1: 54%
– 49% have Overall Satisfaction = 1– 26.0% have both overall satisfaction and recommend to
friends both equal to 1 Q32 - Likelihood to Renew = 1: 46% Implications
– All three are interesting, but Recommend is so high already, not much room for growth
Copyright © 2004-2012, Abbott Analytics, Inc. and Seer Analytics, Inc. All rights reserved.
10
Objective and Data Challenges
Project Objective– Interpret results of survey for YMCA
Challenges– Missing data (some questions either N/A or blank)
Solution: Impute values that least effect information communicated by question (not a mean or median!)
– Question responses highly correlated with one another
Multi-collinearity and interpretation of results problematic
Must reduce dimensionality without losing interpretation of results
Solution: Factor analysis
Copyright © 2004-2012, Abbott Analytics, Inc. and Seer Analytics, Inc. All rights reserved.
11
Objective and Data Challenges
Challenges, cont’d– Target variable
Three questions pointed to the important actionable information (related to how satisfied members were)
No one question fully characterized the value of a member
Solution: combine all three into a new “index of excellence” (IOE)
– IOE = additive weighted sum of Q1, Q32, Q48
– Reverse scale so higher IOE is better
Copyright © 2004-2012, Abbott Analytics, Inc. and Seer Analytics, Inc. All rights reserved.
12
Why Factor Analysis?
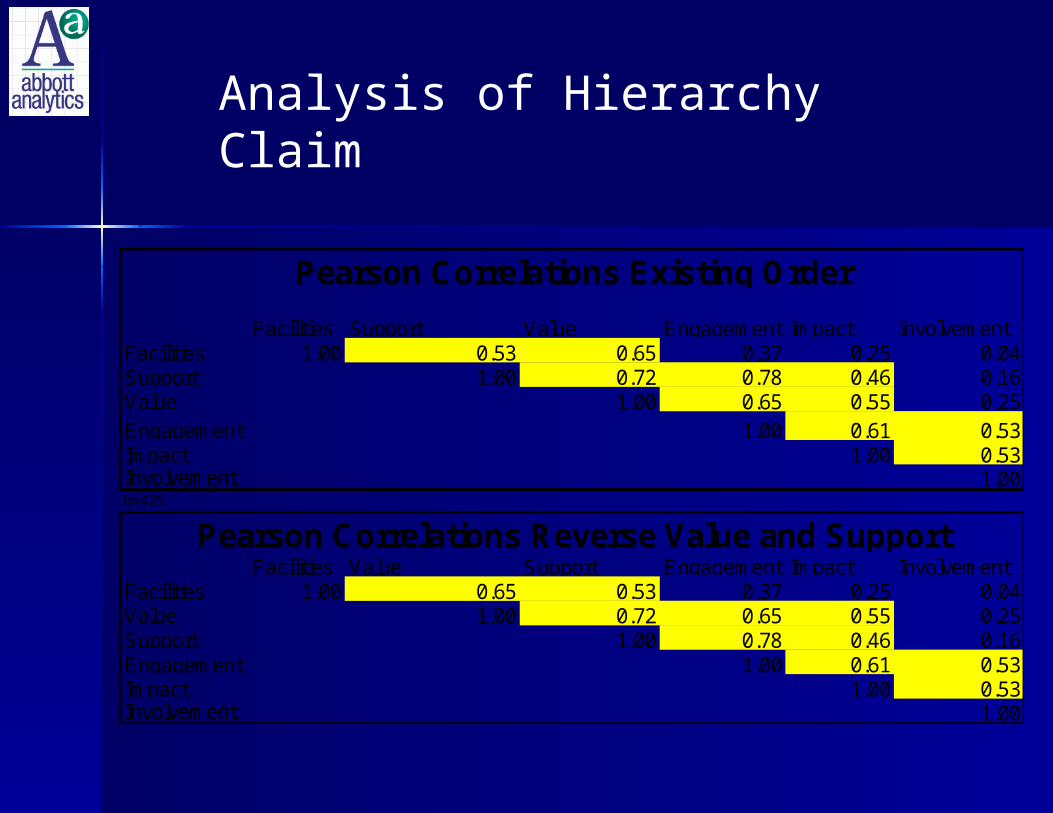
“Traditional approach to survey analysis involves the use of frequency counts, t-test, correlation, and measures of central tendency. “
“Factor analysis is a variable-reduction statistical technique capable of probing underlying relationships in variables”– Santos, J.R.A., Clegg, M.D. (1999), "Factor
analysis adds new dimension to extension surveys", Journal of Extension, http://www.joe.org/joe/1999october/rb6.php
Our use of Factor Analysis– Traditional view: there is an underlying “truth” that
exist, and the survey is a redundant measure of that truth.
– Just a derived variable that reduces dimensionality
Copyright © 2004-2012, Abbott Analytics, Inc. and Seer Analytics, Inc. All rights reserved.
13
Factor Analysis: Key Factors
Factor 1
0.00
0.20
0.40
0.60
0.80
1.00
Q2 Q3 Q4 Q5 Q6 Q7 Q8 Q9 Q10 Q11 Q12
Top Question Loadings
Lo
ad
ing
Va
lue
Factor 2
0.00
0.20
0.40
0.60
0.80
Q12 Q13 Q14 Q15 Q16 Q17 Q18 Q19 Q20 Q23
Top Question Loadings
Lo
ad
ing
Va
lue
s
Copyright © 2004-2012, Abbott Analytics, Inc. and Seer Analytics, Inc. All rights reserved.
14
Member Survey Factor Analysis Loadings
15
Reduce Variables using Regression
Already beginning with only 13 variables
Question: how many of these are useful predictors?
Decided to retain 5 factors for final model
Regression Rankings of Questions/Factors
0
0.1
0.2
0.3
0.4
0.5
0.6
Q44 Q22 Q25
facto
r3.2
facto
r3.9
facto
r3.1
facto
r3.4
facto
r3.3
facto
r3.8
facto
r3.1
0
facto
r3.6
facto
r3.5
facto
r3.7
Question/Factor
Reg
ress
ion
Co
effi
cien
t
Copyright © 2004-2012, Abbott Analytics, Inc. and Seer Analytics, Inc. All rights reserved.
16
Predictive Modeling Approach
Identify Key Questions
Factor Analysis: 10 factors
Regression Model: Find Significant
Variables
Regression Model: Find Significant
Variables
3 questions with high association with target
10 factors, or variables that loaded highest on each factor
13 fields down to 7
Variable ranks
50+
Sur
vey
Que
stio
ns
3 key questions
Copyright © 2004-2012, Abbott Analytics, Inc. and Seer Analytics, Inc. All rights reserved.
17
One Further Note on Final Regression Models
Empirical comparison: Factors as inputs vs. Top-loading question in factor as input
– Top-loading or most interesting question on factor as representative of that factor produced slightly better models
– Use of top-loading question makes final model more easily understood
– This flies in the face of traditional theory, but worked better operationally
Final regression model contained these fields:
18
Key: Explaining Results
Visualization shows key variables in survey associated with “excellence”, and performance metrics for each Y
– How well did this Y do?
– What is the change over last year’s result?
– This is a 45-dimensional visualization (don’t ask me to name them all!)
Shows which attributes does the Y need to improve to improve customer satisfaction.
Copyright © 2004-2012, Abbott Analytics, Inc. and Seer Analytics, Inc. All rights reserved.
relationships
facility
equipment
Staff 2Staff 1
goals
value
Drivers ofSatisfaction
Current Year vs. Last Year
Prior year
Copyright © 2004-2012, Abbott Analytics, Inc. and Seer Analytics, Inc. All rights reserved.
19
Interpreting Index/Drivers of Excellence Analysis
All factors listed are important
Position on ‘x’ axis indicates relative importance
of factors in driving IOE
Above the line = “better than peers”; below the
line = “worse than peers”
Small dot indicates position last year
R-Y-G indicates magnitude of change from
previous year
Size of bubble indicates magnitude of score on
factor
Copyright © 2004-2012, Abbott Analytics, Inc. and Seer Analytics, Inc. All rights reserved.
20
Peer Average
drivers of excellence
May 2003
Gardena YMCA
© 2003 Seer Analytics, LLCTampa, FL 33602
Same
Importance
Rela
tive P
erform
ance
Worse
Better
2002
2003 vs.2002Staff cares
Staff competence
Equipment
Value
Facilities
Meet fitness goals
Feel welcome
Peer Average
drivers of excellence
May 2003
Gardena YMCA
© 2003 Seer Analytics, LLCTampa, FL 33602
Same
Importance
Rela
tive P
erform
ance
Worse
Better
2002
2003 vs.2002Staff cares
Staff competence
Equipment
Value
Facilities
Meet fitness goals
Feel welcome
drivers of excellence
May 2003
Gardena YMCA
© 2003 Seer Analytics, LLCTampa, FL 33602
Same
Importance
Rela
tive P
erform
ance
Worse
Better
2002
2003 vs.2002Staff cares
Staff competence
Equipment
Value
Facilities
Meet fitness goals
Feel welcome
Prior year
Copyright © 2004-2012, Abbott Analytics, Inc. and Seer Analytics, Inc. All rights reserved.
21
Feel welcome
Meet fitness goals
Facilities
Value
Equipment
Staff competence
Staff caresdrivers of excellence
May 2003
Montebello YMCA
© 2003 Seer Analytics, LLCTampa, FL 33602
Same
Importance
Rel
ativ
e Per
form
ance
Worse
Better
2002
2003 vs.2002
Peer Average
Feel welcome
Meet fitness goals
Facilities
Value
Equipment
Staff competence
Staff caresdrivers of excellence
May 2003
Montebello YMCA
© 2003 Seer Analytics, LLCTampa, FL 33602
Same
Importance
Rel
ativ
e Per
form
ance
Worse
Better
2002
2003 vs.2002
Peer Average
Prior year
Copyright © 2004-2012, Abbott Analytics, Inc. and Seer Analytics, Inc. All rights reserved.
22
drivers of excellence
May 2003
Torrance South YMCA
© 2003 Seer Analytics, LLCTampa, FL 33602
Same
Importance
Rel
ative
Per
form
ance
Worse
Better
2002
2003 vs.2002
Peer Average
Staff caresStaff competence
Equipment
Value
Facilities
Meet fitness goals
Feel welcome
Prior year
Copyright © 2004-2012, Abbott Analytics, Inc. and Seer Analytics, Inc. All rights reserved.
23
I love this visualization!
Staff cares
Staff competence
Equipment
Value Facilities
Meet fitness goals
Feel welcome
drivers of excellence
May 2003
Culver YMCA
© 2003 Seer Analytics, LLCTampa, FL 33602
Same
Importance
Rel
ativ
e Per
form
ance
Worse
Better
2002
2003 vs.2002
Peer Average
Staff cares
Staff competence
Equipment
Value Facilities
Meet fitness goals
Feel welcome
drivers of excellence
May 2003
Culver YMCA
© 2003 Seer Analytics, LLCTampa, FL 33602
Same
Importance
Rel
ativ
e Per
form
ance
Worse
Better
2002
2003 vs.2002
Peer Average
Prior year
Copyright © 2004-2012, Abbott Analytics, Inc. and Seer Analytics, Inc. All rights reserved.
24
What’s the Problem with That?
Customer was not interested in “techno” solutions
Customer was interested in what actions could be taken as a result of the data mining models– Which characteristics are most correlated with
best customers? What do they like and dislike about the Y? Is it equipment? relationships? facility? staff?
– Show key contributors, how each Y compared with other Y locations, and if Y is improving
Copyright © 2004-2012, Abbott Analytics, Inc. and Seer Analytics, Inc. All rights reserved.
25
So What’s The Problem with That? (cont’d)
Regression, Neural Networks are “global” estimators– The operate over the entire data space– Descriptors of Regression represent average
influence– Neither technique provides explicit localized
characteristics Customer would like actionable analytics
– Clear characteristics of subgroups – Different strategies for subgroups
Conclusion: In Round 2, use another approach
Copyright © 2004-2012, Abbott Analytics, Inc. and Seer Analytics, Inc. All rights reserved.
26
Who cares about “satisfaction”?
Issue: The YMCA is a cause-driven charity It’s not about running “satisfactory” gyms It’s about improving lives and building communities
Question: How can the member survey data help Ys achieve mission goals?
Answer: Develop a tool that is: Grounded in solid social science Accessible/understandable Diagnostic/predictive A driver of performance and change
Copyright © 2004-2012, Abbott Analytics, Inc. and Seer Analytics, Inc. All rights reserved.
27
Satisfaction Model Performance
0
20
40
60
80
100
0 20 40 60 80 100
% C
lass
% Population
0
20
40
60
80
100
Copyright © 2004-2012, Abbott Analytics, Inc. and Seer Analytics, Inc. All rights reserved.
28
Satisfaction Model from CART®
Q31
Q34 $
Q36
Q19
Q13
Q22
Q13
Q31
Q6
Q36
Q31
Q2
Q13
Q25
1
2
3
9
10
15
8
• Q25: Feel Welcome– Surrogate: Q24 (can relate to other
members)– Q13: Facilities are clean
– Surrogate: Q14 (Facilities safe and secure)
• Q22: Value for Money– Surrogates: Q21 (convenient
schedule) and Q23 (quality classes/programs)
– Q6: Staff Competent– Surrogates: Q5 (friendly staff) and
Q7 (enough staff)
Copyright © 2004-2012, Abbott Analytics, Inc. and Seer Analytics, Inc. All rights reserved.
29
Member Satisfaction Model: Key Rules
Terminal Node 1
• 10,014 surveys (20.8%),
• 7,289 highly satisfied (72.8%),
• 49% of all highly satisfied
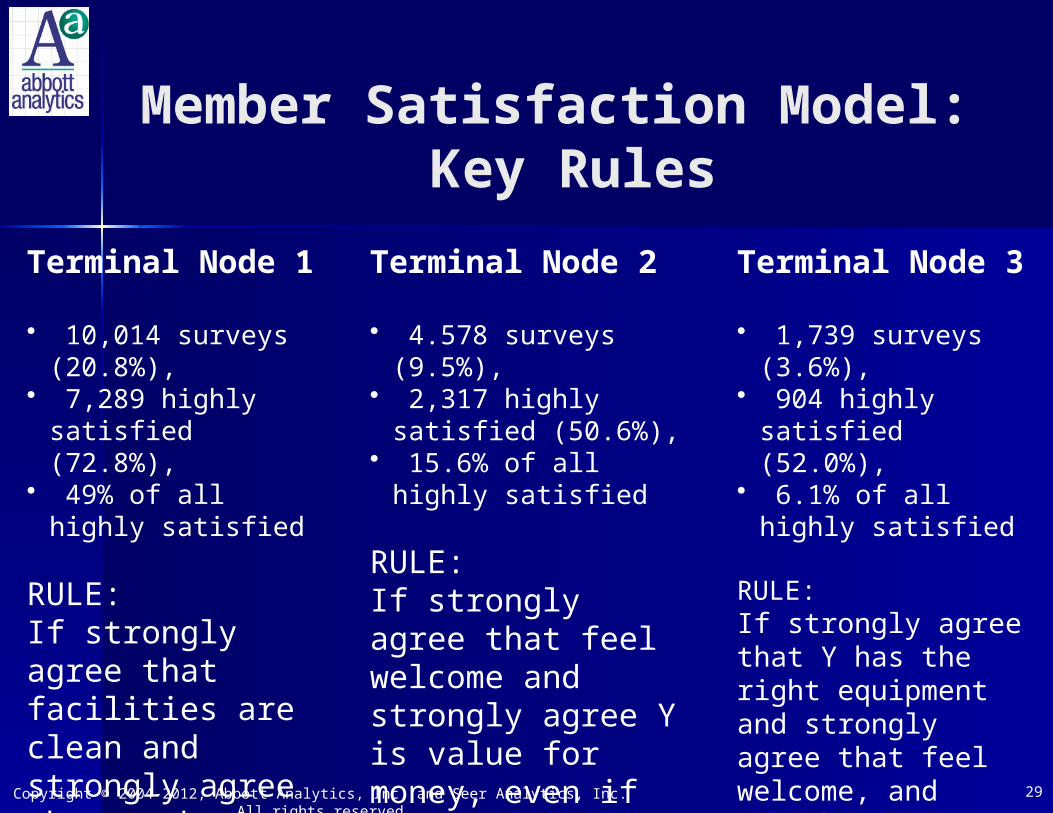
RULE:If strongly agree that facilities are clean and strongly agree that member feels welcome, then highly satisfied
Terminal Node 2
• 4.578 surveys (9.5%),
• 2,317 highly satisfied (50.6%),
• 15.6% of all highly satisfied
RULE:If strongly agree that feel welcome and strongly agree Y is value for money, even if don’t strongly agree facilities are clean, then highly satisfied
Terminal Node 3 • 1,739 surveys
(3.6%), • 904 highly
satisfied (52.0%),• 6.1% of all highly
satisfied
RULE:If strongly agree that Y has the right equipment and strongly agree that feel welcome, and somewhat agree that facilities are clean, even though don’t strongly feel Y is good value for the money, then highly satisfied
Copyright © 2004-2012, Abbott Analytics, Inc. and Seer Analytics, Inc. All rights reserved.
30
Member Satisfaction Model: Other Rules
Terminal Node 10
• 998 surveys (2.1%), • 431 highly satisfied
(43.2%),• 2.9% of all highly
satisfied
RULE: weakest of top 5If strongly agree that loyal to Y and strongly agree that facilities are clean, even though don’t strongly agree that feel welcome nor strongly agree that staff is competent, then highly satisfied
Terminal Node 9
• 1,739 surveys (3.6%), • 904 highly satisfied
(52.0%),• 6.1% of all highly
satisfied
RULEIf strongly agree that facilities are clean, and strongly agree that staff is competent, even if don’t strongly agree feel welcome, then highly satisfied
Copyright © 2004-2012, Abbott Analytics, Inc. and Seer Analytics, Inc. All rights reserved.
31
Member Satisfaction Model: Unsatisfied Rules
Terminal Node 15
• 19,323 surveys (40.2%), • 1,231 highly satisfied
(6.4%),• 8.3% of highly satisfied• 58.2% of all not highly
satisfied
RULE:If don’t strongly agree that staff is efficient and don’t strongly agree that feel welcome, and don’t strongly agree that the facilities are clean, then member isn’t highly satisfied
Terminal Node 8 • 1,364 surveys (2.8%), • 141 highly satisfied
(10.3%),• 1.0% of all highly satisfied
RULEIf don’t strongly agree that facilities are clean and don’t strongly agree that the Y is good value for the money, even though strongly agree that feel welcome, member isn’t highly satisfied.
32
Recommend to Friend Model from CART®
Q31: Loyal– Surrogates: Q25,
Q44, Q22, Q24 (can relate to other members)
Q25: Feel Welcome– Surrogates: Q24, Q5
(friendly staff) Q22: Value for
Money– Surrogates: Q23
(quality classes/programs)
Q44: Helps meet fitness goals
Copyright © 2004-2012, Abbott Analytics, Inc. and Seer Analytics, Inc. All rights reserved.
1
2 4
7
5
Q22
Q25
Q44
Q25
Q22
Q31
Copyright © 2004-2012, Abbott Analytics, Inc. and Seer Analytics, Inc. All rights reserved.
33
Recommend to Friend Model: Key Rules
Terminal Node 1
• 13,678 surveys (28.5%),
• 12,122 recommend (88.6%),
• 47.0% of all strong recommends
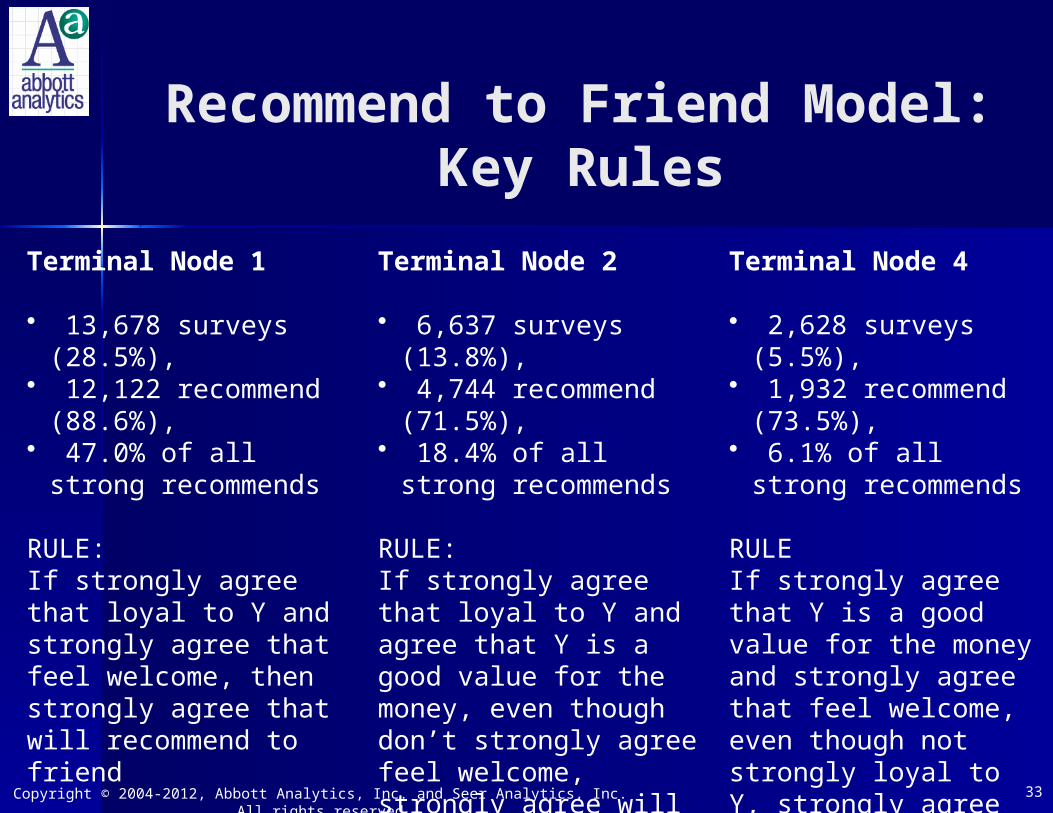
RULE: If strongly agree that loyal to Y and strongly agree that feel welcome, then strongly agree that will recommend to friend
Terminal Node 2
• 6,637 surveys (13.8%),
• 4,744 recommend (71.5%),
• 18.4% of all strong recommends
RULE:If strongly agree that loyal to Y and agree that Y is a good value for the money, even though don’t strongly agree feel welcome, strongly agree will recommend to friend.
Terminal Node 4
• 2,628 surveys (5.5%),
• 1,932 recommend (73.5%),
• 6.1% of all strong recommends
RULEIf strongly agree that Y is a good value for the money and strongly agree that feel welcome, even though not strongly loyal to Y, strongly agree will recommend to friend
Copyright © 2004-2012, Abbott Analytics, Inc. and Seer Analytics, Inc. All rights reserved.
34
Recommend to Friend Model:
Other Rules
Terminal Node 7
• 21,865 surveys (45.5%), • 5,461 highly recommend
(25.0%),• 21.2% of all highly
recommend
RULE:If don’t strongly agree that loyal to Y and don’t strongly agree that Y is value for the money, then will not highly recommend to a friend
Terminal Node 5
• 814 surveys (1.7%), • 509 highly recommend
(62.5%),• 2.0% of all highly
recommend
RULEIf strongly agree that Y is good value for the money, and strongly agree that Y helps meet fitness goals, even though not strongly loyal to the Y and don’t strongly feel welcome, will highly recommend to a friend
Copyright © 2004-2012, Abbott Analytics, Inc. and Seer Analytics, Inc. All rights reserved.
35
Intend to Renew Model from CART®
Q47
Q22
Q44
Q27
Q22
Q44
Q25
• Q25: Feel Welcome– Surrogate: Q24 (can relate to other
members)– Q44: Helps meet fitness goals
– Surrogate: Q51 (visit frequency)• Q22: Value for Money
– Left split Surrogates: Q21 (convenient schedule) and Q23 (quality classes/programs)
– Right split surrogates: Q25 (feel welcome=2 or 3)
– Q47: Would be donor– Surrogate: Q45A (have been donor)
– Q27: Feel sense of belonging– Surrogates: Q25, Q24
1
2
3 5
8
7
Copyright © 2004-2012, Abbott Analytics, Inc. and Seer Analytics, Inc. All rights reserved.
36
Intend to Renew Model: Key Rules
Terminal Node 1
• 13,397 surveys (27.9%),
• 9,903 renew (73.9%),
• 48.4% of all intend to renew
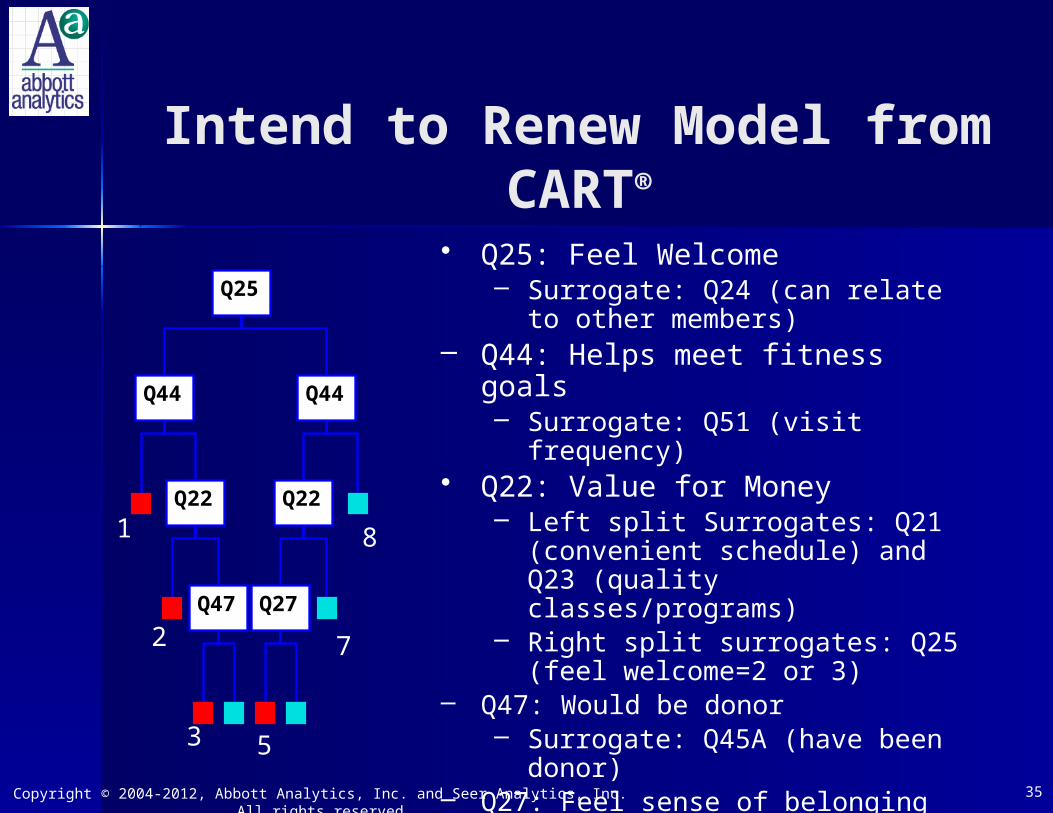
RULE:If strongly agree that feel welcome and strongly agree that Y helps meet fitness goals, then strongly agree that intend to renew
Terminal Node 2
• 3,051 surveys (6.3%),
• 1,823 renew (59.8%),
• 8.9% of all intend to renew
RULE:If strongly agree Y is good value for the money and strongly agree that feel welcome, even if don’t strongly agree that Y helps meet fitness goals, then strongly agree that intend to renew
Terminal Node 5
• 5,704 surveys (11.9%),
• 3,201 recommend (56.1%),
• 15.6% of all intend to renew
RULEIf strongly agree that feel sense of belonging, and agree that Y is value for the money, and strongly agree that Y helps meet fitness goals, even if don’t feel welcome, then strongly agree intend to renew.
Copyright © 2004-2012, Abbott Analytics, Inc. and Seer Analytics, Inc. All rights reserved.
37
Intend to Renew Model: Other Rules
Terminal Node 8
18,547 surveys (38.6%), • 3,130 strongly intend to
renew (16.9%),• 15.3% of all strongly intend
to renew
RULE:If don’t strongly agree that feel welcome and don’t strongly agree that Y helps meet fitness goals, then don’t strongly agree that intend to renew
Terminal Node 7
2,178 surveys (4.5%), • 578 strongly intend to
renew (26.5%),• 2.8% of all strongly intend
to renew
RULEIf don’t strongly agree that Y is good value for money and don’t strongly agree that feel welcome, even if strongly agree Y helps meet fitness goals, don’t strongly agree that intend to renew.
38
Summary of Key Questions in Models
Feel Welcome was root splitter (or surrogate) for each model
Satisfaction is different than Recommend and Renew in other respects– Helps meet fitness goals was in Recommend
and Renew models, but not satisfaction– Facilities clean only in satisfaction model
Copyright © 2004-2012, Abbott Analytics, Inc. and Seer Analytics, Inc. All rights reserved.
3
Copyright © 2004-2012, Abbott Analytics, Inc. and Seer Analytics, Inc. All rights reserved.
39
Key Differences Between Targets, Put Another Way
Satisfaction– Feel Welcome– Clean Facility
Renewal– Feel Welcome– Y Helps Meet Fitness Goals, Value for $$
Recommend to Friend– Feel Welcome– Loyal to Y, Value for $$
Copyright © 2004-2012, Abbott Analytics, Inc. and Seer Analytics, Inc. All rights reserved.
40
Top Terminal Nodes Comprise More than 70% of
Hits
41
Subsequent Results
Rules from Models are still in use today Trees and Factors can help reduce #
questions in survey– Employee ruleset (using same methodology)
resulted in a new “short-form” survey using only questions in the splits
– Not yet implemented in Member survey
Measure 2002 2009Percent
Improvement
Satisfaction 31% 41% 32%
Recommend to Friend 54% 57% 6%
Copyright © 2004-2012, Abbott Analytics, Inc. and Seer Analytics, Inc. All rights reserved.
Index Construction and Scaling
Begin with Factor Analysis
Cluster attribute groupings to be managerially meaningful
Z-normalize the variables, cast all in units of variance
Run tests for deviation from Standard Normal by variable and
factor
Create z-index for each factor
Re-scale to nation-wide percentile
Analysis of Hierarchy Claim
Facilities Support Value Engagement Impact InvolvementFacilities 1.00 0.53 0.65 0.37 0.25 0.04Support 1.00 0.72 0.78 0.46 0.16Value 1.00 0.65 0.55 0.25Engagement 1.00 0.61 0.53Impact 1.00 0.53Involvement 1.00n=425
Pearson Correlations Existing Order
Facilities Value Support Engagement Impact InvolvementFacilities 1.00 0.65 0.53 0.37 0.25 0.04Value 1.00 0.72 0.65 0.55 0.25Support 1.00 0.78 0.46 0.16Engagement 1.00 0.61 0.53Impact 1.00 0.53Involvement 1.00
Pearson Correlations Reverse Value and Support
Copyright © 2004-2012, Abbott Analytics, Inc. and Seer Analytics, Inc. All rights reserved.
44
Summary from “Power of Habit”
In 2000, for instance, two statisticians were hired by the YMCA—one of the nation’s largest nonprofit organizations—to use the powers of data-driven fortune-telling to make the world a healthier place. The YMCA has more than 2,600 branches in the United States, most of them gyms and community centers. About a decade ago, the organization’s leaders began worrying about how to stay competitive. They asked a social scientist and a mathematician—Bill Lazarus and Dean Abbott—for help.
The two men gathered data from more than 150,000 YMCA member satisfaction surveys that had been collected over the years and started looking for patterns. At that point, the accepted wisdom among YMCA executives was that people wanted fancy exercise equipment and sparkling, modern facilities. The YMCA had spent millions of dollars .
Copyright © 2004-2012, Abbott Analytics, Inc. and Seer Analytics, Inc. All rights reserved.
45
Summary from “Power of Habit”: YMCA Satisfaction
Retention, the data said, was driven by emotional factors, such as whether employees knew members’ names or said hello when they walked in. People, it turns out, often go to the gym looking for a human connection, not a treadmill. If a member made a friend at the YMCA, they were much more likely to show up for workout sessions. In other words, people who join the YMCA have certain social habits. If the YMCA satisfied them, members were happy. So if the YMCA wanted to encourage people to exercise, it needed to take advantage of patterns that already existed, and teach employees to remember visitors’ names. It’s a variation of the lesson learned by Target and radio DJs: to sell a new habit—in this case exercise—wrap it in something that people already know and like, such as the instinct to go places where it’s easy to make friends.
“We’re cracking the code on how to keep people at the gym,” Lazarus told me. “People want to visit places that satisfy their
Copyright © 2004-2012, Abbott Analytics, Inc. and Seer Analytics, Inc. All rights reserved.
46
Conclusions
The “best” solutions are not always “good” solutions– There is often more than one way to approach a
solution– It is often unclear even to the end customer what
solution is best until the solution exists on paper Interactions are the Key (or why trees
improve regression models)– Main effects are interesting, but deeper insights
gained from subgroups Don’t give up
– Matching data to decisions is difficult business– Get feedback; make sure the story themodel tells is
understood by decision-makers