A Multi-Criteria Decision Making Tool to Prioritize Network Component for Recovery based on Importance Measures Yasser Almoghathawi, Angela Oommen and Nazanin Morshedlou School of Industrial and Systems Engineering University of Oklahoma Norman, OK 73019, USA [email protected], [email protected], [email protected], Abstract As demands are growing and networks are becoming more complex every day, the cost and consequences of even a small disruption in the network is going to be huge. Analyzing and prioritizing edges for the recovery of the complete network is essential for a successful continuity of business operation. Measuring the importance of network components is of significant value in prioritizing improvement efforts and planning recoverability. Prioritizing transportation network components for recovery based on topology based and flow based importance measures (IMs) will be useful for decision makers. In this project, we aim to create a multi-criteria decision making (MCDM) tool, i.e., PROMETHEE , to analyze and prioritize transportation network components for recovery based on multiple IMs: all pairs max flow edge count, min cutset count, edge flow centrality, flow capacity rate and damage impact, betweenness centrality, and information centrality. The proposed approach is validated through simulation and illustrated with an example. Also, a sensitivity analysis has been carried out for the proposed approach. Conclusion remarks are presented with some suggested future work too. Keywords Network, importance measure, PROMETHEE, simulation. 1. Introduction The role of networks and their performance is patent to many industries, such as transportation, supply chain management, and healthcare systems. Consequently, the disruption in the system and any bottleneck that stops the system can have adverse effects of the whole system. The planning and maintenance teams put all their effort and contemplation to find the criticality in the network and enhance the robustness of the network and moreover find an optimal way to recover the system after the presence of the disaster. Managers are seeking ways whereby they can identify criticality in networks specially the links. Consequently, the most efforts are put to examine links significance and prioritize them. Our goal in this project is to identify importance measures which can be used to rank the network edges. Of all the techniques available to rank the edges, a multi criteria decision making tool called PROMETHEE is used in this project. In reality there are some situation that a network cannot be recovered thoroughly as a result of budget limit, resource availability and other economic and environmental limitation. 1.1 Previous Work Several importance measures (IMs) have been suggested in the literature to identify important components in a network. Najir and Gaudiot (1990) introduce a network fault tolerance measure which calculates the maximum number of failure the network can sustain before the disruption of the whole system occurs. Freeman et al. (1991) propose a new centrality measure for network edges, using the concept of network flows, which is defined for both valued and non-valued graphs and the computation of this measure is based on all independent paths between all pairs of nodes in the networks rather than geodesic paths. Cho and Yum (1997) suggest the uncertainty as an IM of an activity or a pair of them which utilizes Taguchi tolerance design techniques; hence it is applicable for large PERT networks. A new IM for multi-state with multi-components based on reliability is introduced by Ramirez- Marquez et al. (2006) and Zio et al. (2007) which enhance the networks reliability from two points: (i) it measures how a specific component effects multi-state system reliability and (ii) it measures how a specified component state or set of states affects multi-state system reliability. Dall’Asta et al. (2006) consider topology, weight of the links, and geography of network components to study the vulnerability of the networks to intentional attack. Chen et al. (2007) use network-based accessibility as a measure for network component with the variation of travel time and Proceedings of the 2015 International Conference on Operations Excellence and Service Engineering Orlando, Florida, USA, September 10-11, 2015 372
Transcript
A Multi-Criteria Decision Making Tool to Prioritize Network
Component for Recovery based on Importance Measures
Yasser Almoghathawi, Angela Oommen and Nazanin Morshedlou
Hence, a shortest path from 𝑠 to 𝑡 is any path 𝑃 with 𝑤(𝑝) = 𝑠𝑝(𝑠, 𝑡).
2.2. Importance Measures
In this project, seven IMs are considered identify the most important edges for networks, five of which are flow-
based IMs (Nicholson et al. 2014, Rocco et al. 2010) and two are topology-based IMs (Cadini et al. 2009, Sun and
Yang 2013, Sun 2014). Hence, the five flow-based IMs are All Pairs Max Flow Count, Min Cutset Count, Edge
Flow Centrality, Flow Capacity Rate, and One-at-a-Time Damage Impact. The two topology-based IMs are
Betweenness Centrality and Information Centrality. Most important edges proposed by these IMs are subjected to be
reinforced, protected prior to any disruption, or expedited during recovery stage. The seven considered IMs are
explained as follows.
374
2.2.1 All Pair Max Flow Count
The all pairs max flow edge count (MF count) IM measures the utilization of an edge in all 𝑠 − 𝑡 pairs max flow
problems. Accordingly, if an edge is contributing more than others, then it could cause a significant impact on
network performance when its capacity is affected by any disruptive event. The MF count of an edge (𝑖, 𝑗), denoted
as 𝐼(𝑖,𝑗)𝑀𝐹 𝑐𝑜𝑢𝑛𝑡, is defined as shown in Eq. (5).
Where the value of 𝜇𝑠𝑡(𝑖, 𝑗) is defined as 1 if edge (𝑖, 𝑗) is used in a given 𝑠 − 𝑡 max flow problem, and 0 otherwise.
2.2.2. Min Cutset Count
The min cutset count (MC count) IM quantifies the involvement of an edge to the min cutset for all 𝑠 − 𝑡 pairs. An
𝑠 − 𝑡 𝑐𝑢𝑡 on a graph is a segregating of the nodes into two disjoint sets 𝑆 and 𝑇 such that 𝑠 ∈ 𝑆 and 𝑡 ∈ 𝑇 and the
𝑠 − 𝑡 𝑐𝑢𝑡𝑠𝑒𝑡 is the set of edges which starts in 𝑆 but ends in 𝑇. Hence, the 𝑚𝑖𝑛 𝑐𝑢𝑡 of a graph is the 𝑠 − 𝑡 𝑐𝑢𝑡 with
minimal capacity. So, if an edge (𝑖, 𝑗) is involved in the 𝑚𝑖𝑛 𝑐𝑢𝑡𝑠𝑒𝑡 for an 𝑠 − 𝑡 pair, then it is considered as a
bottleneck for the corresponding max flow problem. The MC count of an edge (𝑖, 𝑗), denoted as 𝐼(𝑖,𝑗)𝑀𝐶 𝑐𝑜𝑢𝑛𝑡, is defined
as shown in Eq. (6).
𝐼(𝑖,𝑗)𝑀𝐶 𝑐𝑜𝑢𝑛𝑡 =
1
𝑛(𝑛 − 1)∑ 𝛿𝑠𝑡(𝑖, 𝑗)
𝑠,𝑡∈𝑉
(6)
where the value of 𝛿𝑠𝑡(𝑖, 𝑗) is defined as 1 if edge (𝑖, 𝑗) is a member in the 𝑠 − 𝑡 cutset, and 0 otherwise.
2.2.3 Flow Centrality
The edge flow centrality (FC) IM measures the contribution of a given edge to the max flow of all 𝑠 − 𝑡 pairs.
Hence, it provides an importance based on the ratio of the total volume of flow through a given edge for all possible
𝑠 − 𝑡 pair max flow problems to the flow of all 𝑠 − 𝑡 pairs max flows. The FC of an edge (𝑖, 𝑗), denoted as 𝐼(𝑖,𝑗)𝐹𝐶 , is
defined as shown in Eq. (7).
𝐼(𝑖,𝑗)𝐹𝐶 =
∑ 𝑥𝑠𝑡(𝑖, 𝑗)𝑠,𝑡∈𝑉
∑ 𝑥𝑠𝑡𝑠,𝑡∈𝑉
(7)
where 𝑥𝑠𝑡(𝑖, 𝑗) is the flow on (𝑖, 𝑗) when the max flow is routed from 𝑠 to 𝑡 for all 𝑠 − 𝑡 pair max flow problems.
2.2.4 Flow Capacity Rate
The flow capacity rate (FCR) IM measure which edge has the potential to be the bottleneck, based on the amount of
flow and capacity. It calculates the percentage of the edge flows to the capacity of it. As a result, if the flow through
an edge is close to its capacity, then network performance could be affected by any disruption occurred on that edge.
The FCR of an edge (𝑖, 𝑗), denoted as 𝐼(𝑖,𝑗)𝐹𝐶𝑅 , is defined as shown in Eq. (8).
𝐼(𝑖,𝑗)𝐹𝐶𝑅 =
1
𝑛(𝑛 − 1)∑
𝑥𝑠𝑡(𝑖, 𝑗)
𝑐𝑖𝑗𝑠,𝑡∈𝑉
(8)
2.2.5 Damage Impact
The one-at-a-time damage impact (Impact) IM examines how the network efficiency changes when an edge is
completely damaged due to a disruptive event. It provides the average percent change through all 𝑠 − 𝑡 max flow
problems when an edge (𝑖, 𝑗) is completely incapacitated. The Impact of an edge (𝑖, 𝑗), denoted as 𝐼(𝑖,𝑗)𝐼𝑚𝑝𝑎𝑐𝑡
, is
defined as shown in Eq. (9).
𝐼(𝑖,𝑗)𝐼𝑚𝑝𝑎𝑐𝑡
=1
𝑛(𝑛 − 1)∑
𝑥𝑠𝑡 − 𝑥𝑠𝑡,𝑖𝑗′
𝑐𝑖𝑗𝑠,𝑡∈𝑉
(9)
Where 𝑥𝑠𝑡,𝑖𝑗′ is the max flow from node 𝑠 to node 𝑡 when the capacity of edge (𝑖, 𝑗) is completely damaged, it is not
considered in the network as its capacity equals to 0.
𝐼(𝑖,𝑗)𝑀𝐹 𝑐𝑜𝑢𝑛𝑡 =
1
𝑛(𝑛 − 1)∑ 𝜇𝑠𝑡(𝑖, 𝑗)
𝑠,𝑡∈𝑉
(5)
375
2.2.6. Betweenness Centrality
The betweenness centrality (BC) IM is defined as the number of the shortest paths that go through an edge in a
network. An edge with a high BC score represents could affect the communication between many 𝑠 − 𝑡 pairs of
nodes through the shortest paths between them in case if it is disrupted or damaged. The BC of an edge (𝑖, 𝑗),
denoted as 𝐼(𝑖,𝑗)𝐵𝐶 , is defined as shown in Eq. (10).
𝐼(𝑖,𝑗)𝐵𝐶 = ∑
𝜎𝑠𝑡𝑒
𝜎𝑠𝑡𝑠,𝑡∈𝑉
(10)
where 𝜎𝑠𝑡 is the number of shortest paths from 𝑠 to 𝑡 . 𝜎𝑠𝑡𝑒 is the number of shortest paths from 𝑠 to 𝑡 that pass
through edge 𝑒.
2.2.7 Information Centrality
The information centrality (IC) IM quantifies the importance of an edge on the network. It is defined as the relative
drop in the network efficiency resulted by the removal of an edge from the network. The IC of an edge (𝑖, 𝑗),
denoted as 𝐼(𝑖,𝑗)𝐼𝐶 , is defined as shown in Eq. (11).
𝐼(𝑖,𝑗)𝐼𝐶 =
𝑁𝐸(𝐺) − 𝑁𝐸(𝐺𝑒′)
𝑁𝐸(𝐺) (11)
Where 𝐺𝑒′ is the network 𝐺 but with the removal of edge 𝑒. 𝑁𝐸(𝐺) is the network efficiency of network G and can
be calculated as shown in Eq. (12).
𝑁𝐸(𝐺) =1
𝑛(𝑛 − 1)∑
1
𝑑𝑠𝑡𝑠≠𝑡∈𝐺
(12)
Where 𝑑𝑠𝑡is the length of the shortest path from 𝑠 to 𝑡.
3. Proposed Approach
The PROMETHEE method (Preference Ranking Organization Method for Enrichment Evaluations) is one of the
most recent MCDM methods that was developed by Brans (1982) and further extended by Vincke and Brans (1985). PROMETHEE I method indicates the best alternative among the ones in question; PROMETHEE II gives a
complete ranking of the alternatives. When a subset of alternatives must be identified by the decision maker for
given a set of constraints PROMETHEE V can be used (Fontana et al 2013). PROMETHEE can be applied in many
fields including environment management, hydrology, business and financial management, chemistry, and other
topics (Behzadian et al. 2010). PROMETHEE II is the method of interest for our paper. It assumes that the decision-
maker is able to weigh the criteria appropriately, at least when the number of criteria is not too large (Macharis et al.
2004). The method is based on comparison of each alternative pair with respect to each of the selected criteria. In
order to perform alternative ranking by the PROMETHEE method, it is necessary to define preference function
𝑃(𝑎, 𝑏) for alternatives 𝑎 and 𝑏 which converts the pairwise difference into a preference degree ranging from zero
to one.
In this paper, V-shaped analytical expression is chosen for the shape of preference function which is as shown in Eq.
(15). In the V-shaped preference index an upper boundary parameter 𝑠 is set, this helps in setting a strict preference
of one alternative over another. Once the preference function is set we can aggregate the preference degree of all
criteria for each pair of possible and create a global preference index. For each possible decision a, we compute the
positive outranking flow ∅+(𝑎) and the negative outranking flow ∅−(𝑎) . The difference between the positive
outranking flow and the negative outranking flow will give you the net flow. This net flow can be ordered and used
for ranking the alternatives. Steps for the proposed method are as given below.
Step 1: Collect the IMs values for each alternative and create an m x n matrix. Where m equals the number of IMs
and n equals the number of alternatives.
Step 2: Set the weights for each IM. Let 𝑤𝑗 be the weight for each criterion.
Step 3: Find the deviation by pairwise comparison between the alternatives of each criteria like Eq. (14)
Once we tested the model on all seven chosen IMs. We used PROMETHEE to rank the alternatives considering
different combination of IMs: flow-based (MF count, MC count, FC, FCR, and Impact), topology-based IMs (BC
and IC), network efficiency (NE) (Impact and IC), and centrality (FC, BC, and IC). The ranking of the alternative
considering different IMs combination is shown in Table 3.
378
Table 3: PROMETHEE ranks for edges considering different IMs combinations
Rank All IMs Flow Topology NE Centrality
1 4 4 9 9 9
2 9 9 4 4 10
3 11 11 10 5 12
4 5 12 5 11 8
5 12 5 11 10 2
6 10 7 8 12 7
7 8 8 12 1 6
8 7 10 6 6 4
9 6 6 1 2 1
10 2 2 2 8 5
11 1 1 7 7 3
12 3 3 3 3 11
For PROMETHEE there is no particular rule to choose the weight for the criteria and it is dependent on the decision
maker. We have performed a sensitivity analysis on the ranking of PROMETHEE by considering different weights
criteria, i.e., equal weights, weights generated using the concept of Analytic Hierarchy Process (AHP), and random
weights. Results are given in Table 4.
Table 4: PROMETHEE ranks for edges considering different weight criteria
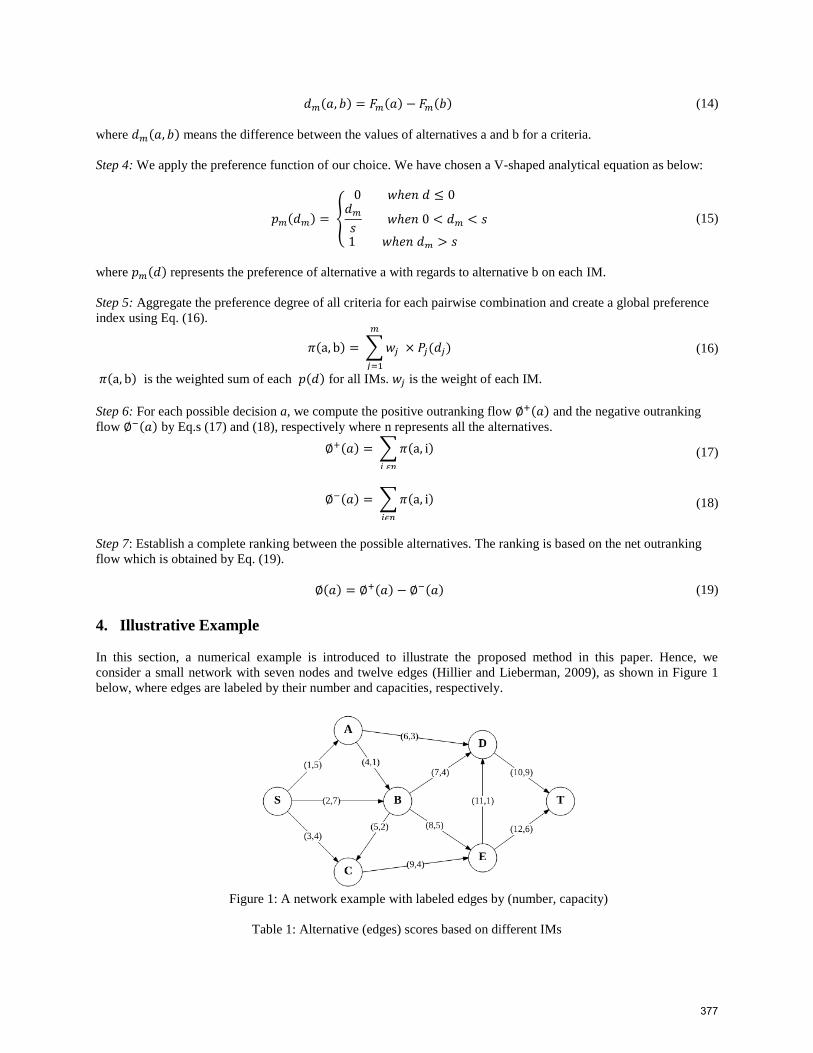
5. Validation
To start the validation we consider a small network with 7 nodes and 12 links, see Figure 1. The capacity of each
link is shown in Table 1.
5.1. Methodology
As it is mentioned, the simulated network which is coded by Awesim software is an example of the real system
which is to be compared with the model which is represented to rank the importance of each links. To start, we
inject the flow of entities to the network. The time between the entities are as small as possible so as we can have
flow in each link before a disaster happens. In the second step, we consider a mechanism for each links whereby the
effect of disaster and the recovery process are simulated as a real case. To consider the effect of the disaster we put a
Gate for each link. The responsibility of a Gate in a link is to be open, let entities transfer through the link, before a
Equal weight AHP Random weight
4 4 9
9 9 4
11 11 12
5 5 8
12 12 10
10 10 11
8 7 6
7 8 7
6 6 5
2 2 2
1 1 1
3 3 3
379
disaster happens, and then in a post disaster situation the Gate becomes close and all entities are sent to the waiting
block. The waiting block keeps the entities coming to the link when the Gate is closed and counts the number of
entities, the average waiting time and the maximum length of entities waiting in the waiting block until the link is
recovered. In other words, the waiting block gives information whereby the decision makers can track what happens
for the entities; meanwhile, the link is under restoration. Depending on the time and order of recovery, the Gate can
be opened in various times. For example, if the time of recovery for link 4 is 100 and the time of recovery for link 5
is 189 and link 4 is to be recovered after link 5, so it takes 289 (100+189) units of time for Gate related to link 4 to
be opened. The third step is concerned with the capacity of the links and for this purpose the queue blocks in are
applied to each link which does not permit to link to get more entities than its capacity. Apart from that, the activity
after the link with the server and service duration can be an introduction of the characteristics of that link such as the
traffic flow the bottle necks it has.
5.2. Example
The simulated network which is coded by Awesim software evaluate the average and maximum length of queue in
the presence of disaster, the average idle and busy time of server, and the utilization of activities. Awesim considers
three links (9,8,7) to be disrupted and then examine all types of orders of recovery to find the one with the optimal
values.
Table 5: Results of all types of recovery order
Links Gate Activity utility Servers
Order Max Length Ave Length Utilization Count Max Idle Time Max Busy Time
8,7,9 146 55 1.29 119 6830 5169.9
7,8,9 163 59.5 1.12 102 7510 4489.9
8,9,7 133 60 1.46 133 6130 5869
7,9,8 166 61 1.11 98 7530 5169.9
9,7,8 151 57 1.29 112 6830 5169.9
9,8,7 131 49 1.47 133 6110 5889.9
As is shown in Table 5, the maximum length and the average length of the entities waiting for gates to be open is
has its least value when the order of 9,8,7 in the recovery. And the utilization and the number of entities which
receiving services are maximum when we choose the recovery order 9,8,7. The idle time, which include the time of
server waiting for the links to be recovered, has its least value for 9,8,7 and the Maximum busy time, which means
links are recovered, is maximum for the order. This prove that the model and simulation are compatible and
emphasize that the model works right.
6. Conclusion
In this project we were able to provide seven IMs which prioritize the configuration of the edges needed to be
recovered. We were successfully able to code these seven IMs with R in order to obtain an applicable framework
measuring the edge’s importance of any networks. On applying PROMETHEE, the MCDM tool, we went on to
prioritize and rank the edges. Coding PROMETHEE in R gave a framework with which we could rank the edges
based on the flow and topology within a network. Validating the produced model with simulated existed systems
proved that the suggested model works. As an extension of this project different MCDM tools can be applied. The
results of which can be analysed to compare the performance of recovery.
380
References Agryzkov, Taras, et al. "A new betweenness centrality measure based on an algorithm for ranking the nodes of a
network." Applied Mathematics and Computation 244 (2014): 467-478. Barker, K., Ramirez-Marquez, J. E., and Rocco, C. M., Resilience-based network component importance measures.
Reliability Engineering and System Safety, vol. 117, pp. 89-97, 2013
Baroud, H., Barker, K., and Ramirez-Marquez, J. E., Importance measures for inland waterway network resilience.
Transportation research part E: logistics and transportation review, vol. 62, pp. 55-67, 2014.
Bazaraa, M. S., Jarvis, J. J., and Sherali, H. D., Linear programming and network flows, 3rd Edition, John Wiley and
Sons, New Jersey, 2011.
Behzadian, M., Kazemzadeh, R. B., Albadvi, A., and Aghdasi, M., PROMETHEE: A comprehensive literature
review on methodologies and applications. European journal of Operational research, vol. 200, no. 1, pp. 198-
215, 2010.
Cadini, F., Zio, E., and Petrescu, C. A. (2009). Using centrality measures to rank the importance of the components
of a complex network infrastructure: Critical information infrastructure security, Springer, Berlin Heidelberg,
pp. 155-167, 2009.
Chen, A., Yang, C., Kongsomsaksakul, S., and Lee, M., Network-based accessibility measures for vulnerability
analysis of degradable transportation networks. Networks and Spatial Economics, vol. 7, no. 3, pp. 241-256,
2007.
Cho, J. G., and Yum, B. J., An uncertainty importance measure of activities in PERT networks. International
Journal of Production Research, vol. 35, no. 10, pp. 2737-2758, 1997.
Dall’Asta, L., Barrat, A., Barthélemy, M., and Vespignani, A., Vulnerability of weighted networks. Journal of
Statistical Mechanics: Theory and Experiment, vol. 2006, no. 04, P04006, 2006
Du, Y., Gao, C., Hu, Y., Mahadevan, S., and Deng, Y., A new method of identifying influential nodes in complex
networks based on TOPSIS. Physica A: Statistical Mechanics and its Applications, vol. 399, pp. 57-69, 2014.
Dwivedi, A., Yu, X., and Sokolowski, P., Analyzing power network vulnerability with maximum flow based
centrality approach. Preceedings 8th IEEE International Conference on Industrial Informatics (INDIN), Osaka,
Japan, pp. 336-341, July 13-16, 2010.
Fontana, M. E., and D. C. Morais. "Using Promethee V to select alternatives so as to rehabilitate water supply
network with detected leaks." Water resources management 27.11 (2013): 4021-4037.
Freeman, L. C., Borgatti, S. P., and White, D. R., Centrality in valued graphs: A measure of betweenness based on
network flow. Social networks, vol. 13, no. 2, pp. 141-154, 1991.
Hillier, F. S., and Lieberman, G. J., Introduction to operations research, 9th Edition, McGraw-Hill, New York, NY,
2009.
Jenelius, E., Redundancy importance: Links as rerouting alternatives during road network disruptions. Procedia
Engineering, vol. 3, pp. 129-137, 2010.
Macharis, C., Springael, J., De Brucker, K., and Verbeke, A., PROMETHEE and AHP: The design of operational
synergies in multicriteria analysis.: Strengthening PROMETHEE with ideas of AHP. European Journal of
Operational Research, vol. 153, no. 2, pp. 307-317, 2004.
Nagurney, A., and Qiang, Q., A network efficiency measure with application to critical infrastructure networks.
Journal of Global Optimization, vol. 40, no. 1-3, pp. 261-275, 2008.
Nagurney, A., and Qiang, Q., A transportation network efficiency measure that captures flows, behavior, and costs
with applications to network component importance identification and vulnerability. Proceedings of the POMS
18th Annual Conference, Dallas, Texas, USA, vol. 4, May 4-7, 2007.
Najjar, W., and Gaudiot, J. L., Network resilience: a measure of network fault tolerance. Computers, IEEE
Transactions on, vol. 39, no. 2, pp. 174-181, 1990.
Nicholson, C. D., Barker, K and Ramirez-Marquez, J. E., Vulnerability analysis for resilience-based network
preparedness. Manuscript in revision, 2014.
Qiang, Q., and Nagurney, A., A unified network performance measure with importance identification and the
ranking of network components. Optimization Letters, vol. 2, no. 1, pp. 127-142, 2008.
Ramirez-Marquez, J. E., Rocco, C. M., Gebre, B. A., Coit, D. W., and Tortorella, M., New insights on multi-state
component criticality and importance. Reliability Engineering and System Safety, vol. 91, no. 8, pp. 894-904,
2006.
Rocco, C., Ramirez-Marquez, J. E., Aponte, D. S., and Zio, E., A flow importance measure via multiple-objective
optimization and its application to an Italian transmission power system. International Journal of