electronic reprint ISSN: 1600-5775 journals.iucr.org/s A multi-MHz single-shot data acquisition scheme with high dynamic range: pump–probe X-ray experiments at synchrotrons Alexander Britz, Tadesse A. Assefa, Andreas Galler, Wojciech Gawelda, Michael Diez, Peter Zalden, Dmitry Khakhulin, Bruno Fernandes, Patrick Gessler, Hamed Sotoudi Namin, Andreas Beckmann, Manuel Harder, Hasan Yavas ¸ and Christian Bressler J. Synchrotron Rad. (2016). 23, 1409–1423 IUCr Journals CRYSTALLOGRAPHY JOURNALS ONLINE J. Synchrotron Rad. (2016). 23, 1409–1423 Alexander Britz et al. · Multi-MHz single-shot data acquisition scheme
Transcript
electronic reprint
ISSN: 1600-5775
journals.iucr.org/s
A multi-MHz single-shot data acquisition scheme with highdynamic range: pump–probe X-ray experiments atsynchrotrons
Alexander Britz, Tadesse A. Assefa, Andreas Galler, Wojciech Gawelda,Michael Diez, Peter Zalden, Dmitry Khakhulin, Bruno Fernandes, PatrickGessler, Hamed Sotoudi Namin, Andreas Beckmann, Manuel Harder,Hasan Yavas and Christian Bressler
J. Synchrotron Rad. (2016). 23, 1409–1423
IUCr JournalsCRYSTALLOGRAPHY JOURNALS ONLINE
J. Synchrotron Rad. (2016). 23, 1409–1423 Alexander Britz et al. · Multi-MHz single-shot data acquisition scheme
(Vanko et al., 2013), and possibly even towards TR X-ray
Raman spectroscopy (Bergmann et al., 2002, 2007; Fister et al.,
2009; Krisch & Sette, 2002; Sternemann et al., 2008; Sahle et
al., 2015).
At MHz repetition rates one can still record the laser-
excited and dark sample in rapid alternating sequence, but
such a scheme requires appropriate electronic gating and
recording schemes for the X-ray signal (as mechanical solu-
tions do not exist). Fast MHz gating, recording and sorted
averaging is laboratory standard for low signal content, i.e. for
single-photon-counting (SPC) methods. This is done using, for
example, scintillators or APDs in combination with gated
constant fraction discriminators (CFD) to measure X-ray
absorption spectroscopy (March et al., 2011; Vanko et al.,
2015). The successful use of SPC techniques limits the useful
pulse intensity on the detector to well below one photon per
X-ray pulse in order to prevent pile-up artefacts due to
multiphoton events, which are counted as single photons. To
exploit not only high repetition rates but equally the large
single X-ray pulse intensity available at third-generation
synchrotrons, we have developed a TR XAS setup at
PETRA III which permits recording X-ray intensities with
suitable dynamic range using a Si-based APD, which is capable
of measuring intensities from well below single photons up to,
in principle, several thousand photons per pulse (or more)
(Saes, Gawelda et al., 2003; Saes et al., 2004; Vanko et al., 2010).
This setup can thus be also applied at intense XFEL sources,
and the European XFEL will have similar repetition rates
(albeit with much higher single pulse intensities) (Altarelli
et al., 2006) as we experience today at SR sources, which
underlines the need for dynamic range at MHz repetition
rates.
This development opens up new possibilities at many SR
sources, but it is useful to first verify the utility of high-repe-
tition-rate experiments at each selected synchrotron. Table 1
compiles the capabilities of selected SR sources for TR
experiments at MHz repetition rates. Hereby it becomes
apparent that the SR sources with larger circumference (0.8–
2.3 km) have more to gain from high-repetition-rate lasers
than the smaller SR sources (operating also at lower electron
beam energies which are less favorable to produce hard
research papers
1410 Alexander Britz et al. � Multi-MHz single-shot data acquisition scheme J. Synchrotron Rad. (2016). 23, 1409–1423
electronic reprint
X-radiation). High-repetition-rate laser systems with sufficient
pulse energies in the 1–10 MHz range are thus better suited at
the larger SR sources: in Table 1 the normalized factor (i.e.
useful X-ray flux) provides a comparison between the poten-
tial capabilities between different SR sources. However, this
comparison does not take into account the (actually very
different!) individual beamline specifications available at each
synchrotron, but should serve as a guide to the eye for the
available potential for TR experiments at each selected
facility, and for each filling pattern reported in Table 1. A
complete comparison between different beamlines in the hard
X-ray domain is beyond the scope of this work, and some
changes (in ranking) are surely to be expected. Table 1 thus
merely compares the principle capabilities of each facility
based only on the stored electron beam properties. Never-
theless, this comparison can be used as a very useful starting
point, from which individual beamlines at these facilities may
compare their capabilities for TR experiments exploiting hard
X-rays in a pump–probe scheme, provided a laser system
matching each SR repetition rate is available.
The table ranks PETRA III, APS, ESRF and Soleil (in its
eight-bunch mode operation) well above the other synchro-
trons. We refrained from including more exotic patterns
permitting higher time resolution, e.g. low-alpha mode at
BESSY-II and ANKA (Feikes et al., 2009; Ibrahimkutty et al.,
2011), the use of X-ray streak cameras, and sliced femtosecond
X-rays generated at ALS (Lindenberg et al., 2000), BESSY-II
(Stamm et al., 2007) and SLS (Bressler et al., 2009), since these
deliver X-ray fluxes orders of magnitude lower than consid-
ered in the present work with MHz repetition rates. For
comparison reasons the conditions for 1 kHz experiments at
SLS are listed at the bottom of Table 1, emphasizing the
dramatic boost in signal quality when performing pump–probe
experiments at MHz repetition rates. Success of this avenue
requires a sufficient amount of sample molecules to be excited
in the X-ray probed volume, or laser pulse energies (at the
selected UV–Vis wavelength) of the order of a few mJ, when
laser and X-ray spot sizes of <50 mm can be realised at the
beamline.
2. Experimental approach for implementing MHzpump–probe experiments in the hard X-ray domain
Time-resolved (pump–probe) measurements at synchrotron
radiation sources benefit enormously when the repetition rate
of the laser system matches that of the delivered X-ray pulses.
However, in practice, there are limits to how much the optical
laser repetition rate can be increased, either due to the time
scale of the investigated reaction or due to conditions resulting
in repeatedly striking the same sample volume, before it has
been moved out of the probe volume. In the following we
describe the implementation of the required instrumentation
at beamline P01 at PETRA III for repetition rates from
0.13 MHz (single-bunch round-trip frequency) up to 7.8 MHz
available in 60-bunch mode. Our data acquisition (DAQ)
scheme was also applied at beamline P11 of PETRA III at
0.13 MHz probe repetition rates for experiments using a
65 kHz laser system (Goeries et al., 2016), but could also
operate reliably at even higher repetition rates towards the
inverse pulse width of typical electrical photodiode signals
(�30 MHz).
2.1. The PETRA III SR source for pump–probe studies
The PETRA III electron storage ring has a circumference
of 2304 m, its RF-accelerating cavities operate at �500 MHz,
generating 3840 of the so-called buckets with 2 ns separation,
which can each support stable storage of electron charges. In
practice, only 40, 60 or 960 buckets are filled with electrons
yielding bunch separations of 192 ns, 128 ns and 8 ns, respec-
tively. The total current of the ring is kept constant at
100.5 mA within �0.5% via relatively frequent (every 1–
2 min) injections of electrons, in this so-called top-up opera-
tion mode. For the TR (pump–probe) measurements
described in this work, only 40- and 60-bunch modes are used.
In 60-bunch mode, where the X-ray pulse-repetition rate is
7.8 MHz, every other (i.e. every second) X-ray pulse records
the laser-excited sample when the laser is tuned to half of its
repetition rate. The high stability of the X-ray flux allows for
accurate comparison (normalization) of the recorded inten-
sities for the dark and laser-illuminated sample.
One issue about top-up operation of the synchrotron
concerns fluctuating X-ray intensities on the sample during the
injection process itself, which lasts for a few seconds. These
top-up-induced fluctuations occur on a slow time scale (much
slower than 1 kHz), so rapid recording of alternate intensities
is not at all hampered, and transient signals (i.e. normalized
laser-on and laser-off X-ray signals) do not detect the injection
process (apart from subtly larger error bars; more details
below in x3.4). However, each of the 60 stored electron
research papers
J. Synchrotron Rad. (2016). 23, 1409–1423 Alexander Britz et al. � Multi-MHz single-shot data acquisition scheme 1411
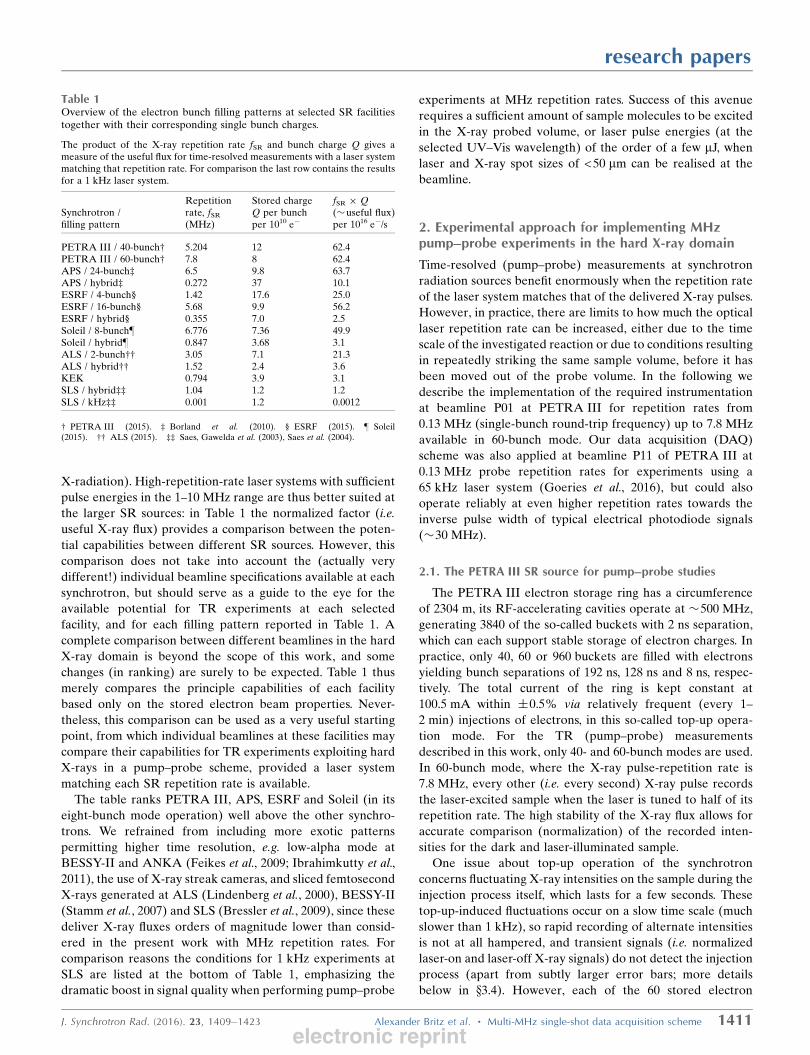
Table 1Overview of the electron bunch filling patterns at selected SR facilitiestogether with their corresponding single bunch charges.
The product of the X-ray repetition rate fSR and bunch charge Q gives ameasure of the useful flux for time-resolved measurements with a laser systemmatching that repetition rate. For comparison the last row contains the resultsfor a 1 kHz laser system.
proved to operate reliably with various solvents covering a
fairly broad range of viscosities. The thin film jet is usually
rotated around the vertical axis to about 45� with respect to
the X-ray beam direction. This permits XAS to be recorded in
TFY mode with its detector placed sideways from the sample
[and/or to disperse the sideways-emitted X-ray fluorescence
with a secondary crystal-based bent crystal arrangement to
record the X-ray emission spectra (Haldrup et al., 2012)].
2.4. Multi-MHz fiber amplifier laser system
The high-repetition-rate laser consists of a bulk oscillator
(t-Pulse, Amplitude Systemes) (Zaouter et al., 2008),
synchronized and locked to the RF of the storage ring, which
seeds a high-energy fiber amplifier (Tangerine 20W, Ampli-
tude Systemes). The Yb:KYW bulk oscillator generates a
stable train of 200 fs mode-locked pulses at 62.5 MHz with an
average power of 1.5 W. The laser cavity contains a set of
actuators that are used to precisely lock the frequency of the
laser cavity to the PETRA III RF frequency and reduce the
timing jitter to less than 1 ps (the synchronization scheme is
described in x2.7). A small fraction of the average power is
coupled into a single-mode polarization-conserving fiber and
seeds the high-power fiber amplifier. Using chirped pulse
amplification together with a state-of-the-art single-mode rod-
type fiber (which mitigates the accumulation of non-linearities
during propagation and amplification in the core of the fiber
amplifier), a maximum pulse energy of 60 mJ (and 300 fs pulse
width) is produced at 400 kHz. The repetition rate of the
output pulses can be changed from below 400 kHz to
15.6 MHz via an acousto-optical modu-
lator (AOM) based pulse picker situ-
ated upstream in the amplifier chain.
The output power and all spatial beam
parameters remain constant at all
selectable repetition rates ensuring the
production of 300 fs/6 mJ pulses at
3.9 MHz and maintaining the pointing
stability. The laser wavelength of
1030 nm can be converted to 515 nm,
343.3 nm and 257.5 nm by second- (SH),
research papers
1412 Alexander Britz et al. � Multi-MHz single-shot data acquisition scheme J. Synchrotron Rad. (2016). 23, 1409–1423
Figure 1Sketch of the dynamics beamline P01 of PETRA III consisting of 2 � 5 m-long undulators togenerate X-rays, a Si(111) double-crystal monochromator, a stack of beryllium prefocusing lensesfollowed by slits and KB mirrors for micro-focusing.
electronic reprint
third- (TH) and fourth-harmonic (FH) generation crystals,
respectively. The optical laser beam is then guided to and
focused on the liquid jet; the losses from the amplifier output
to the sample position can reach 50%. The beam size at the
position of the jet is on the order of 50 mm � 50 mm, thus
slightly larger than the X-ray spot size of 15 mm � 30 mm. The
conversion efficiencies, which we obtained, amount to �36%,
�9.6% and �4.6% at 400 kHz repetition rate; this leads to
maximum pulse energies at the sample position of �30 mJ,
�11 mJ, �2.9 mJ and �1.4 mJ for fundamental, SH, TH and
FH, respectively. For example, at 257.5 nm we can adjust the
excitation intensities with this system (using a half-wave plate
and a polarizer) up to 240 GW cm�2.
2.5. Spatial and temporal overlap of X-ray and laser beams
The X-ray and laser beams are overlapped in a near-
collinear geometry. The angle between both beams is as small
as possible (5–20� depending on setup; here we used �10�), to
ensure a long longitudinal range with good overlap. Both
beams are spatially overlapped using tungsten pinholes with
different diameters between 25 mm and 100 mm. To achieve
temporal overlap, a fast photodiode (Opto Diode Corp, Model
AXUVHS5) with a 700 ps rise-time on a fast oscilloscope
(LeCroy WaveRunner 640Zi with 4 GHz analog bandwidth
and 20 GS s�1 acquisition) are used to record traces of laser
and X-ray pulses. The half-rise position of each pulse and thus
their time separation can be determined with an accuracy of
around 100 ps. Eventually, the actual pump–probe signal is
used to determine time-zero accurately. Adjusting the time
delay between both laser and X-ray pulses is described below
in x2.7.
2.6. X-ray fluorescence detection strategy
The total X-ray fluorescence yield (TFY) from the liquid jet
is detected with an APD (Baron et al., 2006) system, consisting
of an APD head combined with a fast preamplifier (APD0008,
FMB Oxford) and a control/power supply unit (ACE BOX,
FMB Oxford). The APD head (10 mm � 10 mm active surface
area) is placed about 20 mm away from the sample perpen-
dicular to the X-ray propagation direction (or along the linear
polarization axis of the X-ray beam), to minimize the detec-
tion of elastic scattering from the solvent. In this geometry the
detector covers a solid angle of 0.25 sr (or 2% of 4�). A second
APD system can be used to measure the TFY of a lower-Z
material, e.g. a Mn foil (in the case of Fe-containing samples),
located downstream from the sample position. Although
located behind the actual liquid sample, we exploit this device
as a reliable indicator of the incident intensity (I0), especially
concerning the frequent intensity fluctuations due to top-up
injections: the X-rays impinging on the sample {here: 20 mM
of aqueous [Fe(bpy)3]2+} penetrate through the entire length
of the sample of about 0.14 mm (corresponding to the 0.1 mm-
thick jet rotated to 45�), and this results in an attenuation by
18% due to the solvent alone (which is very constant at all
energies used around the Fe K-edge). The solute contributes
to 0.1% below and to 0.6% above the Fe K-edge (with an
excited-state fraction f = 0 for the stationary sample) and the
X-ray transmission through the liquid flat sheet jet Tjet is given
by the ratio of intensities before and after the sample via
Here nsol and nsam are the solvent and sample concentrations
(in particles mm�3), respectively, �sol, �GS, �ES and �rest are
the X-ray (thus energy-dependent) absorption cross sections
of the solvent and solute molecules in their ground (GS) and
excited states (ES), and �rest that of all other elements within
the solute molecule (including counterions), respectively. The
laser power (given in number of laser photons per pulse Nph0 )
enters via the photoexcitation yield of the excited solute
molecules via f = f(nsam, Nph0 , �opt), with �opt being the optical
absorption cross section of the solute molecule at the selected
laser wavelength (for the current estimate of sample trans-
mission we use f = 0, but we include it later for the analysis of
the TR signals), the incident X-ray intensity is I0. Thus the
X-ray transmission through the sample to the second foil is
81.9% below and 81.4% above the Fe K-edge, and the
difference between both transmission values is thus 7 � 10�3,
which would only become distinguishable (within Poisson
statistics) if the collected intensity is >>104 (we typically collect
�108 photons s�1).
Finally, in this setup we record an X-ray fluorescence signal,
e.g. from the Mn foil downstream of the sample, of
IMn ¼ I0 Tjet 1 � TMnð Þ "Mn �det ’det;Mn; ð2Þthus correcting the incident intensity I0 for the transmission
Tjet through the liquid sample, the absorption ð1 � TMnÞ in the
Mn foil, the X-ray emission quantum yield "Mn, the covered
X-ray emission solid angle �det to the detector and the
detector efficiency ’det;Mn. This yields a fluorescence count rate
of >50 photons under our experimental conditions with an
incident flux of 1013 photons s�1 (corresponding to about
106 photons pulse�1 incident on the liquid sample). The
fluorescence count rate IMn is adjusted to at least the count
rate of the X-ray fluorescence signal ITFY from the sample
itself to ensure that normalization (to remove top-up injection
artefacts) does not spoil the overall error of this measurement.
When measuring with less than 104 photons pulse�1 the small
variation of Tjet (below/above the edge) does not change the
count rate for IMn significantly, and can thus even serve for
(rough) single-shot normalization for the incident intensity I0 .
Of course, when collecting several millions of shots this
deviation becomes measurable (see x3.4 later), but the goal
here is to normalize to the top-up injection process on a shot-
by-shot basis, which increases certain X-ray pulses by up to a
few percent (and averages over all bunches within a round
trip) to the limiting set value of 1% top-up injection.
The actual setup aims to measure TR XAS of photoexcited
samples in the hard X-ray regime in TFY mode. This is done
by scanning the incident X-ray energy with the primary DCM
and recording the TFY with the sideways-placed APD (Fig. 2).
research papers
J. Synchrotron Rad. (2016). 23, 1409–1423 Alexander Britz et al. � Multi-MHz single-shot data acquisition scheme 1413electronic reprint
The number of total fluorescence photons ITFY is given by the
number Iabs of absorbed X-ray photons by the solute alone, by
the total fluorescence yield "total, the covered solid angle �APD
and detection efficiency ’det;I1 of the APD as scaling factors
via (Jaklevic et al., 1977)
ITFY ¼ Iabs "total �APD ’det;I1; ð3Þ
with
Iabs ¼ I0ð1 � T jetÞ� ð1 � f Þnsam�GS þ fnsam�ES
nsol�sol þ nsam�rest þ ð1 � f Þnsam�GS þ fnsam�ES
:
To roughly estimate the fluorescence signal per X-ray pulse of
a 20 mM Fe compound in aqueous solution in a 100 mm jet
tilted to 45� we assume an incident X-ray flux of 106 photons
pulse�1 at photon energies just above the Fe K-edge. About
5000 photons are absorbed at the Fe K-edge (thus 0.5% of the
incident ones, which can emit K radiation), which results,
together with the total fluorescence efficiency of Fe "total �"K� þ "K� � 36% (Thompson et al., 2009), the 0.25 sr covered
by the APD and the �95% detector efficiency of the APD at
6 keV (FMB Oxford, 2009), in an expected flux of about
35 photons pulse�1.
In the case of relatively thin samples [nsol�sol + nsam�rest +
ð1 � f Þnsam�GS + fnsam�ES << 1] the exponential term in
equation (1) can be simplified and we can approximate Iabs �I0dnsam½ð1 � f Þ�GS þ f�ES (Jaklevic et al., 1977). Using this,
we can provide an estimate for the expected pump–probe
transient signal S = ITFY;ON � ITFY;OFF = ITFYð f Þ �ITFYð f ¼ 0Þ, which is given by the normalized difference of the
total fluorescence yield ITFY;ON with and ITFY;OFF without laser
excitation, as
S ¼ f �ES � �GS
� �nsam d I0 "total �APD ’det;I1: ð4Þ
For the above-mentioned case the excitation yield f is typically
10%, while the X-ray absorption cross sections for the ground
and excited species typically differ by less than 100% (in the
XANES region, compared with the K-edge jump), thus we
obtain for the transient X-ray fluorescence signal a value of
3.5 photons pulse�1 (on the static 35 photons pulse�1), or
10%. When the expected pump–probe signal becomes smaller
(e.g. in the EXAFS region or due to smaller differences in � or
small f), it is therefore paramount to increase the statistics
significantly, which the presented experimental DAQ scheme,
in combination with a MHz laser system, provides.
2.7. Synchronization and data acquisition strategy at MHzrepetition rates
The laser system is synchronized to the storage ring in the
following way (Fig. 2). The RF signal from the storage ring (a
500 MHz sinusoidal) is converted into a 62.5 MHz trigger
signal by a frequency divider (1/8). This trigger is sent over a
phase shifter module before it enters a frequency mixer unit,
where it is combined with the 62.5 MHz signal from the laser
oscillator to derive and actively correct for any phase varia-
tions. These phase variations between both signals cause a
variation of the relative timing between the laser and X-ray
pulses, and are minimized in the synchronization lock unit to
maintain a reliable (constant) timing between laser and X-ray
pulses. This is realised with a timing jitter much better than
the laser–X-ray instrument response function which mainly
consists of an X-ray pulse width of �100 ps (Schroder et al.,
2011) (see, for example, Fig. 9 later). In order to change the
relative timing between laser and X-ray pulses the frequency-
divided (1/8) RF signal is phase-shifted using an electronic
phase shifter unit, so that the signal entering the synchroni-
zation lock unit leads to an adjustment
of the laser oscillator frequency (via
moving one of the end mirrors in the
laser cavity), so that the output laser
pulses exit at a slightly shifted time, until
the desired time delay has been
reached. Therefore, the phase shifter
unit acts as a tool to control the relative
laser–X-ray time delay. This is done
by coarse and fine adjustment of the
optical path length in the oscillator by
translating one mirror with a servo
motor and the second one with a piezo
actuator. A proportional-integral-deri-
vative (PID) controller in the synchro-
nization lock unit is used to online
correct timing jitter by controlling the
piezo of one mirror. With the 62.5 MHz
of the RF signal, we calculate that a
phase shift of 1� results in a time shift of
the laser pulses of 44.44 ps with respect
to the X-ray pulses. The phase shifter
unit is connected to the data acquisition
research papers
1414 Alexander Britz et al. � Multi-MHz single-shot data acquisition scheme J. Synchrotron Rad. (2016). 23, 1409–1423
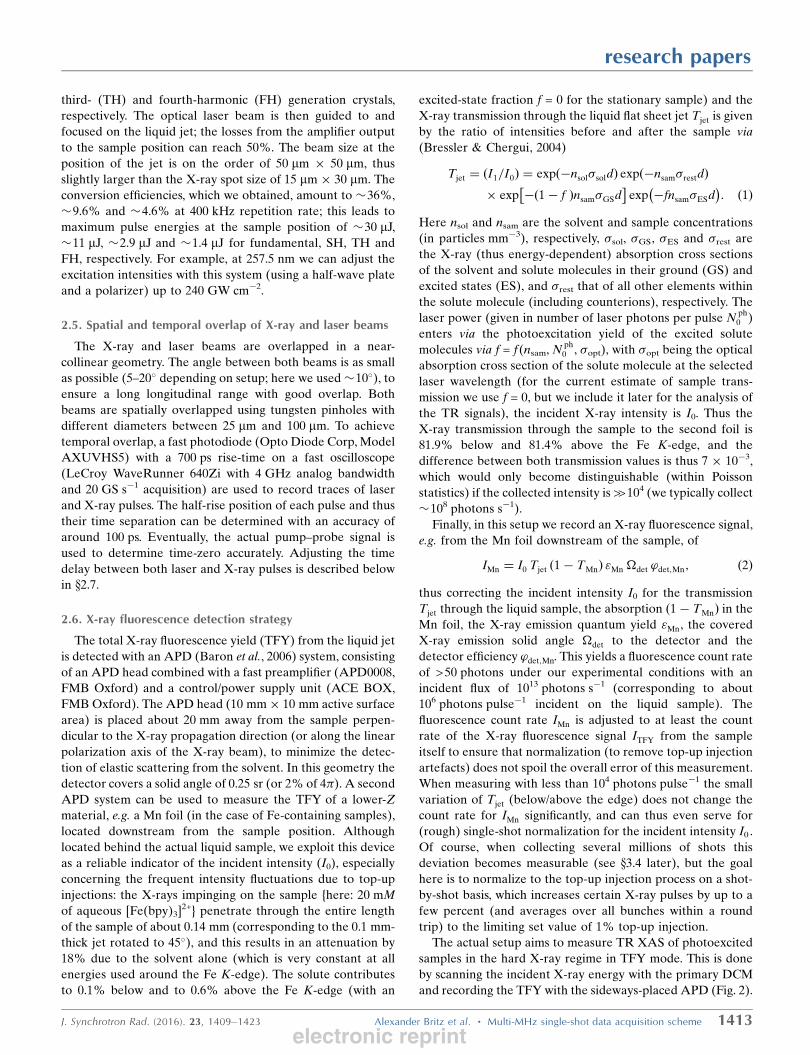
Figure 2Sketch of the experimental setup at the dynamics beamline P01 of PETRA III (here: in 60-bunchmode delivering X-ray pulses at 7.8 MHz), including a fiber amplifier laser system synchronized tothe RF frequency of the storage ring and our MHz DAQ system capable of digitizing and integratingthe APD detector signal traces.
electronic reprint
PC in order to monitor and control the time delay while
acquiring data during a scan.
The X-ray TFY signal generates APD signal traces that are
fed into the DAQ system (a micro TCA based solution with
high-speed digitizers; SP Devices). Each digitizer consists of
four 12-bit analog-to-digital converters (ADCs) accompanied
by a Field Programmable Gate Array (FPGA; Xilinx Virtex 6)
for online data processing. In its standard configuration, this
ADC is able to digitize the traces of our APD detectors at a
sampling rate of 2 GS s�1. Alternatively, it is also possible to
configure the digitizer in the so-called two-channel interleaved
mode to increase the sampling rate to 4 GS s�1 channel�1
(which reduces the number of available channels to two per
ADC). The digitizer is synchronized to a sub-harmonic of the
accelerating RF to ensure stable phase relations. In addition,
a time-to-digital converter (TDC) firmware core has been
implemented in the FPGA for precise measurement of the
rising edge of the provided trigger relative to the sampling
clock. The TDC implementation allows for an accuracy of
about 42 ps RMS. A similar approach reported on a quadrant
APD together with a commercially available ADC at an eight-
fold lower sampling rate (and no TDC implementation) to
measure multi-photon events at MHz repetition rates (Reusch
et al., 2014). Our large sampling rate has proven to be bene-
ficial in order to extract precise integrated signal intensities.
As the maximum peak-to-peak input signal to our ADC is
limited to 800 mV, the APD signal must be attenuated
accordingly when signal intensities exceed this limit.
The trigger and gating scheme for DAQ with the XFEL
MHz DAQ is depicted in Fig. 3 and works as follows. The
entire detection system is triggered by the so-called bunch-
clock, a device which generates trigger pulses either at the
repetition rate of the X-ray pulses or at the round-trip
frequency of a single bunch from the 500 MHz RF signal. In
our scheme, a round-trip frequency of about 130 kHz is used
to trigger the data acquisition, even if the laser operates
at higher repetition rates, i.e. 20-fold (40 bunch) or 30-fold
(60 bunch). The APD traces are sampled and processed for
the duration of the following 40 or 60 X-ray pulses (following
each trigger signal at 130 kHz), depending on the bunch mode
of the experiment. The sampled traces can be displayed online
to select regions of interest for (i) the background signal
before the pulse and (ii) the X-ray pulse, respectively. An
example of such a sampled single APD trace can be found
in Fig. 4(a). The following parameters are defined during
operation and are applied to the system employing an inte-
gration algorithm: the starting point and total number of
sampling points (i) of the background/baseline and (ii) of the
APD signal trace (see Fig. 4a). The FPGA-based algorithm
calculates the sum of the pulse and background samples and
scales the background sum to be correctly removed from the
pulse sum resulting in the single-shot detection signal ITFY. A
second trigger, derived from a photodiode within the MHz
laser amplifier, is used to distinguish between traces (i) right
after laser excitation and (ii) those without prior laser exci-
tation; these are rapidly sorted into ITFY;ON and ITFY;OFF for
pumped and unpumped signals, respectively. Additionally,
research papers
J. Synchrotron Rad. (2016). 23, 1409–1423 Alexander Britz et al. � Multi-MHz single-shot data acquisition scheme 1415
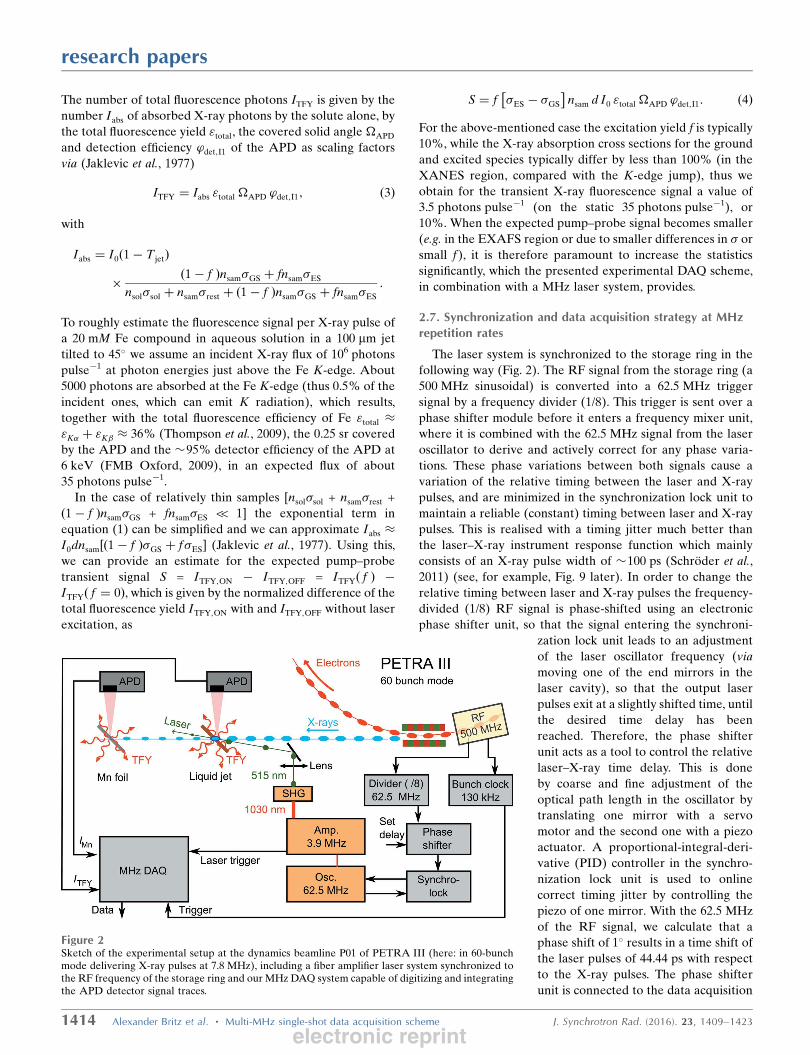
Figure 3Example of the trigger and gating scheme of the MHz DAQ in 60-bunchmode of PETRA III, where the laser repetition rate is set to 3.9 MHz. Inour experiments we mainly used 60-bunch mode, but 40-bunch mode isequally useful (for details see text).
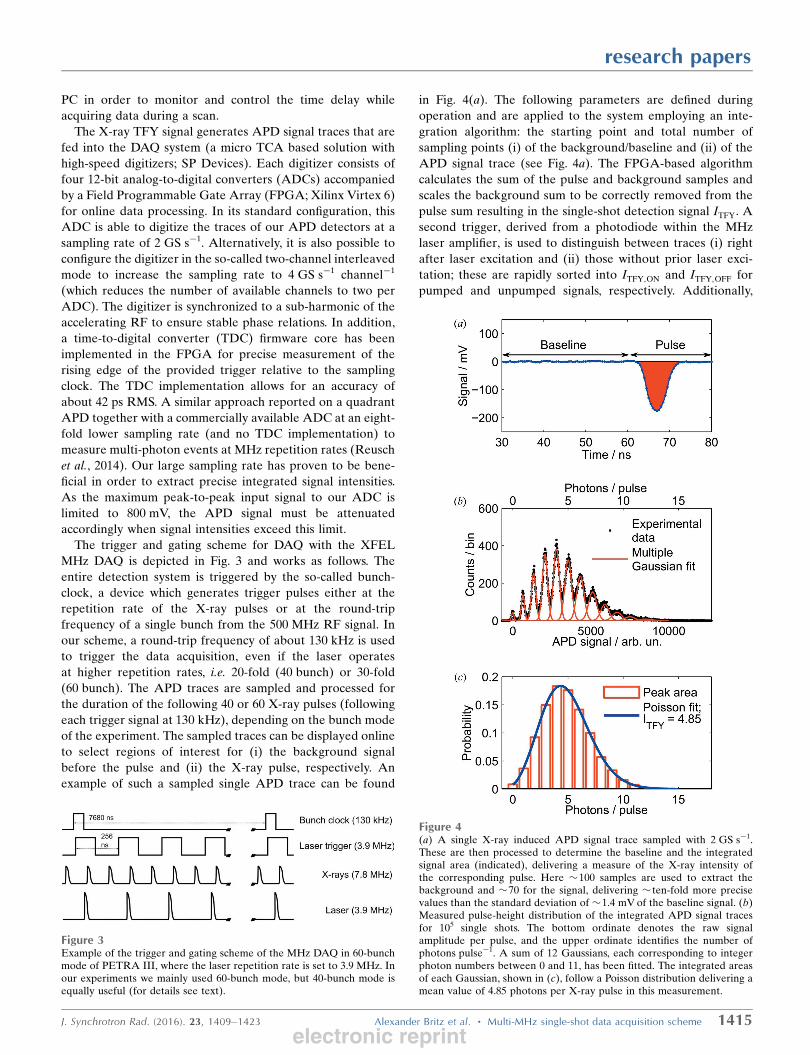
Figure 4(a) A single X-ray induced APD signal trace sampled with 2 GS s�1.These are then processed to determine the baseline and the integratedsignal area (indicated), delivering a measure of the X-ray intensity ofthe corresponding pulse. Here �100 samples are used to extract thebackground and �70 for the signal, delivering � ten-fold more precisevalues than the standard deviation of �1.4 mV of the baseline signal. (b)Measured pulse-height distribution of the integrated APD signal tracesfor 105 single shots. The bottom ordinate denotes the raw signalamplitude per pulse, and the upper ordinate identifies the number ofphotons pulse�1. A sum of 12 Gaussians, each corresponding to integerphoton numbers between 0 and 11, has been fitted. The integrated areasof each Gaussian, shown in (c), follow a Poisson distribution delivering amean value of 4.85 photons per X-ray pulse in this measurement.
electronic reprint
some parameters are calculated online, such as, for example,
mean values of ITFY;ON and ITFY;OFF and their respective
standard deviations. In the current state of the MHz DAQ we
are able to acquire, integrate, baseline correct and average up
�6 � 106 pulses s�1 in real time (neglecting �10% dead-time
due to communication between beamline control PC and, for
example, the X-ray monochromator motor controls, or the
phase shifter mirror controls).
3. Results: signal statistics and time-resolved XASmeasurements
In this section, first results obtained with the above-described
setup are shown. These include tests of the linearity of the
detector/DAQ system combination, a characterization of the
detector signal statistics and benchmark TR XAS measure-
ments of transition metal complexes with extremely high
signal quality.
3.1. Detector signal statistics
To test the detector/DAQ combination we have measured
the TFY from a 300 mm liquid jet containing a 50 mM aqueous
solution of K4[Fe(CN)6]. The total fluorescence from the iron
atom consists of mainly K� X-ray photons around 6.40 keV
and the weaker K� emission at 7.05 keV [the ratio of fluor-
escence yield is "K�="K� ’ 150/17, so 90% of the fluorescence
mainly contains K� photons (Thompson et al., 2009)]; the
remaining valence-to-core emission we disregard here, since it
is 500-fold times weaker than the K� emission (Vanko et al.,
2006). We have varied the APD bias voltage from 200 V up
to 350 V (right below its break-down voltage) to adjust the
internal APD gain, depending on the recorded X-ray flux. For
calibration purposes the upstream beamline slits have been
gradually closed to attenuate the incident X-ray intensity, and
the incident flux on the sample was monitored with a PIN
diode measuring scattered X-rays from a Kapton window
downstream of the high-vacuum KB focusing mirror system
(and before the sample). The recorded sample fluorescence
signal for a collection of 105 shots with attenuated beam
reveals the expected Poisson statistics for an average single-
pulse intensity of about 5 photons pulse�1 (Fig. 4b). Being
mainly of statistical nature, the signals follow a Poisson
distribution,
P �; kð Þ ¼ �k expð��Þk!
: ð5Þ
Hereby k corresponds to the number of photons detected in a
single pulse with � being the mean value of photons detected
after a large (towards infinite) number of acquired pulses; in
our case � corresponds to the total fluorescence yield ITFY
extracted via equation (5) after, for example, 105 acquired
pulses (as shown later in x3.2).
In the case of only a few photons striking the detector the
discrete peaks representing one, two, three, etc. photon events
are well separated (up to �10 pulse�1). This already allows for
a very precise calibration from the integrated signal voltage to
absolute number of photons. The broadening of each peak is
due to effects in the amplification process in the APD itself,
including avalanche gain noise and preamplifier noise, next to
electronic noise, which can be best seen in the zero photon
event (Fig. 4b). To separate the signals belonging to each
integer number of photons a sum of Gaussian peaks has been
fitted to the measured pulse height distribution (Fig. 4b), and
the area of each single Gaussian is proportional to the number
of events for this chosen number of photons. These Gaussian
areas are then normalized to a total area of 1, and a fit to a
Poisson distribution [equation (5)] delivers the precise single-
pulse intensity of ITFY = 4.85 (Fig. 4c). For larger single-photon
intensities (thus at higher incident flux), the Poisson distri-
bution curve [blue trace in Fig. 4(c)] merges into a Gaussian
distribution, and this already [via equation (5)] for single-
pulse intensities around/above 10 photons pulse�1. In the case
of a Gaussian distribution, where a clear separation of the
discrete peaks is no longer present, the mean number of
photons can still be precisely determined: for a shot-noise-
limited measurement the standard deviation of the measured
average signal � becomes �p =ffiffiffi�
pand we can relate ITFY to its
experimentally determined standard deviation � via (Saes et
al., 2004)
� ¼ �
�p
!2
ITFY
�
� �2
: ð6Þ
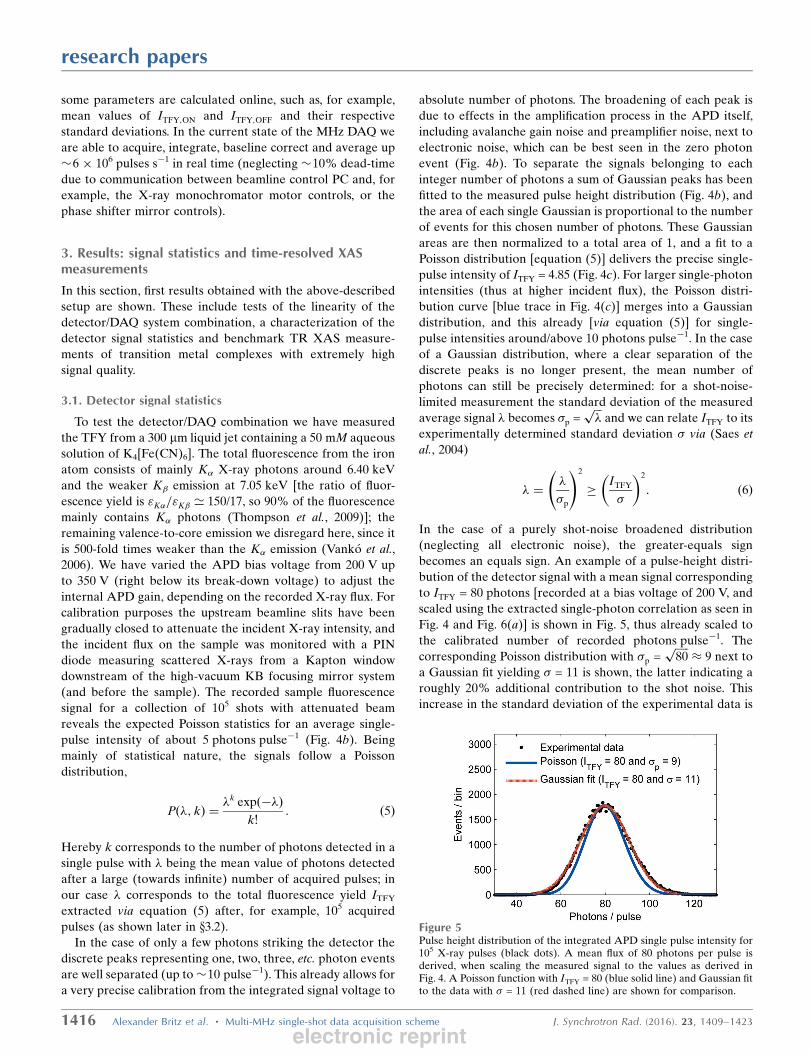
In the case of a purely shot-noise broadened distribution
(neglecting all electronic noise), the greater-equals sign
becomes an equals sign. An example of a pulse-height distri-
bution of the detector signal with a mean signal corresponding
to ITFY = 80 photons [recorded at a bias voltage of 200 V, and
scaled using the extracted single-photon correlation as seen in
Fig. 4 and Fig. 6(a)] is shown in Fig. 5, thus already scaled to
the calibrated number of recorded photons pulse�1. The
corresponding Poisson distribution with �p =ffiffiffiffiffi80
p � 9 next to
a Gaussian fit yielding � = 11 is shown, the latter indicating a
roughly 20% additional contribution to the shot noise. This
increase in the standard deviation of the experimental data is
research papers
1416 Alexander Britz et al. � Multi-MHz single-shot data acquisition scheme J. Synchrotron Rad. (2016). 23, 1409–1423
Figure 5Pulse height distribution of the integrated APD single pulse intensity for105 X-ray pulses (black dots). A mean flux of 80 photons per pulse isderived, when scaling the measured signal to the values as derived inFig. 4. A Poisson function with ITFY = 80 (blue solid line) and Gaussian fitto the data with � = 11 (red dashed line) are shown for comparison.
electronic reprint
due to several factors which, amongst
others, are: (i) the broadening of each
single discrete photon peak as described
above, (ii) in top-up mode not all 40/60
bunches are equally refilled at once,
which effectively leads to charge fluc-
tuations in individual electron bunches,
which are larger than the 1% top-up
limit of the total (i.e. bunch-averaged)
storage ring current. In summary, the
result in Fig. 5 shows that we have
a nearly shot-noise-limited detection
scheme operational, where only less
than 20% of the noise is accountable by
electronic (and other systematic) noise
contributions.
3.2. Linearity of APD and dynamicrange
To assess the linear detector response
over the entire dynamic range, we
analyzed in detail the pulse height
distributions of each integrated APD
pulse (Fig. 4a). In the low-flux cases
shown in Figs. 6(a), 6(c) and 6(e) the
detector response is rather linear,
independent of the bias voltage on the
APD. In the high-flux distributions
[Fig. 6(b), 6(d) and 6( f)], the distribu-
tions clearly indicate a non-linear
behaviour (slowly merging to satura-
tion) at the larger bias voltages of 300
and 350 V. Qualitatively this is due to a
saturation of the integrated pre-ampli-
fier within the APD head. In order to
quantify the linear response regime of
the APD as a function of the bias voltage, the mean APD
signal as a function of incident X-ray intensity is plotted in
Fig. 7. At the highest bias of 350 V the APD response is linear
up to a mean signal of 20 photons, at 300 V bias further up to
40 photons and at 200 V bias up to at least 80 photons. In
addition, these measurements also verify the linear response
of the entire system up to these limits. Thus our setup is able
to operate at total fluorescence yield count rates of up
to 100 photons pulse�1 with single-photon sensitivity or
>>108 photons s�1 when applied at PETRA III in 60-bunch
mode. This also shows the dynamic range increase of two
to three orders of magnitude compared with single-photon
counting methods, where the count rates are limited to
<<1 photon pulse�1.
3.3. High signal quality for measuring a spin transitionprocess: solvated [FeII(bpy)3]
2+
As a benchmark experiment to compare the present
DAQ scheme with previously reported TR-XAS measure-
ments, we have chosen aqueous iron(II)-tris(2,20)-bipyridine
research papers
J. Synchrotron Rad. (2016). 23, 1409–1423 Alexander Britz et al. � Multi-MHz single-shot data acquisition scheme 1417
Figure 6Integrated detector signal for a collection of single measurements (or pulse height distributions) for200 V bias and low (a) and high (b) photon flux, 300 V bias with low (c) and high (d) photon flux,350 V bias with low (e) and high ( f ) photon flux. The strong preamplifier gain amplifies the signal toits limiting value leading to the asymmetric pulse shape near 60 photons in ( f ) (see also Fig. 7).
Figure 7Mean APD signal as a function of incident X-ray intensity for 200 V,300 V and 350 V APD bias voltages, derived from the histograms in Fig. 6.The APD signal is given in units of Fe fluorescence photons, whichconstitute mainly K� photons of 6.4 keV. At the highest bias of 350 V theAPD response is linear up to a mean signal of 20 photons, at 300 V biasup to 40 photons and at 200 V bias of beyond 80 photons.
electronic reprint
{[FeII(bpy)3]2+} which has been readily studied using both
low- and high-repetition optical laser pump/X-ray probe
setups both at synchrotrons and XFELs (Milne et al., 2010;
Bressler et al., 2009; Gawelda, Cannizzo et al., 2007; Cannizzo
et al., 2010; Gawelda, Pham et al., 2007; Gawelda et al., 2009).
Upon laser excitation with 515 nm light the system is excited
from a low-spin (LS) ground state to a metal-to-ligand charge
transfer (MLCT) excited state and subsequently relaxes (on a
100 fs time scale) to a high-spin (HS) quintet state (Cannizzo
et al., 2010). This LS to HS transition is accompanied by an
Fe—N bond elongation of �0.2 A, giving rise to a fairly strong
transient XANES signal. The HS state relaxes back to the LS
ground state with a solvent-dependent lifetime, e.g. with 0.6 ns
in H2O (Gawelda, Cannizzo et al., 2007) and 0.96 ns in CH3CN
(Jamula et al., 2014). The changes in structure and spin states
result in a change of the X-ray absorption spectrum and have
been analysed via EXAFS (Gawelda, Pham et al., 2007) and
XANES (Gawelda et al., 2009). We show TR XANES data
during two different measurement campaigns: earlier results
have been limited in signal quality due to software constraints,
so only the raw digitized APD signal traces were recorded
(Fig. 4a) and post-processed, but, more severely, the number
of acquired pulses per data point was constrained to only a few
tens of thousands (albeit the laser operated at MHz repetition
rates). After software and hardware improvements our latest
results not only reproduce the earlier data quality (when
taking the dramatically different statistics into account) but
facilitated nearly real-time data acquisition and pre-processing
at 7.8 MHz (60-bunch mode), which includes (i) baseline
correction and integration of all signal traces, and (ii) aver-
aging over several samples to deliver an average signal value
ITFY together with its standard deviation �.
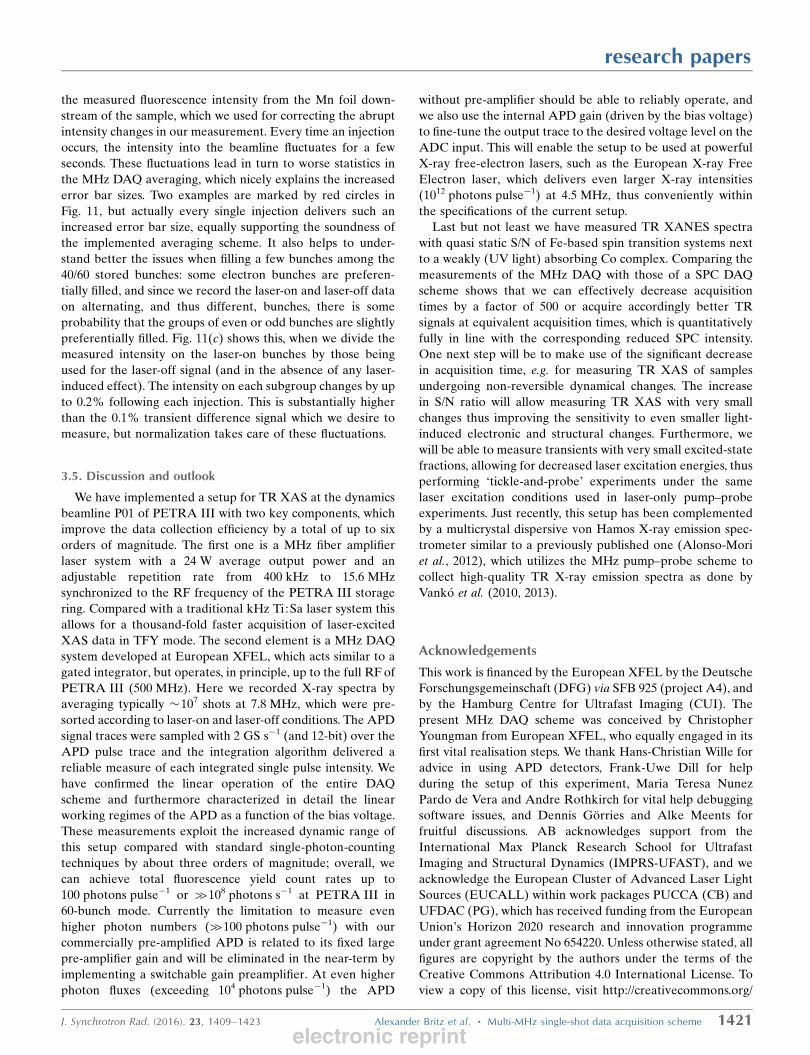
Fig. 8 shows the TR XANES of [FeII(bpy)3]2+ dissolved in
CH3CN, thus the ground state (laser-off), �100 ps after
photoexcitation (laser-on) and the resulting transient signal
(difference). The average laser power measured at the sample
position was �2 W at 1.3 MHz repetition rate (thus a pulse
energy of �1.5 mJ), and the laser spot size �50 mm � 50 mm
(slightly larger than the X-ray spot size of �15 mm � 30 mm).
The X-ray probe energy was scanned over a range of 50 eV in
0.5 eV steps (to cover the XANES region) with the collection
time set to 1 s per data point. The excited-state fraction was
determined by the amplitude of the transient signal (relative
to the absorption edge jump) to �28% via comparison with
prior measurements reported by Gawelda et al. (2009) and
Gawelda, Pham et al. (2007).
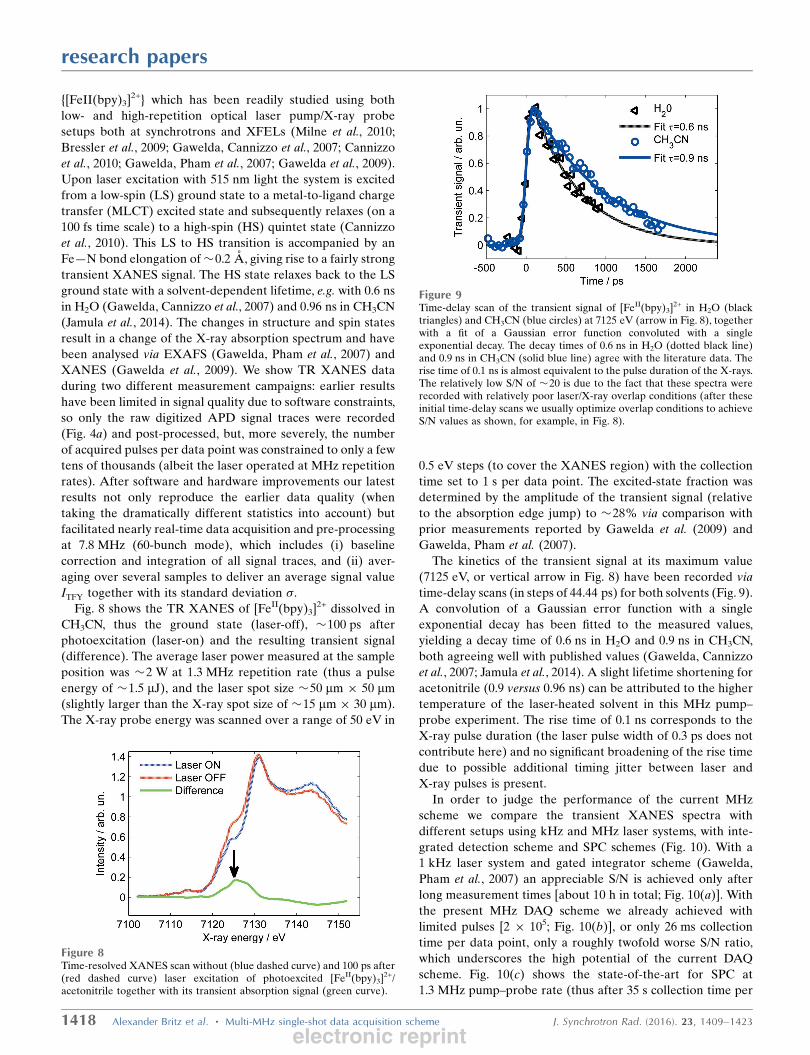
The kinetics of the transient signal at its maximum value
(7125 eV, or vertical arrow in Fig. 8) have been recorded via
time-delay scans (in steps of 44.44 ps) for both solvents (Fig. 9).
A convolution of a Gaussian error function with a single
exponential decay has been fitted to the measured values,
yielding a decay time of 0.6 ns in H2O and 0.9 ns in CH3CN,
both agreeing well with published values (Gawelda, Cannizzo
et al., 2007; Jamula et al., 2014). A slight lifetime shortening for
acetonitrile (0.9 versus 0.96 ns) can be attributed to the higher
temperature of the laser-heated solvent in this MHz pump–
probe experiment. The rise time of 0.1 ns corresponds to the
X-ray pulse duration (the laser pulse width of 0.3 ps does not
contribute here) and no significant broadening of the rise time
due to possible additional timing jitter between laser and
X-ray pulses is present.
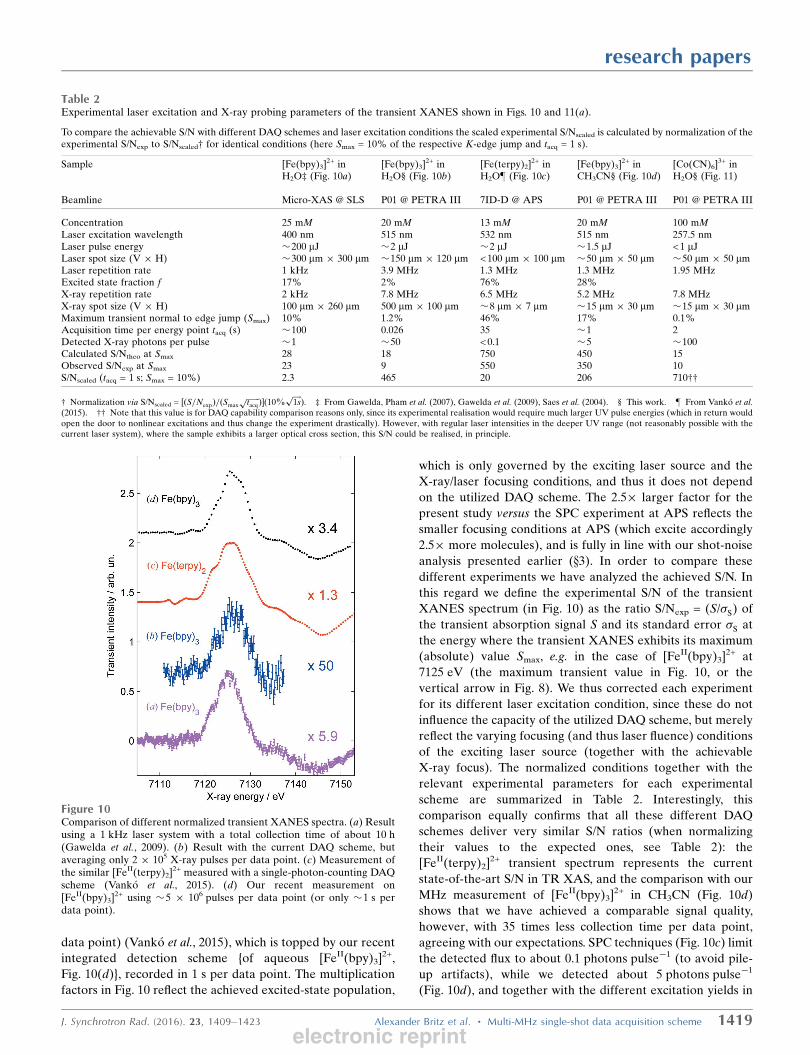
In order to judge the performance of the current MHz
scheme we compare the transient XANES spectra with
different setups using kHz and MHz laser systems, with inte-
grated detection scheme and SPC schemes (Fig. 10). With a
1 kHz laser system and gated integrator scheme (Gawelda,
Pham et al., 2007) an appreciable S/N is achieved only after
long measurement times [about 10 h in total; Fig. 10(a)]. With
the present MHz DAQ scheme we already achieved with
limited pulses [2 � 105; Fig. 10(b)], or only 26 ms collection
time per data point, only a roughly twofold worse S/N ratio,
which underscores the high potential of the current DAQ
scheme. Fig. 10(c) shows the state-of-the-art for SPC at
1.3 MHz pump–probe rate (thus after 35 s collection time per
research papers
1418 Alexander Britz et al. � Multi-MHz single-shot data acquisition scheme J. Synchrotron Rad. (2016). 23, 1409–1423
Figure 9Time-delay scan of the transient signal of [FeII(bpy)3]2+ in H2O (blacktriangles) and CH3CN (blue circles) at 7125 eV (arrow in Fig. 8), togetherwith a fit of a Gaussian error function convoluted with a singleexponential decay. The decay times of 0.6 ns in H2O (dotted black line)and 0.9 ns in CH3CN (solid blue line) agree with the literature data. Therise time of 0.1 ns is almost equivalent to the pulse duration of the X-rays.The relatively low S/N of �20 is due to the fact that these spectra wererecorded with relatively poor laser/X-ray overlap conditions (after theseinitial time-delay scans we usually optimize overlap conditions to achieveS/N values as shown, for example, in Fig. 8).
Figure 8Time-resolved XANES scan without (blue dashed curve) and 100 ps after(red dashed curve) laser excitation of photoexcited [FeII(bpy)3]2+/acetonitrile together with its transient absorption signal (green curve).
electronic reprint
data point) (Vanko et al., 2015), which is topped by our recent
Fig. 10(d)}, recorded in 1 s per data point. The multiplication
factors in Fig. 10 reflect the achieved excited-state population,
which is only governed by the exciting laser source and the
X-ray/laser focusing conditions, and thus it does not depend
on the utilized DAQ scheme. The 2.5� larger factor for the
present study versus the SPC experiment at APS reflects the
smaller focusing conditions at APS (which excite accordingly
2.5� more molecules), and is fully in line with our shot-noise
analysis presented earlier (x3). In order to compare these
different experiments we have analyzed the achieved S/N. In
this regard we define the experimental S/N of the transient
XANES spectrum (in Fig. 10) as the ratio S/Nexp = (S/�S) of
the transient absorption signal S and its standard error �S at
the energy where the transient XANES exhibits its maximum
(absolute) value Smax, e.g. in the case of [FeII(bpy)3]2+ at
7125 eV (the maximum transient value in Fig. 10, or the
vertical arrow in Fig. 8). We thus corrected each experiment
for its different laser excitation condition, since these do not
influence the capacity of the utilized DAQ scheme, but merely
reflect the varying focusing (and thus laser fluence) conditions
of the exciting laser source (together with the achievable
X-ray focus). The normalized conditions together with the
relevant experimental parameters for each experimental
scheme are summarized in Table 2. Interestingly, this
comparison equally confirms that all these different DAQ
schemes deliver very similar S/N ratios (when normalizing
their values to the expected ones, see Table 2): the
[FeII(terpy)2]2+ transient spectrum represents the current
state-of-the-art S/N in TR XAS, and the comparison with our
MHz measurement of [FeII(bpy)3]2+ in CH3CN (Fig. 10d)
shows that we have achieved a comparable signal quality,
however, with 35 times less collection time per data point,
agreeing with our expectations. SPC techniques (Fig. 10c) limit
the detected flux to about 0.1 photons pulse�1 (to avoid pile-
up artifacts), while we detected about 5 photons pulse�1
(Fig. 10d), and together with the different excitation yields in
research papers
J. Synchrotron Rad. (2016). 23, 1409–1423 Alexander Britz et al. � Multi-MHz single-shot data acquisition scheme 1419
Table 2Experimental laser excitation and X-ray probing parameters of the transient XANES shown in Figs. 10 and 11(a).
To compare the achievable S/N with different DAQ schemes and laser excitation conditions the scaled experimental S/Nscaled is calculated by normalization of theexperimental S/Nexp to S/Nscaled† for identical conditions (here Smax = 10% of the respective K-edge jump and tacq = 1 s).
Sample [Fe(bpy)3]2+ inH2O‡ (Fig. 10a)
[Fe(bpy)3]2+ inH2O§ (Fig. 10b)
[Fe(terpy)2]2+ inH2O} (Fig. 10c)
[Fe(bpy)3]2+ inCH3CN§ (Fig. 10d)
[Co(CN)6]3+ inH2O§ (Fig. 11)
Beamline Micro-XAS @ SLS P01 @ PETRA III 7ID-D @ APS P01 @ PETRA III P01 @ PETRA III
Concentration 25 mM 20 mM 13 mM 20 mM 100 mMLaser excitation wavelength 400 nm 515 nm 532 nm 515 nm 257.5 nmLaser pulse energy �200 mJ �2 mJ �2 mJ �1.5 mJ < 1 mJLaser spot size (V � H) �300 mm � 300 mm �150 mm � 120 mm < 100 mm � 100 mm �50 mm � 50 mm �50 mm � 50 mmLaser repetition rate 1 kHz 3.9 MHz 1.3 MHz 1.3 MHz 1.95 MHzExcited state fraction f 17% 2% 76% 28%X-ray repetition rate 2 kHz 7.8 MHz 6.5 MHz 5.2 MHz 7.8 MHzX-ray spot size (V � H) 100 mm � 260 mm 500 mm � 100 mm �8 mm � 7 mm �15 mm � 30 mm �15 mm � 30 mmMaximum transient normal to edge jump (Smax) 10% 1.2% 46% 17% 0.1%Acquisition time per energy point tacq (s) �100 0.026 35 �1 2Detected X-ray photons per pulse �1 �50 < 0.1 �5 �100Calculated S/Ntheo at Smax 28 18 750 450 15Observed S/Nexp at Smax 23 9 550 350 10S/Nscaled (tacq = 1 s; Smax = 10%) 2.3 465 20 206 710††
† Normalization via S/Nscaled = ½ðS=NexpÞ=ðSmax
ffiffiffiffiffiffiffitacq
p Þð10%ffiffiffiffiffi1s
p Þ. ‡ From Gawelda, Pham et al. (2007), Gawelda et al. (2009), Saes et al. (2004). § This work. } From Vanko et al.(2015). †† Note that this value is for DAQ capability comparison reasons only, since its experimental realisation would require much larger UV pulse energies (which in return wouldopen the door to nonlinear excitations and thus change the experiment drastically). However, with regular laser intensities in the deeper UV range (not reasonably possible with thecurrent laser system), where the sample exhibits a larger optical cross section, this S/N could be realised, in principle.
Figure 10Comparison of different normalized transient XANES spectra. (a) Resultusing a 1 kHz laser system with a total collection time of about 10 h(Gawelda et al., 2009). (b) Result with the current DAQ scheme, butaveraging only 2 � 105 X-ray pulses per data point. (c) Measurement ofthe similar [FeII(terpy)2]2+ measured with a single-photon-counting DAQscheme (Vanko et al., 2015). (d) Our recent measurement on[FeII(bpy)3]2+ using �5 � 106 pulses per data point (or only �1 s perdata point).
electronic reprint
both measurements we obtain nearly identical results, thus
with better signal quality (in less time) with the current MHz
DAQ scheme. Summarizing this collection in Table 2, in the
last line we scaled S/Nexp to comparable values of transient
signal Smax (thus correcting out the different excitation yields
and maximum transient signal) together with the different
data collection times. This allows the different DAQ schemes
to be compared: the 1 kHz experiment shows the lowest S/
Nscaled with the MHz SPC method delivering about a ten times
larger S/Nscaled, while the current MHz DAQ scheme delivered
the largest S/Nscaled under otherwise comparable experimental
conditions. The up to �30-fold increase from the MHz SPC
experiment to the here-presented MHz DAQ scheme clearly
reflects the �1000-fold increase in counted photons pulse�1,
leading to an increase offfiffiffiffiffiffiffiffiffiffi1000
pin S/N. We can also compare
our representative single-scan XANES transient of
[FeII(bpy)3]2+ in Fig. 8 with a S/N of 350 with the repre-
sentative single XANES transient scan of the same molecule
(Lima et al., 2011) with a S/N of 45. Our measurement
presented here yields a factor 350/45 ’ 7.8 better S/N which
agrees nicely with the expected improvement offfiffiffiffiffiffiffiffiffiffiffiffiffiffiffiffiffi62:4=1:2
p �7.2 from the ratio 62.4/1.2 of useful flux between both sources
(see Table 1). Furthermore, the dynamic range of an APD can
in principle be boosted from �100 to several thousand (103)
photons per pulse, as was demonstrated in the kHz experiment
at SLS and ALS (Saes et al., 2004) measuring transient XAS
signals in transmission mode, which provides ample room for
even further improvement.
3.4. TR XANES of weakly excited aqueous [Co(CN)6]3+
We further applied the implemented DAQ scheme to
aqueous hexacyanocobaltate(III) ([Co(CN)6]3+). This sample
exhibits two ligand field absorption bands around 260 and
310 nm (Scandola & Scandola, 1971), and light excitation into
these bands is followed by an intersystem crossing to a ligand
field excited triplet state with a near-unit quantum yield
(Nishazawa & Ford, 1981). This triplet state has a lifetime of
about 2.6 ns and decays back to the ground state (with a
quantum yield of 0.69) or undergoes (CN)� ligand detachment
(with a yield of 0.31), and is promptly followed by association
of a solvent water molecule (Milder et al., 1984). This system
serves ideally as a challenging benchmark experiment as its
molar absorptivity at 257.5 nm is only about 130 M�1 cm�1,
thus about 45 times smaller than that for [Fe(bpy)3]2+ in H2O
at 515 nm. The present [Co(CN)6]3+ thus represents a sample
with very low excitation yields. The details of the photocycle
of this molecule will not be addressed in this publication; we
will only use this sample to demonstrate the capabilities
to measure small TR transient signals in fairly short data
acquisition times.
We have measured TR XANES of a 100 mM aqueous
solution of [Co(CN)6]3+ after photoexcitation with 257.5 nm
light (the fourth harmonic of our laser system) operating at
1.95 MHz, and probing in 40-bunch mode of PETRA III at
7.8 MHz. The XANES spectrum measured with an acquisition
time of 2 s per energy point shows a very weak transient signal
of about 1/1000 of the K-edge-jump itself, but the S/N is
already �10 (Fig. 11a). We have also compiled the relevant
experimental parameters in Table 2, that show that the signal
quality is very close to our expectations. Concerning the
strategy to record all pulses at 7.8 MHz while the laser-on
X-ray pulses arrive at 1.95 MHz (or for every fourth X-ray
pulse), this is nicely apparent from the statistically derived
error bars for the groups of laser-on and laser-off data: the
laser-on error bars are indeedffiffiffi3
ptimes larger than the laser-
off error bars.
Equally important is to inspect the error bars on the tran-
sient data (difference between laser-on and laser-off data),
derived from the on-board fast averaging process: the value of
the error bars in the transient of Fig. 11(a) are squared and
plotted in Fig. 11(b) for each energy point. It resembles very
much the ground-state spectrum, which is indeed expected for
a shot-noise-limited detection method. But one also observes
occasional deviations (outliers) with larger values. These are
due to the top-up operation mode of PETRA III, which is
easily identified for this scan in Fig. 11(c): the blue curve shows
research papers
1420 Alexander Britz et al. � Multi-MHz single-shot data acquisition scheme J. Synchrotron Rad. (2016). 23, 1409–1423
Figure 11(a) XANES of [Co(CN)6]3+ after 257.5 nm excitation. (b) Squared errorbars of transient difference. (c) IMn measurement which is used as an I0
measurement as well as the normalized difference between IMn for laserON and OFF which shows the unbalanced top-up of electron bunchescorresponding to laser ON and laser OFF.
electronic reprint
the measured fluorescence intensity from the Mn foil down-
stream of the sample, which we used for correcting the abrupt
intensity changes in our measurement. Every time an injection
occurs, the intensity into the beamline fluctuates for a few
seconds. These fluctuations lead in turn to worse statistics in
the MHz DAQ averaging, which nicely explains the increased
error bar sizes. Two examples are marked by red circles in
Fig. 11, but actually every single injection delivers such an
increased error bar size, equally supporting the soundness of
the implemented averaging scheme. It also helps to under-
stand better the issues when filling a few bunches among the
40/60 stored bunches: some electron bunches are preferen-
tially filled, and since we record the laser-on and laser-off data
on alternating, and thus different, bunches, there is some
probability that the groups of even or odd bunches are slightly
preferentially filled. Fig. 11(c) shows this, when we divide the
measured intensity on the laser-on bunches by those being
used for the laser-off signal (and in the absence of any laser-
induced effect). The intensity on each subgroup changes by up
to 0.2% following each injection. This is substantially higher
than the 0.1% transient difference signal which we desire to
measure, but normalization takes care of these fluctuations.
3.5. Discussion and outlook
We have implemented a setup for TR XAS at the dynamics
beamline P01 of PETRA III with two key components, which
improve the data collection efficiency by a total of up to six
orders of magnitude. The first one is a MHz fiber amplifier
laser system with a 24 W average output power and an
adjustable repetition rate from 400 kHz to 15.6 MHz
synchronized to the RF frequency of the PETRA III storage
ring. Compared with a traditional kHz Ti :Sa laser system this
allows for a thousand-fold faster acquisition of laser-excited
XAS data in TFY mode. The second element is a MHz DAQ
system developed at European XFEL, which acts similar to a
gated integrator, but operates, in principle, up to the full RF of
PETRA III (500 MHz). Here we recorded X-ray spectra by
averaging typically �107 shots at 7.8 MHz, which were pre-
sorted according to laser-on and laser-off conditions. The APD
signal traces were sampled with 2 GS s�1 (and 12-bit) over the
APD pulse trace and the integration algorithm delivered a
reliable measure of each integrated single pulse intensity. We
have confirmed the linear operation of the entire DAQ
scheme and furthermore characterized in detail the linear
working regimes of the APD as a function of the bias voltage.
These measurements exploit the increased dynamic range of
this setup compared with standard single-photon-counting
techniques by about three orders of magnitude; overall, we
can achieve total fluorescence yield count rates up to
100 photons pulse�1 or >>108 photons s�1 at PETRA III in
60-bunch mode. Currently the limitation to measure even
higher photon numbers (>>100 photons pulse�1) with our
commercially pre-amplified APD is related to its fixed large
pre-amplifier gain and will be eliminated in the near-term by
implementing a switchable gain preamplifier. At even higher
photon fluxes (exceeding 104 photons pulse�1) the APD
without pre-amplifier should be able to reliably operate, and
we also use the internal APD gain (driven by the bias voltage)
to fine-tune the output trace to the desired voltage level on the
ADC input. This will enable the setup to be used at powerful
X-ray free-electron lasers, such as the European X-ray Free
Electron laser, which delivers even larger X-ray intensities
(1012 photons pulse�1) at 4.5 MHz, thus conveniently within
the specifications of the current setup.
Last but not least we have measured TR XANES spectra
with quasi static S/N of Fe-based spin transition systems next
to a weakly (UV light) absorbing Co complex. Comparing the
measurements of the MHz DAQ with those of a SPC DAQ
scheme shows that we can effectively decrease acquisition
times by a factor of 500 or acquire accordingly better TR
signals at equivalent acquisition times, which is quantitatively
fully in line with the corresponding reduced SPC intensity.
One next step will be to make use of the significant decrease
in acquisition time, e.g. for measuring TR XAS of samples
undergoing non-reversible dynamical changes. The increase
in S/N ratio will allow measuring TR XAS with very small
changes thus improving the sensitivity to even smaller light-
induced electronic and structural changes. Furthermore, we
will be able to measure transients with very small excited-state
fractions, allowing for decreased laser excitation energies, thus
performing ‘tickle-and-probe’ experiments under the same
laser excitation conditions used in laser-only pump–probe
experiments. Just recently, this setup has been complemented
by a multicrystal dispersive von Hamos X-ray emission spec-
trometer similar to a previously published one (Alonso-Mori
et al., 2012), which utilizes the MHz pump–probe scheme to
collect high-quality TR X-ray emission spectra as done by
Vanko et al. (2010, 2013).
Acknowledgements
This work is financed by the European XFEL by the Deutsche
Forschungsgemeinschaft (DFG) via SFB 925 (project A4), and
by the Hamburg Centre for Ultrafast Imaging (CUI). The
present MHz DAQ scheme was conceived by Christopher
Youngman from European XFEL, who equally engaged in its
first vital realisation steps. We thank Hans-Christian Wille for
advice in using APD detectors, Frank-Uwe Dill for help
during the setup of this experiment, Maria Teresa Nunez
Pardo de Vera and Andre Rothkirch for vital help debugging
software issues, and Dennis Gorries and Alke Meents for
fruitful discussions. AB acknowledges support from the
International Max Planck Research School for Ultrafast
Imaging and Structural Dynamics (IMPRS-UFAST), and we
acknowledge the European Cluster of Advanced Laser Light
Sources (EUCALL) within work packages PUCCA (CB) and
UFDAC (PG), which has received funding from the European
Union’s Horizon 2020 research and innovation programme
under grant agreement No 654220. Unless otherwise stated, all
figures are copyright by the authors under the terms of the
Creative Commons Attribution 4.0 International License. To
view a copy of this license, visit http://creativecommons.org/
research papers
J. Synchrotron Rad. (2016). 23, 1409–1423 Alexander Britz et al. � Multi-MHz single-shot data acquisition scheme 1421electronic reprint
licenses/by/4.0/ or send a letter to Creative Commons, PO Box
1866, Mountain View, CA 94042, USA.
References
Alonso-Mori, R., Kern, J., Sokaras, D., Weng, T. C., Nordlund, D.,Tran, R., Montanez, P., Delor, J., Yachandra, V. K., Yano, J. &Bergmann, U. (2012). Rev. Sci. Instrum. 83, 073114.
ALS (2015). Advanced Light Source Storage Ring Parameters, https://www-als.lbl.gov/index.php/beamlines/storage-ring-parameters.html.
Altarelli, M., Brinkmann, R., Chergui, M., Decking, W., Dobson, B.,Dusterer, S., Grubel, G., Graeff, W., Graafsma, H., Janos Hajdu,Jonathan Marangos, J. P., Redlin, H., Riley, D., Robinson, I.,Rossbach, J., Schwarz, A., Tiedtke, K., Tschentscher, T., Varta-niants, I., Wabnitz, H., Weise, H., Wichmann, R., Karl Witte, A. W.,Wulff, M. & Yurkov, M. (2006). The European X-ray Free-ElectronLaser. Technical Design Report DESY 2006–097, pp. 1–26. DESY,Hamburg, Germany.
Baron, A. Q. R., Kishimoto, S., Morse, J. & Rigal, J.-M. (2006).J. Synchrotron Rad. 13, 131–142.
Bergmann, U., Di Cicco, A., Wernet, P., Principi, E., Glatzel, P. &Nilsson, A. (2007). J. Chem. Phys. 127, 174504.
Bergmann, U., Glatzel, P. & Cramer, S. (2002). Microchem. J. 71, 221–230.
Borland, M., Decker, G., Emery, L., Guo, W., Harkay, K., Sajaev, V.& Yao, C.-Y. (2010). APS Storage Ring Parameters, http://www.aps.anl.gov/Accelerator_Systems_Division/Accelerator_Operations_Physics/SRparameters/SRparameters.html.
Bressler, C. & Chergui, M. (2004). Chem. Rev. 104, 1781–1812.Bressler, C., Gawelda, W., Galler, A., Nielsen, M. M., Sundstrom, V.,
Doumy, G., March, A. M., Southworth, S. H., Young, L. & Vanko,G. (2014). Faraday Discuss. 171, 169–178.
Bressler, C., Milne, C. J., Pham, V.-T., ElNahhas, A., van der Veen,R. M., Gawelda, W., Johnson, S. L., Beaud, P., Grolimund, D.,Kaiser, M., Borca, C. N., Ingold, G., Abela, R. & Chergui, M.(2009). Science, 323, 489–492.
Bressler, C., Saes, M., Chergui, M., Abela, R. & Pattison, P. (2001).Nucl. Instrum. Methods Phys. Res. A, 467–468, 1444–1446.
Cannizzo, A., Milne, C. J., Consani, C., Gawelda, W., Bressler, Ch.,van Mourik, F. & Chergui, M. (2010). Coord. Chem. Rev. 254, 2677–2686.
Canton, S., Zhang, X., Zhang, J., van Driel, T. B., Kjaer, K. S.,Haldrup, K., Chabera, P., Harlang, T., Suarez-Alcantara, K., Liu, Y.,Perez, J., Bordage, A., Papai, M., Vanko, G., Jennings, G., Kurtz,C. A., Rovezzi, M., Glatzel, P., Smolentsev, G., Uhlig, J., Dohn,A. O., Christensen, M., Galler, A., Gawelda, W., Bressler, C.,Lemke, H. T., Møller, K. B., Nielsen, M. M., Lomoth, R.,Warnmark, K. & Sundstrom, V. (2013). J. Phys. Chem. Lett. 4,1972–1976.
Chen, L. X., Jager, W. J., Jennings, G., Gosztola, D. J., Munkholm, A.& Hessler, J. P. (2001). Science, 292, 262–264.
Feikes, J., von Hartrott, M., Wustefeld, G., Hoehl, A., Klein, R.,Muller, R. & Ulm, G. (2009). Proceedings of the 23rd ParticleAccelerator Conference (PAC09), Vancouver, BC, Canada.
Fister, T. T., Nagle, K. P., Vila, F. D., Seidler, G. T., Hamner, C., Cross,J. O. & Rehr, J. J. (2009). Phys. Rev. B, 79, 174117.
Gawelda, W., Bressler, C., Saes, M., Kaiser, M., Tarnovsky, A.,Grolimund, D., Johnson, S. L., Abela, R. & Chergui, M. (2005).Phys. Scr. T115, 102–106.
Gawelda, W., Cannizzo, A., Pham, V.-T., van Mourik, F., Bressler, C.& Chergui, M. (2007). J. Am. Chem. Soc. 129, 8199–8206.
Gawelda, W., Pham, V.-T., Benfatto, M., Zaushitsyn, Y., Kaiser, M.,Grolimund, D., Johnson, S., Abela, R., Hauser, A., Bressler, C. &Chergui, M. (2007). Phys. Rev. Lett. 98, 057401.
Gawelda, W., Pham, V.-T., van der Veen, R. M., Grolimund, D.,Abela, R., Chergui, M. & Bressler, C. (2009). J. Chem. Phys. 130,124520.
Goeries, D., Dicke, B., Roedig, P., Stube, N., Meyer, J., Galler, A.,Gawelda, W., Britz, A., Geßler, P., Sotoudi Namin, H., Beckmann,A., Schlie, M., Warmer, M., Naumova, M., Bressler, C., Rubhausen,M., Weckert, E. & Meents, A. (2016). Rev. Sci. Instrum. 87, 053116.
Haldrup, K., Vanko, G., Gawelda, W., Galler, A., Doumy, G., March,A. M., Kanter, E. P., Bordage, A., Dohn, A., van Driel, T. B., Kjaer,K. S., Lemke, H. T., Canton, S. E., Uhlig, J., Sundstrom, V., Young,L., Southworth, S. H., Nielsen, M. M. & Bressler, C. (2012). J. Phys.Chem. A, 116, 9878–9887.
Heimann, P. A., Lindenberg, A. M., Kang, I., Johnson, S., Missalla, T.,Chang, Z., Falcone, R. W., Schoenlein, R. W., Glover, T. E. &Padmore, H. A. (2001). Nucl. Instrum. Methods Phys. Res. A, 467–468, 986–989.
Ibrahimkutty, S., Issenmann, D., Schleef, S., Muller, A.-S., Mathis,Y.-L., Gasharova, B., Huttel, E., Steininger, R., Gottlicher, J.,Baumbach, T., Bartels, A., Janke, C. & Plech, A. (2011). J.Synchrotron Rad. 18, 539–545.
Issenmann, D., Ibrahimkutty, S., Steininger, R., Gottlicher, J.,Baumbach, T., Hiller, N., Muller, A.-S. & Plech, A. (2013). J. Phys.Conf. Ser. 425, 092007.
Jaklevic, J., Kirby, J. A., Klein, M. P., Robertson, A. S., Brown, G. S. &Eisenberger, P. (1977). Solid State Commun. 23, 679–682.
Jamula, L. L., Brown, A. M., Guo, D. & McCusker, J. K. (2014). Inorg.Chem. 53, 15–17.
Ketenoglu, D., Harder, M., Klementiev, K., Upton, M., Taherkhani,M., Spiwek, M., Dill, F.-U., Wille, H.-C. & Yavas, H. (2015). J.Synchrotron Rad. 22, 961–967.
Krisch, M. & Sette, F. (2002). Surf. Rev. Lett. 09, 969–976.Larsson, J., Heimann, P. A., Lindenberg, A. M., Schuck, P. J.,
Bucksbaum, P. H., Lee, R. W., Padmore, H. A., Wark, J. S. &Falcone, R. W. (1998). Appl. Phys. Mater. Sci. Process. 66, 587–591.
Lima, F., Milne, C. J., Amarasinghe, D. C. V., Rittmann-Frank, M. H.,van der Veen, R. M., Reinhard, M., Pham, V., Karlsson, S., Johnson,S. L., Grolimund, D., Borca, C., Huthwelker, T., Janousch, M., vanMourik, F., Abela, R. & Chergui, M. (2011). Rev. Sci. Instrum. 82,063111.
Lindenberg, A., Kang, I., Johnson, S., Missalla, T., Heimann, P.,Chang, Z., Larsson, J., Bucksbaum, P., Kapteyn, H., Padmore, H.,Lee, R., Wark, J. & Falcone, R. (2000). Phys. Rev. Lett. 84, 111–114.
March, A. M., Assefa, T. A., Bressler, C., Doumy, G., Galler, A.,Gawelda, W., Kanter, E. P., Nemeth, Z., Papai, M., Southworth,S. H., Young, L. & Vanko, G. (2015). J. Phys. Chem. C, 119, 14571–14578.
March, A. M., Stickrath, A., Doumy, G., Kanter, E. P., Krassig, B.,Southworth, S. H., Attenkofer, K., Kurtz, C., Chen, L. X. & Young,L. (2011). Rev. Sci. Instrum. 82, 073110.
Milder, S. J., Gray, H. B. & Miskowski, V. M. (1984). J. Am. Chem.Soc. 106, 3764–3767.
Milne, C., Pham, V., Gawelda, W., Nahhas, A. E., van der Veen, R. M.,Johnson, S. L., Beaud, P., Ingold, G., Borca, C., Grolimund, D.,Abela, R., Chergui, M. & Bressler, Ch. (2010). Acta Phys. Pol. A,117, 391–393.
Navirian, H., Shayduk, R., Leitenberger, W., Goldshteyn, J., Gaal, P.& Bargheer, M. (2012). Rev. Sci. Instrum. 83, 063303.
Neutze, R., Wouts, R., Techert, S., Davidsson, J., Kocsis, M.,Kirrander, A., Schotte, F. & Wulff, M. (2001). Phys. Rev. Lett. 87,195508.
Nishazawa, M. & Ford, P. C. (1981). Inorg. Chem. 20, 294–295.PETRA III (2015). Machine Parameters PETRA III (Design Values),
1422 Alexander Britz et al. � Multi-MHz single-shot data acquisition scheme J. Synchrotron Rad. (2016). 23, 1409–1423
electronic reprint
Reusch, T., Osterhoff, M., Agricola, J. & Salditt, T. (2014). J.Synchrotron Rad. 21, 708–715.
Rohlsberger, R., Wille, H.-C., Schlage, K. & Sahoo, B. (2012). Nature(London), 482, 199–203.
Saes, M., Bressler, C., Abela, R., Grolimund, D., Johnson, S.,Heimann, P. & Chergui, M. (2003). Phys. Rev. Lett. 90, 047403.
Saes, M., Gawelda, W., Kaiser, M., Tarnovsky, A., Bressler, C.,Chergui, M., Johnson, S. L., Grolimund, D. & Abela, R. (2003).Synchrotron Radiat. News. 16, 12–20.
Saes, M., van Mourik, F., Gawelda, W., Kaiser, M., Chergui, M.,Bressler, C., Grolimund, D., Abela, R., Glover, T. E., Heimann,P. A., Schoenlein, R. W., Johnson, S. L., Lindenberg, A. M. &Falcone, R. W. (2004). Rev. Sci. Instrum. 75, 24.
Sahle, Ch. J., Mirone, A., Niskanen, J., Inkinen, J., Krisch, M. &Huotari, S. (2015). J. Synchrotron Rad. 22, 400–409.
Scandola, M. A. & Scandola, F. (1971). J. Am. Chem. Soc. 2589, 1805–1810.
Schotte, F., Lim, M., Jackson, T., Smirnov, A. V., Soman, J., Olson,J. S., Phillips, G. N., Wulff, M. & Anfinrud, P. A. (2003). Science, 300,1944–1947.
Schroder, H.-C., Affeldt, A., Gausepohl, H.-P., Kub, G. & Prieb, G.(2011). Proceedings of the 10th European Workshop on BeamDiagnostics and Instrumentation for Particle Accelerators (DIPAC2011), Hamburg, Germany.
Smolentsev, G. & Sundstrom, V. (2015). Coord. Chem. Rev. 304–305,117–132.
Soleil (2015). Soleil Sources and Accelerators, http://www.synchrotron-soleil.Fr/portal/page/portal/SourceAccelerateur.
Stamm, C., Kachel, T., Pontius, N., Mitzner, R., Quast, T., Holldack,K., Khan, S., Lupulescu, C., Aziz, E. F., Wietstruk, M., Durr, H. A.& Eberhardt, W. (2007). Nat. Mater. 6, 740–743.
Stebel, L., Malvestuto, M., Capogrosso, V., Sigalotti, P., Ressel, B.,Bondino, F., Magnano, E., Cautero, G. & Parmigiani, F. (2011). Rev.Sci. Instrum. 82, 123109.
Stern, E. A., Brewe, D. L., Beck, K. M., Heald, S. M. & Feng, Y.(2005). Phys. Scr. T115, 1044–1046.
Sternemann, C., Sternemann, H., Huotari, S., Lehmkuhler, F., Tolan,M. & Tse, J. S. (2008). J. Anal. At. Spectrom. 23, 807.
Thompson, A., Attwood, D., Gulliksen, E., Howells, M., Kim, K.-J.,Kirz, J., Kortright, J., Lindau, I., Liu, Y., Pianetta, P., Robinson, A.,Scofield, J., Underwood, J., Williams, G. & Winick, H. (2009). X-rayData Booklet. Lawrence Berkeley National Laboratory, Berkeley,CA, USA.
Vanko, G., Bordage, A., Glatzel, P., Gallo, E., Rovezzi, M., Gawelda,W., Galler, A., Bressler, C., Doumy, G., March, A. M., Kanter, E. P.,Young, L., Southworth, S. H., Canton, S. E., Uhlig, J., Smolentsev,G., Sundstrom, V., Haldrup, K., van Driel, T. B., Nielsen, M. M.,Kjaer, K. S. & Lemke, H. T. (2013). J. Electron Spectrosc. Relat.Phenom. 188, 166–171.
Vanko, G., Bordage, A., Papai, M., Haldrup, K., Glatzel, P., March,A. M., Doumy, G., Britz, A., Galler, A., Assefa, T. A., Cabaret, D.,Juhin, A., van Driel, T. B., Kjaer, K. S., Dohn, A. O., Møller, K. B.,Lemke, H. T., Gallo, E., Rovezzi, M., Nemeth, Z., Rozsalyi, E.,Rozgonyi, T., Uhlig, J., Sundstrom, V., Nielsen, M. M., Young, L.,Southworth, S. H., Bressler, C. & Gawelda, W. (2015). J. Phys.Chem. C, 119, 5888–5902.
Vanko, G., Glatzel, P., Pham, V.-T., Abela, R., Grolimund, D., Borca,C. N., Johnson, S. L., Milne, C. J. & Bressler, C. (2010). Angew.Chem. Int. Ed. 49, 5910–5912.
Vanko, G., Neisius, T., Molnar, G., Renz, F., KARPati, S., Shukla, A.& de Groot, F. M. F. (2006). J. Phys. Chem. B, 110, 11647–11653.
Wille, H.-C., Franz, H., Rohlsberger, R., Caliebe, W. & Dill, F. (2010).J. Phys. Conf. Ser. 217, 012008.
Wulff, M., Schotte, F., Naylor, G., Bourgeois, D., Moffat, K. &Mourou, G. (1997). Nucl. Instrum. Methods Phys. Res. A, 398, 69–84.
Zaouter, Y., Boullet, J., Mottay, E. & Cormier, E. (2008). Opt. Lett. 33,1527–1529.
Zhang, X., Lawson Daku, M. L., Zhang, J., Suarez-Alcantara, K.,Jennings, G., Kurtz, C. A. & Canton, S. E. (2015). J. Phys. Chem. C,119, 3312–3321.
research papers
J. Synchrotron Rad. (2016). 23, 1409–1423 Alexander Britz et al. � Multi-MHz single-shot data acquisition scheme 1423electronic reprint