+ All Categories
Home > Documents > A multi-scale seismic response of two-dimensional sedimentary ...

A multi-scale seismic response of two-dimensional sedimentary ...

Date post: 05-Jan-2017
Category:
Upload: voanh
View: 217 times
Download: 1 times
Share this document with a friend
16
HAL Id: hal-00667869 https://hal-enpc.archives-ouvertes.fr/hal-00667869 Submitted on 20 Feb 2013 HAL is a multi-disciplinary open access archive for the deposit and dissemination of sci- entific research documents, whether they are pub- lished or not. The documents may come from teaching and research institutions in France or abroad, or from public or private research centers. L’archive ouverte pluridisciplinaire HAL, est destinée au dépôt et à la diffusion de documents scientifiques de niveau recherche, publiés ou non, émanant des établissements d’enseignement et de recherche français ou étrangers, des laboratoires publics ou privés. A multi-scale seismic response of two-dimensional sedimentary valleys due to the combined effects of topography and geology. Behrouz Gatmiri, Solenn Le Pense, Pooneh Maghoul To cite this version: Behrouz Gatmiri, Solenn Le Pense, Pooneh Maghoul. A multi-scale seismic response of two- dimensional sedimentary valleys due to the combined effects of topography and geology.. Journal of Multiscale Modeling, 2011, 3 (3), pp.133-149. <10.1142/S1756973711000455>. <hal-00667869>
Transcript

HAL Id: hal-00667869https://hal-enpc.archives-ouvertes.fr/hal-00667869

Submitted on 20 Feb 2013

HAL is a multi-disciplinary open accessarchive for the deposit and dissemination of sci-entific research documents, whether they are pub-lished or not. The documents may come fromteaching and research institutions in France orabroad, or from public or private research centers.

L’archive ouverte pluridisciplinaire HAL, estdestinée au dépôt et à la diffusion de documentsscientifiques de niveau recherche, publiés ou non,émanant des établissements d’enseignement et derecherche français ou étrangers, des laboratoirespublics ou privés.

A multi-scale seismic response of two-dimensionalsedimentary valleys due to the combined effects of

topography and geology.Behrouz Gatmiri, Solenn Le Pense, Pooneh Maghoul

To cite this version:Behrouz Gatmiri, Solenn Le Pense, Pooneh Maghoul. A multi-scale seismic response of two-dimensional sedimentary valleys due to the combined effects of topography and geology.. Journalof Multiscale Modeling, 2011, 3 (3), pp.133-149. <10.1142/S1756973711000455>. <hal-00667869>

c©February 20, 2013 11:39 WSPC/INSTRUCTION FILE multiscalepaper

Electronic version of an article published as :

Journal of Multiscale Modelling, 03, 2011, pp 133-149

DOI: 10.1142/S1756973711000455

c©World Scientific Publishing Compagny

http://www.worldscientific.com/worldscinet/jmm

A MULTI-SCALE SEISMIC RESPONSE OF TWO-DIMENSIONAL

SEDIMENTARY VALLEYS DUE TO THE COMBINED EFFECTS

OF TOPOGRAPHY AND GEOLOGY

B. GATMIRI

Department of Civil Engineering, University of Tehran, P.O. Box 11365-4563Tehran, Iran

ANDRA, Direction Scientifique, Parc de la Croix Blanche, 1-7 rue Jean Monnet92298 Chatenay-Malabry, France

Universite Paris-Est, Laboratoire Navier (ENPC/IFSTTAR/CNRS), Ecole des PontsParisTech, 6 & 8 Avenue Blaise Pascal,

77455 Marne la Vallee, France

S. LE PENSE

Universite Paris-Est, Laboratoire Navier (ENPC/IFSTTAR/CNRS), Ecole des PontsParisTech, 6 & 8 Avenue Blaise Pascal,

77455 Marne la Vallee, France ∗

P. MAGHOUL

Universite Paris-Est, Laboratoire Navier (ENPC/IFSTTAR/CNRS), Ecole des PontsParisTech, 6 & 8 Avenue Blaise Pascal,

77455 Marne la Vallee, France

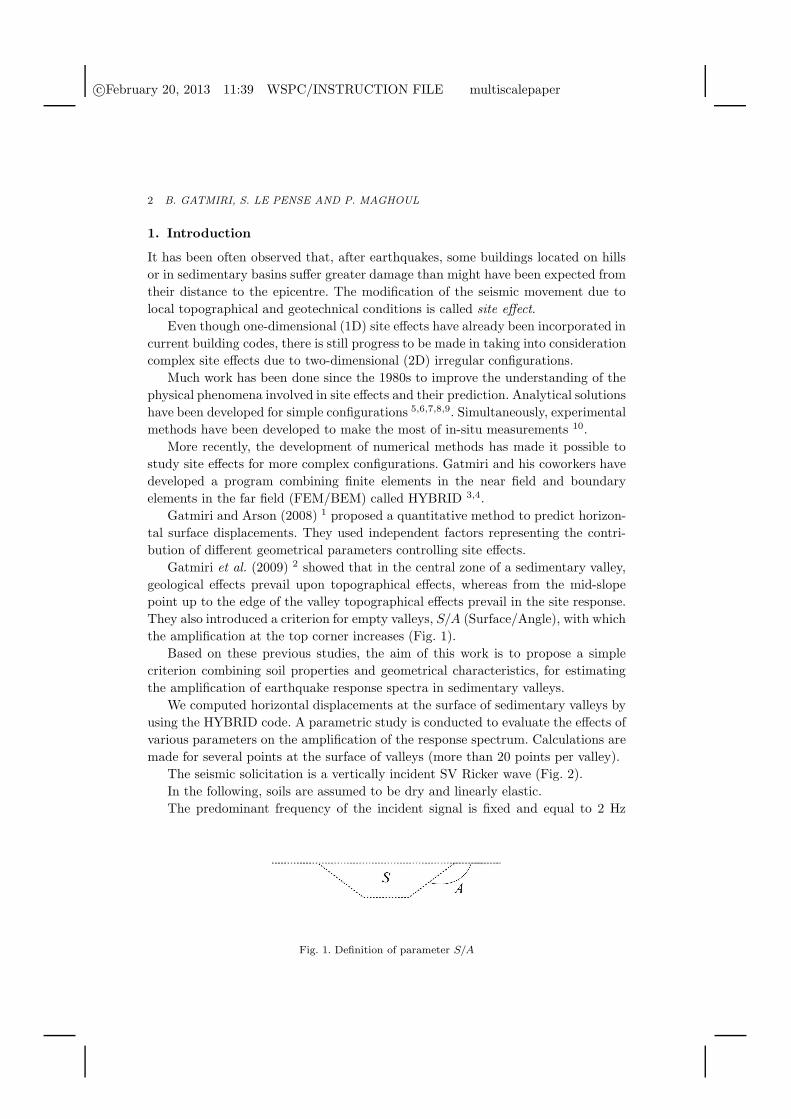
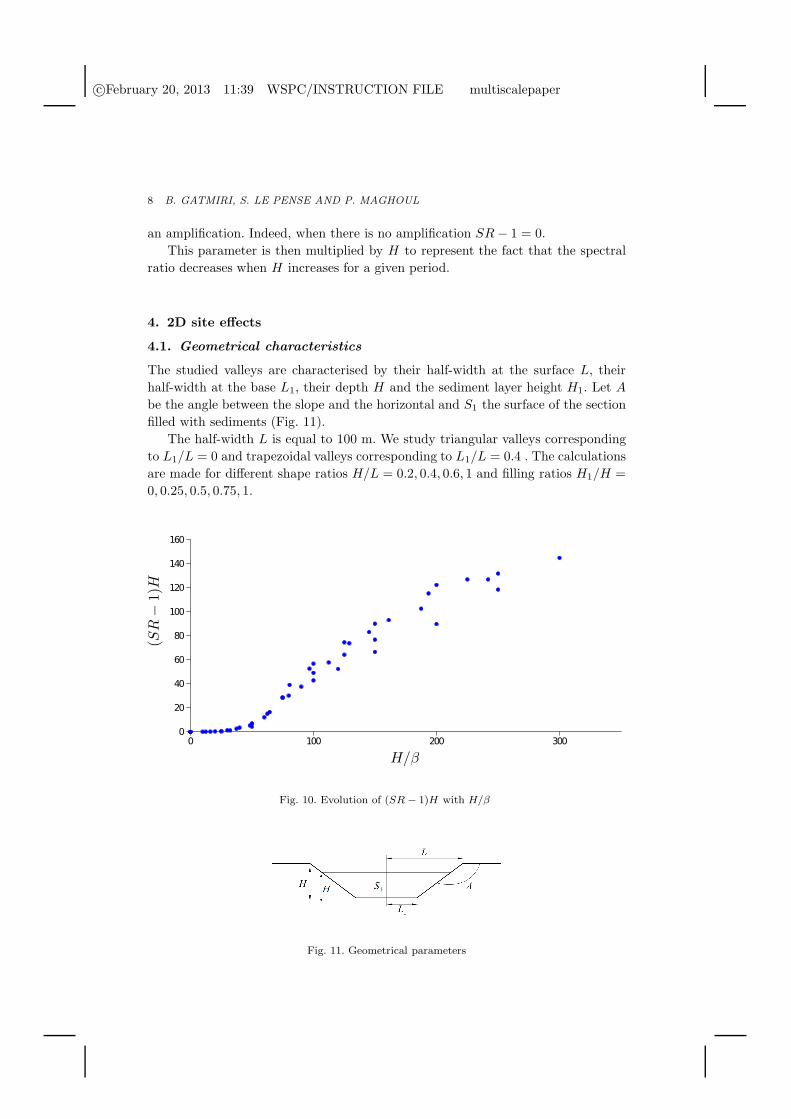
It is well-known that the response of a site to seismic excitation depends on the localtopographical and geological conditions. The current building codes already take intoaccount unidimensional site effects but ignore complex site effects due to two-dimensionalirregular configurations. The aim of this work is to contribute to the establishment ofa simple predictive method to estimate site effects. The horizontal ground movementsat the surface of sedimentary valleys subjected to SV waves with vertical incidence are

calculated by using the HYBRID program, combining finite elements in the near fieldand boundary elements in the far field (FEM/BEM). A parametric study is conductedto examine the combined effects of topography and geology on the amplification ofthe response spectrum at various points across the valley. The influence of differentparameters is considered, such as filling ratios (from empty to full valleys), impedancecontrasts between bedrock and sediments, and dimensions.

Keywords: Seismic site effect; Seismic amplification; Building codes; Seismic responsespectrum; Hybrid numerical method; Sedimentary valley; 2D configurations

∗Universite Paris-Est, Laboratoire Navier (ENPC/IFSTTAR/CNRS), Ecole des Ponts ParisTech,6 & 8 Avenue Blaise Pascal, 77455 Marne la Vallee, France. [email protected]

1

c©February 20, 2013 11:39 WSPC/INSTRUCTION FILE multiscalepaper

2 B. GATMIRI, S. LE PENSE AND P. MAGHOUL

1. Introduction

It has been often observed that, after earthquakes, some buildings located on hills

or in sedimentary basins suffer greater damage than might have been expected from

their distance to the epicentre. The modification of the seismic movement due to

local topographical and geotechnical conditions is called site effect.

Even though one-dimensional (1D) site effects have already been incorporated in

current building codes, there is still progress to be made in taking into consideration

complex site effects due to two-dimensional (2D) irregular configurations.

Much work has been done since the 1980s to improve the understanding of the

physical phenomena involved in site effects and their prediction. Analytical solutions

have been developed for simple configurations 5,6,7,8,9. Simultaneously, experimental

methods have been developed to make the most of in-situ measurements 10.

More recently, the development of numerical methods has made it possible to

study site effects for more complex configurations. Gatmiri and his coworkers have

developed a program combining finite elements in the near field and boundary

elements in the far field (FEM/BEM) called HYBRID 3,4.

Gatmiri and Arson (2008) 1 proposed a quantitative method to predict horizon-

tal surface displacements. They used independent factors representing the contri-

bution of different geometrical parameters controlling site effects.

Gatmiri et al. (2009) 2 showed that in the central zone of a sedimentary valley,

geological effects prevail upon topographical effects, whereas from the mid-slope

point up to the edge of the valley topographical effects prevail in the site response.

They also introduced a criterion for empty valleys, S/A (Surface/Angle), with which

the amplification at the top corner increases (Fig. 1).

Based on these previous studies, the aim of this work is to propose a simple

criterion combining soil properties and geometrical characteristics, for estimating

the amplification of earthquake response spectra in sedimentary valleys.

We computed horizontal displacements at the surface of sedimentary valleys by

using the HYBRID code. A parametric study is conducted to evaluate the effects of

various parameters on the amplification of the response spectrum. Calculations are

made for several points at the surface of valleys (more than 20 points per valley).

The seismic solicitation is a vertically incident SV Ricker wave (Fig. 2).

In the following, soils are assumed to be dry and linearly elastic.

The predominant frequency of the incident signal is fixed and equal to 2 Hz

Fig. 1. Definition of parameter S/A

c©February 20, 2013 11:39 WSPC/INSTRUCTION FILE multiscalepaper

SEISMIC RESPONSE OF TWO-DIMENSIONAL SEDIMENTARY VALLEYS 3

(Fig. 3).

The reference is taken as the scattering of the Ricker incident wave on a flat

bedrock surface.

2. Method

A very common representation of seismic movement used by engineers is the re-

sponse spectrum. This is a plot of the maximum response of a family of damped

single-degree-of-freedom oscillators to earthquake ground motion. The pseudo-

acceleration response spectrum gives an estimation of the maximum acceleration

at the base of the building as a function of the natural period of the oscillator Tn.

For each case, we calculate the earthquake response spectrum with 5% damping

and compare it with the reference spectrum (Fig. 4). The spectral ratio, SR, is

defined as the maximum ratio between the pseudo-acceleration SA and the pseudo-

acceleration of the reference spectrum SAR , for Tn between 0.1 to 1 second. The

site period, Ts, is defined as the natural period for which this ratio SA/SAR reaches

its peak.

3. 1D site effects

3.1. Soil properties

The mechanical parameters for sediments and bedrock are given in Table 1.

Fig. 2. Incident Ricker signalFig. 3. Fourier transform of the reference dis-placement

��� ��� ��� ��� ��� ���

�ABCD

E

F

��A����D

Fig. 4. Elastic acceleration response spectrum with 5 % damping of the reference signal

c©February 20, 2013 11:39 WSPC/INSTRUCTION FILE multiscalepaper

4 B. GATMIRI, S. LE PENSE AND P. MAGHOUL

The impedance contrast between sediments and bedrock characterises the soil

properties “Eq. (1)”.

β =ρsCs

ρrCr

(1)

Table 1. Mechanical parameters of materials

E (MPa) K (MPa) ν G (MPa) ρ (T/m3) C (m/s) β

Bedrock 6 720 11 200 0.4 2 400 2.45 990

382 318 0.3 147 1.63 300 0.2

Sediments 899 750 0.3 346 1.63 461 0.3

1 527 1 272 0.3 587 1.63 600 0.4

2 385 1 988 0.3 917 1.63 750 0.5

Note:

E Young’s modulus (MPa)K Bulk modulus (MPa)ν Poisson’s ratioG Shear modulus (MPa)ρ Density (T/m3)C Wave velocity (m/s)β Impedance contrast between sediments and bedrockρs Soil density (T/m3)Cs Shear wave velocity in sediments (m/s)ρr Bedrock density (T/m3)Cr Shear wave velocity in bedrock (m/s)

3.2. Analytical solution

In the first place, we consider the simple case of an horizontal soil layer over a

semi-infinite elastic space submitted to an harmonic plane S wave. We know the

analytical formula of the ratio between the displacements at the surface point A

Fig. 5. 1D site effect of a soil layer on a bedrock

c©February 20, 2013 11:39 WSPC/INSTRUCTION FILE multiscalepaper

SEISMIC RESPONSE OF TWO-DIMENSIONAL SEDIMENTARY VALLEYS 5

and at point B located at the interface between the soil layer and bedrock “Eq. (2)”

(Fig. 5).

uA

uB

=1

cos2(ks ·H) + β2 · sin2(ks ·H)(2)

• H is the soil layer height.

• ks =2πfcCs

is the wavenumber where Cs is the shear wave velocity in sediments

and fc is the predominant frequency of the input signal.

• β is the impedance contrast between sediments and bedrock.

The maximum amplification takes place for specific frequencies. “Eq. (3, 4)”

fn = (2n+ 1)Cs

4H(3)

(

uA

uB

)

max

=1

α(4)

3.3. Site period Ts

We study the seismic response of horizontal soil layers with various heights and

impedance contrasts. The height H varies from 10m to 100m and the impedance

contrast β varies from 0.2 to 0.5.

Concerning the site period, we notice that, when H increases for a fixed β, Ts

first increases. If H keeps increasing, Ts goes back to lower periods (Fig. 6).

Similarly, when β decreases for a fixed H , Ts increases (Fig. 7).

��� ��� ��� ��� ��� ���

�ABCD

��

��

E�

F�AB��C�D

���������

��AB

��CAB

��DAB

��EAB

��FAB

���AB

���FB

��AAB

Fig. 6. Effect of height on response spectra (β = 0.2)

c©February 20, 2013 11:39 WSPC/INSTRUCTION FILE multiscalepaper

6 B. GATMIRI, S. LE PENSE AND P. MAGHOUL

If we suppose that the maximum amplification of the earthquake spectrum takes

place for the natural period corresponding to the fundamental frequency of the soil

layer, we obtain an analytical value of Ts as a function of H and β. “Eq. (5)”

Ts =1

f0=

4H

Cs

=4ρsρrCr

H

β= 0.0027

H

β(5)

For cases for which the amplification is significant, Fig. 8 shows the evolution of

Ts with H/β in comparison with the theoretical model Ts = 0.0027H/β

For values of H/β from 65 to 300, our set of data is very close to the theoretical

�ABCD

��

��

E�

F�AB��C�D

���������

���ABCD

���ABCE

���ABCE

���ABCF

Fig. 7. Effect of impedance contrast on response spectra (H = 40 m)

Fig. 8. Evolution of Ts with H/β

c©February 20, 2013 11:39 WSPC/INSTRUCTION FILE multiscalepaper

SEISMIC RESPONSE OF TWO-DIMENSIONAL SEDIMENTARY VALLEYS 7

model.

These values of H/β correspond to soil layers with fundamental frequencies

between 1.2 and 5.8 Hz, which are the frequencies included into the incident signal

(Fig. 3).

For higher frequencies (lower values of H/β) which are absent from the inci-

dent signal, the amplification is very weak. It does not allow us to determine an

appropriate site period Ts.

Lower frequencies (higher values of H/β) correspond to the cases for which the

site period Ts goes back to low period, for high values of H and low values of β.

These frequencies being rare in the incident signal, this phenomenon may be due to

a resonance of the soil layer on a second mode. From now on we will ignore these

cases.

As can be seen in Fig. 8, the correlation between our data and the theory is

good enough to validate our model.

3.4. Spectral ratio

For a constant site period Ts the amplitude of response spectra decreases when β

increases (Fig. 9) and when H increases (since these two parameters are linked by

Eq. (5)).

We want to represent on the same graph the spectral ratios for the different soil

layers, in order to give an estimation of the spectral ratio knowing H and β.

We choose to represent the parameter H/β which controls the site period Ts on

the x-axis, and the parameter (SR− 1)H on the y-axis (Fig. 10).

The parameter (SR − 1) allows us to visualise directly whether or not there is

�ABCD

��

��

E�

F�AB��C�D

Fig. 9. Acceleration response spectra of 1D soil layers (Black: reference; blue: β = 0.2; yellow:β = 0.3; red: β = 0.4

c©February 20, 2013 11:39 WSPC/INSTRUCTION FILE multiscalepaper

8 B. GATMIRI, S. LE PENSE AND P. MAGHOUL

an amplification. Indeed, when there is no amplification SR− 1 = 0.

This parameter is then multiplied by H to represent the fact that the spectral

ratio decreases when H increases for a given period.

4. 2D site effects

4.1. Geometrical characteristics

The studied valleys are characterised by their half-width at the surface L, their

half-width at the base L1, their depth H and the sediment layer height H1. Let A

be the angle between the slope and the horizontal and S1 the surface of the section

filled with sediments (Fig. 11).

The half-width L is equal to 100 m. We study triangular valleys corresponding

to L1/L = 0 and trapezoidal valleys corresponding to L1/L = 0.4 . The calculations

are made for different shape ratios H/L = 0.2, 0.4, 0.6, 1 and filling ratios H1/H =

0, 0.25, 0.5, 0.75, 1.

Fig. 10. Evolution of (SR − 1)H with H/β

Fig. 11. Geometrical parameters

c©February 20, 2013 11:39 WSPC/INSTRUCTION FILE multiscalepaper

SEISMIC RESPONSE OF TWO-DIMENSIONAL SEDIMENTARY VALLEYS 9

4.2. Spatial evolution

First, we study the evolution of the spectral ratio with the spatial location of the

studied point. The spectral ratio is represented as a function of the non-dimensional

offset variable x/L for different configurations.

By increasing the filling ratio, we go from empty valley behaviour with a max-

imum amplification at the edge of the valley to fully-filled valley behaviour with

maximum amplification at the centre of the valley. For a quarter-filled valley the

behaviour is the same as that of an empty valley (Fig. 12).

For intermediate filling ratios, there is a local maximum at the edge of the valley,

a local maximum at the centre of the valley and a minimum at the contact point

between sediments and bedrock. There is also a decrease of the spectral ratio by

moving away from the valley (Fig. 13).

From now on, we will study those three specific points :

• Edge of the valley (x/L = 1)

• Contact point sediments/bedrock

• Centre of the valley (x/L = 0)

4.3. Topographical effect, edge of the valley

For empty valleys, the maximum amplification takes place at the edge of the valley.

It increases with the shape ratio. Trapezoidal valleys entail higher amplifications

than triangular valleys (Fig. 14 and 15).

Gatmiri et al. (2009)2 proposed a criteria S/A with which the spectral ratio at

the edge increases (Fig. 1). Our numerical results follow this criteria (Fig. 16).

� � � �

���

AB

������

���������

��������

��������

������

Fig. 12. Spatial evolution of spectral ratio for various filling ratios (trapezoidal valley with H/L =0.6 and β = 0.3)

c©February 20, 2013 11:39 WSPC/INSTRUCTION FILE multiscalepaper

10 B. GATMIRI, S. LE PENSE AND P. MAGHOUL

We also notice that the spectral ratio at the edge is higher for empty valleys

compared to partially-filled ones (Fig. 12). This is verified for every dimension and

geometry of valleys and soil properties.

Fig. 13. Response spectrum evolution along a trapezoidal valley (H/L = 0.6, H1/H = 0.5, β = 0.3)(Reference spectrum in black)

� � � �

���

���

��

���

��

���

��

AB

�������

�������

������

����A

Fig. 14. Triangular empty valleys

� � � �

���

���

��

���

��

���

��

AB

�������

�������

������

����A

Fig. 15. Trapezoidal empty valleys

� �� �� �� �� ��� ��� ���

���

���

���

���

���

���

���

��

����ABCD

��B�EF�

Fig. 16. Evolution of spectral ratio at the edge with S/A for empty valleys

c©February 20, 2013 11:39 WSPC/INSTRUCTION FILE multiscalepaper

SEISMIC RESPONSE OF TWO-DIMENSIONAL SEDIMENTARY VALLEYS 11

4.4. Contact point sediments/bedrock

At the contact point between sediments and bedrock of partially-filled valleys, the

spectral ratio is always lower than that of the corresponding empty valley with

the same dimensions. It means that from this point up to the edge of the valley,

topographical effects prevail upon geological effects. So, for points which are located

on the rock (i.e. outside the area filled with sediments), it is possible to consider

only the topographical site effect due to an empty valley. The response spectra

calculated by this method will always be higher than the ones of the real cases.

We verify that the response spectra at this specific point of deep or shallow,

fully or quarterly-filled valleys are lower than the ones of equivalent empty valleys

(Fig. 17, 18, 19 and 20 )

4.5. Centre of the valley

4.5.1. Envelope of response spectra

For the different configurations, all the acceleration response spectra calculated at

the central point of the valleys are represented on the same graph (Fig. 21).

If there is an attenuation of some spectra for low periods due to topographical

effect, it is not significant compared to the amplification of other spectra. So, we

will not study the attenuation cases afterwards.

��� ��� ��� ��� ��� ���

�ABCD

E

F

��AB��C�D

���������

���ABCD

���ABCE

���ABCE

���ABCF

Fig. 17. H1/H = 0.25, H/L = 0.2, x/L =0.55

��� ��� ��� ��� ��� ���

�ABCD

E

F

��AB��C�D

���������

���ABCD

���ABCE

���ABCE

���ABCF

Fig. 18. H1/H = 0.25, H/L = 1, x/L = 0.55

��� ��� ��� ��� ��� ���

�ABCD

E

F

��AB��C�D

���������

���ABCD

���ABCE

���ABCE

���ABCF

Fig. 19. H1/H = 1, H/L = 0.2, x/L = 1

��� ��� ��� ��� ��� ���

�ABCD

��

��

��

��

EFAB��C�D

���������

���ABCD

���ABCE

���ABCE

���ABCF

Fig. 20. H1/H = 1, H/L = 1, x/L = 1

c©February 20, 2013 11:39 WSPC/INSTRUCTION FILE multiscalepaper

12 B. GATMIRI, S. LE PENSE AND P. MAGHOUL

4.5.2. Site period

Following the same method as for 1D soil layers, we want to define a criterion

allowing an estimation of the site period for configurations with a significant am-

plification.

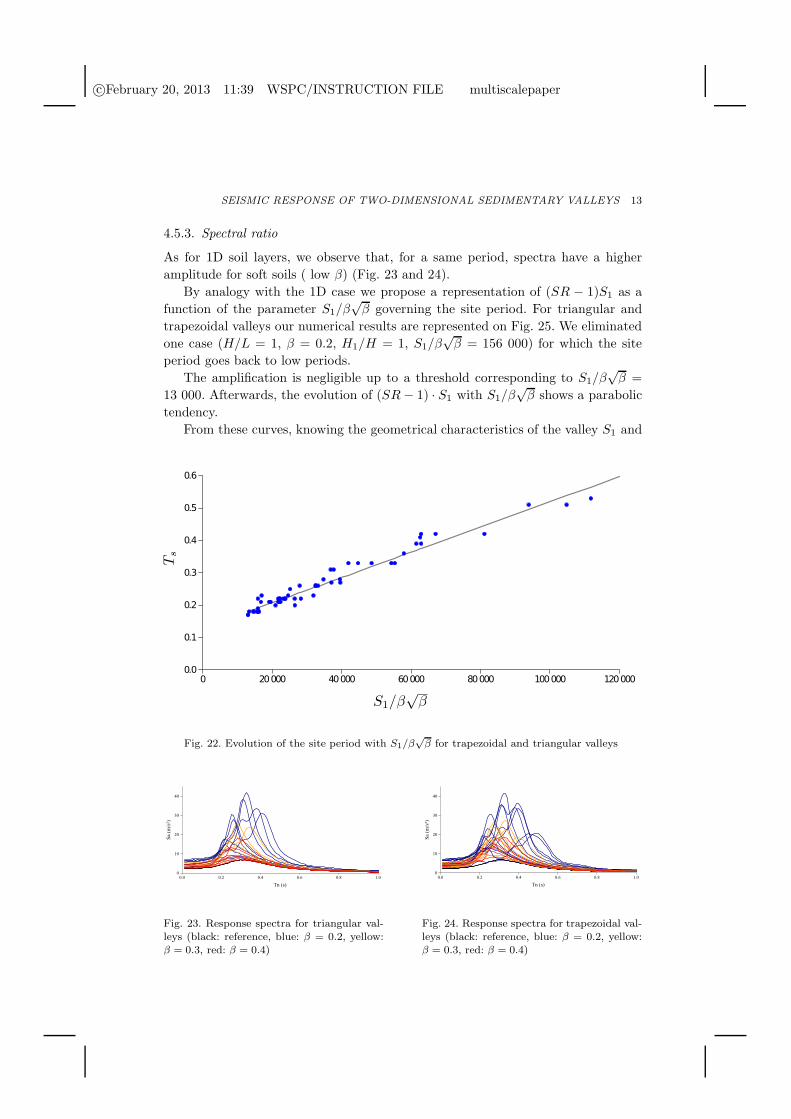
We propose to study the evolution of the site period with the parameter S1/β√β

which combines the soil properties (β) and the geometrical characteristics (S1) (Fig.

22).

An example of values taken by S1/β√β are given in Table 2.

Table 2. Values taken by S1/β√β for trapezoidal valleys with different shape ratios and filling ratios,

β = 0.3

We study the case for which 13 000 < S1/β√β < 120 000

For S1/β√β < 13 000 the amplification is not significant enough to determine

a representative site period Ts.

For S1/β√β > 120 000, we ignore the case corresponding to H/L = 1, β = 0.2,

H1/H = 1 and β√β = 156 000 for which the site period goes back to low periods.

We observe a linear evolution of Ts with S1/β√β (Fig. 22).

��� ��� ��� ��� ��� ���

�ABCD

��

��

E�

��

F�AB��C�D

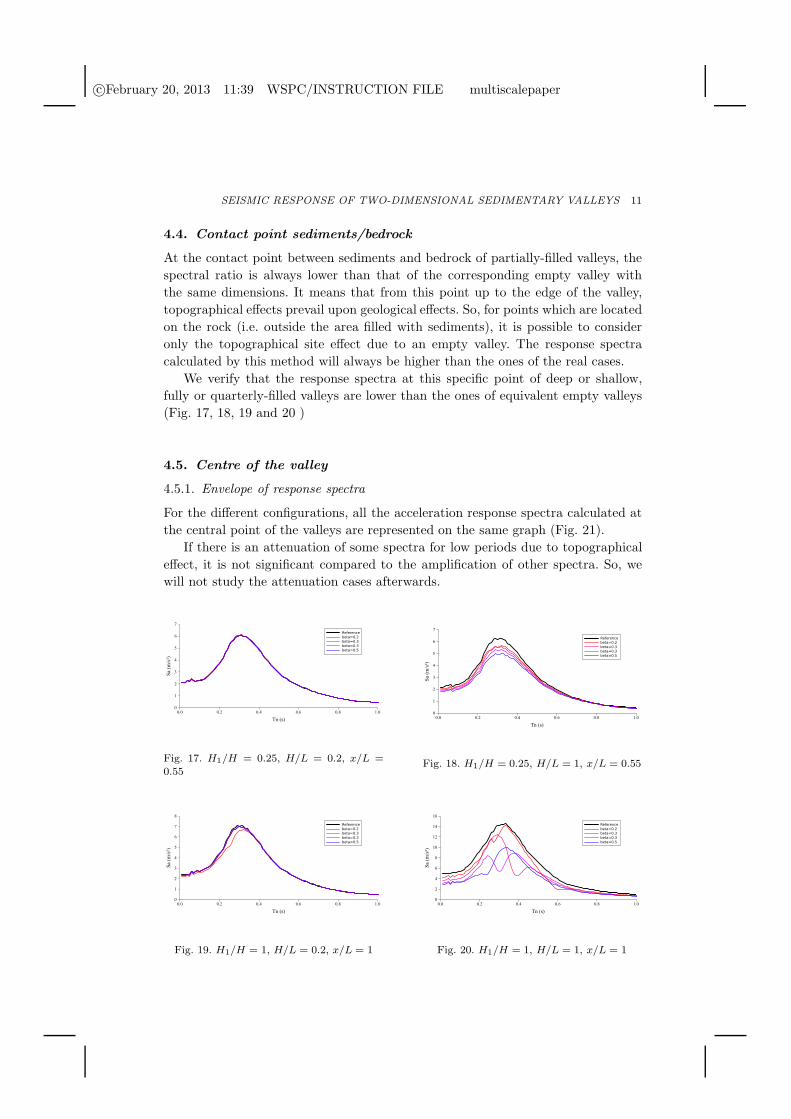
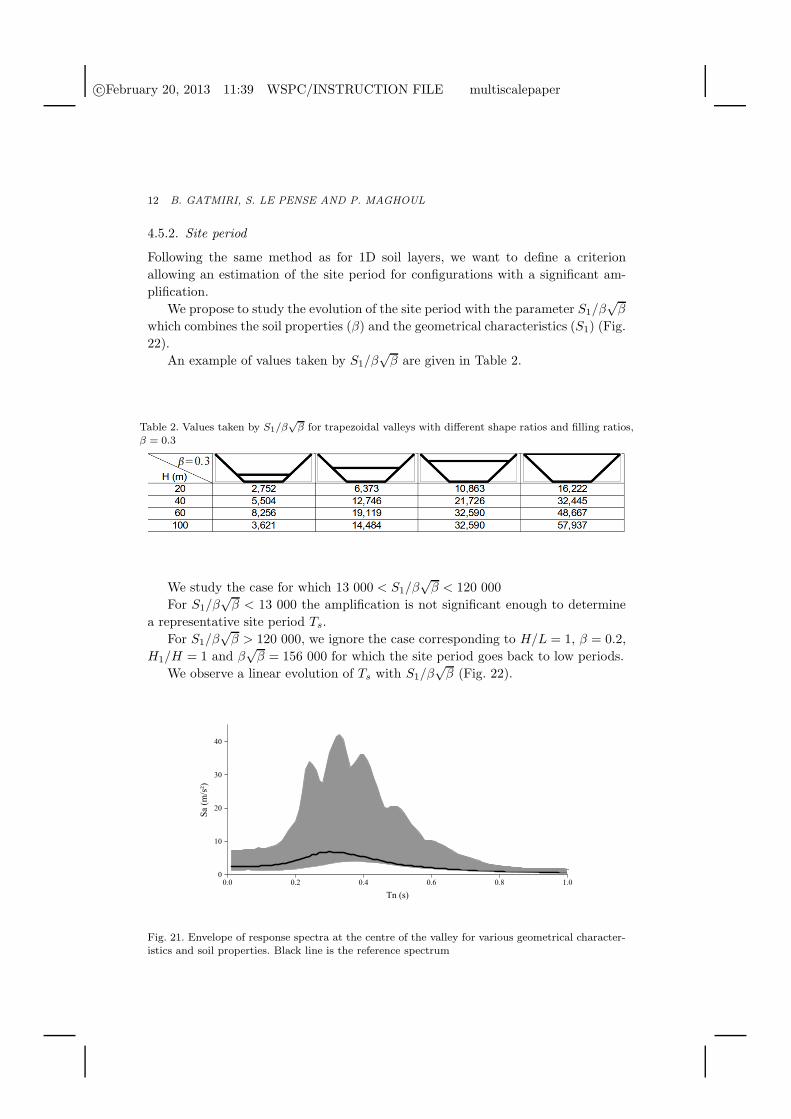
Fig. 21. Envelope of response spectra at the centre of the valley for various geometrical character-istics and soil properties. Black line is the reference spectrum

c©February 20, 2013 11:39 WSPC/INSTRUCTION FILE multiscalepaper

SEISMIC RESPONSE OF TWO-DIMENSIONAL SEDIMENTARY VALLEYS 13

4.5.3. Spectral ratio

As for 1D soil layers, we observe that, for a same period, spectra have a higher

amplitude for soft soils ( low β) (Fig. 23 and 24).

By analogy with the 1D case we propose a representation of (SR − 1)S1 as a

function of the parameter S1/β√β governing the site period. For triangular and

trapezoidal valleys our numerical results are represented on Fig. 25. We eliminated

one case (H/L = 1, β = 0.2, H1/H = 1, S1/β√β = 156 000) for which the site

period goes back to low periods.

The amplification is negligible up to a threshold corresponding to S1/β√β =

13 000. Afterwards, the evolution of (SR− 1) · S1 with S1/β√β shows a parabolic

tendency.

From these curves, knowing the geometrical characteristics of the valley S1 and

Fig. 22. Evolution of the site period with S1/β√

β for trapezoidal and triangular valleys

��� ��� ��� ��� ��� ���

�ABCD

��

��

E�

��

F�AB��C�D

Fig. 23. Response spectra for triangular val-leys (black: reference, blue: β = 0.2, yellow:β = 0.3, red: β = 0.4)

��� ��� ��� ��� ��� ���

�ABCD

��

��

E�

��

F�AB��C�D

Fig. 24. Response spectra for trapezoidal val-leys (black: reference, blue: β = 0.2, yellow:β = 0.3, red: β = 0.4)

c©February 20, 2013 11:39 WSPC/INSTRUCTION FILE multiscalepaper

14 B. GATMIRI, S. LE PENSE AND P. MAGHOUL

its soil properties β,we can now calculate the coefficient S1/β√β. With this coeffi-

cient we can read an estimation of the site period Ts and the coefficient (SR−1) ·S1

and then deduce the value of the spectral ratio SR ( Fig. 22 and Fig. 25).

5. Conclusions

Although 2D complex site effects are not yet taken into consideration in building

codes, many studies have pointed out the importance of their impact on seismic

movement. Indeed, this site effects often leads to a higher amplification of the seismic

signal compared to the 1D case. It also causes an extension of the signal length.

This study gives a method to characterise the spectral amplification of bidimen-

sional triangular and trapezoidal valleys with various filling ratios. We considered

valleys with shape ratios H/L lower than 1 and impedance contrast higher than

0.2.

We first found again known results :

• For 1D soil layers we found a good correlation with the analytical solution. Indeed,

the maximum amplification of the acceleration response spectrum occurs for the

natural period corresponding to the fundamental frequency of the soil layer.

• For empty valleys, the maximum amplification occurs at the edge of the valley

and increases with the criteria S/A.

• In fully-filled valleys, the maximum amplification takes place at the centre of the

valley.

• When increasing the filling ratio, we go from empty valley behaviour to fully-filled

valley behaviour.

Fig. 25. Evolution of (SR − 1) · S1 with S1/β√β

c©February 20, 2013 11:39 WSPC/INSTRUCTION FILE multiscalepaper

SEISMIC RESPONSE OF TWO-DIMENSIONAL SEDIMENTARY VALLEYS 15

The main results of this study are :

• In an alluvial valley, fully- or partially-filled with sediments, from the contact

point between sediments and bedrock up to the edge and outside of valleys,

topographical effects prevail upon geological effects.

• At the central point of the valley, the evolution of the site period Ts with the

parameter S1/β√β has a linear tendency. This parameter combines the soil prop-

erties and the geometrical characteristics of the valley.

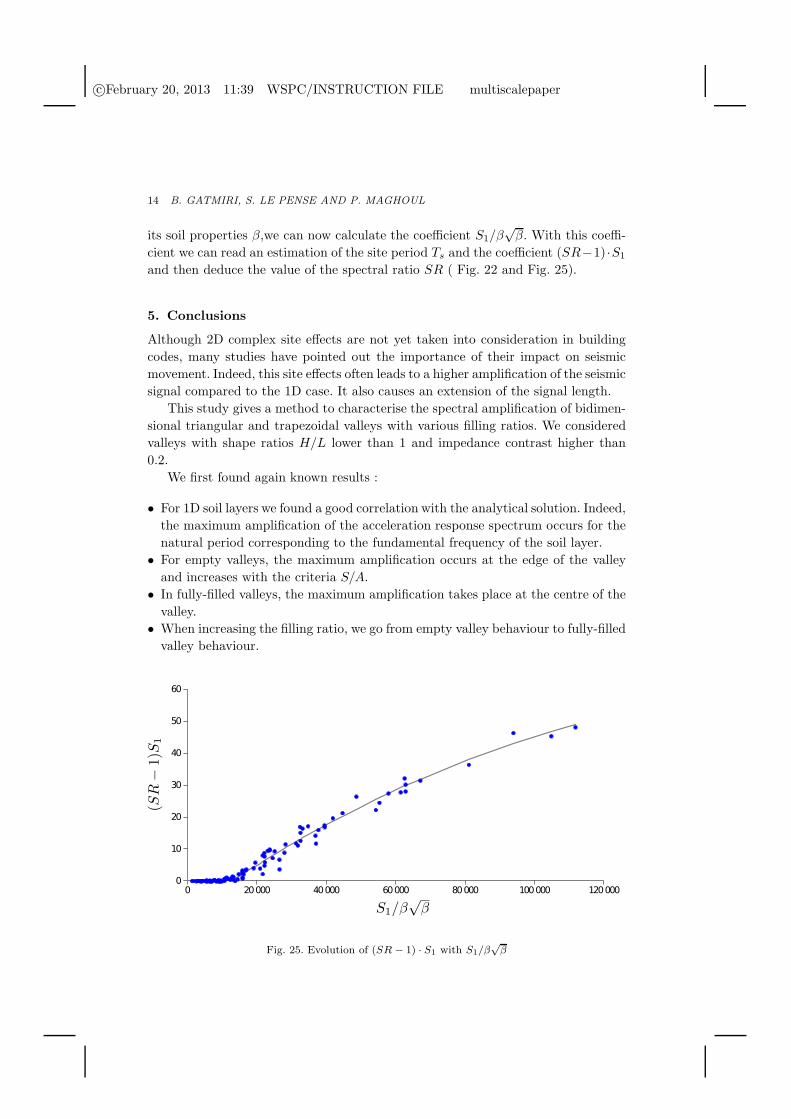
• At the centre of the valley we can estimate the spectral ratio SR from the curve

representing the evolution of (SR− 1)S1 as a function of S1/β√β (Fig. 25).

Appendix A. Appendices

References

1. B. Gatmiri and C. Arson, Seismic site effects by an optimized 2D BE/FE method II.Quantification of site effects in two-dimensional sedimentary valleys, Soil Dyn. Earth-

quake Eng. 28, 646–661 (2008).2. B. Gatmiri , P. Maghoul and C. Arson, Site-specific spectral response of seismic move-

ment due to geometrical and geotechnical characteristics of sites, Soil Dyn. Earthquake

Eng. 29 51–70 (2009).3. B. Gatmiri and M. Kamalian, Two-dimensional transient wave propagation in anelastic

saturated porous media by a Hybrid FE/BE method , Proc. 5th European Conf. on

Numerical Methods in Geotechnical Engineering 947–956 (2002).4. B. Gatmiri and K. Dehghan, Applying a new fast numerical method to elasto-dynamic

transient kernels in HYBRID wave propagation analysis, Proc. 6th Conf. on on struc-

tural dynamics (EURODYN 2005) p. 1879–1884.5. M.D. Trifunac, Surface motion of a semi-cylindrical alluvial valley for incident plane

SH waves, Bull. Seismol. Soc. Am. 61(6) 1755–1770 (1971).6. M.D. Trifunac, Scattering of plane SH waves by a semi-cylindrical canyon, Earthquake

Eng. Struct. Dyn. 1(3) 267–281 (1972). title=Scattering of plane sh waves by a semi-cylindrical canyon,

7. H.L. Wong and M.D. Trifunac, Scattering of plane SH waves by a semi-elliptical canyon,Earthquake Eng. Struct. Dyn. 3(2) 157–169 (1974).

8. H.L. Wong and M.D. Trifunac, Surface motion of a semi-elliptical alluvial valley forincident plane SH waves, Bull. Seismol. Soc. Am. 64(5) 1389–1408 (1974).

9. F.J. Sanchez-Sesma, Diffraction of elastic SH waves by wedges, Bull. Seismol. Soc. Am.

75(5) 1435–1446 (1985).10. Y. Nakamura, A method for dynamic characteristics estimation of subsurface using

microtremor on the ground surface, Railway Technical Research Institute, Quarterly

Reports 30 25–33 (1989).


Recommended