Page 1
A Multiagent Approach Towards Solving Complex Problems ofSociotechnical Systems
by
Hongying Du
Bachelor of EngineeringNorthwestern Polytechnical University 2006
Master of EngineeringNorthwestern Polytechnical University 2009
Submitted in Partial Fulfillment of the Requirements
for the Degree of Doctor of Philosphy in
Computer Science and Engineering
College of Engineering and Computing
University of South Carolina
2014
Accepted by:
Michael N. Huhns, Major Professor
Manton M. Matthews, Committee Member
José M. Vidal, Committee Member
Munindar P. Singh, External Examiner
Kuldar Taveter, External Examiner
Lacy Ford, Vice Provost and Dean of Graduate Studies
Page 2
Acknowledgments
This work would not have been done without the help of so many people in so many
ways. First of all I want to express my sincere gratitude and deep regards to my
adviser, Michael N. Huhns. His knowledge and genuine enthusiasm for research is
unmatched. He is a wonderful adviser and great mentor, who motivated and guided
me all the way along during my Ph.D. studies. I’m thankful to my dissertation
committee members: Kuldar Taveter, José Vidal, Manton Matthews and Munindar
Singh for their ongoing support and great suggestions on my work. Besides, Kuldar
Taveter provided me opportunities to collaborate and it would not be possible to turn
our work into published pieces without him. I must thank Barbara Ulrich, Randi
Baldwin and Sherri Altizer, who prepared all my paperwork needed for graduation.
I received the help of many friends while I was producing this work. Discussion
with them intrigued me and helped me to relax. Special thanks to Mingzhe Du who
provided me with not only spiritual support, but also technical support while I was
struggling with different kinds of problems.
Lastly, I would like to pay tribute to my family. My parents and grandma en-
couraged me to go on this path to pursue the knowledge that I longed for. Also to
my uncle, who provided me a better study environment before going to the college,
otherwise I won’t be able to end up here.
ii
Page 3
Abstract
Complex resource allocation problems arise due to complex human societies and
scarce resources to be distributed. Scarce resources could be food, water, and en-
ergy. Meanwhile, the size of the problem, the intersection of different areas, and
possible global consequences all add to the complexity of the problems, which makes
it difficult for humans to solve the problems by themselves.
For all these reasons, humans need technical help to tackle complex problems.
Since humans participating in the problems usually own part of the information about
the problems, and no one may see the whole picture of the problems, it is natural
to use distributed systems to simulate and analyze the problems. In a distributed
system, humans represented by agents knowing only partial information interact with
each other in order to achieve a common goal while maximizing their own interests.
The resultant distributed system is called a multiagent system, because multiple
agents are involved in the systems.
In this dissertation, we study three cases of multiagent systems that help with
distributing a certain kind of resource. First, we present an approach to assist indi-
viduals shop for groceries. The aim is to help a customer to find the most economical
way of shopping. We show that a customer could save 22% or more most of the
time with simulated price data and 6.7% with real price data. Robustness is also
considered with deceptive stores and wrongly reported prices. Second, we simulate a
healthcare system in which agents are used to assist a patient to find a physician. We
investigate four different strategies for assisting a person in choosing a physician and
three physician-waiting policies in three common social network models. The results
iii
Page 4
show that the resultant sociotechnical system can decrease the number of annual sick
days per person by 0.4-1.8 days compared with choosing a physician randomly. Third
we investigate the influence of humans’ personalities on resource allocation in mixed
human-agent societies. It is shown that humans treat other humans and agents dif-
ferently and humans with different temperaments behave differently, but not with
significantly difference, which means fair is more important than personality types
while making decisions.
The three cases investigate different aspects of a sociotechnical system. The
grocery-shopping case involves agents that interact with each other indirectly through
a central aggregator of local results. The physician choosing case involves agents that
interact with each other directly in a social network that is a subset of the complete
network of agents. The resource-allocation case investigates the relationships between
the agents and the humans in a sociotechnical system.
iv
Page 5
Table of ContentsAcknowledgments . . . . . . . . . . . . . . . . . . . . . . . . . . . . . ii
Abstract . . . . . . . . . . . . . . . . . . . . . . . . . . . . . . . . . . . iii
List of Tables . . . . . . . . . . . . . . . . . . . . . . . . . . . . . . . . vii
List of Figures . . . . . . . . . . . . . . . . . . . . . . . . . . . . . . . ix
Chapter 1 Introduction . . . . . . . . . . . . . . . . . . . . . . . . . 1
1.1 Purpose of Study . . . . . . . . . . . . . . . . . . . . . . . . . . . . . 2
1.2 Complex Problems and Possible Solutions . . . . . . . . . . . . . . . 4
1.3 Research Methodology . . . . . . . . . . . . . . . . . . . . . . . . . . 6
Chapter 2 Background . . . . . . . . . . . . . . . . . . . . . . . . . 9
2.1 Sociotechnical Systems . . . . . . . . . . . . . . . . . . . . . . . . . . 9
2.2 Resource Allocation Problems . . . . . . . . . . . . . . . . . . . . . . 14
2.3 Multiagent Systems . . . . . . . . . . . . . . . . . . . . . . . . . . . . 15
Chapter 3 A Multiagent System Approach to Grocery Shopping 19
3.1 Introduction . . . . . . . . . . . . . . . . . . . . . . . . . . . . . . . . 19
3.2 Background . . . . . . . . . . . . . . . . . . . . . . . . . . . . . . . . 22
3.3 Analysis and Simulation . . . . . . . . . . . . . . . . . . . . . . . . . 23
v
Page 6
3.4 Results and Discussion . . . . . . . . . . . . . . . . . . . . . . . . . . 25
3.5 Conclusion . . . . . . . . . . . . . . . . . . . . . . . . . . . . . . . . . 29
Chapter 4 Simulating a Sociotechnical System for Healthcare 31
4.1 Introduction . . . . . . . . . . . . . . . . . . . . . . . . . . . . . . . . 31
4.2 Related Work . . . . . . . . . . . . . . . . . . . . . . . . . . . . . . . 34
4.3 Methodology . . . . . . . . . . . . . . . . . . . . . . . . . . . . . . . 35
4.4 Evaluation . . . . . . . . . . . . . . . . . . . . . . . . . . . . . . . . . 45
4.5 Conclusion . . . . . . . . . . . . . . . . . . . . . . . . . . . . . . . . . 54
Chapter 5 Determining the Effect of Personality Types onHuman-Agent Interactions . . . . . . . . . . . . . . . . 56
5.1 Introduction . . . . . . . . . . . . . . . . . . . . . . . . . . . . . . . . 56
5.2 Related Work . . . . . . . . . . . . . . . . . . . . . . . . . . . . . . . 60
5.3 Experiment . . . . . . . . . . . . . . . . . . . . . . . . . . . . . . . . 62
5.4 Results . . . . . . . . . . . . . . . . . . . . . . . . . . . . . . . . . . . 63
5.5 Conclusion . . . . . . . . . . . . . . . . . . . . . . . . . . . . . . . . . 74
Chapter 6 Conclusion . . . . . . . . . . . . . . . . . . . . . . . . . . 76
Bibliography . . . . . . . . . . . . . . . . . . . . . . . . . . . . . . . . 81
Appendix A Item Prices in Dollars . . . . . . . . . . . . . . . . . . 90
Appendix B Number of patients going to each physician each day 92
vi
Page 7
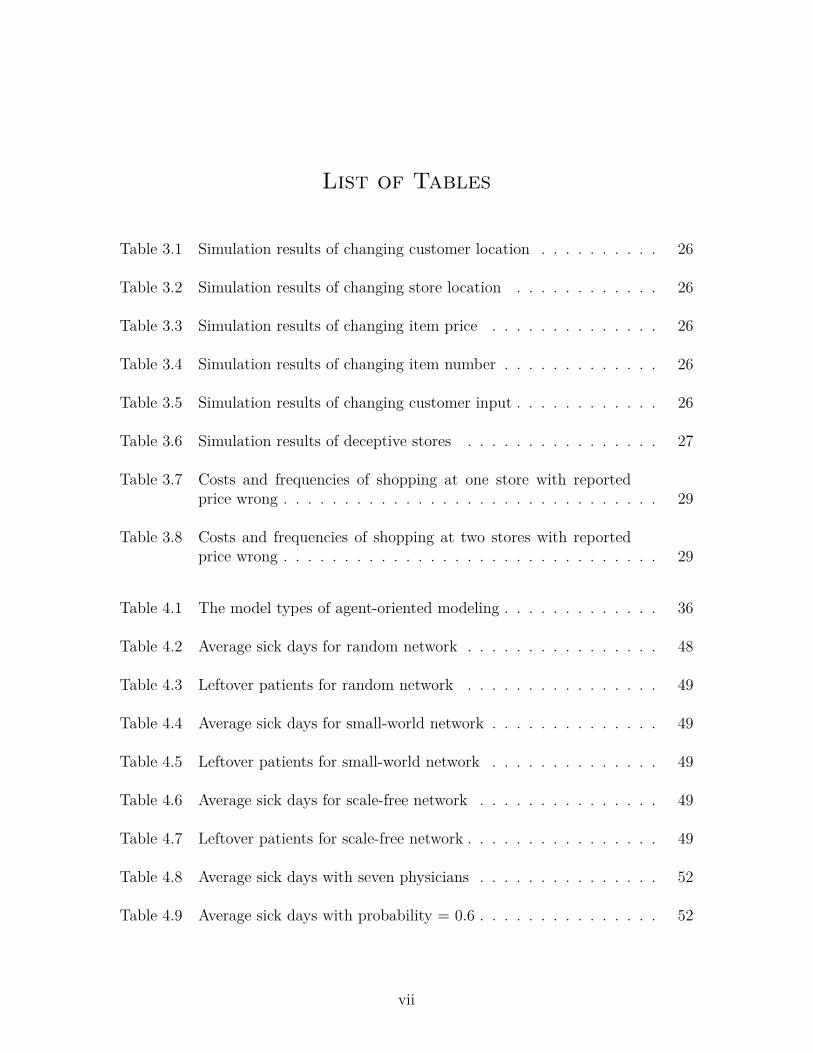
List of Tables
Table 3.1 Simulation results of changing customer location . . . . . . . . . . 26
Table 3.2 Simulation results of changing store location . . . . . . . . . . . . 26
Table 3.3 Simulation results of changing item price . . . . . . . . . . . . . . 26
Table 3.4 Simulation results of changing item number . . . . . . . . . . . . . 26
Table 3.5 Simulation results of changing customer input . . . . . . . . . . . . 26
Table 3.6 Simulation results of deceptive stores . . . . . . . . . . . . . . . . 27
Table 3.7 Costs and frequencies of shopping at one store with reportedprice wrong . . . . . . . . . . . . . . . . . . . . . . . . . . . . . . . 29
Table 3.8 Costs and frequencies of shopping at two stores with reportedprice wrong . . . . . . . . . . . . . . . . . . . . . . . . . . . . . . . 29
Table 4.1 The model types of agent-oriented modeling . . . . . . . . . . . . . 36
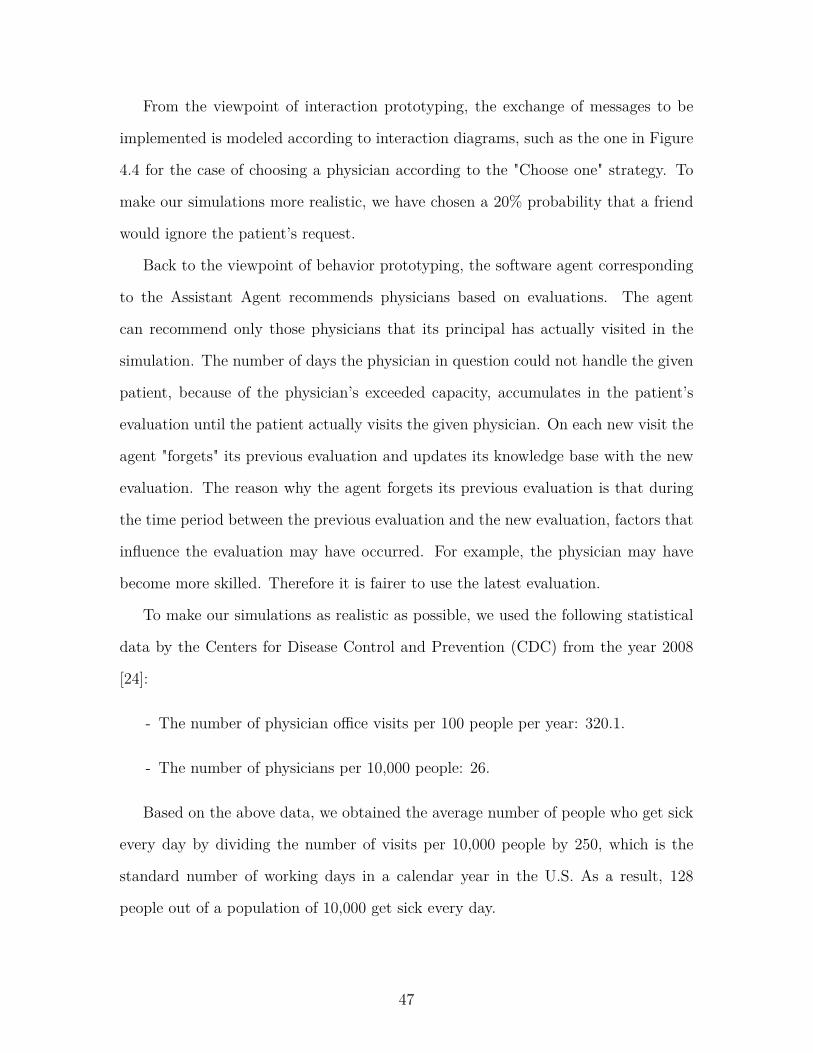
Table 4.2 Average sick days for random network . . . . . . . . . . . . . . . . 48
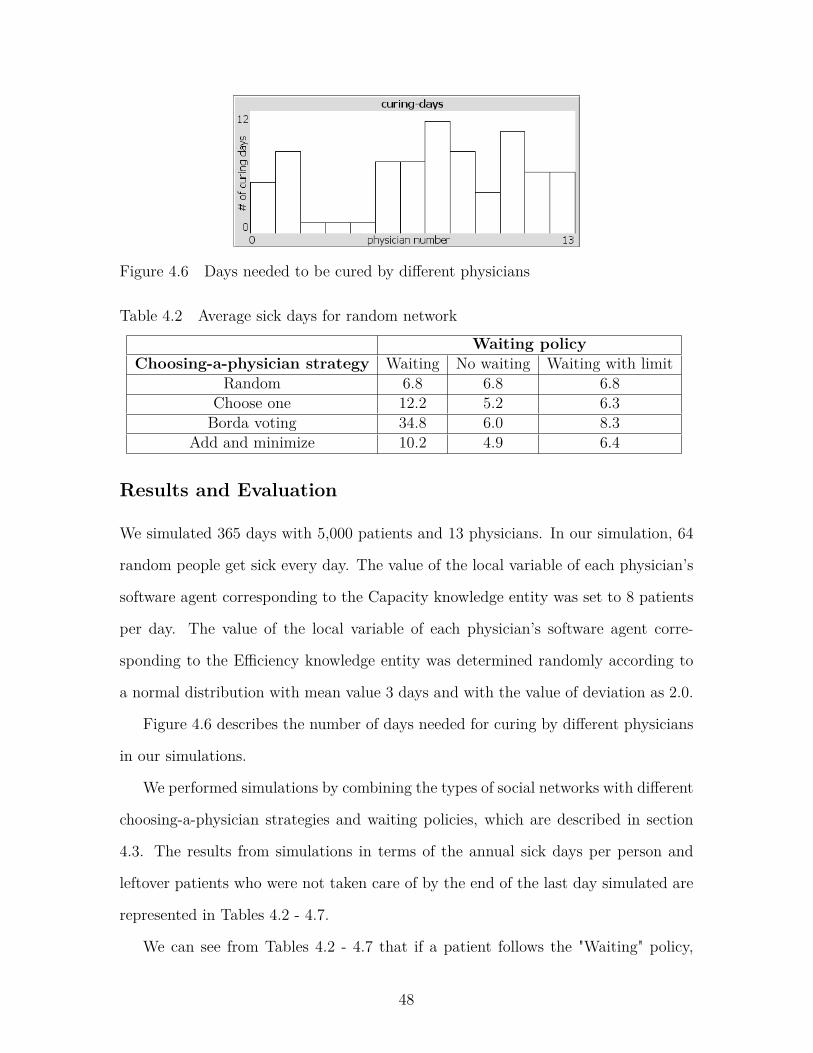
Table 4.3 Leftover patients for random network . . . . . . . . . . . . . . . . 49
Table 4.4 Average sick days for small-world network . . . . . . . . . . . . . . 49
Table 4.5 Leftover patients for small-world network . . . . . . . . . . . . . . 49
Table 4.6 Average sick days for scale-free network . . . . . . . . . . . . . . . 49
Table 4.7 Leftover patients for scale-free network . . . . . . . . . . . . . . . . 49
Table 4.8 Average sick days with seven physicians . . . . . . . . . . . . . . . 52
Table 4.9 Average sick days with probability = 0.6 . . . . . . . . . . . . . . . 52
vii
Page 8
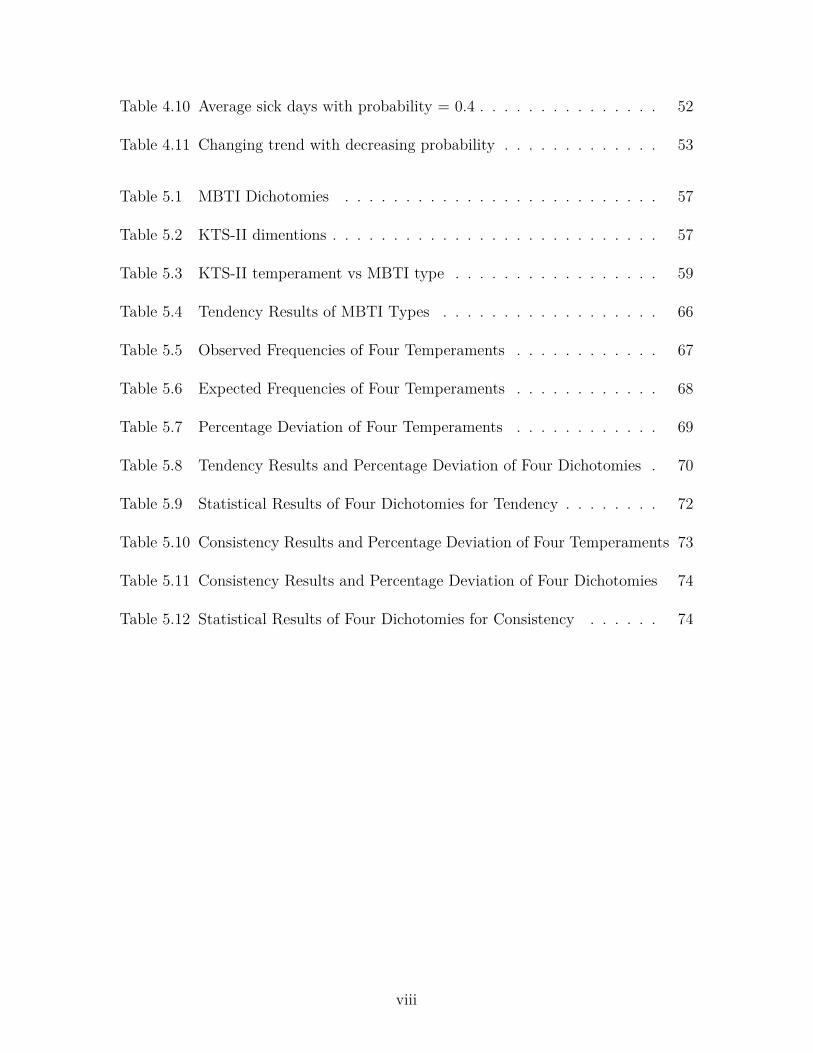
Table 4.10 Average sick days with probability = 0.4 . . . . . . . . . . . . . . . 52
Table 4.11 Changing trend with decreasing probability . . . . . . . . . . . . . 53
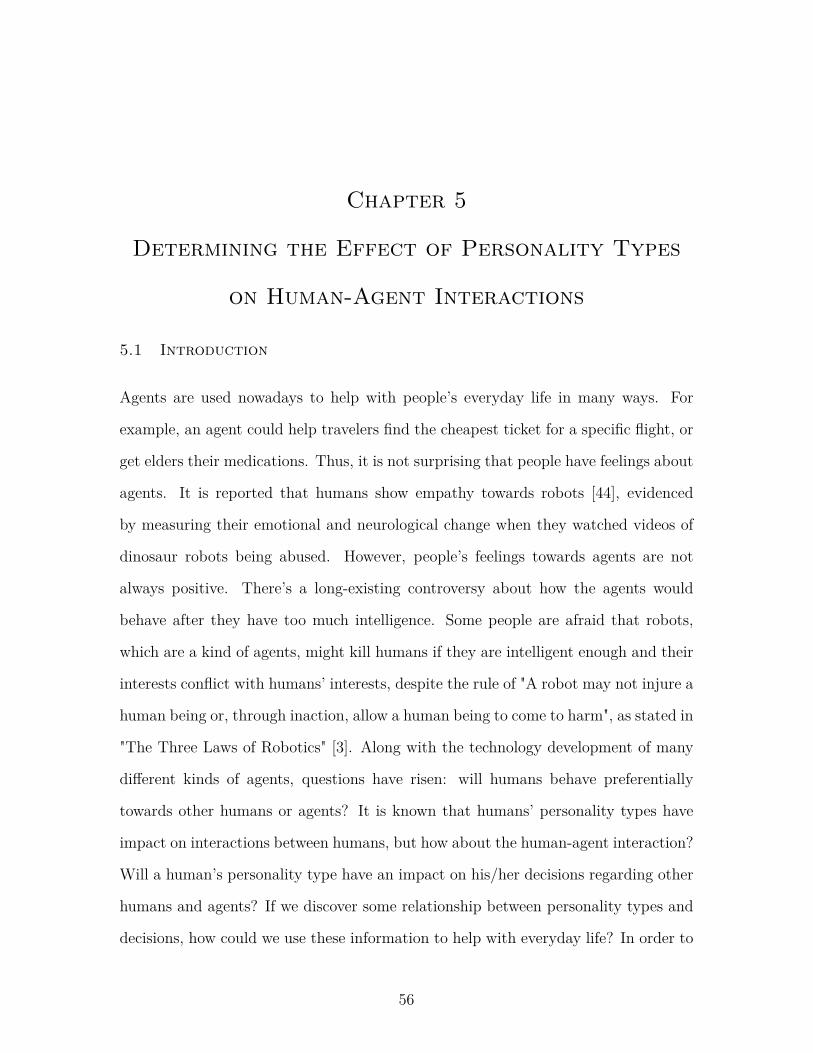
Table 5.1 MBTI Dichotomies . . . . . . . . . . . . . . . . . . . . . . . . . . 57
Table 5.2 KTS-II dimentions . . . . . . . . . . . . . . . . . . . . . . . . . . . 57
Table 5.3 KTS-II temperament vs MBTI type . . . . . . . . . . . . . . . . . 59
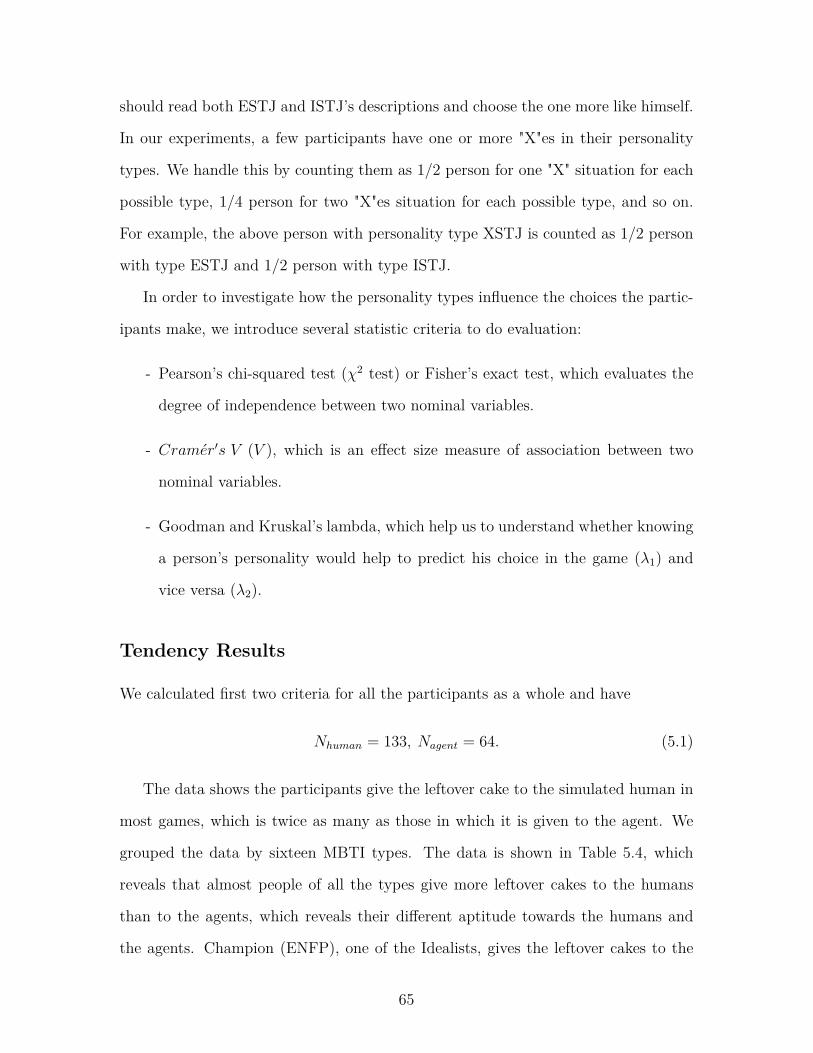
Table 5.4 Tendency Results of MBTI Types . . . . . . . . . . . . . . . . . . 66
Table 5.5 Observed Frequencies of Four Temperaments . . . . . . . . . . . . 67
Table 5.6 Expected Frequencies of Four Temperaments . . . . . . . . . . . . 68
Table 5.7 Percentage Deviation of Four Temperaments . . . . . . . . . . . . 69
Table 5.8 Tendency Results and Percentage Deviation of Four Dichotomies . 70
Table 5.9 Statistical Results of Four Dichotomies for Tendency . . . . . . . . 72
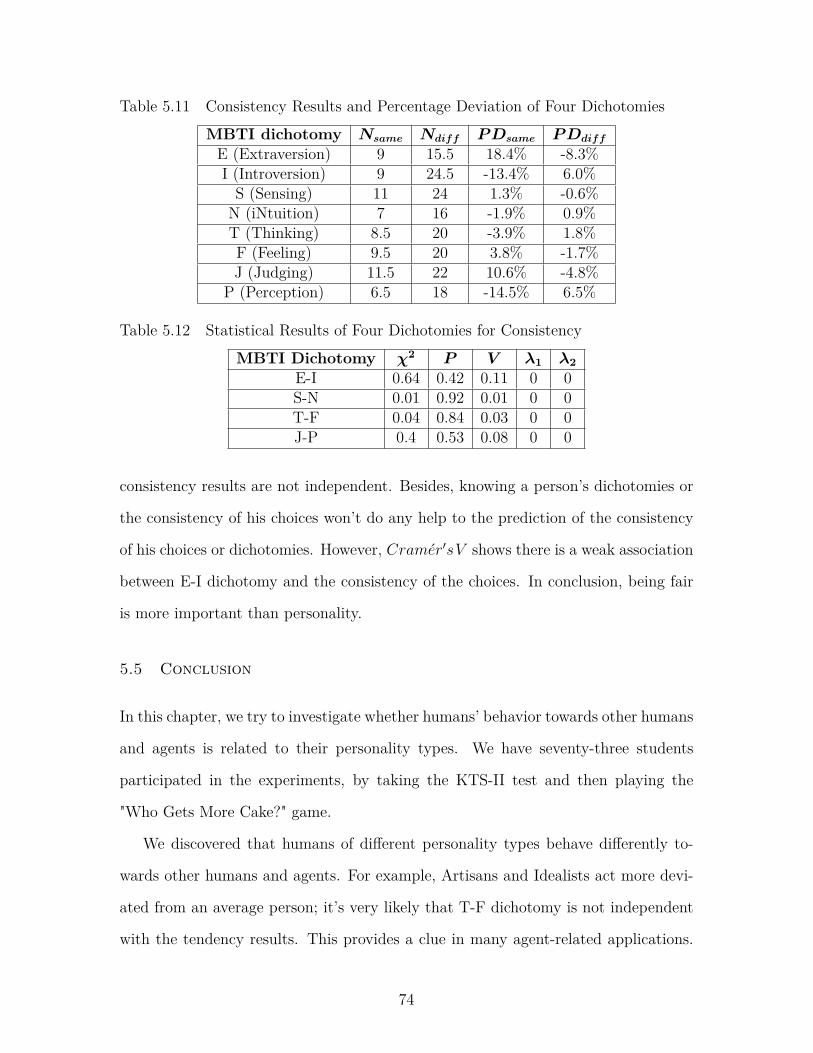
Table 5.10 Consistency Results and Percentage Deviation of Four Temperaments 73
Table 5.11 Consistency Results and Percentage Deviation of Four Dichotomies 74
Table 5.12 Statistical Results of Four Dichotomies for Consistency . . . . . . 74
viii
Page 9
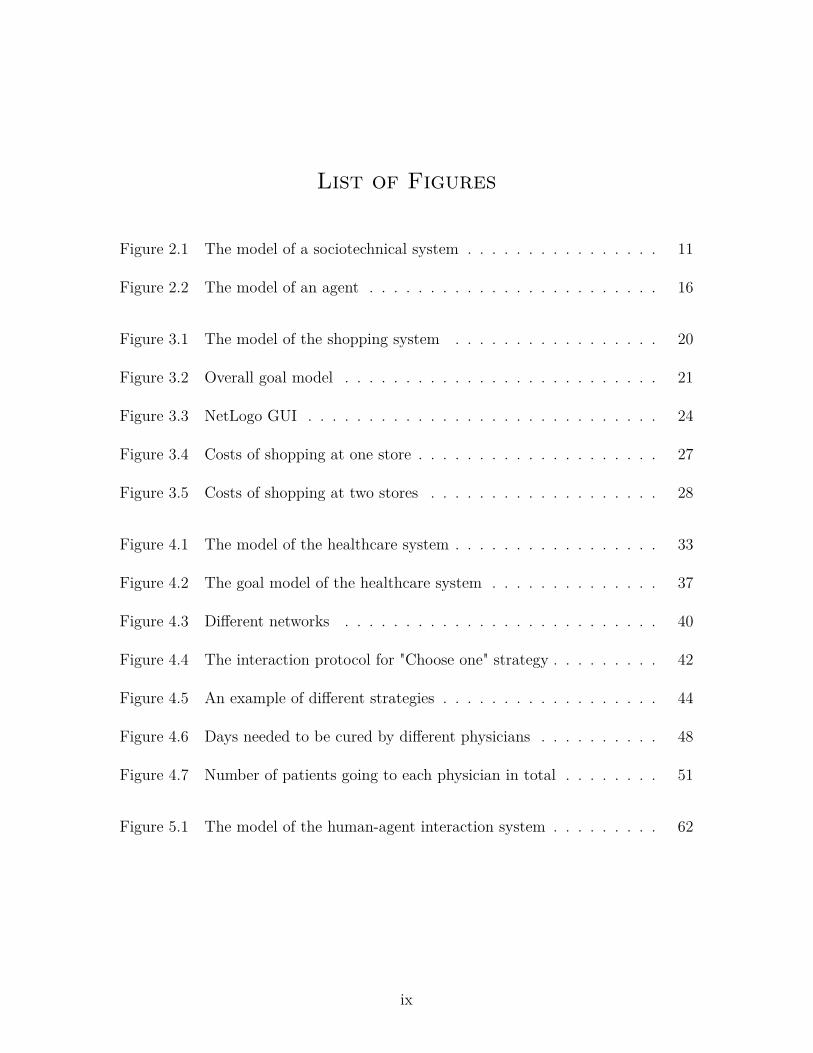
List of Figures
Figure 2.1 The model of a sociotechnical system . . . . . . . . . . . . . . . . 11
Figure 2.2 The model of an agent . . . . . . . . . . . . . . . . . . . . . . . . 16
Figure 3.1 The model of the shopping system . . . . . . . . . . . . . . . . . 20
Figure 3.2 Overall goal model . . . . . . . . . . . . . . . . . . . . . . . . . . 21
Figure 3.3 NetLogo GUI . . . . . . . . . . . . . . . . . . . . . . . . . . . . . 24
Figure 3.4 Costs of shopping at one store . . . . . . . . . . . . . . . . . . . . 27
Figure 3.5 Costs of shopping at two stores . . . . . . . . . . . . . . . . . . . 28
Figure 4.1 The model of the healthcare system . . . . . . . . . . . . . . . . . 33
Figure 4.2 The goal model of the healthcare system . . . . . . . . . . . . . . 37
Figure 4.3 Different networks . . . . . . . . . . . . . . . . . . . . . . . . . . 40
Figure 4.4 The interaction protocol for "Choose one" strategy . . . . . . . . . 42
Figure 4.5 An example of different strategies . . . . . . . . . . . . . . . . . . 44
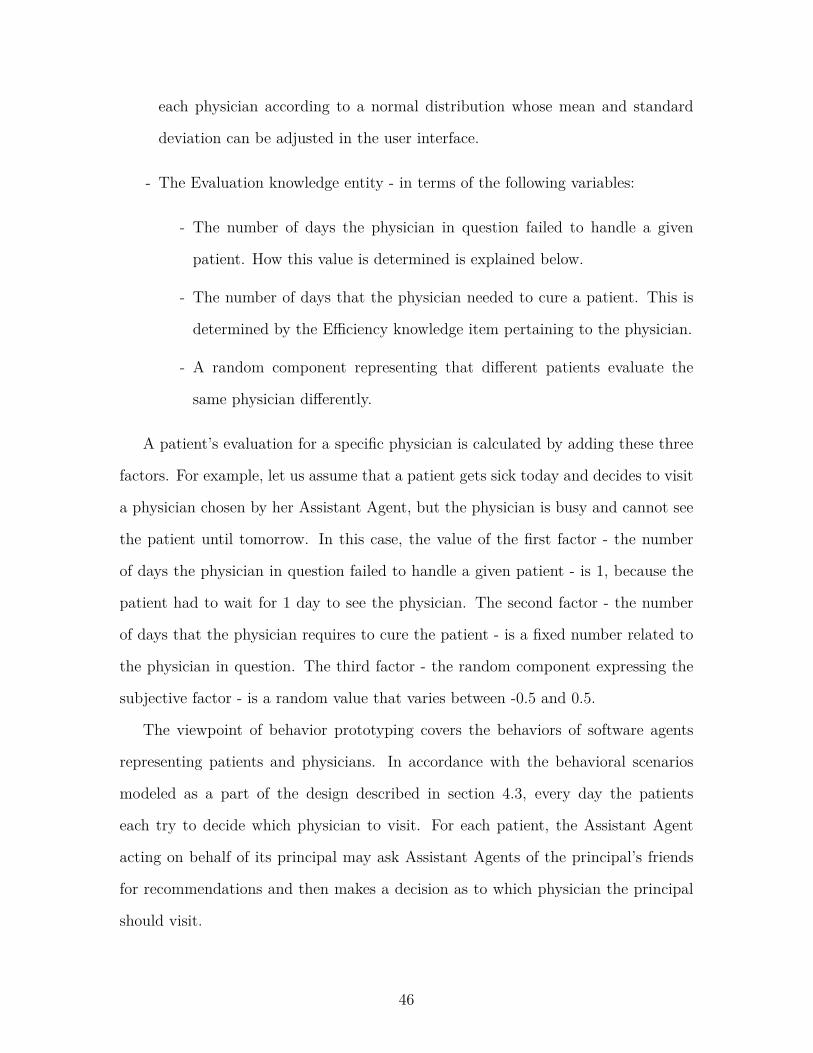
Figure 4.6 Days needed to be cured by different physicians . . . . . . . . . . 48
Figure 4.7 Number of patients going to each physician in total . . . . . . . . 51
Figure 5.1 The model of the human-agent interaction system . . . . . . . . . 62
ix
Page 10
Chapter 1
Introduction
As the amount of communication among people increases rapidly and the technol-
ogy grows fast, more complex problems occurs and humans don’t have enough time,
energy, or ability to tackle with all these problems. Our work involves one complex
problem – scarce resource allocation problem. To help humans with these prob-
lems in sociotechnical systems, we took advantage of multiagent systems in which
autonomous agents represent humans’ interests and make decisions for humans.
In implementing such systems, we need to handle two technical issues. First,
how the agents represent humans and how the agents interact with each other in the
systems. Second, how we represent the interaction between humans and agents. Our
work contains three study cases, while the first two cases, shopping route optimization
and health care provider selection through recommendations investigate the first issue.
The third case is about human-agent interaction while playing a game, which explores
the second technical issue.
This introduction continues with more detailed explanation for the purpose of
study in section 1.1 and a description of complex problems and possible solutions in
section 1.2. To find solutions for these problems, we need some technical help from
the artificial intelligence domain. In section 1.3, we explain what motivates our study
cases in this work.
1
Page 11
1.1 Purpose of Study
Because human societies are complex and humans rely on resources that are scarce,
we encounter complex resource allocation problems. Scarce resources might be dif-
ferent under different circumstances, such as food, energy, medical care, clean water,
etc. To solve these problems, human interact with each other, and the interaction or
information flow among them forms different kinds of information systems. Together
with the technical aspects that participate in the systems to help, the information
systems are actually sociotechnical systems, as we will define later. There are various
kinds of sociotechnical systems serving different purposes. Take a simple situation as
an example, a patient is trying to find a doctor who could take care of him. He may
have a goal to spend money as less as possible, or to cure him as soon as possible, but
he has no idea which doctor fits his purpose best. Thus he turns to his friends, his
friends’ friends if necessary, for recommendations, incorporate these information into
consideration, and make a decision with the help of agents. In this example, the per-
sons involved, the agents and the information flow form a sociotechnical system and
the purpose is to find a doctor for the patient. There are more complex information
systems like the ones in section 1.2.
As the scale of a system grows, more complex problems, some with global inter-
actions which lead to global consequences, emerge. In many cases it is hard to find
solutions to the problems or perform experiments on real systems due to various rea-
sons, such as difficulty of synchronization, long time span of doing the experiments,
or extreme geological conditions.
Because of complexity of the systems, the huge amount of information flow and
other factors that make the problems hard to solve, humans need computational
help in designing, implementing, and evaluating the systems. With the technical
help of simulated systems, the cost of experiments is reduced and the purpose of
study is fulfilled. Several questions need to be considered while designing a simulated
2
Page 12
sociotechnical system. For instance, how big should the system be and what entities
are involved? What kind of information should be kept an eye on? What consequences
to expect and what goals to achieve? We’ll see more analysis in system design in
section 1.2.
Humans involved in complex problems usually only have access to partial informa-
tion and they try to achieve a common goal while pursuing their own interests. This
characteristic is consistent with the feature of distributed systems where agents with
partial information are used to assist humans to make decisions. Such systems with
multiple agents are called MultiAgent Systems (MAS). Agents are an autonomous
software entities that can act on the behalf of his principle, sometimes a human in
a sociotechnical system, based on his knowledge and judgment. This natural char-
acteristic makes an agent a good representative of a human. Also, the amount of
information flow in a sociotechnical system could be potentially enormous, which is
beyond the processing ability of humans brain, thus it is better to have an autonomous
agent gather information, communicate with other agents and make decisions on be-
half of a person. A multiagent system is a system/society that gathers multiple agents
who interact with each other. Information is exchanged among the agents who have
goals based on their principles’ interests. Nowadays agent technology is used every-
where, ranging from industry such as fault detection, energy distribution, to everyday
life, such as web services, security patrols. First two case studies in this dissertation
use multiagent systems to implement a grocery shopping scenario and a health care
system.
Due to the popularity of the agents existed in our society it is inevitable that
human-agent mixed societies emerge. In such societies, humans and agents exchange
information and work together to achieve a particular goal, compete with each other,
or have more complex relationships. Examples of working together include teaching
children languages or mathematics using emotional agents. An emotional agent is an
3
Page 13
agent with emotions which are expressed by expressions of its animated face on the
screen, words programmed in it, and so on. If a child answers a question correctly
or performs well, the agent smiles or does other positive expressions and actions. An
example of competition is that humans and agents take part in an auction and bid
for some goods on the Internet.
It is important to understand how humans and agents interact in various human-
agent mixed societies in different aspects. For example, will humans have the same
performance in the mixed societies as previous while there’s no agent involved? What
factors influence humans’ decisions/attitude towards agents? Do humans’ personal-
ities play a part in their decisions and how? Many researchers studied the first two
questions but less studied the third question. The third part of this dissertation is try-
ing to get an insight into the questions about relationship between personalities and
decisions. Conclusions to these questions could be used in many ways. For example,
we could predict the performance of humans in a game knowing their personalities,
or assign an agent with the "proper" personality to accompany a human, etc.
1.2 Complex Problems and Possible Solutions
The problems human encounter everyday range from very personal, such as what to
eat for breakfast, to very influential, such as what the best plan is for a company.
Nowadays problems become more and more complicated, considering the following
three factors:
- size: since the communication of people and exchange of information are very
frequent today due to the development of new technologies and market needs,
it is very possible that problems encountered have larger size than ever before.
For example, people like to take digital pictures and put it on the Internet,
and with the increasing size of digital photos today, it takes a lot of space to
store these photos and more time to find specific photos. Another example is
4
Page 14
integrating several databases of huge amount of data. Because the databases
are huge and there are complex relationships among them, any operation should
be considered or evaluated before they are actually performed. The size of a
problem matters because it could motivate new technologies which deal with
new challenges brought by the size.
- intersection: a problem may involve different areas and intersect or overlap with
other problem domains. For example, consider the problem of arranging the
routes of goods transportation of a delivery company everyday. First a couple
of key time points should be considered, such as the arrival time of goods to
the company. Other things to be considered include available transportation
vehicles and human labors, weather, and so on. This problem involves human
resources, scheduling, in addition with the help of weather forecasting, and some
other areas. For complex problems, it is inevitable that they involve different
areas and it is beyond the capacity of just humans, which is why we need the
help of technology.
- consequences: due to the above two factors and globalization, some problems
today have more influential consequences than before. For example, an erro-
neous operation on databases of a large electricity company may lead to failure
of several power plants, causing residents of an area short of electricity. An-
other example is global warming, which caused by multiple reasons. Possible
reasons include increasing size of people and cars therefore more carbon diox-
ide, decreasing area of forests, polluted air and seas, and so on, which are all
interrelated that the problem couldn’t be solved with the effort of only a por-
tion of people. Some events, such as nuclear disaster, happen on one location
of the world, but continuously have global consequences, such as the release of
radioactive materials.
5
Page 15
Because of these factors, some problems are so complex that technical help de-
signed to deal with the complexity of these problems is needed. There are two parts
or aspects of the technical help:
- How a technical system represents each person and their interactions with each
other and the problem domain. For example, we need to decide how the agents
communicates in a multiagent system under a particular situation.
- How a person interacts with the system. For example, we could have a person
specify his preferences by selecting some options on a web page.
Since multiagent systems represent the feature of complex problems well in the sense
that information centralization isn’t a must in the systems and that autonomous
agents could represent persons well, multiagent systems are used in this work.
1.3 Research Methodology
For the various complex problems existed in the sociotechnical systems everywhere
nowadays, humans don’t have time or interests to work with other humans on these
problems, so humans need agents to represent them which could relieve them from
tasks or pressure. Therefore, we turned to multiagent systems for technical help.
As for research methodology, which should depend on the research questions, we
uses case study approach to investigate the aspects of implementing a sociotechnical
system in depth. As Yin [82] said, case study is "an empirical inquiry about a con-
temporary phenomenon (e.g., a "case"), set within its real-world context-especially
when the boundaries between phenomenon and context are not clearly evident." Case
study could be used if the research addresses a descriptive question or an explanatory
question, such as "What is happening?", or "Why or how is it happening?" [61], which
is exactly what we need.
6
Page 16
In this work, we studied three cases. First, can you imagine an agent would
help you to list the goods that you want to buy just by scanning the barcode of
your goods that’s running out or taking pictures of them, calculate the optimal route
based on your location and your preferences such as which stores you usually visit,
and provide suggestions? In the first case study, we try to find the optimal route
for a customer who wants to do shopping. First we rely on a multiagent system
to publish and retrieve information related to the items sold in store, such as price
and quality. Then an agent representing the customer will provide a solution for the
customer according to the shopping list by giving suggestions of which stores to visit.
We used simulated data and real-world data to test our approach and then evaluated
the robustness of the system.
Second, have you ever troubled by the question of which physician or doctor to
visit when you are ill? How would you know whom is good for you, especially if
you don’t have experience with any of them? Of course you could search online, but
the information there may be misleading and outdated. In our healthcare system,
an agent representing you could interact with the agents of your friends, or even
your friends’ friends, to acquire information, integrate them, and make a suggestion
based on your preference, such as saving money, or heal fast. Friends’ agents have
their choices of whether to respond to the patient’s agent or not. In this case, we
investigate the interaction among agents.
Third, do you like or fear to interact with agents? Have you wondered what factors
influence your emotion or affection towards agents? These questions are encountered
inevitably while designing a multiagent system. In our last case, we studied the effect
of a particular factor - personality - on the decisions humans made while interacting
with agents and other humans in a mixed human-agent society. Human subjects were
guided to play a variant of cake-cutting game and then asked a question of how they
would like to divide the leftover cake between the simulated human and the agent
7
Page 17
participated in the game. So the questions are, would personality play a part in
humans’ decisions and is there any pattern for the answers to the question?
The three cases come from different domains and it seems that they are unrelated,
but actually not. In the shopping scenario, agents contributed data to a central
server and receive data from a central server, so the agents interacted indirectly, but
a customer’s shopping agent and other persons’ shopping agents might not talk to
each other. In the healthcare case, agents work with or interact directly with other
agents on the problem. In the human-agent interaction case, we investigate how a
person would interact with his agent, and how an agent would interact with a person
and with other agents. Therefore, the first two cases studied the first aspect of the
technical help and the third case investigated the second aspect. The three cases
contribute to what we need for implementing a simulated sociotechnical system.
8
Page 18
Chapter 2
Background
Before implementing a sociotechnical system, we need to understand what a sociotech-
nical system is and its characteristics, problems in the system and possible solutions
of the problems. Whitworth and Ahmad [78] claimed a sociotechnical system as
a social system operating on a technical base, such as email, chat, Facebook, and
described the design process of a sociotechnical system. Why do we need a sociotech-
nical system instead of a common computer-based or technical system? As Baxter
and Sommerville [7] stated, systems often meet their technical "requirements" but
are considered to be a "failure" because they do not deliver the expected support for
the real work in the organization. The source of the problem is that techno-centric
approaches to systems design do not properly consider the complex relationships be-
tween the organization, the people enacting business processes and the system that
supports these processes.
In this chapter, first we present background knowledge of sociotechnical systems,
including the concept and some keywords related to our work. Then we introduce a
complex problem of sociotechnical systems that is related to our case studies here -
the resource allocation problem. At last, multiagent systems are introduced to tackle
the problems in a sociotechnical system.
2.1 Sociotechnical Systems
For solving complex problems, we should understand the environment that the prob-
lems build on, i.e., different kinds of sociotechnical systems. Today everyone lives
9
Page 19
in some sociotechnical systems one way or another. The name "SocioTechnical Sys-
tems" indicates both the social aspects, such as humans or society, and the technical
aspects, such as organizational rules and policies in the system. Through interac-
tion and cooperation of all the participants in the system, it is expected to achieve
solutions better than that achieved with only technology or humans available in the
system. Let’s consider some examples on top of the find-a-doctor example mentioned
before.
Sociotechnical systems are common and play an important role in our era due to
increasingly complex societies, which rely on increased connectivity and global inter-
actions between humans and technology. Information globalization changes human
life in many ways, from communication between friends, to the way the companies
operate their business. All these require the cooperation of the social and technical
aspects. Take companies as an example, as Valacich [74] stated, information technol-
ogy is important because "increasing global competitiveness has forced companies to
find ways to be better and to do things less expensively. The answer for many firms
continues to be to use information systems to do things better, faster, and cheaper.
Using global telecommunications networks, companies can more easily integrate their
operations to access new markets for their products and services as well as access
a large pool of talented labor in countries with lower wages." Thus, sociotechnical
systems are formed and used to deal with different situations.
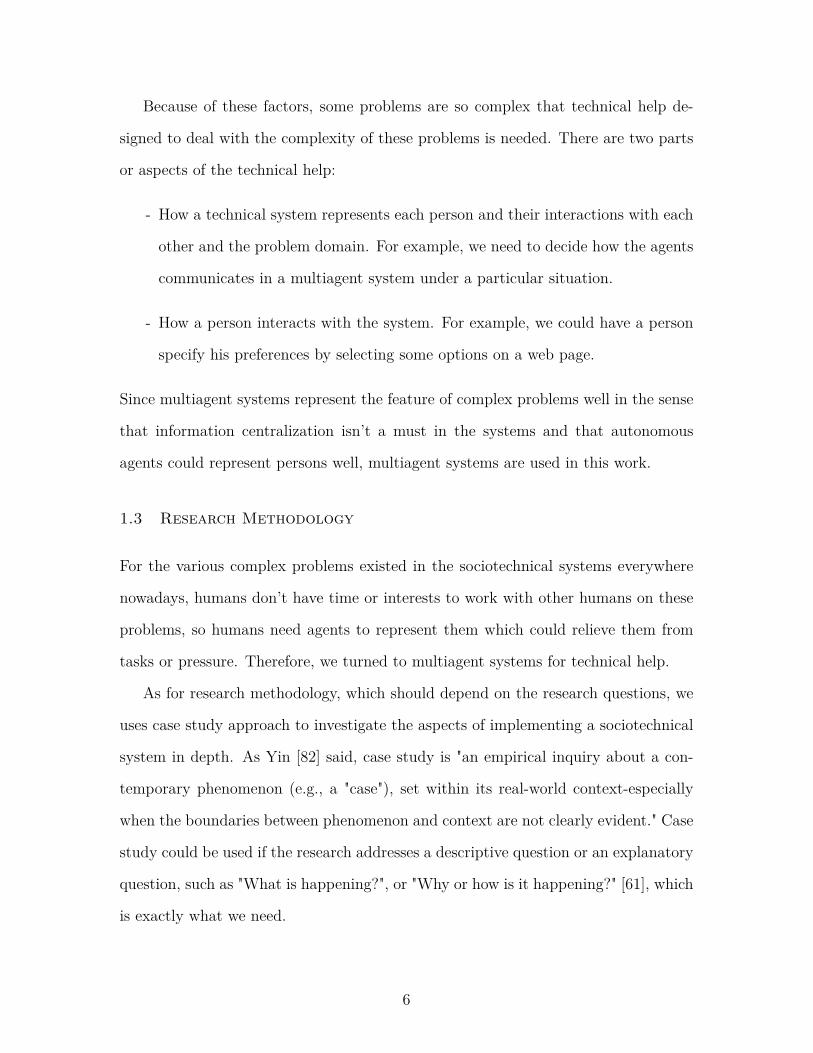
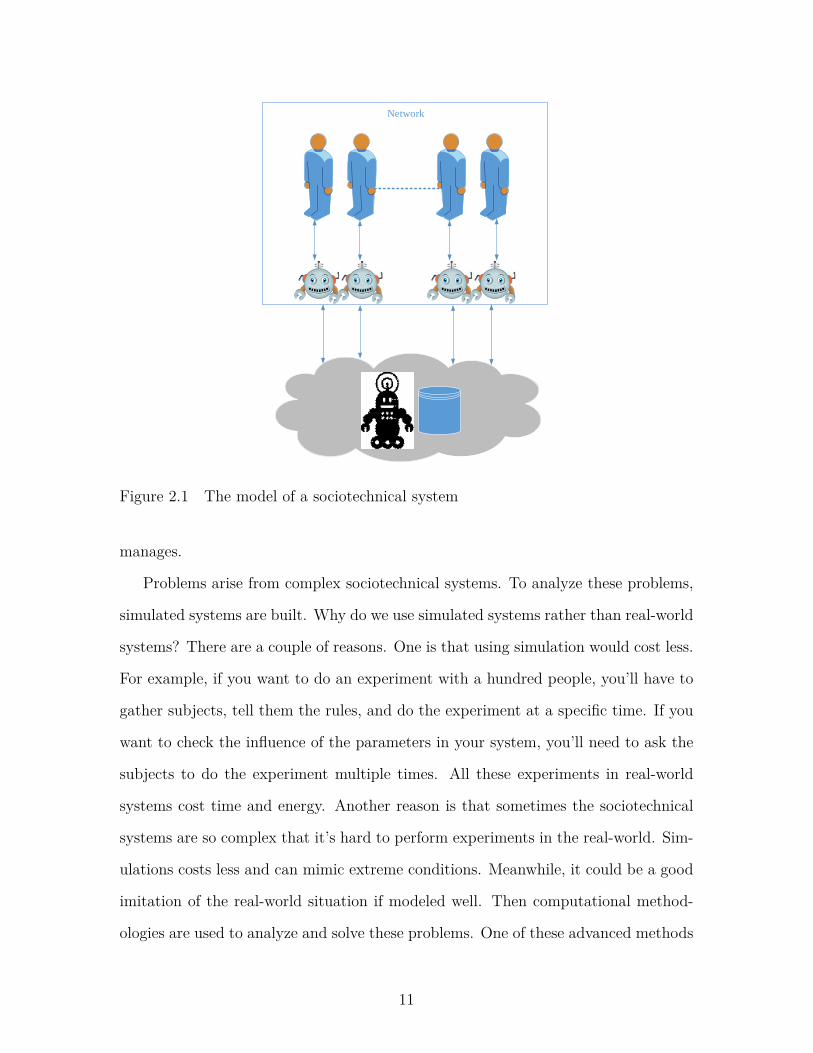
Figure 2.1 shows the model of a sociotechnical system. In the rectangle marked
with "network" there are humans represented by their individual agents involved
in a particular event forming a network. In the network, agents representing their
principles could communicate with each other. Meanwhile, agents could also upload
or download information from a database under the control of a central manager in
the cloud, who is also an agent with a different functionality. The black robot in the
figure is the central manager and the cylinder besides it represents the database it
10
Page 20
Network
Figure 2.1 The model of a sociotechnical system
manages.
Problems arise from complex sociotechnical systems. To analyze these problems,
simulated systems are built. Why do we use simulated systems rather than real-world
systems? There are a couple of reasons. One is that using simulation would cost less.
For example, if you want to do an experiment with a hundred people, you’ll have to
gather subjects, tell them the rules, and do the experiment at a specific time. If you
want to check the influence of the parameters in your system, you’ll need to ask the
subjects to do the experiment multiple times. All these experiments in real-world
systems cost time and energy. Another reason is that sometimes the sociotechnical
systems are so complex that it’s hard to perform experiments in the real-world. Sim-
ulations costs less and can mimic extreme conditions. Meanwhile, it could be a good
imitation of the real-world situation if modeled well. Then computational method-
ologies are used to analyze and solve these problems. One of these advanced methods
11
Page 21
is to use multiagent systems, which will be introduced in section 2.3.
Norms
An important concept in a sociotechnical system or a multiagent system is norms.
Norms regulate the interaction of agents by specifying rules of encounter and lead
the way of how each principle should behave under certain circumstances. Bicchieri
[8] defines a social norm (N) in a population (P) as a function of the beliefs and
preferences of the members of P is the following conditions hold:
- Almost every member of P prefers to conform to N on the condition that almost
everyone else conforms, too.
- Almost every member of P believes that almost every other member of P con-
forms to N.
The definition suggests that a social norm is an equilibrium in the game-theoretic
sense.
Norms are used in the multiagent systems to regulate the behavior of the au-
tonomous agents [9] [28]. For example, Hexmoor [27] modeled norms in multiagent
systems and defined an account of norm stability; Singh [63] viewed a sociotechnical
system as a multistakeholder cyber-physical system and developed an approach for
governance based on a computational representation of norms in organizations.
Norms could be used in our systems. In the grocery shopping scenario, for updat-
ing goods data in the center server, customers are expected to upload real information,
otherwise they get punished, for example, by rated as "low confidence". In the health
care scenario, a patient’s agent trusts the information of other agents if they respond,
which means the norms here include that the agents should not lie to each other. In
the human-agent interaction case, we expect that the simulated human and the agent
in the game don’t lure the subject to make biased decisions.
12
Page 22
Crowdsourcing
One of the most promising approach to solve complex problems in sociotechnical
systems is to use crowdsourcing, which is a distributed methodology. Here is the defi-
nition from Howe [29], who coined the word "crowdsourcing" in 2006: "crowdsourcing
represents the act of a company or institution taking a function once performed by
employees and outsourcing it to an undefined (and generally large) network of people
in the form of an open call. This can take the form of peer-production (when the
job is performed collaboratively), but is also often undertaken by sole individuals.
The crucial prerequisite is the use of the open call format and the large network of
potential laborers."
Crowdsourcing is used by large companies, such as Amazon and Google. Amazon’s
crowdsourcing platform, Amazon Mechanical Turk (AMT), allows people to post or
process tasks on the platform. Companies could use crowdsourcing to receive solutions
quickly at relatively little cost [57] [64]. One problem that a crowdsourcing system
designer should concern is the incentives [47] [69] [58].
We kind of borrow the concept of crowdsourcing in our first two case studies, but
use it in a different way: both utilize the power of the crowd. In the grocery shopping
scenario, we may rely on the goods information reported by customers. In the health
care system, information related to physicians is passed through the network of agents
and is integrated later.
Mixed Human-Agent Societies
As we mentioned earlier, due to the enormous participation of agents into human
societies, mixed human-agent societies are formed. For example, "social computers"
which combine software and human services are constructed. Truong et al. [71]
[70] propose a method to model human capabilities using cloud computing concepts
and combine it with software-based services and establish clouds of hybrid services.
13
Page 23
Sierhuis et al. [10] use a human-centered perspective on teamwork and adjustable
autonomy in mixed human-agent groups and integrate the Brahms [16] and KAoS
[73] agent frameworks to model real work situations.
Because of the challenges in human-agent teamwork coordination [11], we want
to explore ways that could improve the coordination. Among many perspectives or
aspects that can be used to improve coordination, we particularly look into a psy-
chological factor: personality in the third case study in the hope of understanding
humans’ attitude towards agents better and expecting conclusions that could be uti-
lized in human-agent interactions.
2.2 Resource Allocation Problems
There is a lot of concerns on resource allocation problems in both computer science
and economics fields, especially when the resource is scarce. There are circumstances
under which we need to distribute different kinds of resources, such as electricity,
water, network bandwidth, among multiple entities or agents. A particular distri-
bution of the resource is called an allocation. Since multiple agents are involved,
resource allocation problems are also called MultiAgent Resource Allocation (MARA)
problems.
Multiagent Resource allocation has a wide range of applications, such as man-
ufacturing and scheduling [43] [1], logistics [56] and so on. Chevaleyre et al. [15]
presented techniques, concepts, and four major application domains of MARA: in-
dustrial procurement, the joint exploitation of Earth Observation Satellites, manu-
facturing control, and grid computing. Feldman, Lai, and Zhang [23] proposed a
distributed allocation scheme that converged quickly to an equilibrium while main-
taining the balance of efficiency and the fairness indicated by utility uniformity and
envy-freeness. Some researchers developed resource allocation algorithms related to
cloud computing. For example, Ergu et al. [21] proposed a model for task-oriented
14
Page 24
resource allocation in a cloud computing environment with ranking and a bias ma-
trix was used to solve conflicts. In wireless networks, power, time slots, etc. are the
resources that need to be allocated [22] [2] [76].
In game theory, auction is an important mechanism to provide a general solution
to discrete resource allocation among selfish agents. Formally speaking, an auction
is any protocol that allows agents to indicate their interests in one or more resources
and that uses these indications of interest to determine both an allocation resources
and a set of payments by the agents [62].
The allocation procedure could be centralized or distributed. A centralized pro-
cedure requires a single entity that receives the agents’ preferences and chooses an
outcome that satisfies a certain condition, such as maximizing social welfare. One
problem is that agents may lie about their private information, which happens very
common in a collaborative environment [46] [45]. Also, it may not always be possible
to establish a central entity. A distributed procedure doesn’t need the central entity
and usually involves negotiation among the agents. Schmidt et al. [59] discussed
different distributed resource allocation schemes. Bachrach and Rosenschein [4] pro-
posed a distributed and random allocation procedure that converged to the optimal
in terms of utilitarian social welfare.
The third case study is related to resource allocation. It asks the participants
to play a "Who Gets More Cake?" game which is a variant of cake-cutting resource
allocation game with a human-agent related question at the end of the game.
2.3 Multiagent Systems
Researchers proposed different definitions about an agent, or an intelligent agent
[25]. According to Russell and Norvig [55], an agent is anything that can be viewed as
perceiving its environment through sensors and acting upon that environment through
effectors. Jennings, Sycara and Wooldridge [36] consider an agent as a computer
15
Page 25
Figure 2.2 The model of an agent
system, situated in some environment, that is capable of flexible autonomous action
in order to meet its design objectives.
All the definitions agree that an agent should be intelligent and autonomous that
he could make decisions and act on the principle’s behalf on his own based on the
environment he perceived [36] [55] [80], as shown in Figure 2.2. An agent could
be simple, such as a thermostat which controls the air conditioner of a room and
keeps the temperature stable, or something very complex, such as a robot which acts
according to the environment and tries to achieve predefined goals. The thermostat
perceives information about the environment using the mechanic part that detects the
temperature and achieves the goal of keeping the room temperature stable by turning
on/off the air conditioner. The robot perceives the environment using cameras and
other sensors and takes action, e.g., moving to a specific location, based on the
information he integrated. Interestingly, a human could be treated as an agent with
organs perceiving the environment and a brain that integrates perceived information
and makes decisions.
There are a couple of features that an agent could have [36], while autonomy is
16
Page 26
the central notion of agency.
- situatedness: the agent receives sensory input from its environment and it can
perform actions which change the environment in some way.
- autonomy: in the sense that the system should be able to act without the direct
intervention of humans or other agents.
- flexibility: which contains the following three factors:
- responsive: the agent should perceive their environment and respond in a
timely fashion to changes that occur in it.
- pro-active: the agent should be able to exhibit opportunistic, goal-directed
behavior and take the initiative where appropriate.
- social: the agent should be able to interact, when appropriate, with other
artificial agents and humans in order to complete their own problem solving
and to help others with their activities.
There’s one more possible characteristic for an agent: rational. Rational means
an agent always tries to act in a way that will get him the most benefit, or reward.
Humans are not always rational because humans make decisions not only based on
logic. Emotions and other factors are involved while humans make decisions.
A multiagent system consists of more than one agent, and these agents interact
with each other through communication. Each agent may have incomplete informa-
tion or capabilities to solve the global problem in question, and they are trying to
solve the problem through interactions while their primary goals are maximizing their
own benefits. There are many possible ways of interaction, such as cooperation, com-
petition, or negotiation. Due to this high-level of interaction and ability of dealing
with potential complex problems, multiagent systems are good solutions to complex
17
Page 27
problems with multiple solutions/perspectives, such as those mentioned in section
1.2.
The lines between a sociotechnical system and a multiagent system are vague. A
sociotechnical system emphasizes the part that society and technology work together
to reach a better solution, while a multiagent system lay stress on the interaction
among the agents, which includes the technology part and may or may not include
the society aspect. The multiagent systems used in our first two cases include both
the society and the technology aspects, so they are sociotechnical systems too. In
our third case, we focused on investigating the interaction between participants in
the game, while each game could be viewed as a mini sociotechnical system.
18
Page 28
Chapter 3
A Multiagent System Approach to Grocery
Shopping
3.1 Introduction
Aided by information systems for analyzing customer buying data, supermarket
chains continually alter the prices of items to maximize their profits. They do this
by, in essence, experimenting on their customers. For example, the price of an item
might be raised at one store until customers stop buying it. This maximum price
is then used at all of the stores in the chain. The customers at the supermarkets,
however, do not have any comparable information systems that might aid them in
price comparisons and are often at the mercy of the stores. Most stores do not post
their prices online, so that consumers have to visit each store to find the prices of
groceries, which makes comparison shopping prohibitive.
Imagine an online system where customers could post the prices they paid for their
groceries (this could be automated by querying the RFID tags of the items) and where
a prospective shopper could enter a grocery list and obtain a pointer to the store with
the lowest total price. This would enable comparison shopping for groceries and would
render the customer-to-store interactions fairer. It would also encourage stores to
offer their true prices to avoid driving away potential customers. However, the effort
required from the consumers would be substantial. To make the effort reasonable
and manageable, each customer could benefit from an agent that represented his/her
interests and interacted with the agents of the other customers and, possibly, with
19
Page 29
upload
product
infoquery
give
suggestions
ask for help
upload
product
info
download
product info
Figure 3.1 The model of the shopping system
store agents. We have shown this system in Figure 3.1. In this system, agents
representing humans in the left part of the figure upload product information to
the central manager, which is represented by the black robot in the middle, and a
database is used to store the information. To make it clear, the interaction between
a customer who uses this system and his agent is drawn specifically on the right side
of the figure, while the customer could be one of the humans who contribute the
product information as shown in the left part of the figure. The customer asks his
agent for suggestions, and his agent will query the database, get information from
there and provide suggestions based on the information.
However, there is an expense in implementing and operating such a system. More-
over, its success is dependent on prices entered by other consumers, on the availability
of goods, and on prices that stores might change to yield an advantage for them to the
disadvantage of consumers. Hence, it is subject to errors and manipulation. To be
feasible, the potential cost savings must substantially exceed the expense and effort
of its implementation.
In this chapter, we investigate the efficacy of a consumer-oriented comparison-
shopping system for groceries and the trade-offs in an implementation of it. Our
approach is to use real data, normalize it according to typical consumer actions, and
simulate a system of stores and consumers. We introduce both random and systematic
20
Page 30
Shopping
Creatingshopping list Finding stores Deciding stores Transacting
Customer
Store Assistant
Figure 3.2 Overall goal model
(manipulation) errors into our simulation in order to evaluate its robustness.
Our assistant agent’s objective is to assist a customer by all means, especially
by providing a customer with the best combination of price and quality for a list of
products available at different stores and making recommendations of store(s) optimal
for shopping. The whole shopping procedure contains the following four steps, shown
in Figure 3.2. Note that the notation in this figure is from [65].
- creating shopping list: a customer creates a shopping list based on his/her
needs. He should specify items/products and the quantities of the items.
- finding stores: find a series of available stores according to store hours, locations,
the customer’s preference and other possible factors.
- deciding stores: decide which store(s) to go to with the help of an assistance
agent.
- transacting: drive to the store(s) and make transactions.
21
Page 31
3.2 Background
Price comparison services (also known as comparison shopping services) allow people
to query a product’s prices at online stores. The services list the product’s prices in
all of the stores and sort the prices to provide customers with support for their online
shopping. An intelligent software agent to implement comparison shopping is called
a shopbot [17].
In June 1995, the first well-known shopbot called BargainFinder [41] was released
by a group of Andersen Consulting researchers as an intelligent software agent for
comparison shopping. It was designed to find music CDs and had a rather simple
interface. It allowed a user to enter the name of an artist and an album, searched
eight online music stores, and displayed all CD prices on a web page. If the user
clicked on the name of one of the stores, it would bring the user to the specific album
on that store’s website. Consumers gained obvious benefit from BargainFinder and
it has been used widely. Nowadays, shopbots have greater functionality than before
by including information about shipping expenses, taxes, vendors’ rates, and product
reviews. Some corporations even have their own shopbots, such as Google’s Google
Product Search and eBay’s shopping.com. Recently there is also a mobile application
for comparison shopping called RedLaser which can scan the barcode of a product by
the phone’s camera, search many online stores, and show their prices on the phone.
There are typically three steps for a shopbot to deal with data. First, it retrieves
data from online stores or other shopbots, possibly by using an extraction method,
such as [81]. Second, the data is processed according to a user’s command. Last,
the results are shown to the user on a webpage in a way that can be helpful to the
user. One such system lets user re-rank the results locally [13]. Other researchers
are developing better algorithms to improve the behavior of shopbots and making
their performance more robust to changes in the stores’ websites, such as by using
Semantic Web concepts [42]. Other related studies involve consumer search costs and
22
Page 32
benefits [12] [66] and price-setting strategies [26].
3.3 Analysis and Simulation
There are a number of variables in grocery shopping. Our simulation uses five pa-
rameters: customer input, customer location, store location, item price, and item
quantity. Customer input is a customer shopping list that contains the items the
customer wants to buy and the quantity of the items. Store location and customer
location are used to calculate the fuel cost when driving to and from the stores. Item
prices are those either reported by customers or by stores. We assume the quantity
of a specific item in a store is either zero or infinity. All the prices are in US dollars.
Our algorithm begins with the customer’s shopping list of items and quantities. If
the customer just goes to the stores with the lowest price for each item, the customer
might need to go to many stores and spend more on fuel. So we search in all the
stores and find the lowest price and the second lowest price of each item the customer
wants to buy. The combinations of these two prices of the items may lead to the
most economical way for shopping by reducing the fuel cost. We considered all the
possibilities of combination of the two prices and calculate the total cost including
grocery cost and the fuel cost. When calculating the fuel cost, we assume the customer
goes to the nearest store he needs to go to where he has not already shopped until he
gets all the items. For comparison, we also calculate the cost if the customer chooses
to go to stores using three other strategies: (1) choose one store randomly and buy
all the items at that store, (2) go to the nearest store, or (3) randomly go to one of
the five nearest stores. Then we calculate the ratio of the grocery cost and the total
cost of these three methods over that of our method to see the difference.
We next evaluate robustness. What if the stores claim their prices are lower
than they actually charge if the stores themselves provide the prices? What if the
customers make mistakes if they are responsible for reporting the prices to other
23
Page 33
Figure 3.3 NetLogo GUI
customers? We also consider these two situations in our simulation.
The NetLogo platform [79] has been proven to be a useful environment for agent-
based simulations, such as supply chain simulation [37]. We use it for our grocery
shopping simulation. In our simulation, the number of stores and the number of items
can be chosen by sliders in the Netlogo GUI, as shown in Figure 3.3. In reality, a
customer will usually go to one of a few familiar supermarkets, which means we do
not need to indicate very many stores. Our simulation has two phases.
In the first phase, we simulate shopping according to fictitious prices generated
randomly and examine the ratio of the cost of other methods over that of our method
and evaluate the influence of different values for the parameters. For each combination
of parameter values, we ran the simulation 100 times and used the mean of the 100
results. For deception, we assume that the deceptive stores say their prices are 10%
lower than the real prices and the percentage of deceptive stores are 25%, 50% and
75% separately to see how it will affect the results.
In the second phase, we use realistic prices of items collected manually in the
simulation and see whether there is a big difference between the results of simulation
using fictitious prices and that of using realistic prices. With realistic prices, store
24
Page 34
location, item price, and item number are fixed. We did not consider the fuel cost in
this part of the simulation, since its effect would be minor compared to the money
spent on the items. As for the customer input, we constructed a shopping list ac-
cording to the U.S. Consumer Price Index (CPI). CPI, which is published by the U.S.
Bureau of Labor Statistics, measures a price change for a constant market basket of
goods and services from one period to the next within the same area (city, region,
or nation) [51]. Along with CPI, the relative importance of components, which mea-
sures the importance of the items in the market basket by decimal numbers less than
1, is published. We created a realistic shopping list by selecting an item from each
category according to its relative importance [50]. Since there are many categories,
we did not include all of them in our shopping list, so the result was a list of 33
items. For these, we collected item price data from 5 different stores, as shown in
Appendix A. We compared the saving of a customer going to two stores and that of
just going to one store. To measure robustness, we checked the results if there was a
10% possibility that the customers reported each digit of the prices wrong.
3.4 Results and Discussion
In our NetLogo Simulation, we assume there are 12 stores and 30 kinds of items in the
stores. Given 10 items a customer wants to buy, we ran the simulation 100 times for
a random change in a given parameter and calculated the mean, as shown in Tables
3.1 - 3.5. In the tables, we represent the strategy of randomly going to one of the
five nearest stores as "Choose randomly from 5". The ratios in the table are the ratio
of the grocery cost or total cost of a certain method over that of our method. We
also showed what items in which store the customer should buy. When simulating
customers changing the items on their shopping list, using 30 kinds of items increases
the program running time remarkably. To make this more manageable, we limit the
simulation to 10 stores and 15 kinds of items.
25
Page 35
Table 3.1 Simulation results of changing customer location
Method Ratio of grocery cost Ratio of total costChoose randomly 1.24 1.23Choose nearest 1.24 1.24
Choose randomly from 5 1.22 1.22
Table 3.2 Simulation results of changing store location
Method Ratio of grocery cost Ratio of total costChoose randomly 1.24 1.24Choose nearest 1.24 1.23
Choose randomly from 5 1.23 1.23
Table 3.3 Simulation results of changing item price
Method Ratio of grocery cost Ratio of total costChoose randomly 1.22 1.22Choose nearest 1.22 1.22
Choose randomly from 5 1.23 1.22
Table 3.4 Simulation results of changing item number
Method Ratio of grocery cost Ratio of total costChoose randomly 1.27 1.26Choose nearest 1.34 1.33
Choose randomly from 5 1.30 1.29
Table 3.5 Simulation results of changing customer input
Method Ratio of grocery cost Ratio of total costChoose randomly 1.18 1.17Choose nearest 1.11 1.11
Choose randomly from 5 1.16 1.16
As can be seen from the tables mentioned above, our approach to deciding which
stores to shop at can save 22% or more in costs, except when changing customer
input. Since we considered all possibilities and ran the simulation many times, it is
safe to say that our approach is better than the other methods. As for changing the
customer input, the savings are lower, possibly because the program generated the
customer input randomly and it may contain fewer items.
We also considered deceptive stores. What if 25%, 50%, 75% stores are deceptive
26
Page 36
Table 3.6 Simulation results of deceptive stores
Percentage of Ratio of grocery cost Ratio of total costdeceptive stores25% 1.02 1.0250% 1.02 1.0275% 1.01 1.01
114.27
129.52 127.85
129.05
105
110
115
120
125
130
135
0 1 2 3
Co
st (
$)
Store index
Figure 3.4 Costs of shopping at one store
by claiming that their price is 10% lower than the real price? We ran the simulation
with deceptive stores chosen randomly. The ratio in Table 3.6 shows the ratio of
grocery cost or total cost of our approach using deceptive information over using
actual information.
The difference between the cost with real price data and that of deceptive price
data is 2% when 25% of the stores are deceptive. The difference is smaller if more
stores are deceptive: 1% with 75% deceptive stores. So when stores are deceptive,
the customer will save less than when stores are honest. However, our approach is
still valuable, because even after losing 2% due to deception, the customer will still
save more than 20%.
Using the real price data we collected, Figure 3.4 shows the total cost of the goods
on the shopping list if a customer goes to just one store. The lowest price is $114.27
from store 0.
27
Page 37
106.94
108.72 110.05
106.58
118.95 117.60
112.05
117.79
115.10
111.85
100
102
104
106
108
110
112
114
116
118
120
0, 1 0, 2 0, 3 0, 4 1, 2 1, 3 1, 4 2, 3 2, 4 3, 4
Co
st (
$)
Store indices
Figure 3.5 Costs of shopping at two stores
The cost of buying each item at its lowest price is $98.44, which is more than 13%
lower than going to one store, but a customer would have to go to four stores to get
this lowest price. Because a customer might not want to go to more than two stores,
we tried all combinations of two stores and calculated the cost. Figure 3.5 shows that
the lowest cost of $106.58, which occurs when a customer shops at stores 0 and 4, is
6.7% lower than going to just one store.
What if the customers reported the price data wrong? We simulated this situation
by giving each digit of a price a 9% possibility to change to other digits randomly,
each with a 1% possibility. When the price information is wrong, the only thing
changed are the stores the customer would go to. When the customer arrives at the
store, he will still pay the real price. We ran the simulation 500 times and the results
are shown in Tables 3.7 and 3.8, where "Frequency" means the number of simulations
in which an agent recommends his principle to a certain store. Notice that some store
or store combinations are never chosen in 500 simulations, because their overall costs
are too high and thus can hardly be the lowest price, even with a 9% possibility of
incorrect price information.
We can see from the tables that as for the results with one store, there is a 2%
28
Page 38
Table 3.7 Costs and frequencies of shopping at one store with reported price wrong
Store index Cost ($) Frequency0 114.27 4892 127.85 103 129.05 1
Table 3.8 Costs and frequencies of shopping at two stores with reported pricewrong
Store indices Cost ($) Frequency0, 4 106.58 3150, 1 106.94 1180, 2 108.72 350, 3 110.05 303, 4 111.85 2
possibility that the customer would go to another store due to the wrong price data,
rather than going to the store with the lowest price. The average cost, after 500
simulation runs, is $114.57, which is very close to $114.27. For the results with two
stores, there is a 37% possibility that a customer would go to different stores other
than the best combination of two stores. Though the possibility is significant, the
average cost is $107.04, which is very close to $106.58, the lowest price possible for
two stores. So on average, a customer can still save 6.3% by going to two stores
compared to going to just one store, even if the price data is incorrect.
3.5 Conclusion
A societal grocery shopping system as described in this chapter would be useful and
practical, because it helps customers obtain a savings of 22% or more according
to our simulation. Even with deceptive pricing by stores or incorrect price data
reported by other customers, it will still be helpful for obtaining some savings. During
the simulation, we considered all the parameters that may vary in real shopping
experiences: customer location, store location, item price, item number, and customer
input. We varied the parameters to explore this five-dimensional space and produced
29
Page 39
results consisting of the average savings achieved by customers. To validate our results
further, we also used real price data in a simplified version of our simulation containing
fewer stores and shopping at just two of them. The results indicate an average savings
of 6.7% by choosing the best two stores. Even with incorrect price data, customers can
still save 6.3% on average. An implementation of our approach would require a social
infrastructure where customers could report prices they discovered and find prices
reported by others. Based on both simulated and real data, and the expected costs
of such an infrastructure, our system would be useful and cost-effective in practice.
30
Page 40
Chapter 4
Simulating a Sociotechnical System for
Healthcare
4.1 Introduction
This chapter concerns the simulation of a sociotechnical system in the domain of
healthcare. In this case, we view a sociotechnical system as a large-scale informa-
tion system, also called a societal information system, that gathers information from
hundreds or thousands of individual entities with technical help. Such systems can
be abstracted as graphs with nodes representing individual entities and edges rep-
resenting relationships between them. The purpose of a sociotechnical system is to
affect the behavior of a node by means of information retrieved from other nodes.
Nowadays, a person’s behavior is influenced by social networking services, such as
Facebook. However, the amount of information to be comprehended and utilized in
such services can be overwhelming for users. To further automate sharing and pro-
cessing of information within a large social network or a sociotechnical system, we
are investigating supporting each node in the network by a software agent. Software
agents are autonomous computational entities that can be viewed as perceiving their
environment through sensors and acting upon their environment through effectors.
To say that agents are computational entities simply means that they physically ex-
ist in the form of programs that run on computing devices. To say that they are
autonomous entities means that to some extent they have control over their behavior
and can act without the intervention of humans or other systems. Agents pursue
31
Page 41
goals or carry out tasks in order to meet their design objectives, and in general these
goals and tasks can be supplementary as well as conflicting [31] [80]. Agents can form
commitments and act on behalf of individuals and form multiagent systems (MAS).
We view agent-based sociotechnical systems as multiagent systems.
Sociotechnical systems are appropriate for a wide variety of problems, including
regulation (e.g., banking), allocation of scarce resources (e.g., electric power and park-
ing spaces), distributed situation assessment (e.g., urban air quality), system control
(e.g., traffic management, both vehicular and telecommunication), and decentralized
decision-making (e.g., choosing medical care). This article addresses simulating a
sociotechnical system in the area of decentralized decision-making for healthcare.
Healthcare decision-making is done in many developed countries in the context of
a healthcare quadruple, which consists of (1) patients, (2) healthcare providers (hos-
pitals, health centers, labs, etc.) and provider networks, (3) insurance companies,
and (4) the government. There is a variety of information systems available to sup-
port healthcare providers, provider networks, government healthcare agencies, and
insurance companies, but none to support patients. Because patients are naturally
distributed and are typically willing to assist each other, multiagent systems instead
of centralized information systems would be appropriate for fostering this mutual
assistance. In such systems, each patient would be represented by a software agent.
The agent would assist its principal in health-related activities, such as understand-
ing and interpreting insurance rules, finding the most cost-effective insurer, finding
a good healthcare provider, providing advice on cost-effective drugs and care, and
monitoring the spread of disease symptoms and their treatments. Feedback and in-
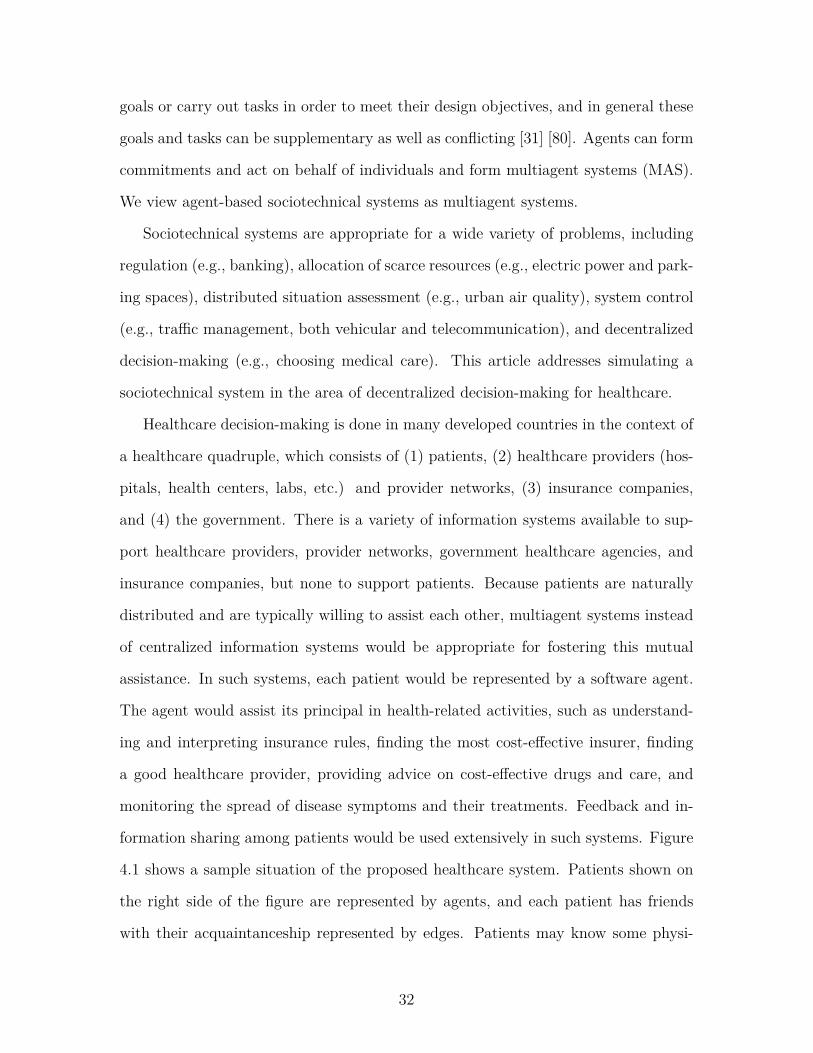
formation sharing among patients would be used extensively in such systems. Figure
4.1 shows a sample situation of the proposed healthcare system. Patients shown on
the right side of the figure are represented by agents, and each patient has friends
with their acquaintanceship represented by edges. Patients may know some physi-
32
Page 42
refer
refer
Figure 4.1 The model of the healthcare system
cians, denoted by the edges between patients and physicians. Physicians has agents
represent them too, and a physician may refer another physician.
Investigating sociotechnical systems for healthcare is a broad research area. More-
over, it is difficult to experiment with such information systems in a society, especially
because patients’ health, privacy, and rights must be considered. We therefore have
relied on simulations for prototyping and evaluating.
This chapter is organized as follows. First, we explain the method we use for pro-
totyping the healthcare system - agent-oriented modeling. Second, we describe briefly
how agent-oriented modeling is applied to design a simulated system for healthcare
running on the NetLogo platform. Third, we analyze and explain the simulation re-
sults. We conclude by comparing the outcomes of using different choosing-a-physician
strategies and waiting policies in the healthcare system and discussing the benefits
33
Page 43
of a sociotechnical system for healthcare.
4.2 Related Work
Multiagent systems are widely used in different areas, such as tracking goods, traffic
control, consensus knowledge, and decision-making [30]. One of the interesting areas
for applying a MAS is healthcare.
Nealon and Moreno [49] analyze features of healthcare problems, including the
distributed nature of the knowledge that is needed to solve a problem, coordina-
tion, complexity, and so on. They claim that a MAS is an appropriate approach to
tackle healthcare problems and could be used for patient scheduling, organ and tissue
transplant management, community care, information access, and decision support
systems. Isern et al. [34] compare the internal architecture and communication-based
coordination techniques of fifteen healthcare-related agent-based systems and claim
that agent-based systems increase reusability, flexibility, and other beneficial qualities
as compared with centralized software systems, such as client-server systems.
MASs are also broadly used in home-care systems. Koutkias et al. [40] present a
MAS for monitoring and detecting important cases for disease management. Isern et
al. [33] describe the K4Care Home Care model, which uses an agent-based platform.
Charfeddine [14] introduces an agent-oriented framework to simulate the population
of a chronic disease.
In the work most closely related to ours, Udupi and Singh [72] use conceptual
models in a sociotechnical system to implement a peer-to-peer network in which an
agent contacts other agents to discover suitable service providers. It uses InterPol, a
language and framework for supporting different kinds of interaction policies between
agents. We described the modeling method of our sociotechnical system in [67].
There are several websites, similar to RateMDs [32], where people rate doctors
according to punctuality, medical knowledge, and other characteristics, and add com-
34
Page 44
ments. As we explain later, our approach differs from such websites and has advan-
tages.
4.3 Methodology
We focuses on designing sociotechnical systems of a particular kind - sociotechnical
systems for finding an appropriate physician and finding out the benefits to do so.
We use the case study method [67] and explore by rapid prototyping the design of
a simulation of a sociotechnical system for healthcare. Rapid prototyping stands for
implementing a proof-of-concept prototype in an agile way by directly mapping the
modeling constructs to the constructs of a scripting environment like Netlogo or some
agent-oriented environment like JADE. The method we use for prototyping is agent-
oriented modeling. Agent-oriented modeling as described in [65] is a holistic approach
for analyzing, designing, and rapid prototyping of sociotechnical systems consisting
of humans and technical components. We have chosen agent-oriented modeling be-
cause it is geared towards prototyping distributed systems that are open, adaptive,
and intelligent. Sociotechnical systems are open systems because members of the
society (e.g., commuters, patients, or shoppers) may join and leave the system at
any time. Sociotechnical systems are adaptive systems, because they should react
to their constantly changing environment, which for example can take the form of
changes in traffic infrastructure, health insurance coverage, and product prices. We
also term sociotechnical systems as intelligent systems, because they reflect the "wis-
dom of crowds" when recommending a patient, for example, a healthcare provider.
In addition, agent-oriented modeling meets well the requirements for purposefulness
and understandability of the design.
A set of canonical models are introduced in agent-oriented modeling, whose types
are shown in Table 4.1. In addition to representing each model with an abstraction
layer (analysis, design, or prototyping), Table 4.1 maps each model to the vertical
35
Page 45
Table 4.1 The model types of agent-oriented modeling
Viewpoint aspectAbstraction layer Interaction Information Behavior
Analysis Role models and Domain model Goal modelsorganization model
Design Agent models and Knowledge Behavioralinteraction models models scenarios
Prototyping Interaction Information Behaviorprototyping prototyping prototyping
viewpoint aspect of interaction, information, or behavior. Each cell in the table rep-
resents a specific viewpoint. We explain these viewpoints in the following paragraphs.
From the viewpoint of interaction analysis, role models represent the properties of
roles and the relationships between the roles are represented by an organization model.
From the viewpoint of information analysis, a domain model represents the knowledge
to be handled by the sociotechnical system. From the viewpoint of behavior analysis,
a goal model is a container of three components: goals, quality goals, and roles.
From the viewpoint of interaction design, agent models transform the abstract
constructs from the analysis stage, roles, to design constructs, agent types, which
will be realized in the implementation process. Interaction models are used to ex-
press interaction patterns between agents. From the viewpoint of information design,
knowledge models represent both private and shared knowledge of agents. From the
viewpoint of behavior design, behavioral scenarios are used to show how agents make
decisions and perform activities [68].
Modeling at the abstraction layer of prototyping is explained in section 4.4.
Figure 4.2 shows the goal model of our sociotechnical system for healthcare, in
which rectangles stand for functional goals and clouds stand for quality goals. The
stick figures represent roles that are required for achieving the goals. As can be seen
from Figure 4.2, from the viewpoint of behavior analysis, our sociotechnical healthcare
system focuses on the purpose of "Allocate Healthcare Resources" among the members
36
Page 46
Figure 4.2 The goal model of the healthcare system
of the society. Specifically, we study the allocation of physicians - a special kind of
healthcare resource. Achieving the functional goal "Allocate Healthcare Resources"
is characterized by the quality goal "Maximal Societal Health", which determines the
quality criterion according to which healthcare resources should be allocated in a
society.
To accomplish the purpose "Allocate Healthcare Resources" of the sociotechnical
system, its four subgoals need to be achieved: finding a healthcare provider, be-
ing provided with care, evaluating the care, and recommending healthcare providers
to other patients. As we demonstrate below, to fulfill the goal "Find Healthcare
Provider", a patient recursively asks her friends, friends’ friends, and so forth for rec-
ommendations and chooses the best physician recommended. This is represented as
two subgoals of "Find Healthcare Provider:" "Ask Friends" and "Choose."
We attach a number of quality goals to the functional goals in the goal model. The
meanings of the quality goals are easy to understand. For example, "Quickly" means
37
Page 47
a patient wants to find a healthcare provider as soon as possible. The "Anonymous"
quality goal expresses that no evaluation by a patient should identify the patient.
It should be noted that the quality goal "In the Context" attached to the functional
goal "Evaluate" represents that evaluation has to occur in the context of receiving the
service, preferably before leaving the facilities of the healthcare provider or at least
on the same day. The "Processable" quality goal means that the evaluation should
be presented in a form amenable to computer processing. In our simulation, we use
a scale from 1 to 5 to measure the evaluations.
According to Figure 4.2, we model two roles for our simulation - Patient and
Healthcare Provider. There is also a third role - Government. Since our work focuses
on the particular aspect of the U.S. healthcare domain dealing with how a patient finds
a physician, rather than modeling the healthcare domain in its full complexity, the
Government role’s modeling is not relevant to the simulation system being designed
and we ignore the Government role in our system. Additionally, we complement
the goal model with the new Assistant role, which is not shown in Figure 4.2. The
Assistant role is the assistant of a person and is responsible for asking friends for
recommendations, choosing a healthcare provider, and assisting in evaluating the care.
In the prototypical system being designed, the role of Assistant should obviously be
mapped to the Assistant Agent software agent type. Since a patient is a real human
that is treated by another real human - a physician - we map both the roles Patient
and Healthcare Provider to the Human Agent type. The software system boundary
of the sociotechnical system is obviously between the roles Patient and Assistant.
From the viewpoint of interaction analysis, the organization model of the so-
ciotechnical system being designed is decided based on the three kinds of networks
that are used for representing the relationships among the members of the society as
follows. Also, we make the average degree of the three networks equal to or almost
equal to a certain number, which is 6 in our case, in order to reduce the differ-
38
Page 48
ence among different network models. The average degree of a graph is defined as
2 ∗ |E|/|V |, where |E| is the number of edges and the |V | is the number of vertices
in the graph.
- Random network: the relationships between pairs of patients are created ran-
domly until the desired number, which is 3 times of the number of nodes, to
ensure the average degree is 6.
- Small-world network: most nodes are not neighbors to one another, but most
nodes can be reached from any other node by a small number of hops. We
followed the approach in [77] to construct our network by first organizing the
vertices into a circle, connecting each vertex to its 3 nearest neighbors and then
rewiring each edge between the vertex in question and its kth nearest neighbor
with a 20% probability, where k = 1, 2, 3 for all the vertices in the graph. Edges
which satisfy the condition that k equals to a certain number should be rewired
first and then the procedure goes on with next available k. The average degree
is 6 in the small-world network.
- Scale-free network: the shortest paths between nodes flow through hubs, and if
a peripheral node is deleted, it is unlikely that this will interfere with passing a
message between other peripheral nodes. We use the Barabási-Albert model [5]
to construct a scale-free network for our simulation. Starting with two nodes,
we keep adding a new node and 3 edges which connect the new node with three
nodes that are already in the graph each time until we reach the desired number
of nodes. For the edges, the probability of connecting with a certain node i in
the graph depends on the connectivity or degree of the node ki such that the
probability is ki/∑
j kj. For the first new node added, we add two edges because
there are only two nodes in the graph in the beginning. The average degree of
39
Page 49
(a) Random network (b) Small-world network (c) Scale-free network
Figure 4.3 Different networks
the scale-free network is 5.998, which is very close to 6. A scale-free network is
a common model for a collaboration network.
We have shown examples of the three different networks in Figure 4.3. The number
of persons is 15 and the average degree is 4 in these networks. The edge between two
persons means they know each other.
After covering the viewpoints of behavior analysis and interaction analysis, we
next proceed to the viewpoint of information analysis by addressing the knowledge
to be represented within the system. We do this by identifying the types of knowledge
entities related to the roles. As each healthcare provider has predefined capacity and
efficiency, which are explained in section 4.4, we attach the Capacity and Efficiency
knowledge entity types to the Healthcare Provider role.
We now proceed to the viewpoint of interaction design. Finding a physician
involves interactions between Assistant Agents representing patients. We represent
these interactions as an interaction protocol between agents of the type Assistant
Agent. It is appropriate to remind here that the difference between an interaction
protocol and other kinds of interaction models is that an interaction protocol models
some aspects of the agent behaviors along with their interactions [65].
Representing the interaction protocol of the sociotechnical system is very impor-
40
Page 50
tant, because it describes the patient’s strategy of choosing a physician. We explored
the following four possible choosing-a-physician strategies:
- Random strategy. The patient’s Assistant Agent randomly chooses a physician.
- The "Choose one" strategy. The patient’s Assistant Agent chooses the best
physician according to the patient’s evaluations and his friends’ evaluations.
Besides the physician(s) with the best evaluation the patient already knows,
his Assistant Agent asks his friends’ Assistant Agents for recommendations.
An Assistant Agent acting on behalf of the patient’s friend may deal with the
request in one of the following ways:
- Reply with the physician(s) who has the best evaluation.
- Provide the requesting agent with the address of the Assistant Agent of
one of its principal’s friends if there is no recommendation to give. This
process continues recursively until the first recommendation is received or
until all the friends down to the maximum forwarding depth have been
asked. The forwarding depth is defined as follows: the originator’s friends
are at depth 1; the originator’s friends’ friends at depth 2, and so on.
Figure 4.4 presents the interaction protocol among patients’ Assistant Agents
for the "Choose one" strategy. It models that the Assistant Agent of a patient’s
friend may respond with a recommendation or recommend the Assistant Agent
of the friend’s friend. This means the interaction protocol is recursive, which
is represented by the "Loop" behavioral construct. A friend’s Assistant Agent
may also ignore a request, which is not shown in the figure.
In addition to the random and "Choose one" strategies, we have included in our
simulations the "Borda voting" and "Add and minimize" strategies. These strategies
are briefly described as follows:
41
Page 51
Figure 4.4 The interaction protocol for "Choose one" strategy
- The "Borda voting" strategy. The patient’s Assistant Agent asks his friends’
Assistant Agents, who are closer than a specified limit in depth, for recom-
mendations. A friend’s Assistant Agent may choose to not answer, or tell the
patient’s Assistant Agent what it knows about all the physicians. After the
patient’s Assistant Agent has received all the responses, it calculates for each
physician the Borda count [a single-winner election method in which voters rank
candidates in order of preference, named for the 18th-century French mathe-
matician and political scientist Jean-Charles de Borda, who devised the system
in 1770], according to which a physician is given a number of points equal to
the number of physicians whose evaluations are worse than the evaluations of
the given physician. Thereafter the agent adds up all the points gained by the
physician in question. The physician with the highest score is chosen.
- The "Add and minimize" strategy, which has the same procedure for getting
recommendations as the "Borda voting" strategy. After the patient’s Assistant
Agent has received all the responses, it adds up all the nonzero evaluations
42
Page 52
and calculates the mean value of them for each physician. Then the Assistant
Agent chooses the physician with the minimum mean evaluation. Choosing the
physician with the minimum value is due to the way we define the evaluation,
as described in section 4.4.
To make it clear, Figure 4.5 shows an example. In the figure, a red-border box
means the agent with its principle ignores the request when asked for recommendation
(Allan and Erle); green means it wants to reply and it has some information (Bob,
Conan, Flora and Gabby); purple means it wants to reply but it has no information
(Daniel and Harris). In the "Choose one" strategy, Paul’s agent asks agents of all his
friends, Allan, Bob, Conan, and Daniel. Allan’s agent doesn’t reply for this time.
Agents of Bob and Conan reply with the evaluations of the best physician(s) they
know. Daniel’s agent wants to reply, but it doesn’t have any information. Thus, it
gives Paul’s agent the addresses of the agents of Daniel’s friends, Gabby and Harris.
Paul’s agent asks Gabby’s agent for recommendation and Gabby’s agent replies with
the best physician it knows, then Paul’s agent won’t ask Harris’s agent any more. In
the "Borda voting" and "Add and minimize" strategy, Paul’s agent will ask agents of
all the other persons in the figure if the depth limit is set to 2, gather evaluations of
all the physicians from them and integrate these information to make a suggestion.
From the viewpoint of behavior design, to model the behaviors of agents of the
decided types, we transform responsibilities of the roles into activities attached to the
agent types. As a result, we obtain behavioral scenarios for agents playing the roles
Patient, Assistant, and Physician. For example, the behavioral scenario of an agent
of the type Assistant Agent playing the role Assistant models that the activities "Find
a physician" and "Evaluate" are performed sequentially. In a sociotechnical system
for healthcare this is always the case, because the Assistant Agent does not perform
any activities between these activities while a patient is attended by a physician.
Another aspect of the Assistant Agent’s behavior in choosing a physician deals
43
Page 53
Allan
Bob
Conan
Daniel
Erle Flora
Gabby Harris
Paul
Figure 4.5 An example of different strategies
with what the agent should do if the physician is not available on the given day.
We have decided to consider the following three waiting policies, which, for instance,
could be decided by the patient’s insurance company:
- Waiting. The patient’s Assistant Agent chooses the best physician by adopt-
ing one of the choosing-a-physician strategy explained above and sticks to this
choice. If the physician is busy, the patient will still make an appointment with
the physician and will wait until the physician becomes available.
- No waiting. If the physician chosen is busy, the patient’s Assistant Agent will
choose a physician randomly according to the "Random" strategy or the next
best physician according to the other choosing-a-physician strategies until it
finds an available physician.
- Waiting with limit. If the physician chosen is not available, the patient’s As-
sistant Agent will check whether the physician could be reached in a certain
44
Page 54
number of days. If it is possible, the patient will make an appointment and wait.
If not, the Assistant Agent will choose another physician according to the rules
of the same waiting policy. If no physician is available in a certain number of
days, the Assistant Agent will choose a physician who has the smallest number
of days required for waiting.
Finally, distinguishing between private and public knowledge entities from the
viewpoint of information design is straightforward, because the knowledge entity
Evaluation is private to the patient and Assistant Agent helping him/her, while the
knowledge entity Recommendation is shared between different patients and instances
of Assistant Agent. Similarly, the knowledge entity Efficiency is private to each
Healthcare Provider, but at the same time naturally forms a basis for how patients
evaluate healthcare providers. We describe models including role models, the organi-
zation model, and the domain model in detail in [67].
4.4 Evaluation
Simulation Settings
We next describe from the three viewpoints introduced in section 4.3 how we mapped
agent-oriented models of the sociotechnical system to the programming constructs of
the simulation environment.
From the viewpoint of information prototyping, we represented the knowledge
entities decided by agent-oriented modeling as described in section 4.3 as follows:
- The Capacity knowledge entity - in terms of the number of patients per day
that a given physician can handle.
- The Efficiency knowledge entity - in terms of the number of days that it takes
for a given physician to cure a patient. This number of days is generated for
45
Page 55
each physician according to a normal distribution whose mean and standard
deviation can be adjusted in the user interface.
- The Evaluation knowledge entity - in terms of the following variables:
- The number of days the physician in question failed to handle a given
patient. How this value is determined is explained below.
- The number of days that the physician needed to cure a patient. This is
determined by the Efficiency knowledge item pertaining to the physician.
- A random component representing that different patients evaluate the
same physician differently.
A patient’s evaluation for a specific physician is calculated by adding these three
factors. For example, let us assume that a patient gets sick today and decides to visit
a physician chosen by her Assistant Agent, but the physician is busy and cannot see
the patient until tomorrow. In this case, the value of the first factor - the number
of days the physician in question failed to handle a given patient - is 1, because the
patient had to wait for 1 day to see the physician. The second factor - the number
of days that the physician requires to cure the patient - is a fixed number related to
the physician in question. The third factor - the random component expressing the
subjective factor - is a random value that varies between -0.5 and 0.5.
The viewpoint of behavior prototyping covers the behaviors of software agents
representing patients and physicians. In accordance with the behavioral scenarios
modeled as a part of the design described in section 4.3, every day the patients
each try to decide which physician to visit. For each patient, the Assistant Agent
acting on behalf of its principal may ask Assistant Agents of the principal’s friends
for recommendations and then makes a decision as to which physician the principal
should visit.
46
Page 56
From the viewpoint of interaction prototyping, the exchange of messages to be
implemented is modeled according to interaction diagrams, such as the one in Figure
4.4 for the case of choosing a physician according to the "Choose one" strategy. To
make our simulations more realistic, we have chosen a 20% probability that a friend
would ignore the patient’s request.
Back to the viewpoint of behavior prototyping, the software agent corresponding
to the Assistant Agent recommends physicians based on evaluations. The agent
can recommend only those physicians that its principal has actually visited in the
simulation. The number of days the physician in question could not handle the given
patient, because of the physician’s exceeded capacity, accumulates in the patient’s
evaluation until the patient actually visits the given physician. On each new visit the
agent "forgets" its previous evaluation and updates its knowledge base with the new
evaluation. The reason why the agent forgets its previous evaluation is that during
the time period between the previous evaluation and the new evaluation, factors that
influence the evaluation may have occurred. For example, the physician may have
become more skilled. Therefore it is fairer to use the latest evaluation.
To make our simulations as realistic as possible, we used the following statistical
data by the Centers for Disease Control and Prevention (CDC) from the year 2008
[24]:
- The number of physician office visits per 100 people per year: 320.1.
- The number of physicians per 10,000 people: 26.
Based on the above data, we obtained the average number of people who get sick
every day by dividing the number of visits per 10,000 people by 250, which is the
standard number of working days in a calendar year in the U.S. As a result, 128
people out of a population of 10,000 get sick every day.
47
Page 57
Figure 4.6 Days needed to be cured by different physicians
Table 4.2 Average sick days for random network
Waiting policyChoosing-a-physician strategy Waiting No waiting Waiting with limit
Random 6.8 6.8 6.8Choose one 12.2 5.2 6.3Borda voting 34.8 6.0 8.3
Add and minimize 10.2 4.9 6.4
Results and Evaluation
We simulated 365 days with 5,000 patients and 13 physicians. In our simulation, 64
random people get sick every day. The value of the local variable of each physician’s
software agent corresponding to the Capacity knowledge entity was set to 8 patients
per day. The value of the local variable of each physician’s software agent corre-
sponding to the Efficiency knowledge entity was determined randomly according to
a normal distribution with mean value 3 days and with the value of deviation as 2.0.
Figure 4.6 describes the number of days needed for curing by different physicians
in our simulations.
We performed simulations by combining the types of social networks with different
choosing-a-physician strategies and waiting policies, which are described in section
4.3. The results from simulations in terms of the annual sick days per person and
leftover patients who were not taken care of by the end of the last day simulated are
represented in Tables 4.2 - 4.7.
We can see from Tables 4.2 - 4.7 that if a patient follows the "Waiting" policy,
48
Page 58
Table 4.3 Leftover patients for random network
Waiting policyChoosing-a-physician strategy Waiting No waiting Waiting with limit
Random 0 0 0Choose one 427 0 80Borda voting 4569 0 96
Add and minimize 155 0 94
Table 4.4 Average sick days for small-world network
Waiting policyChoosing-a-physician strategy Waiting No waiting Waiting with limit
Random 6.8 6.8 6.8Choose one 10.3 5.2 6.3Borda voting 7.6 6.6 6.8
Add and minimize 9.6 5.0 6.3
Table 4.5 Leftover patients for small-world network
Waiting policyChoosing-a-physician strategy Waiting No waiting Waiting with limit
Random 0 0 0Choose one 407 0 71Borda voting 76 0 25
Add and minimize 239 0 93
Table 4.6 Average sick days for scale-free network
Waiting policyChoosing-a-physician strategy Waiting No waiting Waiting with limit
Random 6.8 6.7 6.8Choose one 13.7 5.3 6.3Borda voting 38.6 6.5 9.9
Add and minimize 9.4 4.9 6.4
Table 4.7 Leftover patients for scale-free network
Waiting policyChoosing-a-physician strategy Waiting No waiting Waiting with limit
Random 1 0 2Choose one 686 0 78Borda voting 4449 0 110
Add and minimize 255 0 96
49
Page 59
the "Random" strategy will outperform all the other choosing-a-physician strategies
in social networks of all three kinds addressed. This is the case because in all the
other strategies, a patient always waits for the best physician chosen by her Assistant
Agent, which increases the waiting days and accordingly sick days. Also, because the
Random strategy leads to even visiting of physicians, it has no leftover patients, but
there are leftover patients in the other three strategies.
The performance of the "Borda voting" strategy is the worst in all three kinds of
social networks addressed, except for the combination of the "Borda voting" strategy
and "Waiting" policy in the small-world network, because it uses more evaluation
information than the other strategies due to its method for calculating the votes for
physicians.
Differently from the "Borda voting" strategy, the "Add and minimize" strategy uses
less information because it does not consider the physicians who have not been eval-
uated. The patients whose Assistant Agents follow the "Add and minimize" strategy
therefore tend to choose physicians with fewer days required for curing, as compared
with other choosing-a-physician strategies, and then wait for that physician chosen,
which increases the number of sick days.
If the "No waiting" policy is adopted, all the other strategies will outperform
the "Random" strategy. This is because the patients’ Assistant Agents consider the
evaluations by their principals’ friends and choose the best physicians, and there is
no problem of waiting.
If the "Waiting with limit" policy is adopted, the "Choose one" and "Add and
minimize" strategies show the best performance. However, these strategies result in
more leftover patients than the random strategy. This is reasonable, since according
to "Choose one" and "Add and minimize" strategies a patient may be willing to wait
for a good physician if the waiting time is less than 2 days, leading to just a few
leftover patients and less average annual sick days.
50
Page 60
Figure 4.7 Number of patients going to each physician in total
According to the "Random" choosing-a-physician strategy, patients’ Assistant
Agents just choose physicians randomly and each physician has almost the same
number of patients in total. For the other three strategies, as time passes, Assis-
tant agents gradually gather enough information about physicians, evaluate them,
and recommend to their friends the best physicians they are aware of. As a result,
after patients have formed their opinions about the physicians, good physicians get
full capacity of patients every day and bad physicians get only a few patients. For
example, Figure 4.7 shows the total number of patients going to each physician with
"Waiting with limit" policy and "add and minimize" strategy in random network, and
the number of patients going to each physician each day are shown in Appendix B.
We also performed simulations with fewer physicians to check whether the claims
stated above still hold. We adopted the "Choose one" and "Add and minimize"
choosing-a-physician strategies and "No waiting" and "Waiting with limit" policies
for conducting simulation experiments with 7 physicians. Table 4.8 shows the re-
sults in terms of average sick days. We can see that for the "No waiting" policy, the
"Choose one" and "Add and minimize" choosing-a-physician strategies still perform
better than the combination of "Random" strategy and "No waiting" policy. This is
because a patient’s Assistant Agent first chooses a physician who requires less days
for curing and only then randomly chooses a physician if the patient has to wait.
51
Page 61
Table 4.8 Average sick days with seven physicians
Waiting policyChoosing-a-physician strategy No waiting Waiting with limit
Random 28.0 19.2Choose one 26.2 19.2
Add and minimize 18.3 19.2
Table 4.9 Average sick days with probability = 0.6
Waiting policyChoosing-a-physician strategy Waiting No waiting Waiting with limit
Choose one 9.9 5.3 6.3Borda voting 7.6 6.3 6.6
Add and minimize 9.8 5.0 6.4
Table 4.10 Average sick days with probability = 0.4
Waiting policyChoosing-a-physician strategy Waiting No waiting Waiting with limit
Choose one 8.7 5.4 6.2Borda voting 7.1 6.1 6.4
Add and minimize 10.4 5.1 6.4
Table 4.8 also shows that the combination of the "Waiting with limit" policy and
all strategies for choosing a physician yields almost the same result.
In addition, we investigated the performance of a system having a lower probability
that the friends of a patient in small-world network will answer a request, which are
shown in Tables 4.9 and 4.10. The "Random" strategy is shown here because it is not
influenced by the probability.
Comparing Table 4.4 with these two tables, we discovered that the conclusions
before still hold. To clarify this, we include Table 4.11, which denotes the changing
trend of the average sick days while the probability is decreasing. In the table,
"+" means increasing and "" means decreasing. We can see from the table that for
"Add and minimize", the average sick days increases while the probability decreases,
because patients gets fewer responses from friends, leading to less informed decisions.
For the "Borda voting" strategy, the average sick days decreases while the probability
52
Page 62
Table 4.11 Changing trend with decreasing probability
Waiting policyChoosing-a-physician strategy Waiting No waiting Waiting with limit
Choose one - + -Borda voting - - -
Add and minimize + + +
decreases. As mentioned before, due to the way that the "Borda voting" strategy
gets the evaluation and calculates, it always gets too much information and lead to
worse results than other strategies. So when the information is less with decreasing
probability, we have better results of less average sick days. There’s no fixed trend
for a certain waiting policy with different choosing-a-physician strategies.
In the simulation, we don’t guarantee that each patient rates all the physicians
or the same number of physicians. The procedure of going to the physicians and
learning about them follows a natural way in the real life if a patient asks his friends
for recommendations. The patient’s agent integrates the information and suggests
a best physician according to a particular strategy and policy. As time goes on,
everyone learns who are the best physicians and they tend to go to those physicians,
so it is not the case that some patients have an undue influence on the ratings.
If there is an epidemic in a certain area, conclusions become different for two
waiting policies while the assumption of a uniform rate of sick people doesn’t hold
any more. In the particular area, large amount of patients rush into hospitals. If they
adopt the "Waiting" policy, the patients will all be waiting for some of the physicians
and it will take some patients a long time to get to the physicians except for the
"Random" strategy. For the "Random" strategy, patients choose the physicians ran-
domly and are distributed to physicians uniformly. Since the number of the patients
increases a lot during epidemics, the average sick days and the number of leftover
patients will definitely increase. However, our previous conclusions still hold which is
the "Random" strategy will outperform other choosing-a-physician strategies. If the
53
Page 63
"No waiting" policy is adopted, patients tend to go to the best available physicians.
However, because the number of the patients is too large, almost every physician will
be occupied. Thus, all the choosing-a-physician strategies will perform the same as
the "Random" strategy. For the same reason, if the "Waiting-with-limit" policy is
adopted, all the choosing-a-physician will behave the same.
Another concern is that we only deal with general practitioners, but not specialists.
If we include specialists in our system, the recommendation mechanism will work the
same way as it is now. The only difference is that the ratings of specialists may
probably be higher than the general practitioners. If a patient only cares about
his goal, e.g., to get cured fast, without insisting choosing a specialist or a general
practitioner, the system will work as before. If a patient has a request of choosing a
specialist, the system could recommend him with the best specialist according to his
strategy and policy with just adding a variable to indicate the type of a doctor.
4.5 Conclusion
This chapter describes the design and rapid prototyping of a sociotechnical system
for healthcare. Agent-oriented modeling was chosen for developing our simulation
because it explicitly addresses the design of sociotechnical systems where the activities
of humans are supported by software agents.
We investigated the prototyped sociotechnical healthcare system using agent-
based simulations on the NetLogo platform. In the simulation, we investigated the
influence of different strategies of finding an appropriate physician and different wait-
ing policies in three common social network models. Our prototype revealed that
if a patient adopts the "Waiting" policy, the "Random" strategy will outperform all
the other strategies of choosing a physician. On the other hand, with the "No wait-
ing" policy, all the other strategies will outperform the "Random" strategy. If the
"Waiting with limit" policy is adopted, the "Choose one" and "Add and minimize"
54
Page 64
strategies will show the best performance. We found that by adopting the "Choose
one" or "Add and minimize" strategy, in the "No waiting" and "Waiting with limit"
case, the average number of sick days can be reduced by 0.4 - 1.8 days or 6% - 27%.
If there is an epidemic, large amount of people get sick and rush into hospitals. If
the "Waiting" strategy is adopted, which is rarely the case in the real world during
epidemics because patients probably want to be cured as soon as possible, the "Ran-
dom" choosing-a-physician strategy will outperform all the other strategies. For the
other two policies, all the choosing-a-physician strategies perform the same.
Our sociotechnical system differs from RateMDs and other similar websites where
people can rate and find physicians in the way that people rate the physicians and
patients interact. It is difficult to compare the effect of these websites and that of our
system, mostly because there are no objective evaluation statistics on the websites,
such as the length of time each patient takes to get cured during a period. Such
websites use more flexible criteria on which different people might have different
opinions, such as punctuality, medical knowledge, and time spent on a patient, while
our system uses the time it takes to cure a patient as a criterion, which is more
objective and meaningful. Although patients might access more ratings online, they
usually do not know the people who have rated the physicians and there is a higher
possibility that the ratings will not be truthful and accurate. In our system, a patient
relies on friends’ recommendations, which are typically more reliable.
Each agent in the sociotechnical system could be implemented on a mobile de-
vice which also has sensors to detect his principle’s body temperature, glucose, and
other health measures. In this way, the agent becomes an intelligent personal health
assistant. It could warn the principle about abnormal health measures, provide sug-
gestions on diet and exercise, and recommendations for physicians if his principle gets
sick. Developing such multi-functional agents will greatly improve the life quality of
people, especially those with potential health problems.
55
Page 65
Chapter 5
Determining the Effect of Personality Types
on Human-Agent Interactions
5.1 Introduction
Agents are used nowadays to help with people’s everyday life in many ways. For
example, an agent could help travelers find the cheapest ticket for a specific flight, or
get elders their medications. Thus, it is not surprising that people have feelings about
agents. It is reported that humans show empathy towards robots [44], evidenced
by measuring their emotional and neurological change when they watched videos of
dinosaur robots being abused. However, people’s feelings towards agents are not
always positive. There’s a long-existing controversy about how the agents would
behave after they have too much intelligence. Some people are afraid that robots,
which are a kind of agents, might kill humans if they are intelligent enough and their
interests conflict with humans’ interests, despite the rule of "A robot may not injure a
human being or, through inaction, allow a human being to come to harm", as stated in
"The Three Laws of Robotics" [3]. Along with the technology development of many
different kinds of agents, questions have risen: will humans behave preferentially
towards other humans or agents? It is known that humans’ personality types have
impact on interactions between humans, but how about the human-agent interaction?
Will a human’s personality type have an impact on his/her decisions regarding other
humans and agents? If we discover some relationship between personality types and
decisions, how could we use these information to help with everyday life? In order to
56
Page 66
Table 5.1 MBTI DichotomiesExtraversion (E) - Introversion (I)
Sensing (S) - iNtuition (N)Thinking (T) - Feeling (F)Judging (J) - Perception (P)
Table 5.2 KTS-II dimentionsAbstract Cooperator (Idealist) Concrete Cooperator (Guardian)Abstract Utilitarian (Rational) Concrete Utilitarian (Artisan)
answer these questions, we must determine a human’s personality type first.
Personality Types
There are different methods to test personality types. A famous psychometric ques-
tionnaire to reveal a person’s personality type is the Myers-Briggs Type Indicator
(MBTI) assessment [48]. Myers used four dichotomies in MBTI theory, as shown in
Table 5.1.
The result of the MBTI questionnaire is a four-letter personality type, with one
letter coming from one of the four dichotomies. For example, a person with type
INFP means he/she is introverted, intuitive, friendly, and more likely to probe the
environment.
We chose the Keirsey Temperament Sorter-II (KTS-II) [39], which is closely asso-
ciated with MBTI. KTS-II classifies people into four temperament groups according
to two basic dimensions of personality: what people say (communication) and what
people do (action). There are two types of communication: concrete people talk
about reality while abstract people talk about ideas, shown by the columns of Table
5.2. Similarly, there are two types of action: cooperative and utilitarian. Cooperative
people do what’s right and utilitarian people do what works, as shown by the rows
in Table 5.2.
The temperaments are Artisan, Guardian, Rational, Idealist, whose names come
57
Page 67
from Plato’s book The Republic. They each have different traits [38]:
- Idealists speak mostly of what they hope for and imagine might be possible
for people, and they want to act in good conscience, always trying to reach
their goals without compromising their personal code of ethics. Examples of
the Idealists are Mohandas Gandhi and Princess Diana.
- Guardians speak mostly of their duties and responsibilities, of what they can
keep an eye on and take good care of, and they’re careful to obey the laws,
follow the rules, and respect the rights of others. Examples of the Guardians
are George Washington and Mother Teresa.
- Rationals speak mostly of what new problems intrigue them and what new
solutions they envision, and always pragmatic, they act as efficiently as possible
to achieve their objectives, ignoring arbitrary rules and conventions if need be.
Examples of the Rationals are Hillary Clinton and Stephen Hawking.
- Artisans speak mostly about what they see right in front of them, about what
they can get their hands on, and they will do whatever works, whatever gives
them a quick, effective payoff, even if they have to bend the rules. Examples of
the Artisans are Michael Jordan and Marilyn Monroe.
Each temperament has four variants, as shown in the first two columns in Table
5.3. The third column in Table 5.3 shows the MBTI types corresponding to the
KTS-II types. KTS-II describes behaviorial patterns while MBTI describes what
people have in mind, which makes KTS-II suitable for our experiments in theory. For
convenience, we sometimes use the letters from the MBTI dichotomies to denote the
KTS-II personality types in this chapter.
58
Page 68
Table 5.3 KTS-II temperament vs MBTI type
KTS-II temperament KTS-II character type MBTI type
Artisan (SP)
Promoter ESTPCrafter ISTP
Performer ESFPComposer ISFP
Guardian (SJ)
Supervisor ESTJInspector ISTJProvider ESFJProtector ISFJ
Rational (NT)
Fieldmarshal ENTJMastermind INTJInventor ENTPArchitect INTP
Idealist (NF)
Teacher ENFJCounselor INFJChampion ENFPHealer INFP
The Cake-Cutting Game
After the human subjects get their personality types through the KTS-II test, they
are asked to play the "Who Gets More Cake?" game, which is related to the classic
cake-cutting game.
In the classic cake-cutting game, players want to divide a cake in such a way that
all of them believe they have received a fair amount of the cake. There are two basic
measurements for a solution of the cake-cutting problem: fairness and envy-freeness.
Fairness means anyone gets at least the amount that he believes is fair, while envy-
freeness means anyone believes no one gets more than he has and he won’t want
to exchange his cake with others. If the cake is divided between two players, there
is a fair and envy-free solution, which is to have one player cut the cake into two
pieces and the other player choose his piece of the cake first. For three players,
Selfridge-Conway discrete procedure [54] can be used to provide a fair and envy-free
solution. However, our focus here is whether humans of different personality types
act differently towards an agent, not dividing the cake perfectly with fairness and
59
Page 69
envy-freeness. We add a "leftover cake giveaway" part to the cake-cutting game in
our "Who Gets More Cake?" game, which will be described in detail in section 5.3.
The rest of the chapter is organized as follows. In section 5.2, we introduce some
related work. In section 5.3 and 5.4, the experiments are described in detail and the
results are analyzed. In section 5.5, we draw the conclusion.
5.2 Related Work
Reeves and Nass [53] claimed that people were inclined to treat media, usually com-
puters in their studies, as if they were real people or real places. Thus we have
the hypothesis that the personality types of humans would influence their behavior
towards other humans and agents, just like in the interactions between humans.
Bartneck, Hoek, Mubin, and Mahmud [6] used "iCat" robots of different intelli-
gent levels to test whether humans treat the robots differently. They showed that the
robots’ intelligence had a significant influence on the humans’ decision in the mea-
surement of their hesitation time to switch off the robot. While they investigated the
influence of different intelligence levels towards humans’ decision, we try to figure out
whether the personality type of a human influences his decisions towards a person or
an agent.
Many researchers who investigated the influence of personality types towards hu-
mans’ decisions. For example, Schmitt, Shupp, Swope, and Mayer [60] used MBTI
test to get personality types and let the human subjects play the ultimatum game.
In the ultimatum game, there are two players: a proposer and a responder. The
proposer first makes an offer on how to divide a given amount of money, then the
responder could accept or reject. The money is divided according to the offer if the
responder accepts, but none of them gets anything if the responder rejects. They
discovered that the "Thinking (T)" types made lower offers than those characterized
as "Feeling (F)" types and "Extraversion (E)" types indicated a willingness to accept
60
Page 70
offers that was less than "Introversion (I)" types. Peever, Johnson and Gardner [52]
used the Five Factor Model to test the personality types and discovered the games a
person preferred was related to his personality type.
Personality traits including those in Five Factor Model [18] and some other traits,
such as public self-consciousness and shyness are considered by Von der Putten,
Kramer, and Gratch [75]. In their study, subjects recruited through a website in-
teracted with a virtual agent. They found that some personality traits, such as
agreeableness, extraversion, approach avoidance, were related to humans’ behavior,
while some traits, gender, and age didn’t affect the results.
We presented the questions of this chapter in the mixed human-agent society and
some experimental results in [19] [20]. This chapter studies the impact of humans’
personality types towards their behavior, while it is different from other studies be-
cause of three reasons:
- Other than MBTI or Five Factor Model, we used KTS-II test in our study, which
broadens the domain of possible explanations of the influences that personality
types could bring to human behavior.
- Many researchers considered the interaction between a person and an agent,
sometimes just between humans, while we considered a human interacts with
both a simulated human and an agent at the same time, showing the different
aptitudes the human has towards the simulated human and the agent.
- We explored a different experimental setting from previous studies, which may
bring new conclusions since conclusions based on previous studies might only
be applied to certain studies. We developed a new game and try to figure out
how humans would behave in this situation.
61
Page 71
play
play
play
Data
data output
Figure 5.1 The model of the human-agent interaction system
5.3 Experiment
As mentioned before, our experiment contains two phases:
- Test the subjects’ personality types using KTS-II.
- The subjects play the "Who Gets More Cake?" game.
Figure 5.1 shows the model of the human-agent interaction system. A subject shown
on the left takes the personality test and plays the game with the other two players
on a computer and the computer will send the result data to a database for further
analysis. The upper right corner shows a simulated human who is faked by an agent.
In our "Who Gets More Cake?" game, we have a cake for three players to divide.
One player is the human subject/participant, one player is a simulated human, and
the third player is an agent/robot (the robot has a way to convert the cake into the
energy it needs to move). The participant was told he was playing with another
person and a robot, but actually a simulated human and an agent for the reason of
experimental control. Each player indicates how he would like to cut the cake into
three pieces by drawing two lines/cuts on his own picture of the cake. Thus, we will
have six lines on the cake in total after the players draw the lines. We then follow
62
Page 72
a protocol proposed by Iyer and Huhns [35], which is proved to be fair for dividing
a resource among n agents, to decide how the cake is divided: whoever has drawn
the left-most cut will get the left side of the cake from the edge to this cut. Of the
remaining two players, whoever has drawn the right-most cut will get the right side
of the cake from this cut to the right edge. The third player will get the portion in
the middle indicated by that player’s two cuts. Note that all players will get one of
the pieces that they indicated, as proved in [35].
After the cake is divided, no player would want to trade with others, because
they would get a piece that is smaller than the one they drew on the cake. However,
there will be one or two portions of the cake left. To make the game more real,
the participants were told one player would then be chosen randomly to give the
remaining portions of the cake to one of the other players in each game. In fact, the
participants were asked to whom they would give the leftover cake in every game.
They could only give the leftover cake to either the simulated human or the agent,
but not themselves. Each participant was asked to play the game three times, each
time with a different cake and with a different simulated human. To play the part of
a human as real as possible, our simulated human has different names in three games
and their names are neutral to eliminate the bias of sex. At the beginning of each
game, participants were asked to type a greeting sentence to the simulated human
and the simulated human will type some greetings too. It takes our simulated human
some time to think and draw cuts on the cake, each game with different amount of
delay to mimic human thinking.
5.4 Results
73 non-computer science students with age around 20 who have little technological
background participated in the experiment. They took the KTS-II personality test
and played the game after being told the rules of the game. 58 of them played all
63
Page 73
three rounds of the game. In total, they played 197 games. We measure four criteria:
- The number of games in which the participants give the leftover cake to the
simulated human, denoted by Nhuman;
- The number of games in which the participants give the leftover cake to the
agent, denoted by Nagent;
- The number of participants who give the leftover cake to the same player (either
the simulated human or the agent) in the three games they played, denoted by
Nsame;
- The number of participants who give the leftover cake to different players in
the three games they played, denoted by Ndiff .
The first two criteria measure the tendency that a participant would like to choose
either a person or an agent under some circumstances, which might indicates whether
he would like to interact with a person or an agent, and the last two criteria mea-
sure the consistency of his choice. For the last two criteria, we only consider the
participants who finished all three games.
To deal with the personality type results, we first need to understand how to
interpret KTS-II test. KTS-II provides a questionnaire based on seventy questions,
each with two options indicating the two aspects of a certain dichotomy. There are
ten questions for E (Extraversion)-I (Introversion) dichotomy and twenty questions
each for the other three dichotomies. A personality type depends on how many
options you selected for the two aspects of each dichotomy. If a person chooses the
same number of options for the two aspects of any dichotomy, an "X" will appear
for that dichotomy. For example, if a person choose 5 options for E (Extraversion)
and 5 options for I (Introversion), his personality type will have an "X" in the E
(Extraversion)-I (Introversion) dichotomy, such as XSTJ. If this happens, the person
64
Page 74
should read both ESTJ and ISTJ’s descriptions and choose the one more like himself.
In our experiments, a few participants have one or more "X"es in their personality
types. We handle this by counting them as 1/2 person for one "X" situation for each
possible type, 1/4 person for two "X"es situation for each possible type, and so on.
For example, the above person with personality type XSTJ is counted as 1/2 person
with type ESTJ and 1/2 person with type ISTJ.
In order to investigate how the personality types influence the choices the partic-
ipants make, we introduce several statistic criteria to do evaluation:
- Pearson’s chi-squared test (χ2 test) or Fisher’s exact test, which evaluates the
degree of independence between two nominal variables.
- Cramer′s V (V ), which is an effect size measure of association between two
nominal variables.
- Goodman and Kruskal’s lambda, which help us to understand whether knowing
a person’s personality would help to predict his choice in the game (λ1) and
vice versa (λ2).
Tendency Results
We calculated first two criteria for all the participants as a whole and have
Nhuman = 133, Nagent = 64. (5.1)
The data shows the participants give the leftover cake to the simulated human in
most games, which is twice as many as those in which it is given to the agent. We
grouped the data by sixteen MBTI types. The data is shown in Table 5.4, which
reveals that almost people of all the types give more leftover cakes to the humans
than to the agents, which reveals their different aptitude towards the humans and
the agents. Champion (ENFP), one of the Idealists, gives the leftover cakes to the
65
Page 75
Table 5.4 Tendency Results of MBTI Types
MBTI type Nhuman Nagent |∆| drESTJ 8.25 6.75 1.5 5%ISTJ 17.25 9 8.25 16%ESFJ 12.875 3.5 9.375 29%ISFJ 16.875 7.25 9.625 20%ESTP 7 4.5 2.5 11%ISTP 2 2.75 0.75 8%ESFP 8.625 3.5 5.125 21%ISFP 6.125 2.75 3.375 19%ENFJ 3.375 2.5 0.875 7%INFJ 5.875 2 3.875 25%ENFP 12.625 2 10.625 36%INFP 8.125 5 3.125 12%ENTJ 7 2.25 4.75 26%INTJ 8 2.25 5.75 28%ENTP 2.25 2 0.25 3%INTP 6.75 6 0.75 3%
simulated human 6 times than they give to the agent. On the other hand, Crafter
(ISTP), one of the Artists, give more cake to the agent. |∆| in the table is the absolute
difference of Nhuman and Nagent,
|∆| = |Nhuman −Nagent|. (5.2)
dr is the percentage difference, which is the relative difference in percentage calculated
by the following formula:
dr = |∆|(Nhuman +Nagent)/2
(5.3)
The data is heterogeneous and it’s hard to discover the pattern among all the sixteen
personality types. That’s one clue of suggesting us to group them in some way and
analyze the results.
KTS-II Temperaments Tendency Results
Thus, we calculated the same criteria for the four KTS-II temperaments, as shown
in Table 5.5 and criteria for each two aspects of the four dichotomies, as shown in
66
Page 76
Table 5.5 Observed Frequencies of Four Temperaments
Ofreq Guardian Artisan Idealist Rational Rtotal
Nhuman 55.25 23.75 30 24 133Nagent 26.5 13.5 11.5 12.5 64Ctotal 81.75 37.25 41.5 36.5 197
Table 5.8.
Now we want to see whether the KTS-II temperaments have significant influence
on the choices the participants made. Our data fits the conditions of Pearson’s χ2
test. Following the test procedure, we stated the null hypothesis as follows:
H0: The participants’ KTS-II temperaments and the choices they made are inde-
pendent.
Then we represent the data in a contingency table as in Table 5.5, where Rtotal
describes row total and Ctotal describes column total. The participants choices, as we
observed, are called observed frequencies (Ofreq) in statistics.
Our hypothesis is that there is no relationship between the participants’ temper-
aments and their choices, which means they give the leftover cake to the simulated
human or the agent randomly (i.e., with equal probability). Based on this hypothesis,
we obtain the expected frequencies (Efreq) according to the following formula, which
are the frequencies if we don’t consider the factor of personality. For example, let’s
consider the expected frequency of Nhuman for Guardian. If we don’t know a person’s
personality, then he should give the leftover cake to the simulated human by the
probability of 133/197. With a total number of 81.75 people, the number of people
who give the leftover cake to the simulated human should be 81.75∗133/197 = 55.19.
The expected frequencies are shown in Table 5.6.
Efreq = Ctotal ∗Rtotal/T (5.4)
For a specific cell in the expected frequency table, Ctotal in the above formula is the
column total for the column of that cell, while Rtotal is the row total for the column
67
Page 77
Table 5.6 Expected Frequencies of Four Temperaments
Efreq Guardian Artisan Idealist RationalNhuman 55.19 25.15 28.02 24.64Nagent 26.56 12.10 13.48 11.86
of that cell. T in the formula is the number of games played in total, which is 197 in
our case.
We use the following formula to calculate χ2:
χ2 =∑
0<i<m, 0<j<n
(Ofreq(i, j)− Efreq(i, j))2
Efreq(i, j), (5.5)
where Ofreq(i, j) and Efreq(i, j) denote the observed frequencies and expected fre-
quencies in the table cell of ith row and jth column. m and n represents the total
row number and total column number. The statistical results are
χ2 = 0.72, P = 0.87, V = 0.06. (5.6)
P is one-tailed (right-tail) probability value for a chi-square test (i.e., the area under
the chi-square distribution from the chi-square value to positive infinity), given the
chi-square value and the degree of freedom, which can be calculated through a lookup
table or an online tool. The degree of freedom df is the number of values in the table
that are free to vary given existing constrains. In our table, Rtotal and Ctotal are the
constrains fixed for each row and column. In the table, we only need to vary the
contents of 3 cells and the contents of the rest cells could be decided then. Thus, the
degree of freedom is 3 in our case. V is calculated using the following formula:√√√√ χ2
T ∗ (k − 1) , (5.7)
where T = 197 and k = 2, which is the smaller number of the number of rows and
the number of columns in the table.
The meaning of the result is that we are 1 − P (in the form of percentage) sure
to reject the null hypothesis. Normally significant level of 0.05 or 0.1 is used, which
68
Page 78
Table 5.7 Percentage Deviation of Four Temperaments
Percentage Deviation Guardian Artisan Idealist RationalNhuman 0.1% -5.6% 7.1% -2.6%Nagent -0.2% 11.6% -14.7% 5.4%
means if P < 0.05 or P < 0.1 we can reject the hypothesis. In our case, P >
0.05 and there is 13% probability that we could reject the hypothesis, which is very
low. Thus we can’t reject the null hypothesis, which means we can’t say there is
a relationship between the participants’ temperaments and their choices. V is an
effect size measure which shows the inter-correlation of the variables. In this case, it
measures the relationship between the participants’ KTS-II temperaments with their
choices. According to the convention, V < 0.1 means negligible relationship. In our
case, V = 0.06 means the association between the KTS-II temperaments and the
choices is negligible.
Percentage deviation, which measures the degree to which observed frequencies
differs from the expected frequencies, is calculated as follows:
PD(i, j) = Ofreq(i, j)− Efreq(i, j)Efreq(i, j)
. (5.8)
Table 5.7 shows the percentage deviation of the KTS-II temperaments’ tendency
results, from which we could see that people with different temperaments behave very
differently. Artisans and Idealists are deviated more from the general public than the
other two temperaments. The Guardians act just like an average person. By an
average person, we refer to an imaginary person who will act as our reference data
shows. For example, if this person plays our game for 197 times, he would probably
end up with giving the leftover cake 133 times to the simulated human and 64 times
to the agent.
At last we use Goodman and Kruskal’s lambda to measure the proportional reduc-
tion in error. For example, in our case, the estimated probability of correct prediction
69
Page 79
Table 5.8 Tendency Results and Percentage Deviation of Four Dichotomies
MBTI dichotomy Nhuman Nagent PDhuman PDagent
E (Extraversion) 62 27 3.2% -6.6%I (Introversion) 71 37 -2.6% 5.5%S (Sensing) 79 40 -1.7% 3.5%N (iNtuition) 54 24 2.5% -5.3%T (Thinking) 58.5 35.5 -7.8% 16.2%F (Feeling) 74.5 28.5 7.1% -14.8%J (Judging) 79.5 35.5 2.4% -5.0%
P (Perception) 53.5 28.5 -3.4% 7.0%
when predicting a person’s choice without knowing his temperament is
p1 = 133197 = 0.68, (5.9)
while estimated probability of correct prediction when predicting what choice a person
will make knowing his temperament is
p2 = 55.25 + 23.75 + 30 + 24197 = 0.68. (5.10)
Goodman and Kruskal’s lambda of predicting choice on the basis of temperament is
λ1 = (1− p1)− (1− p2)1− p1
= 0, (5.11)
which means there is no difference whether or not knowing a person’s temperament
when predicting his choice. Also we found out lambda of predicting a person’s tem-
perament from his choice (λ2), which is calculated according to a similar way as that
of λ1, is 0, meaning knowing a person’s choice won’t do any good to predicting the
his temperament.
To give a hint of how the participants’ choices of each dichotomy varies, table
5.8 shows the tendency results of four dichotomies, where PDhuman is the percentage
deviation of Nhuman and PDagent is the percentage deviation of Nagent. We could see
that the biggest difference from what is supposed to be with our equal probability
assumption happens in the T-F dichotomy.
70
Page 80
Then we investigated howMBTI dichotomies influence the choices the participants
made. Following the same procedure, first we stated the null hypothesis for each
dichotomy as follows:
- For E-I dichotomy: The participants’ types in E-I dichotomy and their choices
are independent;
- For S-N dichotomy: The participants’ types in S-N dichotomy and their choices
are independent;
- For T-F dichotomy: The participants’ types in T-F dichotomy and their choices
are independent;
- For J-P dichotomy: The participants’ types in J-P dichotomy and their choices
are independent.
Table 5.9 shows the statistic results for each dichotomy. From the table we could
see that in T-F dichotomy, there is 87% possibility, which is close to the standard
of rejecting the null hypothesis with a significance level of 0.1, to reject the null
hypothesis. Still, we can’t reject the null hypothesis, but we probably could see it get
rejected with more experiments and draw a conclusion that the personality in T-F
dimension has something to do with the participants’ choices based on statistics. For
other dimensions, there is no evidence to lead to the conclusion that we should reject
the null hypothesis and say there is a relationship between a certain dichotomy and
the choices.
Also, we could see from Cramer′s V there’s a weak relationship between T-F
dichotomy and the choices, and negligible relationship between any other dichotomy
and the choices in the whole population based on our samples. λ2 for T-F dichotomy
is 0.07, which means that we could reduce 7% error when predicting a person’s tem-
perament with his choice known compared to that with his choice not known.
71
Page 81
Table 5.9 Statistical Results of Four Dichotomies for Tendency
MBTI Dichotomy χ2 P V λ1 λ2E-I 0.34 0.56 0.04 0 0S-N 0.17 0.68 0.03 0 0T-F 2.28 0.13 0.11 0 0.07J-P 0.33 0.57 0.04 0 0
Consistency Results
Next, we measure the consistency of the participants’ choices. First we calculated
the consistency criteria:
Nsame = 18, Ndiff = 40. (5.12)
We could see that more than two thirds of participants give the leftover cake to
different players in three games, which means they don’t always prefer the simulated
human or the agent. Similar to the tendency results, we grouped the Ndiff and Nsame
data according to temperaments and dichotomies, shown in the first three columns
in Table 5.10 and Table 5.11. We could consider the consistency as "fairness" in the
sense that the participants try to behave "fairly" by giving the leftover cake to the
simulated human and the agent in three repetitions of the game, rather than to only
one of them.
It is not suggested to use Pearson’s χ2 test if there are small expected frequency
values, so we use Fisher’s exact test here to perform analysis similar to Pearson’s χ2
test for data in Table 5.10 and it turns out P is very close to 1. We also perform
Pearson’s χ2 test to get an approximate V value. Our null hypothesis is as follows:
H0: The participants’ KTS-II temperaments and the consistency results of their
choices are independent.
The statistical results are as follows:
χ2 = 0.22, V = 0.06, λ1 = 0, λ2 = 0. (5.13)
It shows that there is no significant dependence between the participants’ KTS-II
72
Page 82
Table 5.10 Consistency Results and Percentage Deviation of Four Temperaments
KTS-II Temperament Nsame Ndiff PDsame PDdiff
Guardian 7.75 16.5 3.0% -1.3%Artisan 3.25 7.5 -2.6% 1.2%Idealist 3 8.5 -15.9% 7.2%Rational 4 7.5 12.1% -5.4%
temperaments and the consistency of their choices. A person’s temperament has little
association with the consistency of his choices. Knowing a person’s temperament or
the consistency of his choices won’t do any help to the prediction of the consistency
of his choices or his temperament.
Then we investigated how MBTI dichotomies influence the consistency of the
choices that the participants made. Following the same procedure, first we stated the
null hypothesis for each dichotomy as follows:
- For E-I dichotomy: The participants’ types in E-I dichotomy and the consis-
tency of their choices are independent;
- For S-N dichotomy: The participants’ types in S-N dichotomy and the consis-
tency of their choices are independent;
- For T-F dichotomy: The participants’ types in T-F dichotomy and the consis-
tency of their choices are independent;
- For J-P dichotomy: The participants’ types in J-P dichotomy and the consis-
tency of their choices are independent.
Table 5.11, where PDsame and PDdiff denote the percentage deviation of Nsame
and Ndiff , gives us a hint of how the observed data deviates from what should be
with equal possibility assumption. E-I and J-P dichotomies deviates more than the
other two dichotomies. The statistical results are shown in Table 5.12, based on
which we couldn’t reject any of the null hypothesis and say any dichotomy and the
73
Page 83
Table 5.11 Consistency Results and Percentage Deviation of Four Dichotomies
MBTI dichotomy Nsame Ndiff PDsame PDdiff
E (Extraversion) 9 15.5 18.4% -8.3%I (Introversion) 9 24.5 -13.4% 6.0%S (Sensing) 11 24 1.3% -0.6%N (iNtuition) 7 16 -1.9% 0.9%T (Thinking) 8.5 20 -3.9% 1.8%F (Feeling) 9.5 20 3.8% -1.7%J (Judging) 11.5 22 10.6% -4.8%
P (Perception) 6.5 18 -14.5% 6.5%
Table 5.12 Statistical Results of Four Dichotomies for Consistency
MBTI Dichotomy χ2 P V λ1 λ2E-I 0.64 0.42 0.11 0 0S-N 0.01 0.92 0.01 0 0T-F 0.04 0.84 0.03 0 0J-P 0.4 0.53 0.08 0 0
consistency results are not independent. Besides, knowing a person’s dichotomies or
the consistency of his choices won’t do any help to the prediction of the consistency
of his choices or dichotomies. However, Cramer′sV shows there is a weak association
between E-I dichotomy and the consistency of the choices. In conclusion, being fair
is more important than personality.
5.5 Conclusion
In this chapter, we try to investigate whether humans’ behavior towards other humans
and agents is related to their personality types. We have seventy-three students
participated in the experiments, by taking the KTS-II test and then playing the
"Who Gets More Cake?" game.
We discovered that humans of different personality types behave differently to-
wards other humans and agents. For example, Artisans and Idealists act more devi-
ated from an average person; it’s very likely that T-F dichotomy is not independent
with the tendency results. This provides a clue in many agent-related applications.
74
Page 84
For example, an Idealist has to partner with an agent/robot as his personal assis-
tant due to business reasons. As an Idealist, he is inclined to interact with humans
more and agents less, thus he might choose an robot with less talking or interactions
needed. In the next stage, we may discover agents of which personality type could
cooperate well with a certain kind of person, which could be used in many domains,
such as elder’s personal care, team formation and so on.
Currently our experiments shows little clue of making predictions based on a
person’s personality. In the future, we expect that more students participate in an
updated version of this experiment to draw more reliable conclusion based on our
statistical criteria and explore other possibilities. Also, the personality types of the
simulated human and the agent are not considered yet. We expect to find a way to
integrate this factor into the future experiments.
75
Page 85
Chapter 6
Conclusion
Agents are involved in humans’ everyday life and thus humans with the help of agent
technologies form different sociotechnical systems under various situations. The rea-
son why humans need technical help is the increasing complexity of ongoing problems
in the society. For the complex problems that are beyond the ability of individuals,
it is promising to take advantage of advanced technologies to cope with them. For
technical help, we consider two aspects, which are how to represent and use the in-
teractions of agents acting on behalf of humans, and how a person interacts with
the system or the agent. In this dissertation, we investigated these two aspects by
studying three cases using the case study approach.
The first case is a multiagent shopping system that could give a customer sugges-
tions on where to shop and what to shop. We proposed an approach, tested it with
simulated price data and real price data collected from nearby stores, and compared
it with three other common approaches. It is shown that at least 22% savings could
be made generally with simulated data. With the real data, a customer could save
6% more using our approach. We also proved robustness of our approach under the
situation of deceptive stores with simulated data and wrongly reported price with
real data.
The second case is a multiagent healthcare system in which agents representing pa-
tients could exchange information about physicians and recommend the most proper
physician to a patient. We considered three kinds of networks: random network,
scale-free network, and small-world network to represent the social relationship of
76
Page 86
people. We assume that if two people know each other, their agents know each other
too. The agent of a patient asks the agents of the patient’s friends for information
about physicians they know. Depending on different choosing-a-physician strategies
and waiting policies, the patient may get different recommendations of a physician.
As for the number of annual sick days per person in different situations, it is shown
that 0.4-1.8 days could be reduced using the sociotechnical system compare to that
of choosing a physician randomly.
In the third case, we are trying to investigate a factor, personality to be particular,
that influences human-agent interaction. To achieve this purpose, we test human
subjects’ personality and have them play the "Who Gets More Cake?" game. The
game is designed in such a way that at the end of the game each subject is asked a
question that indicates his inclination towards humans or agents. The result shows
that humans treat other humans and agents differently and humans with different
personalities behave differently. However, fair is more important than personality
types, which means the subjects would try to treat humans and agents differently,
but in the same extent of difference regardless of their personalities.
Agents are involved in the sociotechnical systems in all three cases. In the gro-
cery shopping case, agents work together indirectly through the central manager of
the online system. If we could scan the items and the information related to the
items could be taken and uploaded by an agent possibly installed on our cellphone
automatically to the online system, people could save a lot of money by sharing the
information they know. In the healthcare case, agents communicate and collect more
information than that could be collected by only one person and utilize integrated
information to give suggestions. In the human-agent interaction case, humans’ reac-
tion to other humans and agents are observed and the effect of personality as a factor
is investigated. Through the three cases, it is shown that agents, which could be
considered as a piece of autonomous intelligent software, could provide suggestions
77
Page 87
to humans by integrating information that a human could not or does not willing to
handle. Along with the rapid development of technologies and thus huge amount of
information, the need of agents in different areas of human life is growing bigger and
bigger. Thus, we foresee that agent technologies will be widely used in the future
than it is today.
However, there are limitations in our case studies. For the shopping system, we
need some way to get the item information automatically to the online system, which
might be difficult because stores may not want to provide the convenience of getting
item information they have already stored in their system by simply letting customers
scan the barcode.
For the healthcare system, real life is much more complex than our simulation.
First, we simplify the question by making the patients and physicians homogeneous,
that is, each person behaves similarly to the other persons of the same kind. For
example, the ratings of a physician from different patients won’t vary too much; each
physician could take care of the same number of patients at most every day; the num-
ber of patients distributed evenly throughout the year, etc. We assume that patients
all adopt the same choosing-a-physician strategy and waiting policy in a particular
simulation, which is not true in the real world since everyone might have different
preferences over these choices and each person may have different preferences depend-
ing on the severity of his disease. Second, we didn’t consider unforeseen situations or
the variables. For example, a patient may change his/her idea in the middle of the
treatment, such as switching to another physician if he/she is not satisfied with the
current physician.
In the human-agent interaction case, there might be multiple factors that influence
humans’ decisions in the game. We didn’t consider the interactions of different factors
and actually it’s even impossible to list all the factors. Also, the subjects in our
experiment are students around 20s. If we want to generalize the conclusion, we need
78
Page 88
to collect data from more subjects of various ages, educational background and so on.
In this way, we could get more useful and accurate conclusion. Moreover, if we have
large amount of subjects of different background play different games, we might find
some pattern that could guide us and learn more about the effects of personality or
other factors on humans’ attitude towards other humans and agents.
Based on our experience, here are some recommendations for designing sociotech-
nical systems:
- Model the problem as realistically as possible. When designing a sociotechnical
system for research purposes, simplifications are usually made because it is
difficult to make it just like in a complex real life situation. However, it is
necessary to model the problem in question complex enough to make sure it
doesn’t lack of any critical factors that might influence the conclusion.
- Carefully design the rules of the interaction among agents, and the interaction
between a human and an agent. Different systems may require different rules
of interaction, so it is important to define the norms and have all the agents
follow the norms.
- Consider possible variables in the system and perform a robustness analysis.
In most systems, there are variables that may change at some point or wrong
data input depending on the designed system. These uncertainties should be
considered and taken care of.
To summarize, agent technologies can have important effect on aiding or facili-
tating humans’ everyday life in various kinds of sociotechnical systems. To better
accomplish this purpose, we need to understand how the agents could help in so-
ciotechnical systems, which motivates this dissertation. There are additioanl studies
that could be done to improve the work in this dissertation. For the shopping sugges-
tion system, a mobile app could be developed and used to upload the information to
79
Page 89
the central manager; real shopping lists of different types of families could be used to
further test the system. For the healthcare system, a more complex model is needed
to overcome the shortcomings mentioned in the limitations part. For the human-
agent interaction case, more subjects of different background could be very helpful to
draw a more accurate conclusion. Exploring different possibilities of improving these
case studies could help us to understand aspects of implementing sociotechnical sys-
tems more in depth, thus providing useful tools for assisting humans with complex
problems that are hard to cope with.
80
Page 90
Bibliography[1] Sunil Adhau, M. L. Mittal, and Abhinav Mittal, A multi-agent system for dis-
tributed multi-project scheduling: An auction-based negotiation approach, Eng.Appl. Artif. Intell. 25 (2012), no. 8, 1738–1751.
[2] Eitan Altman, Konstantin Avrachenkov, and Andrey Garnaev, Fair resource al-location in wireless networks in the presence of a jammer, Proceedings of the 3rdInternational Conference on Performance Evaluation Methodologies and Tools(ICST, Brussels, Belgium, Belgium), ValueTools ’08, ICST (Institute for Com-puter Sciences, Social-Informatics and Telecommunications Engineering), 2008,pp. 33:1–33:7.
[3] Isaac Asimov, I, Robot, Signet, New York, NY, USA, June 1956.
[4] Yoram Bachrach and Jeffrey S. Rosenschein, Distributed multiagent resource al-location in diminishing marginal return domains, Proceedings of the 7th Interna-tional Joint Conference on Autonomous Agents and Multiagent Systems - Vol-ume 2 (Richland, SC), AAMAS ’08, International Foundation for AutonomousAgents and Multiagent Systems, 2008, pp. 1103–1110.
[5] Albert-László Barabási and Réka Albert, Emergence of scaling in random net-works, Science 286 (1999), no. 5439, 509–512.
[6] Christoph Bartneck, Michel van der Hoek, Omar Mubin, and Abdullah Al Mah-mud, "daisy, daisy, give me your answer do!": switching off a robot, Proceedingsof the ACM/IEEE international conference on Human-robot interaction (NewYork, NY, USA), HRI ’07, ACM, 2007, pp. 217–222.
[7] Gordon Baxter and Ian Sommerville, Socio-technical systems: From design meth-ods to systems engineering, Interact. Comput. 23 (2011), no. 1, 4–17.
[8] Cristina Bicchieri, Norms of Cooperation, Ethics 100 (1990), no. 4, 838–861.
[9] Guido Boella, Gabriella Pigozzi, and Leendert van der Torre, Five guidelinesfor normative multiagent systems, Proceedings of JURIX 2009 - The 22nd In-ternational Conference on Legal Knowledge and Information Systems (Rotter-
81
Page 91
dam, The Netherlands), Frontiers in Artificial Intelligence and Applications, IOSPress, December 2009.
[10] JeffreyM. Bradshaw, Maarten Sierhuis, Alessandro Acquisti, Paul Feltovich,Robert Hoffman, Renia Jeffers, Debbie Prescott, Niranjan Suri, Andrzej Uszok,and Ron Van Hoof, Adjustable autonomy and human-agent teamwork in prac-tice: An interim report on space applications, Agent Autonomy (Henry Hexmoor,Cristiano Castelfranchi, and Rino Falcone, eds.), Multiagent Systems, ArtificialSocieties, and Simulated Organizations, vol. 7, Springer US, 2003, pp. 243–280(English).
[11] J.M. Bradshaw, P.J. Feltovich, M.J. Johnson, L. Bunch, M.R. Breedy, T. Es-kridge, Hyuckchul Jung, J. Lott, and A. Uszok, Coordination in human-agent-robot teamwork, Collaborative Technologies and Systems, 2008. CTS 2008. In-ternational Symposium on, May 2008, pp. 467–476.
[12] Erik Brynjolfsson, AstridA. Dick, and MichaelD. Smith, A nearly perfect mar-ket?, QME 8 (2010), no. 1, 1–33 (English).
[13] Martin Buchholz, Dirk Pflüger, and Josiah Poon, Application of machine learn-ing techniques to the re-ranking of search results, KI 2004: Advances in ArtificialIntelligence (Susanne Biundo, Thom Frühwirth, and Günther Palm, eds.), Lec-ture Notes in Computer Science, vol. 3238, Springer Berlin Heidelberg, 2004,pp. 67–81.
[14] M. Charfeddine and B. Montreuil, Integrated agent-oriented modeling and simu-lation of population and healthcare delivery network: Application to copd chronicdisease in a canadian region, Simulation Conference (WSC), Proceedings of the2010 Winter, Dec 2010, pp. 2327–2339.
[15] Y. Chevaleyre, P. E. Dunne, U. Endriss, J. Lang, M. Lemaitre, N. Maudet,Julian Padget, Steve Phelps, Juan A. Rodríguez-Aguilar, and P. Sousa, Issuesin multiagent resource allocation, Informatica 30 (2006), no. 1, 3 – 31.
[16] William J. Clancey, Patricia Sachs, Maarten Sierhuis, and Ron Van Hoof,Brahms: simulating practice for work systems design, International Journal ofHuman-Computer Studies 49 (1998), no. 6, 831 – 865.
[17] D. Clark, Shopbots become agents for business change, Computer 33 (2000),no. 2, 18–21.
82
Page 92
[18] J. M. Digman, Personality Structure: Emergence of the Five-Factor Model, An-nual Review of Psychology 41 (1990), no. 1, 417–440.
[19] Hongying Du, The effects of human personality on human-agent interactions(doctoral consortium), Proceedings of the 12th International Conference onAutonomous Agents and Multiagent Systems (AAMAS 2013) (Takayuki Ito,Catholijn Jonker, Maria Gini, and Onn Shehory, eds.).
[20] Hongying Du and M.N. Huhns, Determining the effect of personality types onhuman-agent interactions, Web Intelligence (WI) and Intelligent Agent Technolo-gies (IAT), 2013 IEEE/WIC/ACM International Joint Conferences on, vol. 2,Nov 2013, pp. 239–244.
[21] Daji Ergu, Gang Kou, Yi Peng, Yong Shi, and Yu Shi, The analytic hierarchyprocess: task scheduling and resource allocation in cloud computing environment,The Journal of Supercomputing 64 (2013), no. 3, 835–848 (English).
[22] A. Eryilmaz and R. Srikant, Fair resource allocation in wireless networks usingqueue-length-based scheduling and congestion control, Networking, IEEE/ACMTransactions on 15 (2007), no. 6, 1333–1344.
[23] Michal Feldman, Kevin Lai, and Li Zhang, A price-anticipating resource alloca-tion mechanism for distributed shared clusters, CoRR abs/cs/0502019 (2005).
[24] Centers for Disease Control and Prevention, Ambulatory care use and physi-cian visits, http://www.cdc.gov/nchs/fastats/docvisit.htm, Accessed Feb6, 2014.
[25] Stan Franklin and Art Graesser, Is it an agent, or just a program?: A taxonomyfor autonomous agents, Intelligent Agents III Agent Theories, Architectures, andLanguages (Jörg P. Müller, Michael J. Wooldridge, and Nicholas R. Jennings,eds.), Lecture Notes in Computer Science, vol. 1193, Springer Berlin Heidelberg,1997, pp. 21–35.
[26] AmyR. Greenwald and JeffreyO. Kephart, Shopbots and pricebots, Agent Me-diated Electronic Commerce II (Alexandros Moukas, Fredrik Ygge, and CarlesSierra, eds.), Lecture Notes in Computer Science, vol. 1788, Springer Berlin Hei-delberg, 2000, pp. 1–23.
[27] Henry Hexmoor, Satish Gunnu Venkata, and Donald Hayes, Modelling socialnorms in multiagent systems, Journal of Experimental & Theoretical ArtificialIntelligence 18 (2006), no. 01, 49–71.
83
Page 93
[28] Christopher D. Hollander and Annie S. Wu, The current state of normativeagent-based systems, Journal of Artificial Societies and Social Simulation 14(2011), no. 2, 6.
[29] J. Howe, Crowdsourcing: A definition, http://crowdsourcing.typepad.com/cs/2006/06/crowdsourcing_a.html, Accessed Feb 12, 2014.
[30] Michael N. Huhns, From dps to mas to ...: Continuing the trends, Proceedingsof The 8th International Conference on Autonomous Agents and MultiagentSystems - Volume 1 (Richland, SC), AAMAS ’09, International Foundation forAutonomous Agents and Multiagent Systems, 2009, pp. 43–48.
[31] Michael N. Huhns and Larry M. Stephens, Multiagent systems, MIT Press, Cam-bridge, MA, USA, 1999, pp. 79–120.
[32] RateMDs Inc., http://www.ratemds.com/.
[33] David Isern, Antonio Moreno, Gianfranco Pedone, and Laszlo Varga, An intelli-gent platform to provide home care services, Knowledge Management for HealthCare Procedures (David RiaÃśo, ed.), Lecture Notes in Computer Science, vol.4924, Springer Berlin Heidelberg, 2008, pp. 149–160.
[34] David Isern, David Sánchez, and Antonio Moreno, Agents applied in health care:A review, International Journal of Medical Informatics 79 (2010), no. 3, 145 –166.
[35] Karthik Iyer and Michael N. Huhns, Multiagent negotiation for fair and unbi-ased resource allocation, OTM Conferences (1) (Robert Meersman, Zahir Tari,Mohand-Said Hacid, John Mylopoulos, Barbara Pernici, Özalp Babaoglu, Hans-Arno Jacobsen, Joseph P. Loyall, Michael Kifer, and Stefano Spaccapietra, eds.),Lecture Notes in Computer Science, vol. 3760, Springer, 2005, pp. 453–465.
[36] Nicholas R. Jennings, Katia Sycara, and Michael Wooldridge, A roadmap ofagent research and development, Autonomous Agents and Multi-Agent Systems1 (1998), no. 1, 7–38 (English).
[37] Arkadiusz Kawa, Simulation of dynamic supply chain configuration based onsoftware agents and graph theory, Distributed Computing, Artificial Intelligence,Bioinformatics, Soft Computing, and Ambient Assisted Living (Sigeru Omatu,MiguelP. Rocha, José Bravo, Florentino Fernández, Emilio Corchado, AndrésBustillo, and JuanM. Corchado, eds.), Lecture Notes in Computer Science, vol.5518, Springer Berlin Heidelberg, 2009, pp. 346–349.
84
Page 94
[38] D. Keirsey, Keirsey’s webpage on overview of the four temperaments, 1996.
[39] , Please understand me ii, Prometheus Nemesis, 1998.
[40] V.G. Koutkias, I. Chouvarda, and N. Maglaveras, A multiagent system enhancinghome-care health services for chronic disease management, Information Technol-ogy in Biomedicine, IEEE Transactions on 9 (2005), no. 4, 528–537.
[41] B. Krulwich, The bargainfinder agent: Comparison price shopping on the inter-net, 1996.
[42] Ho-Kyoung Lee, Young-Hoon Yu, Supratip Ghose, and Geun-Sik Jo, Comparisonshopping systems based on semantic web - a case study of purchasing cameras,Grid and Cooperative Computing (Minglu Li, Xian-He Sun, Qian-ni Deng, andJun Ni, eds.), Lecture Notes in Computer Science, vol. 3032, Springer BerlinHeidelberg, 2004, pp. 139–146.
[43] Kangbok Lee, Byung-Cheon Choi, Joseph Y. T. Leung, and Michael L. Pinedo,Approximation algorithms for multi-agent scheduling to minimize total weightedcompletion time, Inf. Process. Lett. 109 (2009), no. 16, 913–917.
[44] T. Lewis, Humans show empathy for robots, April 2013.
[45] Ahmad Kamran Malik and Schahram Dustdar, An intelligent information shar-ing control system for dynamic collaborations, Proceedings of the 8th Interna-tional Conference on Frontiers of Information Technology (New York, NY, USA),FIT ’10, ACM, 2010, pp. 30:1–30:6.
[46] , Enhanced sharing and privacy in collaborative virtual teams., Journal ofInformation Assurance and Security 7 (2012), no. 2, 61 – 70.
[47] Winter Mason and Duncan J. Watts, Financial incentives and the "performanceof crowds", Proceedings of the ACM SIGKDD Workshop on Human Computa-tion (New York, NY, USA), HCOMP ’09, ACM, 2009, pp. 77–85.
[48] I.B. Myers and P.B. Myers, Gifts differing: Understanding personality type,Davies-Black Pub., 1980.
[49] John Nealon and Antonio Moreno, Agent-based applications in health care, in Ap-plications of Software Agent Technology in the Health Care Domain , WhitesteinSeries in Software Agent Technologies, BirkhÃďuser Verlag, Verlag, 2003, pp. 3–18.
85
Page 95
[50] Bureau of Labor Statistics, Consumer price index, http://www.bls.gov/cpi, U.S.Bureau of Labor Statistics Division of Information Services, Accessed 29 Jan2014.
[51] , Glossary, http://www.bls.gov/bls/glossary.htm, U.S. Bureau of LaborStatistics Division of Information Services, Accessed 29 Jan 2014.
[52] Nicole Peever, Daniel Johnson, and John Gardner, Personality & video gamegenre preferences, Proceedings of The 8th Australasian Conference on InteractiveEntertainment: Playing the System (New York, NY, USA), IE ’12, ACM, 2012,pp. 20:1–20:3.
[53] Byron Reeves and Clifford Nass, The media equation: how people treat comput-ers, television, and new media like real people and places, Cambridge UniversityPress, New York, NY, USA, 1996.
[54] J. Robertson and W. Webb, Cake cutting algorithms: Be fair if you can, AkPeters Series, Peters, 1998.
[55] Stuart Russell and Peter Norvig, Artificial intelligence: A modern approach, 3rded., Prentice Hall Press, Upper Saddle River, NJ, USA, 2009.
[56] Eugene Santos, Feng Zhang, and PeterB. Luh, Intra-organizational logistics man-agement through multi-agent systems, Electronic Commerce Research 3 (2003),no. 3-4, 337–364 (English).
[57] Benjamin Satzger, Harald Psaier, Daniel Schall, and Schahram Dustdar,Auction-based crowdsourcing supporting skill management, Inf. Syst. 38 (2013),no. 4, 547–560.
[58] Ognjen Scekic, Christoph Dorn, and Schahram Dustdar, Simulation-based mod-eling and evaluation of incentive schemes in crowdsourcing environments, On theMove to Meaningful Internet Systems: OTM 2013 Conferences (Robert Meers-man, Hervé Panetto, Tharam Dillon, Johann Eder, Zohra Bellahsene, NorbertRitter, Pieter Leenheer, and Deijing Dou, eds.), Lecture Notes in ComputerScience, vol. 8185, Springer Berlin Heidelberg, 2013, pp. 167–184.
[59] D.A. Schmidt, Changxin Shi, R.A. Berry, M.L. Honig, and W. Utschick, Dis-tributed resource allocation schemes, Signal Processing Magazine, IEEE 26(2009), no. 5, 53–63.
86
Page 96
[60] Pamela Schmitt, Robert Shupp, Kurtis Swope, and Justin Mayer, Pre-commitment and personality: behavioral explanations in ultimatum games, Jour-nal of Economic Behavior & Organization 66 (2008), no. 3-4, 597–605.
[61] Richard J Shavelson, Dennis C Phillips, Lisa Towne, and Michael J Feuer, Onthe science of education design studies, Educational researcher 32 (2003), no. 1,25–28.
[62] Yoav Shoham and Kevin Leyton-Brown, Multiagent systems: Algorithmic, game-theoretic, and logical foundations, Cambridge University Press, New York, NY,USA, 2008.
[63] Munindar P. Singh, Norms as a basis for governing sociotechnical systems, ACMTrans. Intell. Syst. Technol. 5 (2014), no. 1, 21:1–21:23.
[64] Florian Skopick, Daniel Schall, and Schahram Dustdar, Discovering and manag-ing social compositions in collaborative enterprise crowdsourcing systems, Inter-national Journal of Cooperative Information Systems 21 (2012), no. 04, 297–341.
[65] Leon Sterling and Kuldar Taveter, The art of agent-oriented modeling, Cam-bridge, MA, and London, England: The MIT Press, 2009.
[66] Zhulei Tang, Michael D. Smith, and Alan Montgomery, The impact of shopbot useon prices and price dispersion: Evidence from online book retailing, InternationalJournal of Industrial Organization 28 (2010), no. 6, 579 – 590.
[67] K. Taveter, Hongying Du, and M.N. Huhns, Method for rapid prototyping ofsocietal information systems, Computer Science and Information Systems (Fed-CSIS), 2012 Federated Conference on, 2012, pp. 1221–1228.
[68] Kuldar Taveter, Hongying Du, and Michael N. Huhns, Engineering societal in-formation systems by agent-oriented modeling, Journal of Ambient Intelligenceand Smart Environments 4 (2012), 227–252.
[69] O. Tokarchuk, R. Cuel, and M. Zamarian, Analyzing crowd labor and designingincentives for humans in the loop, Internet Computing, IEEE 16 (2012), no. 5,45–51.
[70] Hong-Linh Truong, Schahram Dustdar, and Kamal Bhattacharya, Programminghybrid services in the cloud, Service-Oriented Computing (Chengfei Liu, HeikoLudwig, Farouk Toumani, and Qi Yu, eds.), Lecture Notes in Computer Science,vol. 7636, Springer Berlin Heidelberg, 2012, pp. 96–110.
87
Page 97
[71] Hong-Linh Truong, Schahram Dustdar, and Kamal Bhattacharya, Conceptu-alizing and programming hybrid services in the cloud, International Journal ofCooperative Information Systems 22 (2013), no. 04, 1341003.
[72] Yathiraj B. Udupi and Munindar P. Singh, Information sharing among au-tonomous agents in referral networks, Agents and Peer-to-Peer Computing(SamuelR.H. Joseph, Zoran Despotovic, Gianluca Moro, and Sonia Bergamaschi,eds.), Lecture Notes in Computer Science, vol. 5319, Springer Berlin Heidelberg,2010, pp. 13–26.
[73] Andrzej Uszok, JeffreyM. Bradshaw, and Renia Jeffers, Kaos: A policy anddomain services framework for grid computing and semantic web services, TrustManagement (Christian Jensen, Stefan Poslad, and Theo Dimitrakos, eds.), Lec-ture Notes in Computer Science, vol. 2995, Springer Berlin Heidelberg, 2004,pp. 16–26.
[74] J.S. Valacich and C. Schneider, Information systems today: Managing in thedigital world, Prentice Hall PTR, 2009.
[75] Astrid M. von der Putten, Nicole C. Kramer, and Jonathan Gratch, How ourpersonality shapes our interactions with virtual characters - implications for re-search and development, 10th International Conference on Intelligent VirtualAgents (Philadelphia, PA), 2010.
[76] Xin Wang and G.B. Giannakis, Resource allocation for wireless multiuser ofdmnetworks, Information Theory, IEEE Transactions on 57 (2011), no. 7, 4359–4372.
[77] Duncan J. Watts and Steven H. Strogatz, Collective dynamics of ’small-world’networks, Nature 393 (1998), 440–442.
[78] Brian Whitworth and Adnan Ahmad, Socio-technical system design, The Inter-action Design Foundation, Aarhus, Denmark, 2013.
[79] Uri Wilensky, Netlogo, http://ccl.northwestern.edu/netlogo/, Center for Con-nected Learning and Computer-Based Modeling, Northwestern University,Evanston, IL, 1999.
[80] Michael Wooldridge, An introduction to multiagent systems, 2nd ed., Wiley Pub-lishing, 2009.
88
Page 98
[81] Jaeyoung Yang, Tae-Hyung Kim, and Joongmin Choi, An interface agent forwrapper-based information extraction, Intelligent Agents and Multi-Agent Sys-tems (MichaelWayne Barley and Nik Kasabov, eds.), Lecture Notes in ComputerScience, vol. 3371, Springer Berlin Heidelberg, 2005, pp. 291–302.
[82] R.K. Yin, Case study research: Design and methods, Applied Social ResearchMethods, SAGE Publications, 2009.
89
Page 99
Appendix A
Item Prices in Dollars
90
Page 100
Table A.1 Item Prices in Dollars
Item index Item name Walmart Publix Food Lion BI-LO Target
store 0 store 1 store 2 store 3 store 4
1 Tropicana: orange juice, 64oz 2.92 3.79 2.97 3.69 2.99
2 Simply Orange juice, 1.75l 3.00 3.79 2.99 3.00 2.99
3 Corona extra: 12oz*6 8.47 8.29 7.99 8.29 6.50
4 Budlight: 12oz*6 6.97 6.49 5.99 6.99 5.25
5 Totino's: pepperoni pizza, 10.2oz 1.25 1.49 1.67 1.67 1.20
6 Coca-Cola zero, 12oz*12 4.28 4.99 3.33 3.33 4.99
7 Mtn Dew soda, 2l 1.38 1.59 1.33 1.79 1.00
8 Lay's: potato chips classic, 11oz 2.48 3.99 3.00 3.49 3.59
9 Pringles: BBQ chips, 6.38oz 1.50 1.50 1.67 1.50 1.44
10 Chicken drumsticks (per LB) 1.72 1.19 1.49 1.79 -
11 Chicken breasts (per LB) 3.33 1.69 1.99 4.49 -
12 Horizon organic: milk 0.5gal 3.50 3.99 3.79 3.49 3.54
13 Silk: pure almond 0.5gal 2.64 2.99 2.79 3.00 2.69
14 McCormick: black pepper, 2oz 1.38 2.19 1.72 1.89 0.94
15 McCormick: grill mates, 3oz 1.78 1.99 2.05 1.49 1.99
16 Kraft: sharp cheddar, 8oz 2.00 2.80 2.50 2.99 2.29
17 Sargento: sharp chedder, 16oz 4.74 3.99 4.89 2.99 4.38
18 Ground Beef (per LB) 1.98 2.89 3.59 4.29 -
19 Whole grain bread, 24oz 3.69 3.69 3.69 3.69 2.54
20 Whole wheat bread, 16oz 2.98 2.50 2.99 3.59 2.39
21 Quaker: instant oatmeal, 15.1oz 2.88 1.99 2.99 3.79 2.89
22 Spearmint 14 ct gum 0.96 1.19 1.19 1.19 1.04
23 Doublemint 15 sticks gum 0.86 1.09 1.19 1.19 1.04
24 Ribeye steak (per LB) 8.28 11.99 10.99 9.99 -
25 Beringer: Merlot, 750ml 8.97 6.59 7.49 7.99 8.99
26 Woodbridge Chardonnay, 750ml 5.47 6.99 6.49 6.50 5.00
27 Large cooked shrimp (per LB) 5.71 7.99 10.99 6.00 -
28 Butter pecan ice cream, 1.5qt 3.50 4.41 4.69 5.49 3.99
29 Chocolate ice cream, 1.5qt 2.25 4.99 3.79 3.30 2.89
30 Maxwell House: original, 10.5oz 3.00 3.89 4.41 3.79 3.27
31 Starbucks: house blend 12oz 7.48 9.29 8.19 9.19 6.99
32 One dozen large eggs 1.25 1.39 1.22 1.19 1.29
33 Gala apples large (per LB) 1.67 1.89 1.79 1.99 -
91
Page 101
Appendix B
Number of patients going to each physician
each day
92
Page 105
Figure B.1 Number of patients going to each physician each day
96