89-96 89 The Mining-Geology-Petroleum Engineering Bulletin UDC: 551.24 DOI: 10.17794/rgn.2019.4.9 Preliminary communication Corresponding author: Reza Goli Ejlali [email protected]A new approach for particle size characterization of soil based on dynamic image analysis (DIA) Saman Tabrizi-Zarringhabaei 1 ; Reza Goli Ejlali 1 ; Mikaeil Yousefzadeh Fard 1 ; Sayyedjavad Sayyedfattahi 2 1 Department of Civil Engineering, Tabriz Branch, Islamic Azad University, Tabriz, Iran 2 Department of Electrical Engineering, Tabriz Branch, Islamic Azad University, Tabriz, Iran Abstract Particle size distribution (PSD) affects soil behaviour and plays a main role in geotechnical engineering. In site investiga- tions of large engineering structures, in earthquakes and liquefaction research and before filter material selection, it is necessary to make a number of PSD analyses. There are two popular techniques to determine PSD in the lab: sieving for the coarse-grained samples and hydrometer analysis for fine-grained samples. However, determining the PSD of soil in the lab has some challenges such as time, labour, difficulty and errors related to the analysis. The newly developed dy- namic image analysis (DIA) method based on wavelet transformation (WT) analysis is used as the main approach for determining particle size distribution. The DIA method contains saving the image and processing it with the software for a specified goal. The DIA method holds many advantages over the hydrometer analysis, including automating the test, reducing errors, monitoring and evaluating the particles at any time. In this paper, the PSD of fine-grained soil with a plasticity index (PI(=30 has been determined. The images of soil were prepared with a digital camera at a different time when particles settled through a sedimentation cylinder and were analysed with MATLAB software. The results were compared with the hydrometer analysis. The results showed that at t=15 min, a complete overlapping was seen between the DIA method and hydrometer analysis. The D 20 , D 50 and D 80 values by the DIA method were determined respectively, 0.0017, 0.012 and 0.031 mm at t=15 min. The results demonstrated that the DIA technique can be implemented for all types of fine-grained soils, more easily than the hydrometer analysis. The differences between the methods’ results were raised due to the amount of data provided by them. Keywords dynamic image analysis, fine-grained soil, MATLAB software 1. Introduction The PSD of soil is one of the most essential and vital soil properties (e.g., Tafesse et al., 2012). In civil engi- neering, particle size distribution is used to predict engi- neering properties, such as the groundwater drainage, fill material and soil improvement method. PSD is used to estimate soil behaviour, such as liquefaction (e.g., Ta- brizi-Zarringhabaei et al., 2019). There are two com- mon methods to determine PSD: sieving for coarse- grained soils and hydrometer analysis for fine-grained soils. Hydrometer analysis is based on the principle of sedi- mentation and Stoke’s law so it has some limitations (e.g., Ghasemi et al., 2018). It presumes that all soil par- ticles are globular, but some particles are plate-shaped and flaky. The container, which is not infinitely long, while Stoke’s principle is for infinitely free falling parti- cles. A lot of particles are used in the hydrometer analy- sis while Stoke’s law is for a single particle. Hydrometer analysis is a time-consuming process. Image processing would be a practical alternative to make an accurate measurement of particle size distribu- tion. Image processing is the use of computer algorithms to create, process, communicate and display digital im- ages for specified purposes. The image analysis tech- niques can be summarized in four basic steps: taking photographs with a digital camera, storing the image file as a digital file, image processing to edit the digital im- ages for specific analysis, and analysis of the modified image to quantify the properties of an object (Dipova, 2017). The imaging method has some advantages over hydrometer analysis such as less errors, preparation of visual data of the soil and it is fast and easy. Image analysis is used for detailed works of many disciplines, including medicine, genetics, biology, tex- tiles, food science, geology, physics, chemistry, agricul- ture, forestry, mining, computer engineering, civil engi- neering and environmental sciences. For example, an MRI plays a crucial role in many medical treatments
Transcript
89-96
89
The Mining-Geology-Petroleum Engineering BulletinUDC: 551.24DOI: 10.17794/rgn.2019.4.9
A new approach for particle size characterization of soil based on dynamic image analysis (DIA)
Saman Tabrizi-Zarringhabaei1; Reza Goli Ejlali1; Mikaeil Yousefzadeh Fard1; Sayyedjavad Sayyedfattahi2
1Department of Civil Engineering, Tabriz Branch, Islamic Azad University, Tabriz, Iran2Department of Electrical Engineering, Tabriz Branch, Islamic Azad University, Tabriz, Iran
AbstractParticle size distribution (PSD) affects soil behaviour and plays a main role in geotechnical engineering. In site investiga-tions of large engineering structures, in earthquakes and liquefaction research and before filter material selection, it is necessary to make a number of PSD analyses. There are two popular techniques to determine PSD in the lab: sieving for the coarse-grained samples and hydrometer analysis for fine-grained samples. However, determining the PSD of soil in the lab has some challenges such as time, labour, difficulty and errors related to the analysis. The newly developed dy-namic image analysis (DIA) method based on wavelet transformation (WT) analysis is used as the main approach for determining particle size distribution. The DIA method contains saving the image and processing it with the software for a specified goal. The DIA method holds many advantages over the hydrometer analysis, including automating the test, reducing errors, monitoring and evaluating the particles at any time. In this paper, the PSD of fine-grained soil with a plasticity index (PI(=30 has been determined. The images of soil were prepared with a digital camera at a different time when particles settled through a sedimentation cylinder and were analysed with MATLAB software. The results were compared with the hydrometer analysis. The results showed that at t=15 min, a complete overlapping was seen between the DIA method and hydrometer analysis. The D20, D50 and D80 values by the DIA method were determined respectively, 0.0017, 0.012 and 0.031 mm at t=15 min. The results demonstrated that the DIA technique can be implemented for all types of fine-grained soils, more easily than the hydrometer analysis. The differences between the methods’ results were raised due to the amount of data provided by them.
The PSD of soil is one of the most essential and vital soil properties (e.g., Tafesse et al., 2012). In civil engi-neering, particle size distribution is used to predict engi-neering properties, such as the groundwater drainage, fill material and soil improvement method. PSD is used to estimate soil behaviour, such as liquefaction (e.g., Ta-brizi-Zarringhabaei et al., 2019). There are two com-mon methods to determine PSD: sieving for coarse-grained soils and hydrometer analysis for fine-grained soils.
Hydrometer analysis is based on the principle of sedi-mentation and Stoke’s law so it has some limitations (e.g., Ghasemi et al., 2018). It presumes that all soil par-ticles are globular, but some particles are plate-shaped and flaky. The container, which is not infinitely long, while Stoke’s principle is for infinitely free falling parti-cles. A lot of particles are used in the hydrometer analy-
sis while Stoke’s law is for a single particle. Hydrometer analysis is a time-consuming process.
Image processing would be a practical alternative to make an accurate measurement of particle size distribu-tion. Image processing is the use of computer algorithms to create, process, communicate and display digital im-ages for specified purposes. The image analysis tech-niques can be summarized in four basic steps: taking photographs with a digital camera, storing the image file as a digital file, image processing to edit the digital im-ages for specific analysis, and analysis of the modified image to quantify the properties of an object (Dipova, 2017). The imaging method has some advantages over hydrometer analysis such as less errors, preparation of visual data of the soil and it is fast and easy.
Image analysis is used for detailed works of many disciplines, including medicine, genetics, biology, tex-tiles, food science, geology, physics, chemistry, agricul-ture, forestry, mining, computer engineering, civil engi-neering and environmental sciences. For example, an MRI plays a crucial role in many medical treatments
Tabrizi-Zarringhabaei, S.; Ejlali, R.; Yousefzadeh Fard, M.; Sayyedfattahi, S. 90
(Pham et al., 2000). Image analysis is used for cancers and heart diseases diagnosis (Wang et al., 2009). Deter-mining an individual’s identity by image analysis (Jain et al., 2006). The image processing method has been ap-plied increasingly for food quality evaluation (Du and Sun, 2004). Machine vision systems provide quality control and real-time feedback for industrial processes, overcoming physical limitations and subjective judg-ment of humans. The image processing techniques for developing a low-cost machine vision system for phar-maceutical capsule inspection has been explored (Islam et al., 2008). Eremin (2006) used an imaging technique for quality control of a sheet metal roll. Imaging tech-niques are also used in the field of engineering.
Kuo et al. (1996) used image analysis of gravel parti-cles for controlling asphalt quality. Later, a particle shape factor was determined (Kuo and Freeman, 2000; Sukumaran and Ashmawy, 2001). The imaging meth-od was used to control pavement performance (Tutum-luer and Pan, 2008). Sukumaran and Ashmawy, 2003 correlated particle shape and angularity obtained from images with hopper flow rates and pluviated void ratios. Bowman et al. (2001) used fourier shape descriptors to determine the particle shape. Later, this method was used to determine the creep (Bowman and Soga, 2003). The powder characteristics in the viscosity model were analysed in terms of the interparticle distance. The new-ly developed image processing method to quantify the interparticle distances for powder particle sizes can en-hance the understanding of physical phenomena in vari-ous industrial applications because the interparticle dis-tance enables a quantitative analysis of rheological char-acteristics such as viscosity or powder agglomeration (Park and park, 2018). Using digital images of soil horizons, their boundaries, and purity were evaluated. Soil profile images in JPEG format were taken from 17 morphologically different soil profiles using a digital camera. Soil colour models and image texture features were extracted from the soil profile images, and k-means clustering was used to segment the soil profile. Four models with different input variables were compared, and soil horizon boundary features (distinctness, tortu-osity, mean curvature, and topography) and horizon fea-tures (thickness and purity) were calculated (Zhang and Hartemink, 2019). Based on digital image processing, an automatic generation method of PFC∼2D numerical model of soil-rock mixture microstructure was pro-posed, and the experimental simulation was carried out with MATLAB. Thus, the rapid, real and automatic modelling of heterogeneous material microstructure by PFC∼2D software was realized (Pengfei and Xingping, 2019). Araujo et al. (2015) studied the use of image analysis together with the degree of sphericity and frac-tal theory as a tool to measure the textural parameters of the shape and surface texture of two types of quartz sands. A laboratory testing program was used to evaluate the feasibility of using a digital image analysis technique
to track deformation of geosynthetics during tensile test-ing. The technique developed in this study offers great potential to determine deformations in geosynthetics.
As mentioned above, determining the particle size distribution through imaging techniques has been wide-ly used in studies. However, none of them have focused on dynamic image analysis. The aim of this study is to explain a new method called dynamic image analysis for determining the PSD of fine-grained soil.
2. Methodology
2.1. Testing apparatus and instrumentation
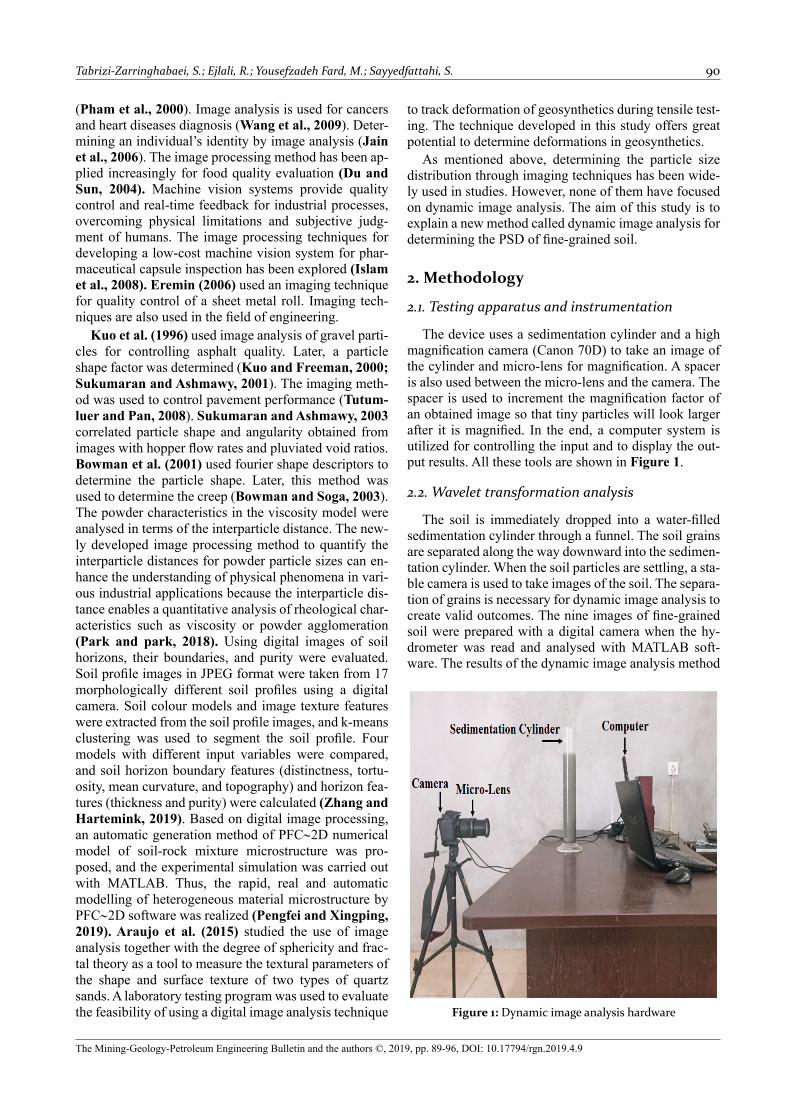
The device uses a sedimentation cylinder and a high magnification camera (Canon 70D) to take an image of the cylinder and micro-lens for magnification. A spacer is also used between the micro-lens and the camera. The spacer is used to increment the magnification factor of an obtained image so that tiny particles will look larger after it is magnified. In the end, a computer system is utilized for controlling the input and to display the out-put results. All these tools are shown in Figure 1.
2.2. Wavelet transformation analysis
The soil is immediately dropped into a water-filled sedimentation cylinder through a funnel. The soil grains are separated along the way downward into the sedimen-tation cylinder. When the soil particles are settling, a sta-ble camera is used to take images of the soil. The separa-tion of grains is necessary for dynamic image analysis to create valid outcomes. The nine images of fine-grained soil were prepared with a digital camera when the hy-drometer was read and analysed with MATLAB soft-ware. The results of the dynamic image analysis method
Figure 1: Dynamic image analysis hardware
91 A new approach for particle size characterization of soil based on dynamic image analysis (DIA)
were compared with the hydrometer analysis. All the other test conditions such as soil, amount of soil, sample preparation, temperature, etc. are the same for both the dynamic image analysis method and the hydrometer analysis.
In this paper, wavelet transformation is utilized for analysing the images of the sample and determining its PSD. This technique uses the wavelet transform and the quantity of energy included at each wavelet decomposi-tion level. The energy of a level relies on the grain size in images. At each decomposition level, energy is calcu-lated. The total energy in the 3 directions at the i-th level is calculated by Equation 1:
(1)
Where:Ei – energy of each decomposition level,EHorizontal i, EVertical i, and EDiagonal i – energies in horizon-
tal, vertical, and diagonal directions, respectively.
Figure 3: Particle size distribution of Al2O3 by DIA
Figure 2: Sample of Al2O3 particles
The Ei is a calculation of the size of discrepancies among the mean grayscale amounts of neighbouring zones in the image.
The Ei gets mutually bigger for very big images. The real Ei values are not very helpful since values increase only with the image size, but the distribution of energy by decomposition level is useful. According to this, the Ei for all levels must be normalized by the total Ei of the main image by Equation 2:
(2)
Where:Enormalized – the total amount of it is a hundred percent.Therefore, the effect of ambient conditions was al-
most omitted by using it at each level. The energy distri-bution between the decomposition levels is used to cal-
Table 2: Soil geotechnical description
Soil number
Soil colour
Colour uniformity
plasticity index
Soil name
1 Olive Uniform 30 CH
Figure 4: Clay sample in laboratory
Figure 5: Clay sample image by digital camera after processing (the black dots are soil particles)
Tabrizi-Zarringhabaei, S.; Ejlali, R.; Yousefzadeh Fard, M.; Sayyedfattahi, S. 92
The Al2O3 particles were used for validating the DIA technique. The Al2O3 particles data were prepared by the SIGMA-ALDRICH corporation and listed in Table 1. The sample of Al2O3 is shown in Figure 2. The gradation curve of Al2O3 by the DIA technique is shown in Figure 3. The results showed that the imaging instrument is pre-cise and trustworthy.
2.4. Materials
The soil geotechnical properties are given in Table 2. The soil sample is shown in Figure 4. The sample for this study was taken from Tabriz city. The soil sample was classified as (CH) according to ASTM D2487. The example of the sample image is shown in Figure 5 and the black dots are soil particles.
3. Results and discussion
The results of the DIA at different times are shown in Figures 6, 7 and Table 3. The hydrometer analysis was carried out in a laboratory and its result is shown in Fig-ure 8 and Table 3.
Table 3 shows that the difference of the D80 values between the DIA method and hydrometer analysis at time 0.5 min to 1440 min respectively are almost 22.5, 18.4, 11.4, 6, 0, 3.3, 6.8, 24, 47%. The difference be-tween the DIA method and hydrometer analysis in D50 values at the different time respectively are almost 25, 20, 7.6, 0, 0, 20, 22.4, 41.1, 71%.
The results of the dynamic image analysis method and hydrometer analysis were compared and show that at t=15 min, a complete overlapping was seen between the DIA and hydrometer analysis methods. The results
Figure 7: Particle size distribution of clay at a) t=15 min b) t=30 min c) t=60 min d) t=240 min e) t=1440 min
Tabrizi-Zarringhabaei, S.; Ejlali, R.; Yousefzadeh Fard, M.; Sayyedfattahi, S. 94
show that at time 0.5 min up to 1440 min, the curves moved to the left because bigger particles settled fast. According to Table 3, at time 0.5 min up to 1440 min, the particles get smaller. The differences in hydrometer analysis and dynamic image analysis results are because of the fact that the hydrometer analysis makes just nine data points compared to a lot of information by the dy-namic image analysis technique. A good agreement was seen between the dynamic image analysis method and hydrometer analysis.
According to Table 2, the soil name is fat clay (CH). Since fat clay has a high plasticity index and it is closer to the clay, the DIA method and the hydrometer analysis
are different. Therefore, when the plasticity index in-creases, the soil clings to the clay and the difference be-tween the DIA and hydrometer analysis methods in-creases because particles get smaller.
Table 3 shows that the difference of the D20 values between the DIA and hydrometer analysis methods at time 0.5 min to 1440 min respectively are almost 45.1, 43.3, 43.3, 43.3, 0, 21.4, 21.4, 21.4%. The D50 values for the entire duration of the DIA method are closer to the hydrometer analysis. The results showed that when par-ticle size decreases, the difference between the DIA method and hydrometer analysis increases.
4. Conclusions
Proper classification of earth material is essential for the anticipation of soil behaviour. For classification by either the AASHTO or the Unified Soil Classification system, the soil grain size distribution must be deter-mined. The grain size distribution provides quantitative estimates of the engineering behaviour of soils. Howev-er, the characterization of particle sizes in the lab has some difficulties and is a time-consuming process. This paper describes the development of a computer vision algorithm designed to process the images collected us-ing a digital camera to determine the PSD of fine-grained soil. The new method is termed “DIA”, which combines rapid soil grain segregation by size through a water-filled sedimentation column with image processing to measure the grain size distribution. The images of fine-grained soil prepared with a digital camera at a different time when particles were settled through a sedimenta-tion cylinder and were analyzed with MATLAB soft-ware. The results were compared with a hydrometer analysis. However, DIA has the potential to simplify and decrease error compared to the hydrometer analysis. The D20, D50 and D80 values by the DIA method were deter-mined respectively, 0.0017, 0.012 and 0.031 mm at t=15 min. There is complete overlapping between the DIA method and hydrometer analysis results at t=15 min. The results showed that at time 0.5 min up to 1440 min the gradation curves move to the left because bigger parti-cles settled fast. The differences in hydrometer analysis and dynamic image analysis results are because of the fact that the hydrometer analysis makes just nine data points compared to a lot of information by the dynamic image analysis technique. The dynamic image analysis test is a suitable alternative to hydrometer analysis for sizing particles. The PSD of fine-grained soil could be determined by one image at t=15 min so the DIA method is fast.
5. References
ASTM D2487-17 (2017): Standard Practice for Classification of Soils for Engineering Purposes (Unified Soil Classi-fication System), ASTM International, West Conshohock-en, PA.
Figure 8: Particle size distribution of clay by hydrometer analysis
95 A new approach for particle size characterization of soil based on dynamic image analysis (DIA)
Araujo, G.S., Bicalho, K.V. and Tristao, F.A. (2015):Use of image analysis to determine the shape and texture of sands. Revista Brasileira De Ciencia Do Solo, 39, 1, 94-99.
Bowman, E.T., Soga, K. and Drummond, W. (2001): Particle shape characte- risation using fourier descriptor analysis. Geotechnique, 51, 6, 545-554.
Bowman, E. T. and Soga, K. (2003): Creep, ageing and micro-structural change in dense granular materials. Soils and Foundations, 43, 4, 107–117.
Dipova, N. (2017): Determine the grain size distribution of granular soils using image analysis. Acta Geotechnica Slovenica, 1, 29-37.
Du, C.J. and Sun, D.W. (2004): Recent developments in the applications of image processing techniques for food qual-ity evaluation. Trends in Food Science & Technology, 15, 5, 230-249.
Eremin, S.N. (2006): Image processing technology in the sys-tems for quality control of sheet metal roll. Pattern Recog-nition and Image Analysis, 16, 1, 127-130.
Ghasemy, A., Rahimi, E. and Malekzadeh, A. (2018): Intro-duction of a new method for determining the particle-size distribution of fine-grained soils. Measurement, 32, 79-86.
Islam, M.J., Ahmad, M.i and Sid-Ahmed, M.A. (2008): Image processing techniques for quality inspection of gelatin capsules in pharmaceutical applications. 10th International Conference on Control, Automation, Robotics and Vision, Vietnam, 862-867.
Jain, A.K., Ross, A. and Pankanti, S. (2006): Biometrics: A tool for information security. IEEE Transactions on Infor-mation Forensics and Security, 1, 2, 125-143.
Kuo, C.Y., Frost, J.D., Lai, LS. and Wang, L.B. (1996): Three-Dimensional image analysis of aggregate particles from orthogonal projections. Transportation Research Record, 1526, 98-103.
Kuo, C.-Y. and Freeman, R.B. (2000): Imaging indices for quantification of shape, angularity, and surface texture of
aggregates. Transportation Research Record Journal of the Transportation Research Board, 1721, 1, 57–65.
Park, D.Y. and Park, S.J. (2018): Particle size-dependent vis-cosity behavior of a suspension using image processing. Powder Technology, 339, 686-694.
Pengfei, S. and Xingping, L. (2019): Mesoscopic structure PFC∼2D model of soil rock mixture based on digital im-age. Journal of Visual Communication and Image Repre-sentation, 58, 407-415.
Pham, D.L., Xu, C. and Prince, J.L. (2000): Current methods in medical image segmentation. Annual Review of Bio-medical Engineering, 2, 315-337.
Sukumaran, B. and Ashmawy, A.K. (2001): Quantitative char-acterisation of the geometry of discrete particles. Geotech-nique, 51, 7, 619-627.
Sukumaran, B. and Ashmawy, A. K. (2003): Influence of in-herent particle characteristics on hopper flow rate. Powder Technology, 138, 1, 46–50.
Tabrizi-Zarringhabaei, S., Ejlali, R.G., Yuosefzadeh Fard, M. and Sayyedfattahi, S. (2019): An image-based method to determine the particle size distribution (PSD) of fine-grained soil. The Mining-Geology-Petroleum Engineering Bulletin (Rudarsko-geološko-naftni zbornik), 34, 3, 81-88.
Tafesse, S., Fernlund, J.M.R. and Bergholm, F. (2012): Digital sieving-matlab based 3-D image analysis. Journal of Engi-neering Geology, 137, 74–84.
Tutumluer, E. and Pan, T. (2008): Aggregate morphology af-fecting strength and permanent deformation behavior of unbound aggregate materials. Journal of Materials in Civil Engineering, 20, 9, 617–627.
Wang, W.H., Liu, X.Y. and Sun Y. (2009): High-throughput automated injection of individual biological cells. IEEE Transactions on Automation Science and Engineering, 6, 2, 209-219.
Zhang, Y. and Hartemink, A.E. (2019): A method for automat-ed soil horizon delineation using digital images. Geoder-ma, 343, 97-115.
Tabrizi-Zarringhabaei, S.; Ejlali, R.; Yousefzadeh Fard, M.; Sayyedfattahi, S. 96
Novi pristup određivanju veličine zrna tla uporabom dinamičke slikovne analize
Razdioba veličine zrna (RVZ) utječe na ponašanje tla i igra glavnu ulogu u geotehničkome inženjerstvu. kod istraživanja velikih inženjerskih građevina, a posebice ispitivanja osjetljivosti na potrese ili otapanje odabranoga materijala, nužno je obaviti analizu RVZ-a. Postoje dvije popularne tehnike koje se primjenjuju u laboratoriju – prosijavanje krupnozrnatih uzoraka i hidrometarska analiza sitnozrnatih. Međutim, laboratorijsko određivanje RVZ-a tla ima određene uvjete poput potrebnoga vremena, rada te mjernih pogrješaka. Ovdje prikazana dinamička slikovna analiza (DSA) temelji se na upo-rabi valne transformacije za određivanje RVZ-a. Metoda DSA pohranjuje sliku objekta i obrađuje je računalnim paketom. Sadržava niz prednosti u odnosu na hidrometarsku analizu poput automatizirane provjere, smanjivanja pogrješke, pra-ćenja i kontinuirane procjene veličine zrna. Ovdje je prikazana razdioba veličine zrna unutar sitnozrnatoga tla s indek-som plastičnosti (PI) 30. Slika tla načinjena je digitalnom kamerom u različitim vremenskim razmacima, tj. trenutcima kada se određeni dio čestica istaložio unutar cilindra. Postupak je analiziran u paketu MATLAB, a rezultati su uspoređe-ni s onima hidrometarske analize. Tako je u trenutku t = 15 min postignuto cjelovito poklapanje rezultata metode DSA i hidrometra. Vrijednosti D20, D50 i D80 u metodi DSA iznosile su 0,0017, 0,012 i 0,031. To je pokazalo kako se ova meto-da, i to znatno lakše od hidrometarske, može primijeniti za sve vrste sitnozrnatoga tla. Razlike između ovih dviju meto-de proizlaze iz broja podataka koji su dostupni nakon njihove primjene.
Saman Tabrizi-Zarringhabaei (Phd candidate): provided the images of samples. Reza Goli Ejlali (Assistant Profe-ssor) planned the research, initialized the idea, managed the whole process and supervised it from the beginning to the end. Mikaeil Yousefzadeh Fard (Assistant Professor) completed literature review and participated in all work stages such as providing soil samples, running experimental tests and data analysis. Sayyedjavad Sayyedfattahi (Assistant Professor) performed the image processing.