16
1 A NEW APPROACH TO NATURAL GAS SEPARATION Andrea Tran, Conner Cruson, Quang Nguyen and Miguel Bagajewicz
1
A NEW
APPROACH TO
NATURAL GAS
SEPARATION
Andrea Tran, Conner Cruson, Quang Nguyen and Miguel Bagajewicz
2
A NEW APPROACH TO NATURAL GAS SEPARATION
Conventional technology of natural gas processing requires many separation steps from acid gas treating to hydrocarbon recovery, etc. The biggest drawback of the conventional gas processing is that these steps demand large usage of energy. Additionally, in the traditional technology it is rather difficult to control the emission of green house gases and toxic gases (such as methane, carbon dioxide, and hydrogen sulfide) to the environment.
The problems associated with the traditional gas processing have initiated our motivation to develop a new technology so that natural gas conditioning can be conducted in a conservative manner such that minimal energy is used, emissions to the environment are minimized, and the maximum amounts of hydrocarbons are recovered. In this work a new approach to gas processing is introduced. This new technology is adapted to a separation scheme and a model is proposed. For the scope of this project, the new technology is specifically designed to remove only acid gases (CO2 and H2S).
In this work, the removal of carbon dioxide and hydrogen sulfide is studied. For this project, we have conducted two case studies. In the first case study, there is only CO2 gas present in the feed at a composition of 9%. The results show a reduction of CO2 composition to 2%. In the second case study, we add H2S gas to the feed to study the overall performance of this technology when both CO2 and H2S gases are present. The calculated results show satisfactory reductions of CO2 from 9% to 1% and H2S from 5% to 0.04%. PRO/II simulations provided necessary process values so that economic comparisons could be made between the amine unit and the new technology. In order to mimic a practical case in natural gas conditioning, feed gas flow‐rate of 63,030 lb‐mole/hr or 576 MMCF/day is used*. Using these conditions the total annualized cost of the amine unit and the new technology are determined to be $32.12M and $13.8M respectively for case study 1, and $39.7 and $15.8M for case study 2.
The new technology is attractive from an economic viewpoint in both case studies. The determining factor of this cost advantage is due to the energy savings in the new process. Furthermore, the new technology has the potential to have much less environmental impact because of the nature of the separation.
* The gas flow‐rate and composition is generously provided by Williams from their Milagro gas plant.
3
TABLE OF CONTENTS
SUMMARY ERROR! BOOKMARK NOT DEFINED.
INTRODUCTION 4
PART 1: CONVENTIONAL GAS PROCESSING ERROR! BOOKMARK NOT DEFINED.
OVERVIEW OF CONVENTIONAL PROCESS Error! Bookmark not defined. ACID GAS PROCESSING Error! Bookmark not defined. DEMETHANIZER Error! Bookmark not defined. FRACTIONATION COLUMN Error! Bookmark not defined.
ECONOMICS Error! Bookmark not defined. AMINE UNIT Error! Bookmark not defined.
PART 2: NEW GAS SEPARATION PROCESS 13
PROCESS DESIGN* 13
ACID GAS REMOVAL UNIT DESIGN 13 Case study 1: CO2 removal 13 Case study 2: CO2 and H2S removal 14
ECONOMICS 14
CONCLUSION/RECOMMENDATIONS 15
4
INTRODUCTION The conventional gas conditioning process requires many stages of separation, which include cryogenic fractionation, gas absorption by liquid solvent, or gas adsorption by solid adsorbent, etc. Although these methods have proven to successfully separate the desired gas components, their inherent disadvantage is large consumption of energy. It would be beneficial to gas processing companies and to the environment to adopt a gas separation process that provides sufficient separation with a much lower energy demand.
In this work, we propose a process that can remove CO2 and H2S on an industrial scale utilizing the special property of natural gas. The advantage of this new technology is that it consumes considerably less energy and significantly reduces operation costs. Hence, this new process is an economically superior method to replace the amine unit as a means to remove acid gases from the gas stream. Additionally, the versatility of this new technology is projected to have the capability to isolate all the primary components present in natural gas.
The report is divided into two separate parts. Part 1 is an overview of the conventional gas separation process currently used in majority of plants in the US. Part 2 introduces the new technology and a comparison of its performance compared with the amine unit.
PartPRO
OVERVThere arecoming fr Water comwater. Fosulfide antoxic and sulfur canThe next Although natural gamethane typical coobtained isolated nliquids aredistillate.
In this repsulfide, anthat does
t 1: COOCESS
VIEW OF Te currently sevom the wellh
mes with theollowing flashnd carbon diocorrosive natn be recoverestep is nitrnitrogen is nas. After nitroup to pentanomponents fofrom. Methanext using a ce then sent to
port, we onlynd we companot contain H
ONVESING
THE CONVveral step‐wihead (Figure 1
e oil and gas wh separation,oxide are remture. A commed in its elemrogen removnot corrosiveogen rejectionne and minoround in natuane is the primryogenic disto an ordinary
y demonstrateare its perforH2S and has 9
ENTIO
VENTIONAse processes 1).
when exiting the natural
moved. It is immon side procmental form. val either bye, it is still den the natural r amounts of ral gas, the emary componillation procey fractionatio
e a new techrmance to the9.4% CO2.
ONAL
AL PROCErequired to i
the well, so tgas stream
mportant to recess directs tThe now swy pressure‐swesirable to regas is primarheavier hydrexact gas manent in the ness, called a dn column, ca
hnology for the amine unit.
GAS
ESS isolate the m
the first procis sent to anemove acid ghe isolated aeetened natuwing adsorptemove becaurily composedrocarbons upake‐up depenatural gas thademethanizerlled a deetha
he removal o. Figure 2 sho
many constitue
cess is the remn amine unitases such as cid gases to aural gas has ttion, or cryouse it lowers d of hydrocarp to octane. Ands highly onat is sold to cr. The methananizer, to reco
of carbon dioxows the targe
ents of natur
moval of the t where hydthese due toa Claus unit wto be dehydrogenic distillthe heat valrbons rangingAlthough thesn where the consumers, sne‐free naturover ethane i
xide and hydeted task for
5
al gas
liquid rogen o their where rated. ation. lue of g from se are gas is o it is al gas in the
rogen a gas
ACID GA
The amine“sour gas”are also cflowing dcompoun(methyldisolution, solution. solution iprovided solution. Tit is coolesulfur, thecombuststhe remai
S PROCESSI
e treating pro”, so called ducalled like thdownward. Tds are ethanolaminso they absoThe sweetens sent to a loby a reboilerThe acid gaseed then recyce acid gases s the acid gasining carbon d
Fi
Figure 1:
NG
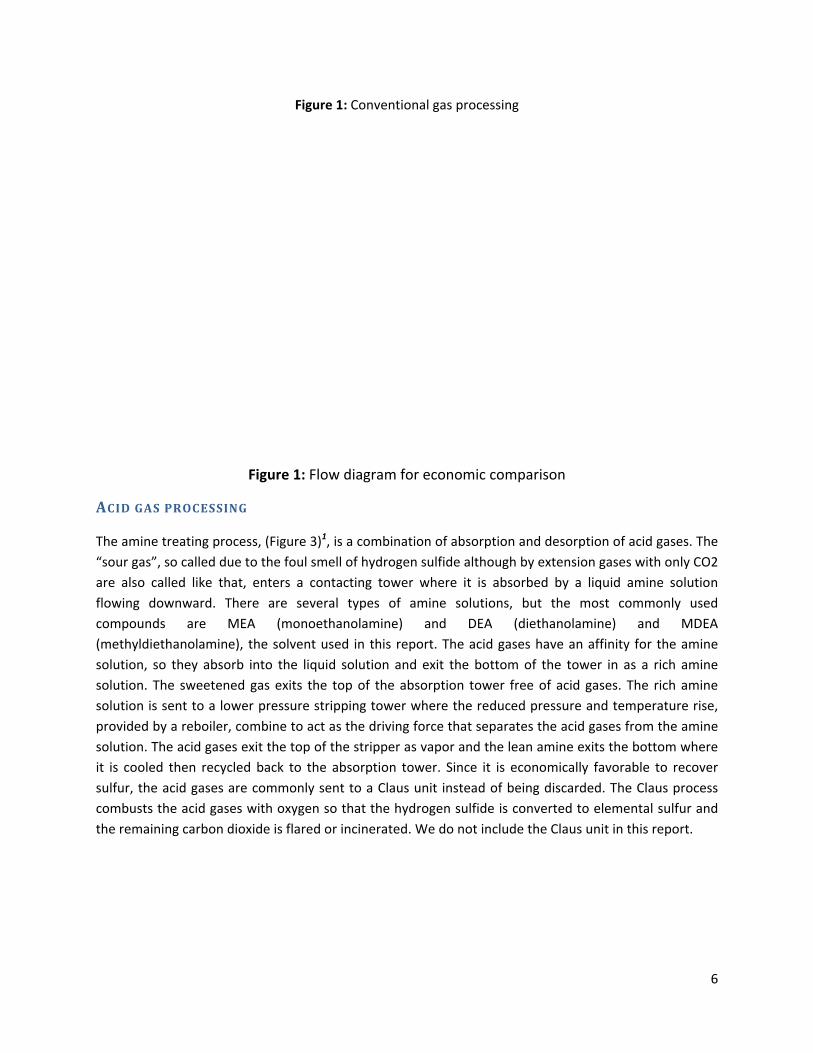
ocess, (Figureue to the fouhat, enters a There are seMEA (mone), the solveorb into the lned gas exits ower pressure, combine to es exit the topcled back to are commonses with oxygdioxide is flar
igure 1: Conv
: Flow diagra
e 3)1, is a coml smell of hydcontacting t
everal types noethanolamnt used in thliquid solutiothe top of te stripping toact as the drp of the stripthe absorptily sent to a Cgen so that thred or inciner
entional gas
am for econo
mbination of adrogen sulfidetower whereof amine s
ine) andhis report. Thon and exit thhe absorptioower where triving force thper as vapor on tower. SiClaus unit inshe hydrogen srated. We do
processing
omic compa
absorption ane although bye it is absorbsolutions, buDEA (die
e acid gases he bottom ofn tower freethe reduced phat separatesand the leannce it is ecostead of beinsulfide is connot include t
rison
nd desorptiony extension gabed by a liquut the mostethanolaminehave an affinf the tower ie of acid gasepressure and s the acid gas amine exits nomically favg discarded. nverted to elehe Claus unit
of acid gasesases with onlyuid amine solt commonly e) and Mnity for the ain as a rich aes. The rich a temperaturees from the athe bottom wvorable to reThe Claus premental sulfut in this repor
6
s. The y CO2 lution used
MDEA amine amine amine e rise, amine where ecover rocess ur and t.
7
DEMETHANIZER
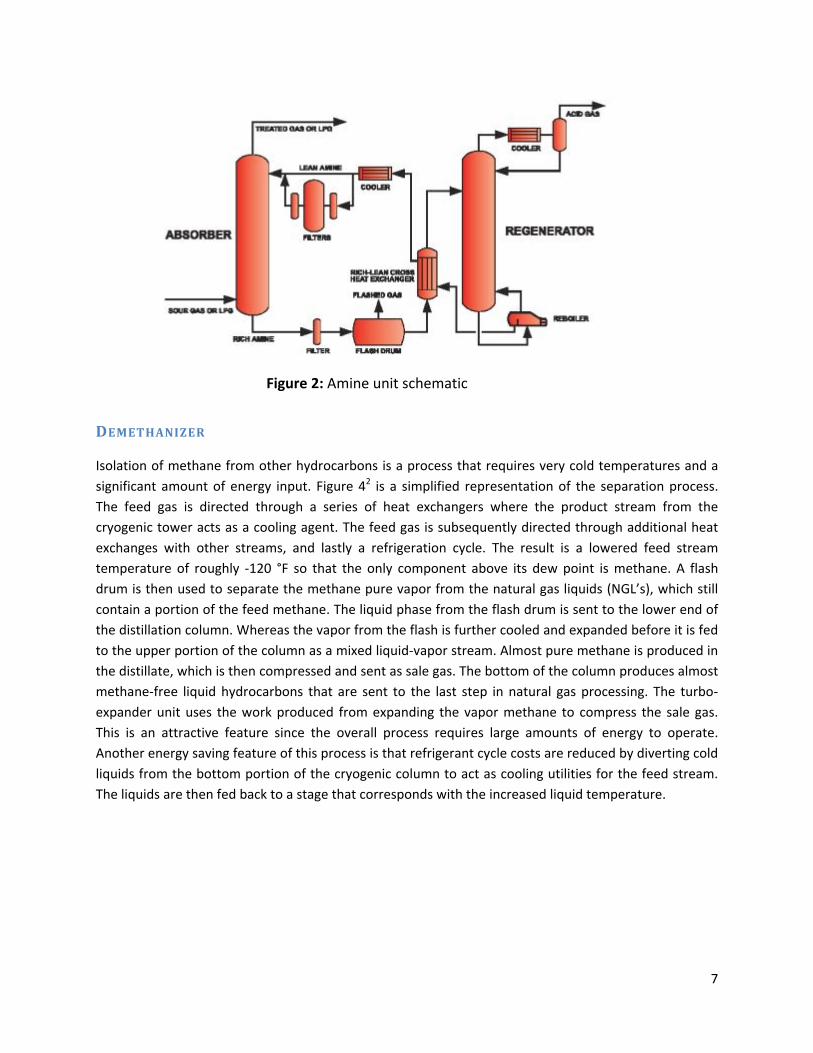
Isolation of methane from other hydrocarbons is a process that requires very cold temperatures and a significant amount of energy input. Figure 42 is a simplified representation of the separation process. The feed gas is directed through a series of heat exchangers where the product stream from the cryogenic tower acts as a cooling agent. The feed gas is subsequently directed through additional heat exchanges with other streams, and lastly a refrigeration cycle. The result is a lowered feed stream temperature of roughly ‐120 °F so that the only component above its dew point is methane. A flash drum is then used to separate the methane pure vapor from the natural gas liquids (NGL’s), which still contain a portion of the feed methane. The liquid phase from the flash drum is sent to the lower end of the distillation column. Whereas the vapor from the flash is further cooled and expanded before it is fed to the upper portion of the column as a mixed liquid‐vapor stream. Almost pure methane is produced in the distillate, which is then compressed and sent as sale gas. The bottom of the column produces almost methane‐free liquid hydrocarbons that are sent to the last step in natural gas processing. The turbo‐expander unit uses the work produced from expanding the vapor methane to compress the sale gas. This is an attractive feature since the overall process requires large amounts of energy to operate. Another energy saving feature of this process is that refrigerant cycle costs are reduced by diverting cold liquids from the bottom portion of the cryogenic column to act as cooling utilities for the feed stream. The liquids are then fed back to a stage that corresponds with the increased liquid temperature.
Figure 2: Amine unit schematic
8
Figure 3: Demethanizer unit
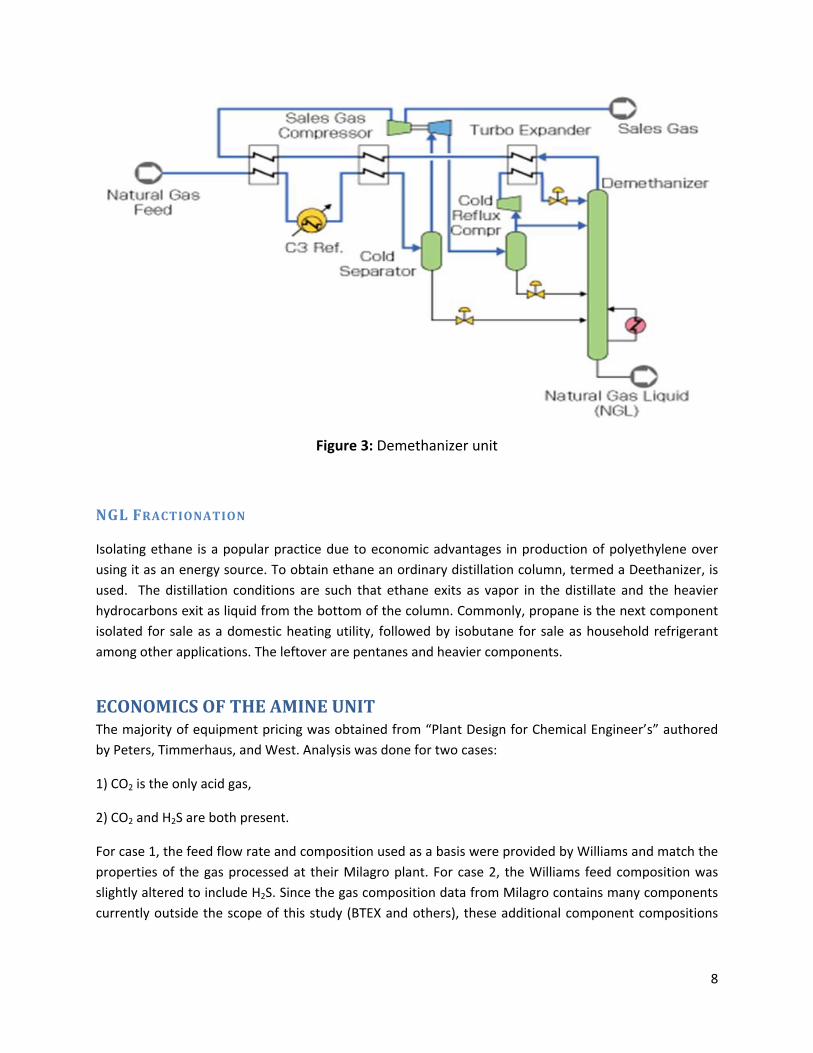
NGL FRACTIONATION
Isolating ethane is a popular practice due to economic advantages in production of polyethylene over using it as an energy source. To obtain ethane an ordinary distillation column, termed a Deethanizer, is used. The distillation conditions are such that ethane exits as vapor in the distillate and the heavier hydrocarbons exit as liquid from the bottom of the column. Commonly, propane is the next component isolated for sale as a domestic heating utility, followed by isobutane for sale as household refrigerant among other applications. The leftover are pentanes and heavier components.
ECONOMICS OF THE AMINE UNIT The majority of equipment pricing was obtained from “Plant Design for Chemical Engineer’s” authored by Peters, Timmerhaus, and West. Analysis was done for two cases:
1) CO2 is the only acid gas,
2) CO2 and H2S are both present.
For case 1, the feed flow rate and composition used as a basis were provided by Williams and match the properties of the gas processed at their Milagro plant. For case 2, the Williams feed composition was slightly altered to include H2S. Since the gas composition data from Milagro contains many components currently outside the scope of this study (BTEX and others), these additional component compositions
9
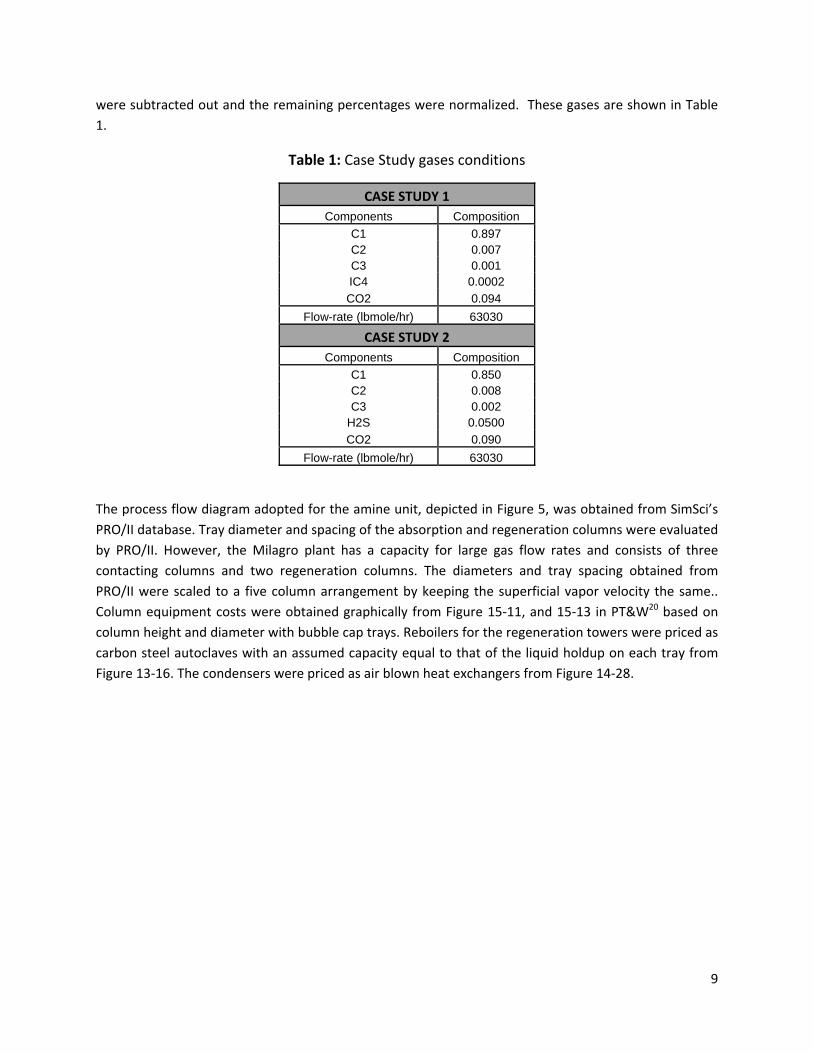
were subtracted out and the remaining percentages were normalized. These gases are shown in Table 1.
Table 1: Case Study gases conditions
CASE STUDY 1 Components Composition
C1 0.897 C2 0.007 C3 0.001 IC4 0.0002 CO2 0.094
Flow-rate (lbmole/hr) 63030
CASE STUDY 2 Components Composition
C1 0.850 C2 0.008 C3 0.002
H2S 0.0500 CO2 0.090
Flow-rate (lbmole/hr) 63030
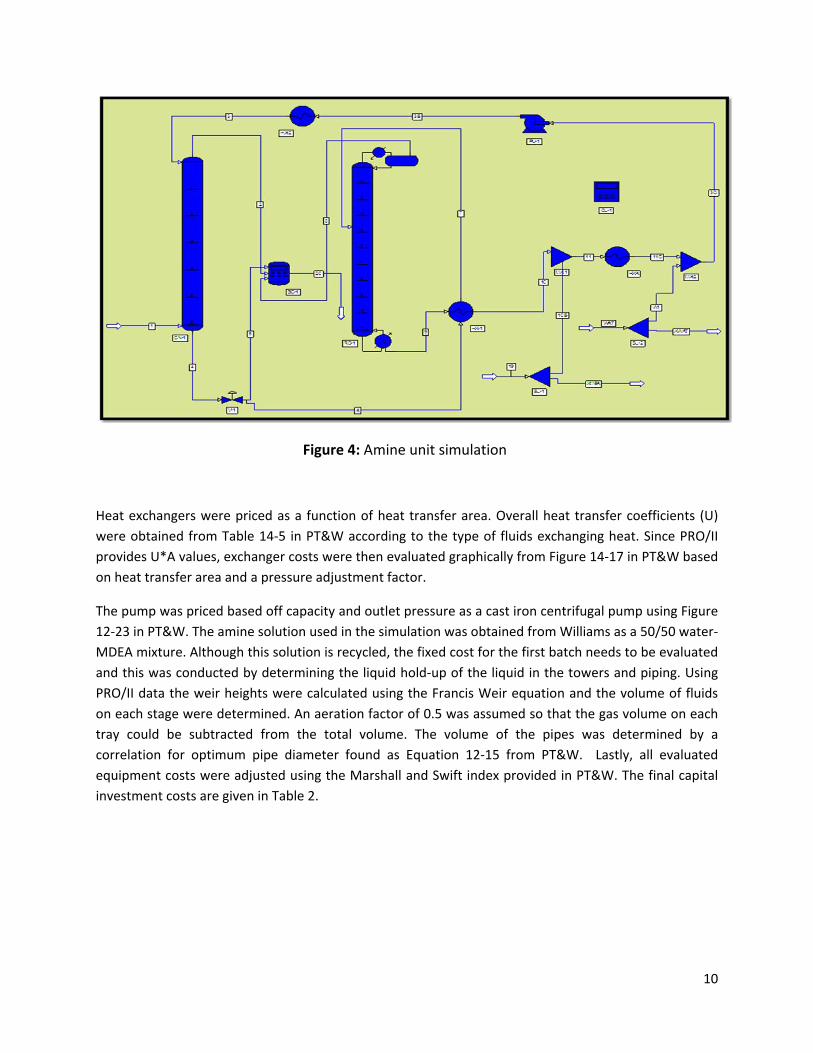
The process flow diagram adopted for the amine unit, depicted in Figure 5, was obtained from SimSci’s PRO/II database. Tray diameter and spacing of the absorption and regeneration columns were evaluated by PRO/II. However, the Milagro plant has a capacity for large gas flow rates and consists of three contacting columns and two regeneration columns. The diameters and tray spacing obtained from PRO/II were scaled to a five column arrangement by keeping the superficial vapor velocity the same.. Column equipment costs were obtained graphically from Figure 15‐11, and 15‐13 in PT&W20 based on column height and diameter with bubble cap trays. Reboilers for the regeneration towers were priced as carbon steel autoclaves with an assumed capacity equal to that of the liquid holdup on each tray from Figure 13‐16. The condensers were priced as air blown heat exchangers from Figure 14‐28.
10
Heat exchangers were priced as a function of heat transfer area. Overall heat transfer coefficients (U) were obtained from Table 14‐5 in PT&W according to the type of fluids exchanging heat. Since PRO/II provides U*A values, exchanger costs were then evaluated graphically from Figure 14‐17 in PT&W based on heat transfer area and a pressure adjustment factor.
The pump was priced based off capacity and outlet pressure as a cast iron centrifugal pump using Figure 12‐23 in PT&W. The amine solution used in the simulation was obtained from Williams as a 50/50 water‐MDEA mixture. Although this solution is recycled, the fixed cost for the first batch needs to be evaluated and this was conducted by determining the liquid hold‐up of the liquid in the towers and piping. Using PRO/II data the weir heights were calculated using the Francis Weir equation and the volume of fluids on each stage were determined. An aeration factor of 0.5 was assumed so that the gas volume on each tray could be subtracted from the total volume. The volume of the pipes was determined by a correlation for optimum pipe diameter found as Equation 12‐15 from PT&W. Lastly, all evaluated equipment costs were adjusted using the Marshall and Swift index provided in PT&W. The final capital investment costs are given in Table 2.
Figure 4: Amine unit simulation
11
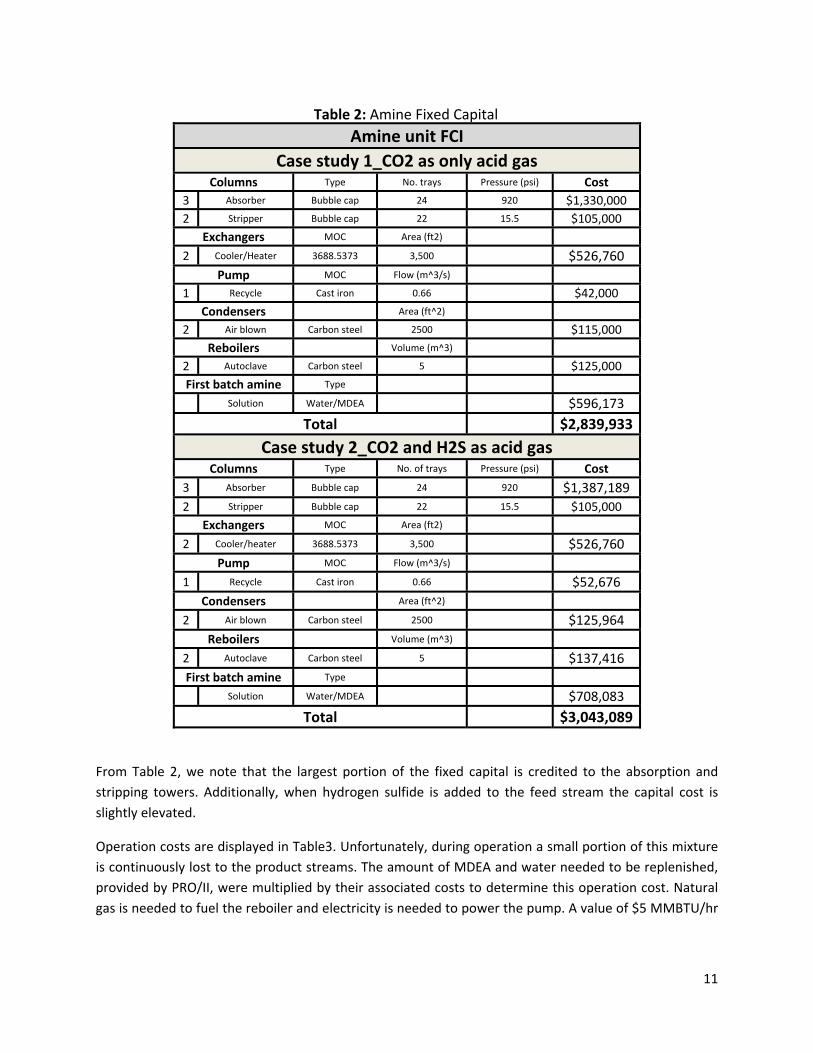
Amine unit FCICase study 1_CO2 as only acid gas
Columns Type No. trays Pressure (psi) Cost 3 Absorber Bubble cap 24 920 $1,330,000 2 Stripper Bubble cap 22 15.5 $105,000
Exchangers MOC Area (ft2)
2 Cooler/Heater 3688.5373 3,500 $526,760 Pump MOC Flow (m^3/s)
1 Recycle Cast iron 0.66 $42,000 Condensers Area (ft^2)
2 Air blown Carbon steel 2500 $115,000 Reboilers Volume (m^3)
2 Autoclave Carbon steel 5 $125,000 First batch amine Type
Solution Water/MDEA $596,173
Total $2,839,933
Case study 2_CO2 and H2S as acid gasColumns Type No. of trays Pressure (psi) Cost
3 Absorber Bubble cap 24 920 $1,387,189 2 Stripper Bubble cap 22 15.5 $105,000
Exchangers MOC Area (ft2)
2 Cooler/heater 3688.5373 3,500 $526,760 Pump MOC Flow (m^3/s)
1 Recycle Cast iron 0.66 $52,676 Condensers Area (ft^2)
2 Air blown Carbon steel 2500 $125,964 Reboilers Volume (m^3)
2 Autoclave Carbon steel 5 $137,416 First batch amine Type
Solution Water/MDEA $708,083
Total $3,043,089
From Table 2, we note that the largest portion of the fixed capital is credited to the absorption and stripping towers. Additionally, when hydrogen sulfide is added to the feed stream the capital cost is slightly elevated.
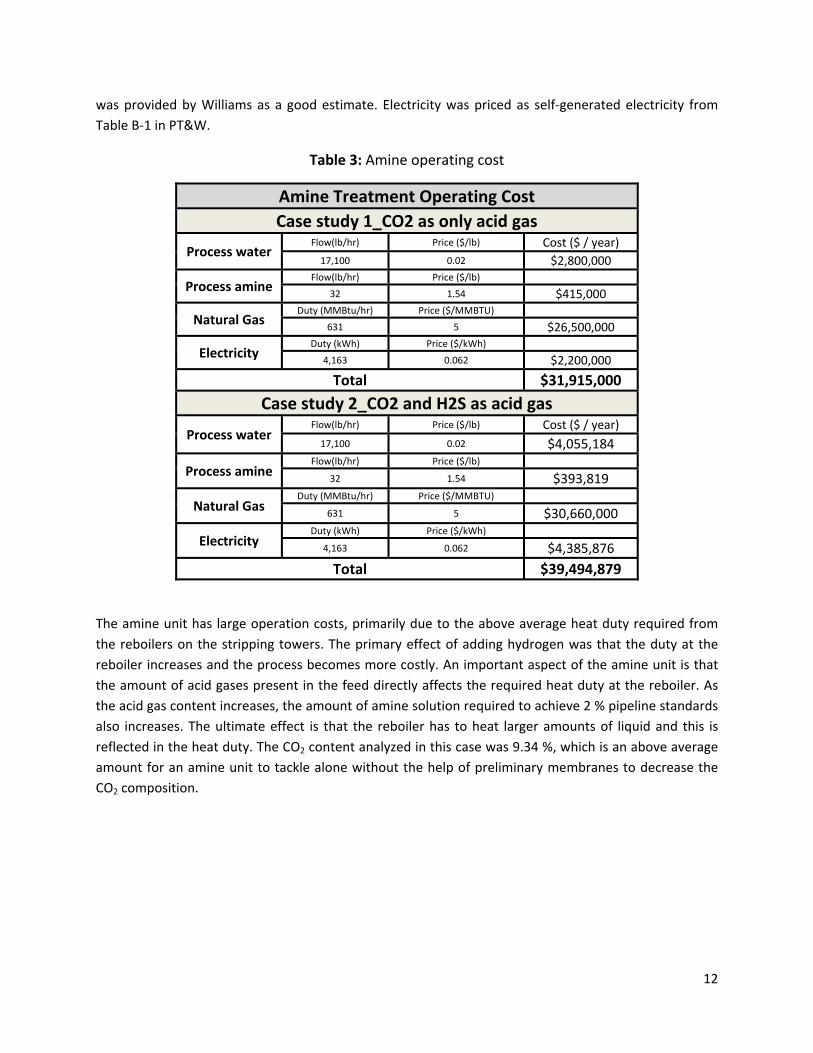
Operation costs are displayed in Table3. Unfortunately, during operation a small portion of this mixture is continuously lost to the product streams. The amount of MDEA and water needed to be replenished, provided by PRO/II, were multiplied by their associated costs to determine this operation cost. Natural gas is needed to fuel the reboiler and electricity is needed to power the pump. A value of $5 MMBTU/hr
Table 2: Amine Fixed Capital
12
was provided by Williams as a good estimate. Electricity was priced as self‐generated electricity from Table B‐1 in PT&W.
Table 3: Amine operating cost
Amine Treatment Operating CostCase study 1_CO2 as only acid gas
Process water Flow(lb/hr) Price ($/lb) Cost ($ / year) 17,100 0.02 $2,800,000
Process amine Flow(lb/hr) Price ($/lb)
32 1.54 $415,000
Natural Gas Duty (MMBtu/hr) Price ($/MMBTU)
631 5 $26,500,000
Electricity Duty (kWh) Price ($/kWh)
4,163 0.062 $2,200,000
Total $31,915,000
Case study 2_CO2 and H2S as acid gas
Process water Flow(lb/hr) Price ($/lb) Cost ($ / year) 17,100 0.02 $4,055,184
Process amine Flow(lb/hr) Price ($/lb)
32 1.54 $393,819
Natural Gas Duty (MMBtu/hr) Price ($/MMBTU)
631 5 $30,660,000
Electricity Duty (kWh) Price ($/kWh)
4,163 0.062 $4,385,876
Total $39,494,879
The amine unit has large operation costs, primarily due to the above average heat duty required from the reboilers on the stripping towers. The primary effect of adding hydrogen was that the duty at the reboiler increases and the process becomes more costly. An important aspect of the amine unit is that the amount of acid gases present in the feed directly affects the required heat duty at the reboiler. As the acid gas content increases, the amount of amine solution required to achieve 2 % pipeline standards also increases. The ultimate effect is that the reboiler has to heat larger amounts of liquid and this is reflected in the heat duty. The CO2 content analyzed in this case was 9.34 %, which is an above average amount for an amine unit to tackle alone without the help of preliminary membranes to decrease the CO2 composition.
13
Part 2: NEW GAS SEPARATION PROCESS
PROCESS DESIGN*
*Technical information will be disclosed upon signing a Confidentiality agreement . Only results and economics analysis are shown in this report.
ACID GAS REMOVAL UNIT DESIGN
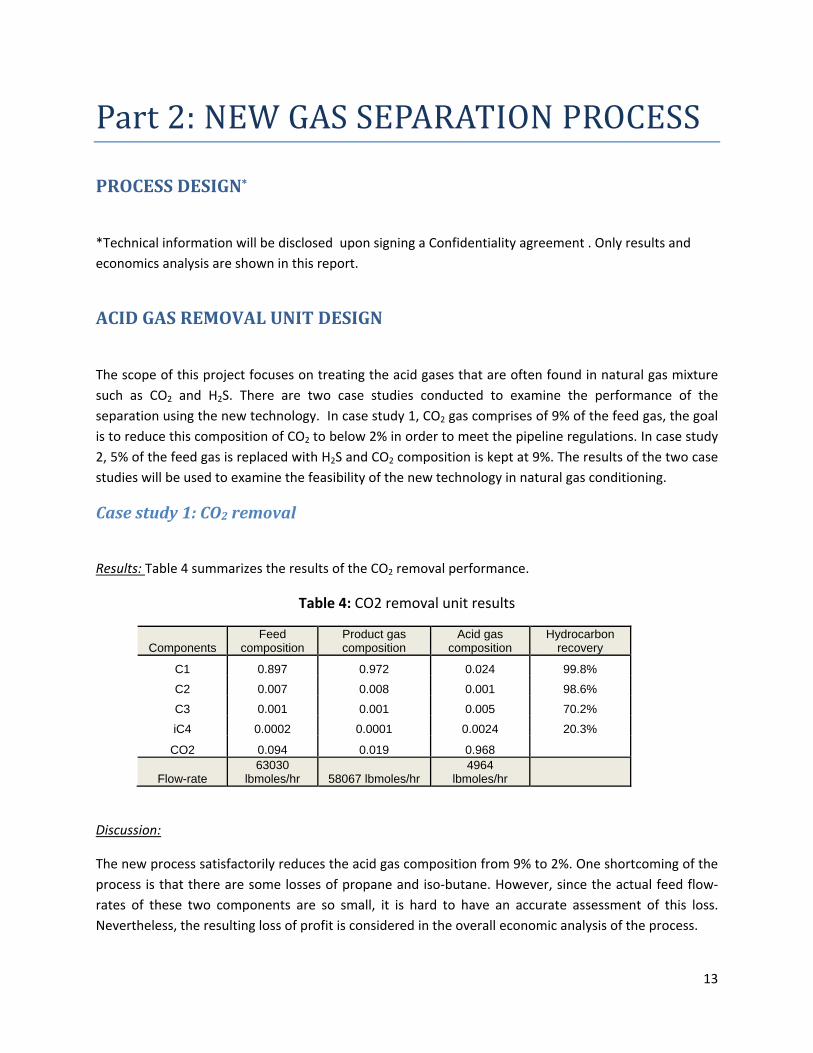
The scope of this project focuses on treating the acid gases that are often found in natural gas mixture such as CO2 and H2S. There are two case studies conducted to examine the performance of the separation using the new technology. In case study 1, CO2 gas comprises of 9% of the feed gas, the goal is to reduce this composition of CO2 to below 2% in order to meet the pipeline regulations. In case study 2, 5% of the feed gas is replaced with H2S and CO2 composition is kept at 9%. The results of the two case studies will be used to examine the feasibility of the new technology in natural gas conditioning.
Case study 1: CO2 removal
Results: Table 4 summarizes the results of the CO2 removal performance.
Table 4: CO2 removal unit results
Components Feed
composition Product gas composition
Acid gas composition
Hydrocarbon recovery
C1 0.897 0.972 0.024 99.8%
C2 0.007 0.008 0.001 98.6%
C3 0.001 0.001 0.005 70.2%
iC4 0.0002 0.0001 0.0024 20.3%
CO2 0.094 0.019 0.968
Flow-rate 63030
lbmoles/hr 58067 lbmoles/hr 4964
lbmoles/hr
Discussion:
The new process satisfactorily reduces the acid gas composition from 9% to 2%. One shortcoming of the process is that there are some losses of propane and iso‐butane. However, since the actual feed flow‐rates of these two components are so small, it is hard to have an accurate assessment of this loss. Nevertheless, the resulting loss of profit is considered in the overall economic analysis of the process.
14
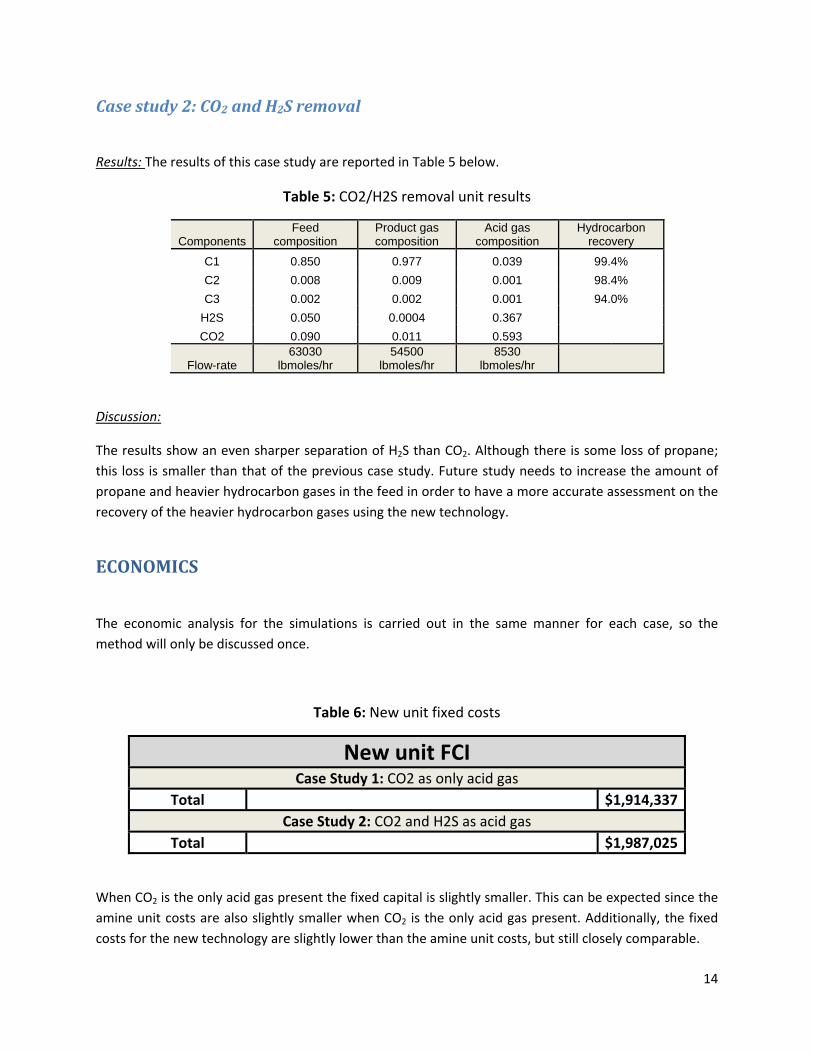
Case study 2: CO2 and H2S removal
Results: The results of this case study are reported in Table 5 below.
Table 5: CO2/H2S removal unit results
Components Feed
composition Product gas composition
Acid gas composition
Hydrocarbon recovery
C1 0.850 0.977 0.039 99.4% C2 0.008 0.009 0.001 98.4% C3 0.002 0.002 0.001 94.0%
H2S 0.050 0.0004 0.367 CO2 0.090 0.011 0.593
Flow-rate 63030
lbmoles/hr 54500
lbmoles/hr 8530
lbmoles/hr
Discussion:
The results show an even sharper separation of H2S than CO2. Although there is some loss of propane; this loss is smaller than that of the previous case study. Future study needs to increase the amount of propane and heavier hydrocarbon gases in the feed in order to have a more accurate assessment on the recovery of the heavier hydrocarbon gases using the new technology.
ECONOMICS
The economic analysis for the simulations is carried out in the same manner for each case, so the method will only be discussed once.
Table 6: New unit fixed costs
New unit FCICase Study 1: CO2 as only acid gas
Total $1,914,337Case Study 2: CO2 and H2S as acid gas
Total $1,987,025
When CO2 is the only acid gas present the fixed capital is slightly smaller. This can be expected since the amine unit costs are also slightly smaller when CO2 is the only acid gas present. Additionally, the fixed costs for the new technology are slightly lower than the amine unit costs, but still closely comparable.
15
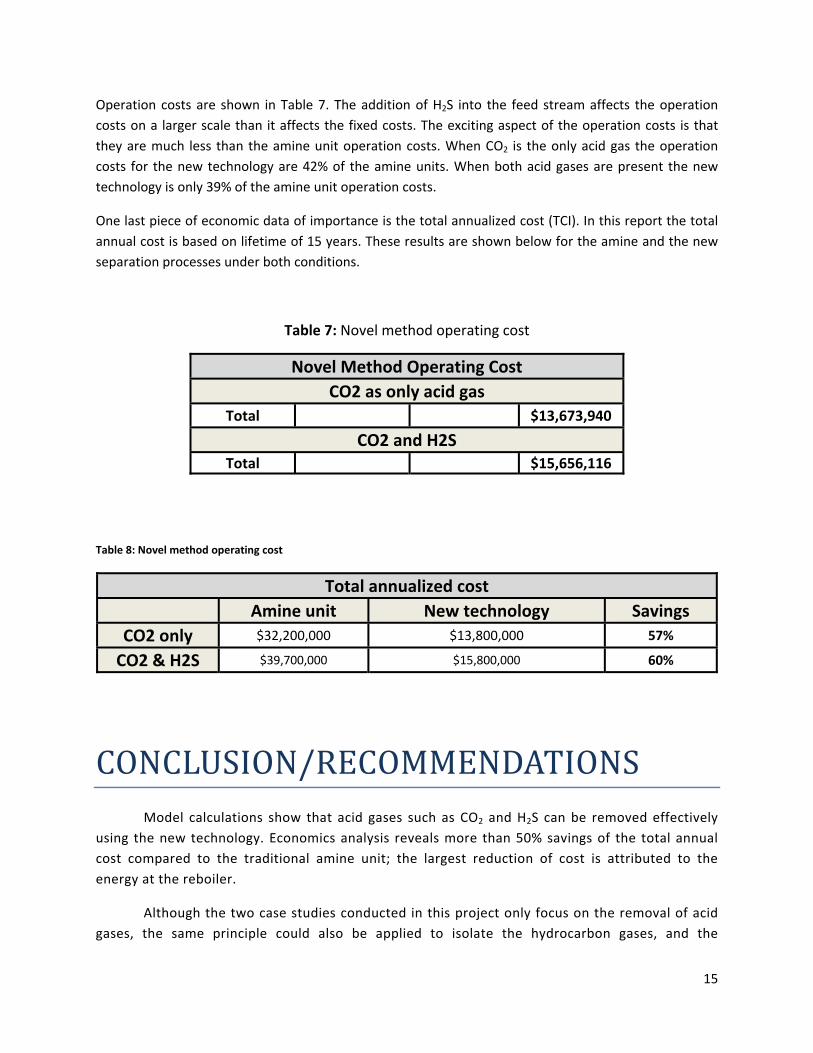
Operation costs are shown in Table 7. The addition of H2S into the feed stream affects the operation costs on a larger scale than it affects the fixed costs. The exciting aspect of the operation costs is that they are much less than the amine unit operation costs. When CO2 is the only acid gas the operation costs for the new technology are 42% of the amine units. When both acid gases are present the new technology is only 39% of the amine unit operation costs.
One last piece of economic data of importance is the total annualized cost (TCI). In this report the total annual cost is based on lifetime of 15 years. These results are shown below for the amine and the new separation processes under both conditions.
Table 7: Novel method operating cost
Novel Method Operating CostCO2 as only acid gas
Total $13,673,940
CO2 and H2STotal $15,656,116
Table 8: Novel method operating cost
Total annualized costAmine unit New technology Savings
CO2 only $32,200,000 $13,800,000 57%
CO2 & H2S $39,700,000 $15,800,000 60%
CONCLUSION/RECOMMENDATIONS Model calculations show that acid gases such as CO2 and H2S can be removed effectively
using the new technology. Economics analysis reveals more than 50% savings of the total annual cost compared to the traditional amine unit; the largest reduction of cost is attributed to the energy at the reboiler.
Although the two case studies conducted in this project only focus on the removal of acid gases, the same principle could also be applied to isolate the hydrocarbon gases, and the
16
technology can potentially replace the demethanizer and the fractionation train. It would be interesting to examine the performance and the economics of the new technology compared with the cryogenic distillation in the demethanizer. Cryogenic distillation a costly process due to the large demand of cooling; hence, if the new process succeeds, it would be a breakthrough in the gas separation technology.
Based on the nature of the separation, the gas emission can be controlled so that the toxic gas and the green house gases can be prevented from harming the environment. However, this feature will need to be verified experimentally.
RECOMMENDATIONS
• In order to have a complete assessment of the new acid gas removal unit and also to determine the optimal conditions for the new technology, a wider range of CO2/H2S concentrations should be studied.
• A separate study in which the feed flow‐rates of the C3+ gases are higher should be investigated to test the recovery performance of the new technology with the heavier hydrocarbon gases.
1 Schematic obtained from http://www.amines.com/ 2 Schematic obtained from http://www.toyo‐eng.co.jp


