+ All Categories
Home > Documents > A New Assessment of Heavy Metal Contaminations in an

A New Assessment of Heavy Metal Contaminations in an

Date post: 04-Feb-2022
Category:
Upload: others
View: 3 times
Download: 0 times
Share this document with a friend
13
Turkish Journal of Fisheries and Aquatic Sciences 12: 135-147 (2012) www.trjfas.org ISSN 1303-2712 DOI: 10.4194/1303-2712-v12_1_16 © Published by Central Fisheries Res earch Institute (CFRI) Trabzon, Turkey in cooperation with Japan International Cooperation Agency (JICA), Japan A New Assessment of Heavy Metal Contaminations in an Eutrophicated Bay (Inner Izmir Bay, Turkey) Ebru Yeşim Özkan 1 1 Ege University, Fisheries Faculty, Department of Hydrobiology, 35100, Izmir Turkey. * Corresponding Author: Tel.: +90.232 3112815 ; Fax: +90.232 3883685; E-mail: [email protected] Received 24 August 2011 Accepted 29 December 2011 Abstract The distribution, controlling geochemical factors and contamination status of heavy metals in inner Izmir Bay (Eastern part of Aegean Sea) were investigated. 23 surface sediment samples were collected and analized for major elements (Al and Fe), heavy metals (Pb, Zn, Cd, Cu, Hg, Cr, Mn), organic matter, grain size composition, carbonate and Chl.-a. Metals controlling factors were elucidated based on statistical methods such as the Pearson product-moment linear correlation and Factor Analysis. The results illustrated that Pb, Zn, Cr and Cd are mainly controlled by organic matter and a lesser extent Fe. Pb also controlled by carbonate and Mn additionally. Other controlling factor on Cr and Cd are Chl.-a via uptake in water column and then sedimentation. Cu and Hg are mainly controlled by Chl.-a. Some evidences were found on changing of carrier phases. The results indicated that contamination of surface sediments in inner Izmir Bay is dominated Pb, Hg, Cd, Zn and to a lesser extent Mn, Cu, Cr and Fe. Igeo classification was consistent with the Enrichment Factor ans Contamination Factor classes generally. Geoaccumulation index values for Zn, Hg, Cr and Cd have decreased two contamination classes from 1994 to 2008, whereas Pb has remained the same and Cu has decreased only one class. Generally Cu, Zn, Pb, Hg and Cr contaminations were below effects range median values. The extent of heavy metal contamination and degree have been affected significantly by sedimentological parameters such as grain size, organic carbon, carbonate and chloropyll-a. Keywords: Heavy metal, enrichment factor, contamination factor, geoaccumulation index, sediment quality guidelines. Eutrofik Bir Körfezde (İzmir İç Körfez, Türkiye) Ağır Metal Kontaminasyonlarına Yeni Bir Yaklaşım Özet Bu çalışmada İzmir İç Körfezindeki (Doğu Ege Denizi) mevcut ağır metalleri etkileyen jeokimyasal faktörler, kontaminasyon durumları ve bu metallerin dağılımları araştırılmıştır. 23 istasyondan yüzey sediment örnekleri toplanarak, bu örneklerde majör elementlerin (Al ve Fe), ağır metallerin (Pb, Zn, Cd, Cu, Hg, Cr, Mn), organik karbon, karbonat, klorafil -a ve tane boyu dağılım analizleri yapılmıştır. Faktörleri kontrol eden metaller Pearson product-moment linear correlation ve Faktör analizi gibi istatistiksel metodlara dayalı olarak açıklanmaya çalışılmıştır. Sonuçlar Pb, Zn, Cr ve Cd un organik mad de tarafından yüksek derecede, Fe in ise daha düşük derecede kontrol edildiğini göstermiştir. Pb un ayrıca organik karbonun yanısıra karbonat ve Mn tarafından da kontrol edildiği gözlemlenmiştir. Cr ve Cd u kontrol eden diğer faktörler su kolonundaki uptake yoluyla chl-a ve bunu takiben sedimantasyondur. Cu ve Hg ise başlıca chl -a tarafından kontrol edilmektedir. Taşıyıcı fazların değişimi üzerine de bazı sonuçlar bulunmuştur. Bu sonuçlar İzmir İç Körfezi yüzey sedimentlerindeki birikimin Pb, Hg, Cd ve Zn tarafından baskın olduğu; Mn, Cu, Cr ve Fe açısından ise daha az etkilendiğini göstermiştir. Jeoakümülasyon indexi sınıflaması genelliklezenginleşme ve kontaminasyon faktörü ile uyumluluk göstermiştir. Jeoakümülasyon indeks değerleri 1994 ten -2008 e doğru Zn, Hg, Cr ve Cd açsından hemen hemen iki kontaminasyon sınıfı azalma gösterirken; Pb aynı derecede kalıp, Cu ise bir sınıf azalma göstermiştir. Genellikle, Cu, Zn, Pb, Hg ve Cr kontaminasyonları medyan etki aralığı (ERM) değerlerinin altında bulunmuştur. Ağır metal kontaminasyonunun yayılımı ve derecesi tane boyu, organik karbon, karbonat ve klorifil-a gibi sedimentolojik parametrelerle önemli bir şekilde etkilenmektedir. Anahtar Kelimeler: Ağır metal, Zenginleşme faktörü, Kontaminasyon faktörü, Jeoakümülasyon indeksi, Sediment kalite kılavuzu
Transcript

Turkish Journal of Fisheries and Aquatic Sciences 12: 135-147 (2012)

www.trjfas.org ISSN 1303-2712

DOI: 10.4194/1303-2712-v12_1_16

© Published by Central Fisheries Research Institute (CFRI) Trabzon, Turkey in cooperation with Japan International Cooperation Agency (JICA), Japan

A New Assessment of Heavy Metal Contaminations in an Eutrophicated

Bay (Inner Izmir Bay, Turkey)

Ebru Yeşim Özkan1

1 Ege University, Fisheries Faculty, Department of Hydrobiology, 35100, Izmir Turkey.

* Corresponding Author: Tel.: +90.232 3112815 ; Fax: +90.232 3883685;

E-mail: [email protected] Received 24 August 2011

Accepted 29 December 2011

Abstract

The distribution, controlling geochemical factors and contamination status of heavy metals in inner Izmir Bay (Eastern part of Aegean Sea) were investigated. 23 surface sediment samples were collected and analized for major elements (Al and Fe), heavy metals (Pb, Zn, Cd, Cu, Hg, Cr, Mn), organic matter, grain size composition, carbonate and Chl.-a. Metals controlling factors were elucidated based on statistical methods such as the Pearson product-moment linear correlation and

Factor Analysis. The results illustrated that Pb, Zn, Cr and Cd are mainly controlled by organic matter and a lesser extent Fe. Pb also controlled by carbonate and Mn additionally. Other controlling factor on Cr and Cd are Chl.-a via uptake in water column and then sedimentation. Cu and Hg are mainly controlled by Chl.-a. Some evidences were found on changing of carrier phases. The results indicated that contamination of surface sediments in inner Izmir Bay is dominated Pb, Hg, Cd, Zn and to a lesser extent Mn, Cu, Cr and Fe. Igeo classification was consistent with the Enrichment Factor ans Contamination Factor classes generally. Geoaccumulation index values for Zn, Hg, Cr and Cd have decreased two contamination classes from 1994 to 2008, whereas Pb has remained the same and Cu has decreased only one class. Generally Cu, Zn, Pb, Hg and Cr contaminations were below effects range median values. The extent of heavy metal contamination and degree have been affected significantly by sedimentological parameters such as grain size, organic carbon, carbonate and chloropyll-a.

Keywords: Heavy metal, enrichment factor, contamination factor, geoaccumulation index, sediment quality guidelines.

Eutrofik Bir Körfezde (İzmir İç Körfez, Türkiye) Ağır Metal Kontaminasyonlarına Yeni Bir Yaklaşım

Özet

Bu çalışmada İzmir İç Körfezindeki (Doğu Ege Denizi) mevcut ağır metalleri etkileyen jeokimyasal faktörler, kontaminasyon durumları ve bu metallerin dağılımları araştırılmıştır. 23 istasyondan yüzey sediment örnekleri toplanarak, bu örneklerde majör elementlerin (Al ve Fe), ağır metallerin (Pb, Zn, Cd, Cu, Hg, Cr, Mn), organik karbon, karbonat, klorafil-a ve tane boyu dağılım analizleri yapılmıştır. Faktörleri kontrol eden metaller Pearson product-moment linear correlation ve

Faktör analizi gibi istatistiksel metodlara dayalı olarak açıklanmaya çalışılmıştır. Sonuçlar Pb, Zn, Cr ve Cd un organik madde tarafından yüksek derecede, Fe in ise daha düşük derecede kontrol edildiğini göstermiştir. Pb un ayrıca organik karbonun yanısıra karbonat ve Mn tarafından da kontrol edildiği gözlemlenmiştir. Cr ve Cd u kontrol eden diğer faktörler su kolonundaki uptake yoluyla chl-a ve bunu takiben sedimantasyondur. Cu ve Hg ise başlıca chl-a tarafından kontrol edilmektedir. Taşıyıcı fazların değişimi üzerine de bazı sonuçlar bulunmuştur. Bu sonuçlar İzmir İç Körfezi yüzey sedimentlerindeki birikimin Pb, Hg, Cd ve Zn tarafından baskın olduğu; Mn, Cu, Cr ve Fe açısından ise daha az etkilendiğini göstermiştir. Jeoakümülasyon indexi sınıflaması genelliklezenginleşme ve kontaminasyon faktörü ile uyumluluk göstermiştir. Jeoakümülasyon indeks değerleri 1994 ten -2008 e doğru Zn, Hg, Cr ve Cd açsından hemen hemen iki kontaminasyon sınıfı

azalma gösterirken; Pb aynı derecede kalıp, Cu ise bir sınıf azalma göstermiştir. Genellikle, Cu, Zn, Pb, Hg ve Cr kontaminasyonları medyan etki aralığı (ERM) değerlerinin altında bulunmuştur. Ağır metal kontaminasyonunun yayılımı ve derecesi tane boyu, organik karbon, karbonat ve klorifil-a gibi sedimentolojik parametrelerle önemli bir şekilde etkilenmektedir.

Anahtar Kelimeler: Ağır metal, Zenginleşme faktörü, Kontaminasyon faktörü, Jeoakümülasyon indeksi, Sediment kalite kılavuzu

136 E.Y. ÖZKAN / Turk. J. Fish. Aquat. Sci. 12: 135-147 (2012)

Introduction

Metals which discharged into near shore areas of

marine environments is partitioned between the

sediment and water column phases. Further

partitioning of metals occurs within the sediment and

water column with different ligands (Luoma, 1983;

Korfali and Davies, 2004). This process of metal

speciation may lead to the self-purification of aquatic environment from metal pollution (Korfali and

Davies, 2004). Because of the metals are likely to be

scavenged by particles and removed to the sediment,

sediments become large repositories of toxic heavy

metals. The distributions, bioavailability and mobility

of heavy metals in marine sediments can change

natural and anthropogenic impact (i.e., parent rock,

weathering, transportation, soil erosion) and may be

greatly different various aquatic ecosystems.

Therefore, heavy metal pollution is one of the largest

threats to marine environment and human health. In

many coastal regions adjacent to industrial and urban areas where metals from both geological and man-

made sources accumulate together, it can be difficult

to determine the proportion of anthropogenic inputs

(Ergin et al., 1993).

Marine sediments provide useful information for

environmental and geochemical research about

marine pollution (Uluturhan, 2009). Therefore,

sediments are ecologically important components of

the marine environment and have been contaminated

by inorganic and organic materials. They are

composite minerals consisting of inorganic components, mineral particulates and organic matter

in various stages of decomposition (Küçüksezgin et

al., 2006).

Development of industrial activities in coastal

zones brought the risk of heavy metal contamination

in marine environment (Esen et al., 2008). Since

industrial revolution, tremendous amounts of the toxic

pollutants have been discarded into coastal

environment and sediments of bays and estuaries have

huge sinks of heavy metals (Fukue et al., 1999;

Turner, 2000; Billon et al., 2002; Fan et al., 2002; Wang et al., 2010).

Several studies have demonstrated that heavy

metal pollution especially in marine environment

increased over the last few decades at global scale;

therefore, the evaluation of metal distribution in

marine sediments is useful to assess the pollution

status in coastal zones.

While general status is as it is described above,

in this study, it could be found the detailed analysis of

the situation in the inner Izmir Bay is now becoming

increasingly polluted with organic and inorganic

contaminant discharged into the Aegean Sea from various anthropogenic sources (Parizanganeh et al.,

2007). The bay has a highly disturbed environment

due to the rapid increase of the population and

development industry (Atgin et al., 2000). Especially

domestic and industrial waste water are the most

important sources of pollution.

As it is known, there are so many studies on

sedimentology and geochemistry of sediments in the

Aegean Sea (Küçüksezgin, 2001; Dalman et al., 2006;

Pekey, 2006; Uluturhan, 2009; Esen et al., 2010).

Each of the scientist have been assessed one or two

accumulation indexes and have been commented

about that indexes results. Also it has been evaluated

the geochemical approach using deviations of organic

carbon normalized heavy metal values in the inner

Izmir Bay. The geochemical approach is an effective strategy for distinguishing anthropogenic from

naturally occuring metal concentrations, paticularly

when it is used with the traditional quantitative

statistical evaluations. The objective of this research

are: (a) elucidate the distribution of a number heavy

metals in the inner Izmir Bay sediment, (b) evaluate

geochemical factors that control the distribution

pattern of the studied heavy metals, (c) investigate

biological effects of heavy metal concentrations in

sediments of inner Izmir Bay.

In order to realize the objectives of this study, 21

core sediment samples were collected and analyzed according to the that criterias: grain size, organic

carbon, carbonate, heavy metal. So, the asseessment

of sediment contamination based on: (a) Enrichment

factor (b) contamination factor and contamination

degree (c) sediment quality guidelines used by US

EPA.

Materials and Methods

Study Area

Izmir Bay is located in the western Aegean Sea

and is one of the great natural bays of the

Mediterranean. It is an important semi-enclosed basin

and has been increasingly polluted with massive loads

of contaminants discharge from various

anthropogenic sources. From the topographic and

hydrographic points of view, the bay is divided into

inner, middle outer regions (Guven and Akinci,

2008). Its' average depth is 15 meter and total area is 500 km2.The exponential growth of Izmir on both

sides of inner Izmir Bay has led to severe pollution.

The quality of water and sediment in the inner Izmir

Bay is seriously affected by pollutants which enter

through drains that bring domestic as well as

industrial effluents and discharge into the river and

also from the sewage system that pumps untreated

effluent into it during its journey through the city.

These industrial and domestic waste waters, besides

other pollutants also contain high concentration of

heavy metals. The main industries in the city of Izmir

include food processing, beverage manufacturing and bottling, tanneries, oil soap and paint production,

chemical industries, paper and pulp factories, textile

industries, metal processing and timber processing

(Küçüksezgin, 2001). Most of the industries in Izmir

are located edge and the catchment basins of the

E.Y. ÖZKAN / Turk. J. Fish. Aquat. Sci. 12: 135-147 (2012) 137

creeks which flow into the inner Bay. So, inner Izmir Bay is consequently one of the most important

sources of heavy metal pollution in the western

Mediterrenean.

Analytical Procedure

The sediment samples were taken from the 21

stations using a gravity corer. 14 samples were

collected from the inner Bay and also 7 sediment

samples were collected creeks (Melez, Manda,

Bayrakli, Bostanlı, Bornova and Balcova) in August 2008.

The stations were selected considering heavy

metal concentrations in sediments of the inner Bay.

Coordinates were determined by Global Positioning

System (GPS). The locations of sampling stations are

shown in Figure 1.

After the cores collection, all of them were

sliced as two cm intervals with the sediment extruding

device. The sediment slices were stored in cleaned

polyethlene bottles with on ice and transferred to the

laboratory. They were frozen at -20 ºC in a deep freeze. The microwave digestion was carried out with

a CEM Model Mars 5. 0,1 g of sediment samples

which were placed in teflon vessels were digested

with a mixture of concentrated HNO3 (3mL), HF

(1mL) and HCl (0,8 mL) for 30 minutes at 200 ºC

using microwave oven (CEM Corp. MARS 5).

Ultrapure water was used throughout the study. All

glassware and other containers were throughly

cleaned with ultrapure water several times prior to

use. The average values of three replicates were

analyzed for each determination. Heavy metal contents of the sediment samples were determined

using metrohm voltammeter model 797 VA

computrace. A voltammetric analyzer (VA 797,

Metrohm, Switzerland) including a voltammetric cell

with a HMDE as a working electrode (WE), a

platinum rod electrode as an auxiliary electrode (AE),

and a Ag/AgCl electrode (3M KCl) as a reference

electrode (RE), was employed for differential pulse

anodic stripping voltammetric analysis. The

voltammetric analyzer was controlled by a personal

computer, using a VA Computrace version 2.797.00X0, SR1 software (8.797.8013, 797 VA

Computrace, Metrohm). All chemicals used were of

analytical reagent grade. Deionized water was used

throughout the experiment. Stock standard solution

(1000 ppm) of heavy metals was purchased from

Merck, Germany. The working standard solutions

were prepared daily by diluting the stock standard

solution of each metal with 0.025 M acetate buffer

(pH 4.6). An oxygen free nitrogen (OFN) gas

(99.9995%) was used for purging the solution to

remove dissolved oxygen. An aliquot of 10 mL acetate buffer (pH 4.6) was placed in a voltammetric

cell and the solution was purged with pure Nitrogen

for 300 second. Then, a fixed potential of -1.15V was

applied to the WE for a period of 90 s, while the

solution was stirred at 2000 rpm (deposition step).

After that the stirring was stopped and equilibrate for

5 s, followed by anodically scanning of the potential

from −1.15 to 0.15 V, employing a square wave

waveform with amplitude of 50 mV, step potential of

30 mV, and frequency of 50 Hz (stripping step). A

Figure 1. Map of Inner Izmir Bay and sampling sites.

138 E.Y. ÖZKAN / Turk. J. Fish. Aquat. Sci. 12: 135-147 (2012)

voltammogram was recorded with a personal

computer. Peak potential and peak current

corresponding to each metal was calculated from the

voltammogram. Amounts of the metal from sample

were reported as μg/L. The metal contents were

quantified by the standard addition method with four

additions for each metal. The values obtained for the

curve slopes were used to calculate the metal

quantities in the sample solution and in the blank.

Detection limits for 0.5 g sediment are: 0.005 ppm for Fe; 0.05 ppm for Al; 0.03 ppm for Mn; 0.02 ppm for

Cu; 0.01 ppm for Hg; 0.02 ppm for Cr; 0.02 ppm for

Cd; 0.01 ppm for Zn and 0.02 ppm for Pb.

Dried samples at 50-60 ºC were analyzed for

carbonate and organic carbon contents. Before the

organic carbon analysis, homogenized sediments were

moistened with distilled water and exposed to

concentrated HCl flumes for 48 hour to remove

carbonates.

The amount of organic matter was measured by

the Walkey-Black methods (Gaudette et al., 1974) which is based on remaining dichromate with back

titration ferrous ammonium sulfate using phenylamine

as an indicator. Total carbonate content was

determined by a gasometric method. This method is

based on the measurements of the partial pressure of

CO2 released by acidification with 10% HCl.

Chlorophyll-a (Chl-a) were analyzed through acetone

extraction and spectrophotometry (Lorenzen 1971).

For grain size analysis, initially the sediment

samples were homogenized with 10% H2O2 to remove

the organic matter. The granulometric composition was investigated by standard sieve and pipette

analysis techniques (Folk, 1954). Textural

classification of the samples were based on the sieves

for four fractions: <0.002mm (clay), 0.002-0.063mm

(silt), 0.063-2mm (sand) and the fraction more than

2mm (gravel) (Shepard, 1954).

Statistical Analysis

The data set has been subjected to correlation

and factor analysis for elucidating the relationships

between heavy metals and geochemical characteristics such as organic carbon (Corg), chloropyll-a (chl.-a),

grain size, carbonate (CO3-2). Different modules of the

statistical software statistica such as Pearson Product

Moment linear correlation method and the Factor

Analysis were used to elucidate the relationships

between heavy metals. The correlation between

coefficient is significant with p-value ˂ 0.05.

Results

The contents of heavy metal in the inner Izmir

Bay sediments from the 21 sites were evaluated.

Analysis showed that the concentrations of metals

were found very high in the inner part of the Bay due

to intensive industrialization such as textile industries,

metal processing, cement factories, iron, paperand

pulp factories, antifouling paints, timber processing.

Also, the heavy metal concentrations in sediments

from the eastern stations are higher than those from

the western stations. It is resonable assume that the

pollution level in this area is much higher in industrial

areas. The heavy metal concentrations in surface

sediments varied from 2,48% to 6,95% for Fe, 1,1%

to 3,98% for Al, 210,1 to 304,7 mg kg-1 for Mn, 31,6

to 81,6 mg kg-1 for Cu, 0,3 to 0,82 mg kg-1 for Hg,

154,9 to 385,4 mg kg-1 for Cr, 0,02 to 0,49 mg kg-1 for Cd, 105,4 to 265,3 mg kg-1 for Zn and 81,2 to 172,8

mg kg-1 for Pb. Especially the maximum heavy metal

concentration were measured at harbour.

Enrichment Factor

Assessment of heavy metal pollution in marine

sediments requires knowledge of pre-industrial metal

concentrations to act as a reference against which

measured values can be compared (Abrahim and

Parker, 2007). So in order to better understand the sediment quality in the inner Bay, levels of metal

pollution were evaluated different techniques for

environmental assessment should be considered. One

of them is “enrichment factor (EF)” which is a

powerful tool to distinguish between anthropogenic

and naturally occuring sources of heavy metals. EF

technique is used in the area of atmospheric aerosols,

sediments, soil and solid wastes to determine the

degree of modification in the composition (Pekey,

2006).

The EF of metal is defined as follows using Aluminium as a reference element.

backgroundAl

x

sampleAl

x

CC

CC

EF

)(

)(

where

sampleAl

x

CC

)( is the ratio of metal and Al

concentrations of the sample and

backgroundAl

x

CC

)( is the ratio of metal and Al

concentrations of background. The background

concentrations of Fe, Mn, Cu, Zn, Pb, Hg, Cr, Cd and Al in the average shale obtained from Turekian and

Wedepohl (1961) are used in this study (Table 1).

Birch (2003) divided contamination into

different categories based on EF values. EF<1

demonstrates “no enrichment”, EF<3 is “minor

enrichment”, EF=3-5 is “moderate enrichment”,

EF=5-10 is “moderately severe enrichment”, EF=10-

25 is “severe enrichment”, EF=25-50 is “very severe

enrichment” and EF50 is “extremely severe enrichment”. In this study, EF values are 2.56 for Fe

(minor enrichment), 0.958 for Mn (no enrichment),

3.324 for Cu (moderate enrichment), 20.372 for Pb

(severe enrichment), 5.854 for Zn (moderately severe

E.Y. ÖZKAN / Turk. J. Fish. Aquat. Sci. 12: 135-147 (2012) 139

enrichment), 9.537 for Cr (moderately severe

enrichment) and 3.821 for Cd (moderate enrichment).

The Ef values of Fe, Mn, Cu, Hg and Cd are

especially less than 5 (moderate enrichment and

minor enrichment), because such small enrichment

may arise from differences in the composition of local soil material.

Elements Zn, Pb and Cr are very heavily

enriched in the inner Izmir Bay. Although the high

enrichment factor is a first indication of a potential

anthropogenic contribution for an element, some

natural sources can also cause for the observed

enrichments (Atgin et al., 2000).

Especially the maximum EF values of heavy

metal were measured at harbor. All antifouling paints

applied to commercial, naval and recreational vessels

in the inner bay contain significant quantities Cu and

lesser quantities of Pb and Hg (Aksu et al., 1998). Also these metals come from the effects of ships

gasoline combustion, catodic protection of ship’s

body (there are some block of Pb on the vessel’s hull),

metal coating and metal smelters industries

(especially Bornova and Melez Creek).

The EF of Pb in the inner parts of the Bay is

quite high because of the automobile traffic. The

automobile exhaust emissions have significantly

accentuated Pb accumulations in the air and soils

(Sutherland, 1999). Also Pb and Zn derive from the

Izmir domestic and industrial sewage. Fly ash constitutes a major pollutant of the coal burning

process and is known to contribute notable quantities

of Cd, Cu, Pb and Zn into the environment (Natusch

et al., 1975; Aksu et al., 1998).

Elevated Cr, Pb and Zn values indicate to some

anthropogenic pollution by the Bostanli, Manda and

Melez Creek discharges. These Creeks for long years

carried the untreated discharges of leather

manufacturers to the inner Bay. But now, the leather

indusrty has moved away and their discharges are

minimized by effective measures. Even so, the Cr

originated from manufacturing for a long years is accumulated in the sediments.

Enrichment for the element Pb ann Zn in the

inner Bay should be identified in order to assess a

possible human influence. Especially, the harbor in

the inner Izmir Bay, where the higher enrichment Pb

and Cu are observed. High Zn and Pb enrichments

come from gasoline combustion from ship and boats.

On the other hand, Pb and Cd are bound to the ferro-

manganese oxides and/or organic matter fraction,

suggesting anthropogenic sources (Karageorgis et al.,

2003). Cr and Zn pigments and compounds are used

in metal plating and probably contributing some

quantities on these metals into the inner Bay

(Küçüksezgin, 2001). Cd and Zn originate primarily from anthropogenic sources, whereas the major part

of the Fe and Al seem to come from natural sources.

The labile Mn should not be attributed to possible

anthropogenic source, because Mn tends to be present

in less thermodinamically stable in sediment phases,

such as Mn+2, easily reducible Mn oxides and Mn

enclosed in carbonate minerals (Angelidis and Aloupi,

2000).

High Hg values may ocur natural and

anthropogenic riverine inputs. The effluent from large

chlor-alkali and chlorine plants probably supply most

of the mercury found in the inner Izmir Bay surface sediments (Aksu et al., 1998).

Contamination Factor

A contamination was described the

contamination of a given toxic substance in a basin by

Hakanson (1980). Contamintion factor (Cf) is ratio of

the concentration of the element in samples to pre-

industrial reference value for the element.

pi

ei

f CC

C

According to Hakanson (1980), Cf has been

classified into four groups: Cf <1 low contamination

factor, 1≤ Cf <3 moderate contamination factor, 3≤ Cf <6 considerable cotamination factor and Cf 6 very high contamination factor. In the calculation of Cf , is

commonly used the average shale values (Turekian

and Wedepohl, 1961) and/or average crustal

abundance (Taylor, 1972). In this study, it was used to the average shale values (Turekian and Wedepohl,

1961) as reference baselines. It was calculated the Cf

values of Mn, Cu, Zn, Pb, Hg, Cr, Cd and Fe using

the raw elemental data. Accordingly, metal levels

existed in order of Pb Cr Zn Cd Hg Cu Mn in the inner Bay (Table 2). The Cf values Cu, Cd,

Cr, Hg and Zn are moderate contamination, Pb and

Mn are low contamination. The maximum Cf value

was found for Pb.

Non-lithogenic metal values were calculated

Table1. Average, min and max metal values of Enrichment factor and geoaccumulation index values

Fe Mn Cu Zn Pb Hg Cr Cd

max 4,711 2,205 11,954 16,049 57,303 15,655 32,701 15,836

EF min 1,305 0,519 1,723 2,499 9,797 1,722 4,277 1,721 average 2,566 0,958 3,324 5,854 20,372 3,994 9,537 3,821 std sapma 0,094 0,046 0,276 0,325 1,38 0,322 0,602 0,301

max -0,038 -0,336 0,712 0,450 0,230 0,820 0,380 1,327 geo min -1,115 -0,872 -0,656 -0,880 -0,860 -0,630 -0,935 -3,977

average 0,431 -0,583 -0,115 -0,130 -0,200 0,002 -0,191 0,147 std sapma -0,820 -2,296 0,910 0,812 3,317 2,734 -0,001 3,011

140 E.Y. ÖZKAN / Turk. J. Fish. Aquat. Sci. 12: 135-147 (2012)

following as:

MNL(%)=Metotal-Me/Al)crustal*Altotal*100 / Metotal

Non-lithogenic Mn values were found as except

stations 1, 11, 14, 16 and E. Negative values explain

metal concentrations of sediment are lower than that of the values come from crustal. Indicating that the

sediment condition of inner Bay have been changed to

reducing condition. Matthiesen (1998) emphasized

that Fe and Mn mobilization in sediment at the

reducing condition Fe+2 rapidly precipitated on the

sediment but reduced and dissolved Mn diffuses

overlying oxic water.

The degree of contamination (Cd) in a

depocentre is defined as the sum of all contaminants

factor various heavy metals (Aksu et al., 1998).

The Cd values therminology is used to: Cd < 8

low degree of contamination, 8 ≤Cd < 24 moderate

degree of contamination, 24 ≤Cd < 48 considerable

degree of contamination and Cd 48 very high degree of contamination. The degree of contamination

values are between the 8-24. All of them is moderate

degree of contamination.

Comparison between the Cd and Cf shows that

the contamination of the surface sediments in the

inner Izmir Bay is dominated Pb, Hg, Cd, Zn and to a

lesser extent Mn, Cu, Cr and Fe. Also, compared with

the literature values reported for the heavy metal in

sediments, the values of heavy metal concentrations lowers than that reported by previous studies.

Acomparision of metal values in sediments have

shown in different localities of Aegean Sea (Table 3).

Cu, Zn, Cr inner Izmir Bay are two times; Pb and Hg

five times; Cd is ten times more and Mn ten times less

than Eastern Aegean Sea. Fe is similar with all

localities.

Geoaccumulation Index

A common approach to estimating the

enrichment of metal concentrations above background

or baseline concentrations is to calculate the

geoaccumulation index (geo) as proposed by Müller,

1969 (Abrahim and Parker, 2007). Sediment geo is the quantitative measure of heavy metal pollution in

aquatic sediments. This index is basically a single

metal approach to quantify metal pollution in

sediments when the concentration of toxic heavy

metal is 1.5 or more times greater than their lithogenic

background values (Gaur et al., 2005).

where Cn is the measured concentration of the

element n and Bn is the geochemical background

value element n in average crust (Wedepohl, 1995).

The factor 1.5 is used to compansate possible

variations which may be attributed to lithologic

variations in the sediment. Geochemical background

values of Fe and Mn were taken from Turekian and

Wedepohl (1961). The others were taken from Aksu

et al., (1998) as: Cu: 17 ppm, Zn: 65 ppm

Pb: 8.5 ppm Hg: 0.005 ppm, Cr: 1.75 ppm Cd: 0.003 ppm Al: 84000 ppm

According to this classification, the inner Izmir

Bay can be categorized unpolluted to strongly

polluted. The geo shows the general tendency proven

Table 2. Contamination factors (Cf) and degree of contamination (Cd) of surface sediments in the inner Bay

Station Cf Cd

Mn Cu Zn Pb Hg Cr Cd Fe

1 0,31 0,72 1,43 4,06 0,75 1,72 0,77 0,63 10,39

2 0,30 1,64 2,20 7,84 2,05 4,28 2,17 1,46 21,93 3 0,34 0,93 2,26 8,64 1,15 4,20 2,63 1,48 21,63

4 0,29 0,86 2,12 7,63 1,08 2,85 1,87 0,53 17,22 5 0,25 0,75 1,33 7,43 0,88 2,50 0,70 0,76 14,59

6 0,30 0,80 1,28 6,91 0,75 2,06 0,60 0,64 13,33 7 0,25 0,70 1,25 6,09 0,95 1,80 0,63 1,11 12,79 8 0,34 0,96 1,11 4,67 0,78 2,19 0,83 0,66 11,54

9 0,28 0,71 2,79 4,41 0,83 2,89 1,53 0,77 14,20 10 0,35 1,03 2,09 4,81 1,28 3,13 0,93 0,68 14,30 11 0,29 1,26 1,79 8,51 1,58 3,63 1,20 0,69 18,94 12 0,36 1,81 1,81 8,47 2,20 3,72 1,63 0,91 20,92 13 0,29 0,97 2,77 7,59 1,03 2,71 1,37 0,78 17,49 14 0,28 0,73 2,72 8,18 0,80 3,27 1,00 0,94 17,92 15 0,30 0,80 1,97 6,27 0,75 2,73 0,73 0,72 14,27 16 0,28 0,77 1,16 5,55 0,78 2,21 0,67 0,73 12,12

A 0,35 1,37 2,11 8,38 1,73 3,52 0,70 0,98 19,15 B 0,35 1,02 2,03 6,37 1,23 3,27 1,53 0,78 16,57 C 0,32 0,72 1,96 6,83 0,98 2,06 1,13 1,06 15,05 D 0,31 0,98 1,36 5,72 0,78 1,92 0,87 0,90 12,82 E 0,30 0,96 1,56 4,77 0,95 1,98 1,13 0,76 12,42 F 0,27 1,49 1,93 4,16 1,83 3,62 1,20 0,68 15,17 G 0,25 1,54 1,81 5,03 1,98 4,01 1,60 0,85 17,07

E.Y. ÖZKAN / Turk. J. Fish. Aquat. Sci. 12: 135-147 (2012) 141

by the EF and Cf (Table 4). In Table 4, EF, Cf and

geo indexes for all metals consistent with each other

except geo values of Cr. In the fact that geo values of Cr are different from the classes of EF and Cf is

expected situation because of the precautions on the

leather tanning plant. Also the values of geo for Zn, Hg, Cr and Cd have decreased two contamination

classes from 1994 to 2008, whereas Pb has remained

the same and Cu has decreased only one class.

Sediment Quality Guidelines

Numerical sediment quality guidelines (SQGs)

have been developed using a variety of approaches,

typically involving statistical comparisons of

chemical concentrations and measures of adverse biological effects upon exposure to sediments (Long

and MacDonald, 1998).This guidline was used

correctly classifying sediments as either toxic or non-

toxic. Two sets of SQGs developed for marine and

estuarine ecosystems (MacDonald et al., 1996; Long

and MacDonald, 1998). One set of SQGs (the effect

range low (ERL)/effect range median (ERM)) was

applied in this study, to assess the ecotoxicological

sense of trace element concentrations in sediments.

Generally Cu, Zn Pb, Hg and Cr contaminations were

below ERM values, whereas only Cd contaminations had below ERL values. Expected adverse biological

effects for all of the stations in Cd were found only

6.6%, in contradiction with geo classification (moderate to strongly polluted), indicating that the

pre-industrial background value is well below the

crustal value. There is a strong accumulation of this

metal but it does not reach to highly toxic levels. In

the inner most part of inner Bay, 95%, 42% toxic

effects will be able to expected for Cr and Hg

respectively. In other stations it maybe uncountered

with the toxic effects greater than 20% (Table 5). Pb

values of all stations correspond to between ERL-

ERM, indicating 35.8% incidence of adverse effects.

47% toxicity of Zn in 15 satations and 29% toxicity of

Cu in 17 stations are expected. Toxicity of Zn

decreased to 6.1% in old Gediz River mouth, Balcova

Creek, northwestern and southwestern stations. In

western stations, toxicity for Cu decreases also 9.4%.

Grain Size, Organic Carbon and Carbonate

The grain size distribution in the study area are

given in Figure 2. Fine grianed sediments with 14-

79% silt (sandy silt and silty sand) ocur in inner Izmir

Bay. The sand content is higher southwest and

northwest in the inner Bay. In the east of the study

area, silt is major companent of the sediment. The

surface sediments of inner bay are composed of from

silty sand to sandy silt with range of grain size.

The carbonate content (CO3-2) varies between

4.07%-8.79% by dry weight. The total carbonate concentrations are generally high in the southwest and

northwest part of he bay. This may be related to

derived from skelatal parts and benthic organisms.

There is no significant correlation between the total

carbonate and grain size fraction (Table 6). On the

other hand high carbonate contents also occur due to

the presence of calcareous lithoclastics and bioclastics

from the terrigenous sources (Ergin et al., 1993) and

riverine input of calcareous rocks.

Total organic carbon (Corg) concentrations of

the surface sediment ranging from 1.98%-6.03% by dry weight are generally higher values in silt sized

Table 3. Average of heavy metal concentrations in sediment from different areas

Regions Fe Mn Cu Zn Pb Hg Cr Cd (%) mg kg-1 mg kg-1 mg kg-1 mg kg-1 mg kg-1 mg kg-1 mg kg-1

This studya 3.41 256.75 45.98 177.03 128.92 0.47 259.43 0.35 Candarli Bb - 798.0 37.5 206.5 76.15 0.815 86.9 - Nemrut Bc 2.82 282.5 26.6 173.0 55.9 4.8 67.25 0.13

Güllük Bd - - 25.0 81.0 20.0 - - 0.56 Eastern Aegean Sea e 2.68 2534.0 27.15 82.85 26.05 0.098 117.4 0.025 Izmit Bayf - - 99.8 850.0 100.9 - 87.0 0.5 Milos Bayg 3.4 1985.0 51.0 325.0 151.0 - 119.0 -

aThis study,

bPazi et al. (2010),

cEsen et al. (2008),

dDalman et al. (2006),

eUluturhan (2009),

fPekey(2006),

gKarageorgis et al. (1998)

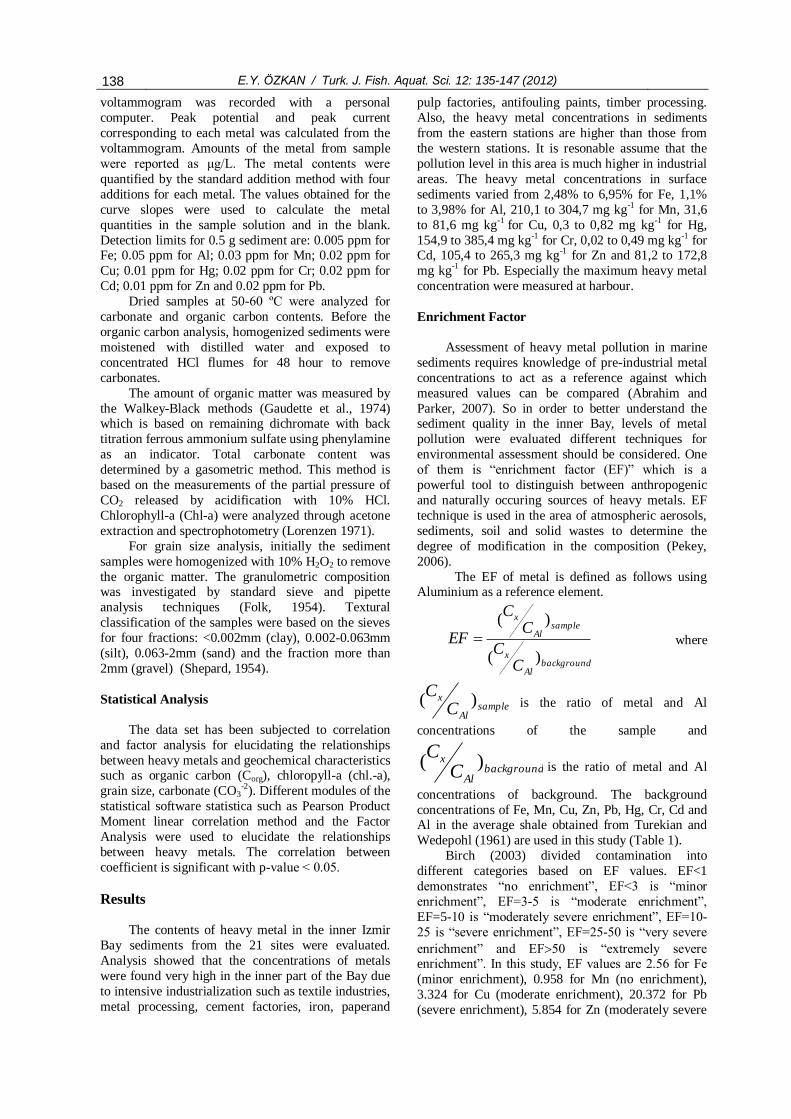
Table 4. Comparison of enrichment factor, contamination factor and geoaccumulation index of metals

Heavy Metals EF Cf Igeo

Mn no enrichment low contamination unpolluted Cu moderate enrichment moderate contamination unpolluted to moderately polluted Zn moderately severe enr. moderate contamination unpolluted to moderately polluted Pb severe enrichment very high contamination strongly polluted Hg moderate enrichment moderate contamination moderate to strongly polluted Cr moderately severe enr. moderate contamination unpolluted Cd moderate enrichment moderate contamination moderate to strongly polluted

Fe minor enrichment low contamination unpolluted

142 E.Y. ÖZKAN / Turk. J. Fish. Aquat. Sci. 12: 135-147 (2012)

feaction. The high values of Corg were observed in

the vicinity of stations (1, 10, 11, F and G). Relatively

high Corg percentage in the inner bay may indicate

the effect of terrestrial and anthropogenic inputs in

addition to the relative proximity of creeks. The low Corg contents reflect variations in degree of dilution

by the coarse grained biogenic components. The

relatively high concentrations of Corg at stations 1, 2,

3, 9, 10, 11, 12, 13, A, B, F and G reflect high organic

matter flux to sediments due to the eutrophication.

The correlation of Corg against sand (%) was

inversely correlated, because most of the stations

contain low level clay component. From Pearson

product correlation between each pair of variables

(Corg, CO3-2, sand, silt, clay), the relationships of

Corg/silt, Corg/sand exhibit statistically significant non-zero correlations at 95% confidence level. R2

statistic indicates that linear model for Corg/silt

(Figure 3) explains 76% of the variability in Corg.

Sand content of sediment increases toward southwest

and northwest stations whereas metal contents and

toxicity decrease.

Al/OC, Fe/OC, Mn/OC, Cu/OC, Zn/OC, Pb/OC,

Hg/OC, Cr/OC and Cd/OC ratios in Inner Izmir Bay

sediments vary inversely with OC concentrations.

Figure 4 indicating the differential addition of freshly

produced organic carbon. Changing of natural

organic matter (NOM) can also affect trace metal partitioning. Ships traffic may also causes

resuspention of sediments because of the maximum

15 meters of depth as encountered in Galveston Bay

(Wen et al., 2008)

Me (metal) to Al ratios exhibit inverse linear

relationships (Figure 5), likely due to particle

fractionation processes such as differential

sedimentation, resuspension and flocculation,

allowing fine suspended matter to become enriched in

secondary carrier phases such as organic matter or Fe, Mn oxyhydroxides. Wen et al., (2008) reported that in

Galveston Bay water column, decrease in Fe/Al ratios

of particulate matter was consistent with a coupling of

sediment resuspension by wind and wave action, with

Fe diagenesis in sediments.

The regressions of Me/Al ratios vs. Al contents

of sediments have negative slopes, indicating main

sources of metals not pertaning to crustal material

and/or adsorbing of freshly formed organic matter as

carriers of trace metals via resuspension of sediments

by winds, waves, turbulence of ships traffic. Therefore a dilution effect due to the Al comes out.

Another possibility is the reducing conditions in

sediment in relation to decreasing sediment

permeability (clay fraction) and organic carbon

accumulation as seen in Mn mobilization.

Factor Analysis

A R- factor analysis was performed. On raw

geochemical data in an attempt to further clarify the

major controling factors that determine the

distribution of heavy metals in the sediment. Four of the factors which account for most of the variability in

the 12 variables was obtained. 4 factors have been

extracted, since 4 factors had eigenvalues greater than

or equal to 1. Together they account for 79,467% of

the variability in the original data (Table 7).

Table 5. ERM and ERL guideline values for trace elementsa,b

Cu Zn Pb Hg Cr Cd

1 73,6 208,6 156,8 0,8 385,4 0,7

2 41,8 214,8 172,8 0,5 378,4 0,8 3 38,7 201,6 152,5 0,4 256,9 0,6 4 33,6 126,4 148,6 0,4 225,3 0,2 5 35,8 121,7 138,2 0,3 185,2 0,2 6 31,6 118,6 121,7 0,4 162,4 0,2 7 43,2 105,4 93,4 0,3 197,5 0,3 8 31,9 265,3 88,1 0,3 259,7 0,5 9 46,3 198,5 96,2 0,5 281,8 0,3

10 56,7 169,7 170,2 0,6 326,4 0,4 11 81,6 172,3 169,4 0,9 335,2 0,5 12 43,7 263,1 151,7 0,4 243,6 0,4 13 32,8 258,6 163,5 0,3 294,3 0,3 14 35,9 187,1 125,3 0,3 245,7 0,2 15 34,7 109,8 110,9 0,3 198,7 0,2 16 32,2 136,2 81,2 0,3 154,9 0 A 61,8 200,9 167,5 0,7 317,2 0,2

B 45,9 193,2 127,3 0,5 294,1 0,5 C 32,4 186,4 136,5 0,4 185,4 0,3 D 43,9 129,3 114,3 0,3 173,2 0,3 E 43,2 148,6 95,4 0,4 178,6 0,3 F 66,9 183,5 83,1 0,7 325,7 0,4 G 69,3 172,1 100,6 0,8 361,3 0,5 ERLa 34 150 46,7 0,15 81 1,2 ERMa 270 410 218 0,71 370 9,6 aLong et al., (1995,

bConcentrations are in mg kg

-1

E.Y. ÖZKAN / Turk. J. Fish. Aquat. Sci. 12: 135-147 (2012) 143

The type of factoring have been selected as

principal components. Metal loadings of the factors

have been given in Table 8.

Factor1 accounts for 35,457% of the variability in the original data. The first group of variables can be

described as an anthropogenic assemblage composed

of mainly Zn, Pb, Cr, Cd and Corg . This factor reflects

the binding of heavy metals to organic matter.

Factor 2 accounts for 21,974% of the variability

in the original data. The second group of

anthropogenic variables composed of mainly Cu Hg,

Cr, Cd to some extent Fe with stations 1, 10, 11 are

the main pollution sources for Cu Hg and Cr. Only the

sediments of Melez and Bornova creeks contain lower

levels of Cd. Also harbour (station 10) contain the

effects of ship traffic and antifouling paints Cr and Cd have higher values in stations 2, 3, 8 and the sediment

of Bayraklı creek. Cu with Hg and Cr with Cd can be

discriminated as seen three dimensional factor

loadings in Figure 6. The major carrier phase is likely

ferric oxyhydroxides and to some extent organic

matter for this anthropogenic assemblage.

Factor 3 accounts for 13.099% of the variability

in the original data and explains metal sorbtion pools:

carbonates, alumino silicates (clay minerals), ferric

oxyhidroxides and algal biomass. The first two of

them result from terrestrial sources. Both of them are conservative components and they lose some trace

metal contents via resuspension by the winds, wave

effects and ship traffic’s turbulence. Iron

accumulation in sediment surface derives from the

oxidation and sedimentation of dissolved species,

atmospheric dust, terrestrial sources and mobilization

of reduced iron from deeper sediment layers

(including past times) to surface of sediment. The last

pool stems from eutrophication.

Factor 4 accounts for 8.936% of the variability

in the original data and is composed of mainly Mn, Pb

and Fe. This factor includes the effects of harbor

traffic, shipyard, catodic protection of ship’s body (there are some block of Pb on the vessel’s hull) and

metal coating and metal smelters industries

(especially in Bornova creek and Melez creek).

Conclusions

The results illustrated that Zn, Pb, Cr, Cd are

mainly controlled by organic matter and to some

extent ferric oxyhydroxides. The second anthropogenic assemblage Cu, Hg, Cr, Cd mainly

controlled by Chl.-a and organic matter. Metal

sorbtion pools also distinguished as carbonate,

aluminosilicates, ferric oxyhydroxides and algal

biomass. Mn, Fe and lesser carbonate seem to extent

some control on the Pb.

Comparison of heavy metal concentrations with

different localities in Aegean Sea emphasized that Cu,

Zn, Cr are two times, Pb, Hg five times, Cd ten times

more and Mn ten times less than Eastern Aegean Sea.

Fe is similar with all localities.

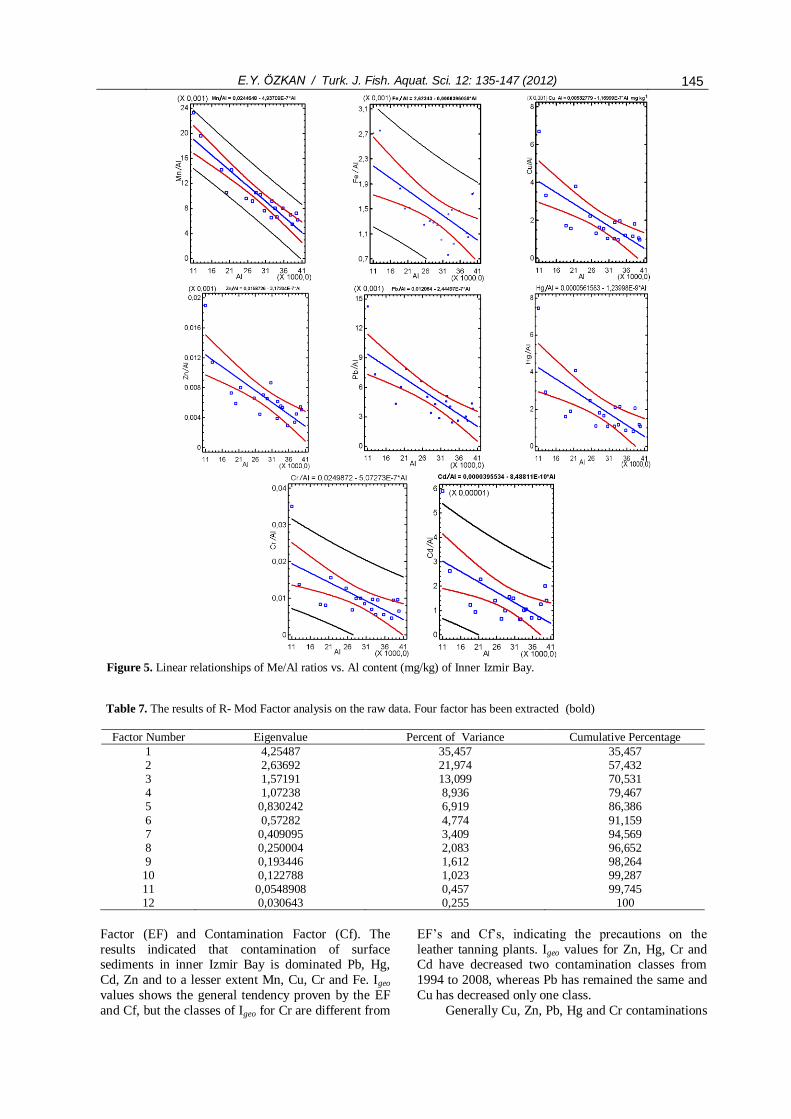
An established way to dedect anthropogenic contamination and to become comparable of different

sediment samples is by normalization of contaminant

concentrations to Al and/or organic carbon. Me/Al

and Me/Corg ratios did not constant among stations

and decreased with increasing Al and Corg values,

indicating changing of carrier phases via resuspension

by wind, wave, ships traffic and freshly formed

autochthonous organic matter by eutrophication.

The contamination status by heavy metals was

assessed based on comparison with Sediment Quality

Guidelines, geoaccumulation index, Enrichment

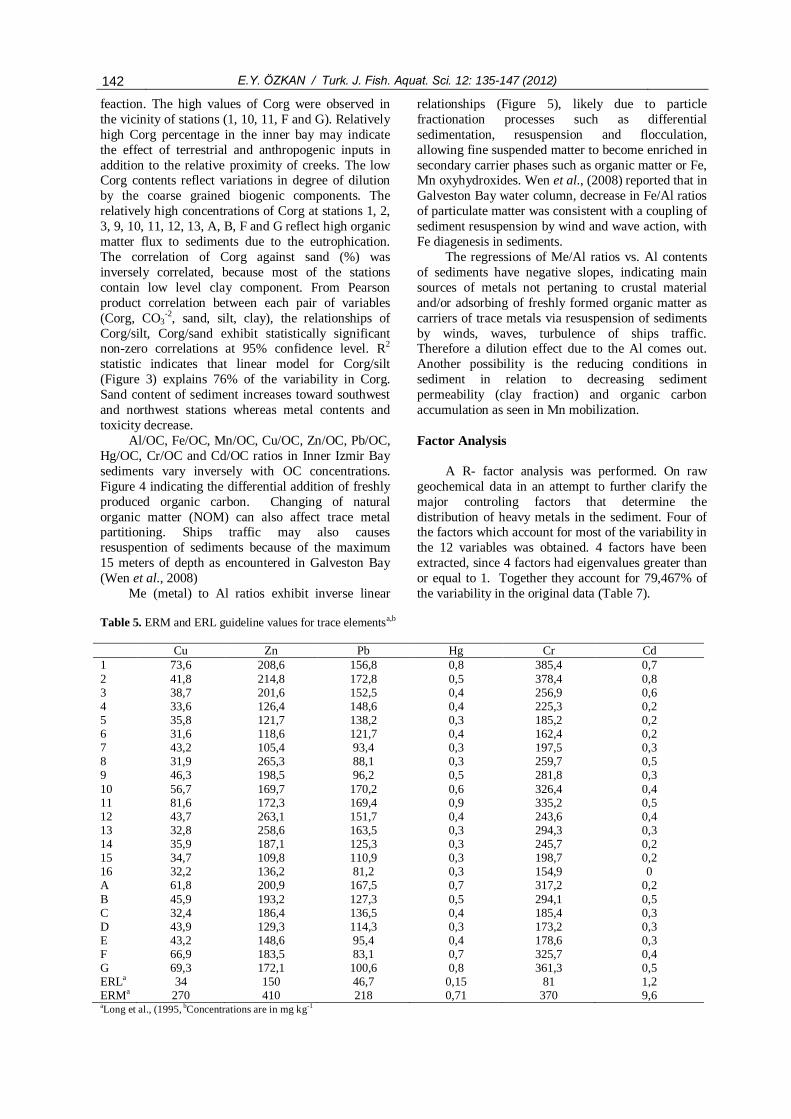
Figure 2. Grain size distribution and sediment type of Inner Izmir Bay. Table 6. Pearson’s product moment correlations between each pair of variables (Corg, CO3

-2, sand, silt, clay)

Corg (%) CO3-2 (%) sand(%) silt(%) clay(%)

0.0139 -0.8863 0.8726 0.1977 CO3

-2 (%) 0.1064 -0.1276 0.0774 sand(%) -0.9761 -0.2604 silt(%) 0.0443 clay(%)

144 E.Y. ÖZKAN / Turk. J. Fish. Aquat. Sci. 12: 135-147 (2012)

Figure 3. Statistically significant linear regression of Corg vs. silt content (P<0.05). Corg (%) = 0.057 [ silt ] + 1.085

0,00

0,20

0,40

0,60

0,80

1,00

1,20

1,40

1,60

1,80

2,00

0 2 4 6 8

Corg

Al/orgC

0,00

0,50

1,00

1,50

2,00

2,50

3,00

3,50

0 2 4 6 8

Corg

Fe/orgC

0,00

20,00

40,00

60,00

80,00

100,00

120,00

140,00

160,00

0 2 4 6 8

Corg

Mn/orgC

0,00

5,00

10,00

15,00

20,00

25,00

0 2 4 6 8

Corg

Cu/orgC

0,00

10,00

20,00

30,00

40,00

50,00

60,00

70,00

80,00

90,00

100,00

0 2 4 6 8

Corg

Zn/orgC

0,00

10,00

20,00

30,00

40,00

50,00

60,00

70,00

80,00

0 2 4 6 8

Corg

Pb/orgC

0,00

0,02

0,04

0,06

0,08

0,10

0,12

0,14

0,16

0,18

0,20

0 2 4 6 8

Corg

Hg/orgC

0,00

20,00

40,00

60,00

80,00

100,00

120,00

0 2 4 6 8

Corg

Cr/orgC

0,00

0,05

0,10

0,15

0,20

0,25

0 2 4 6 8

Corg

Cd/orgC

Figure 4. Scatter plot of Metal/Corg ratios against Corg.

E.Y. ÖZKAN / Turk. J. Fish. Aquat. Sci. 12: 135-147 (2012) 145

Factor (EF) and Contamination Factor (Cf). The

results indicated that contamination of surface sediments in inner Izmir Bay is dominated Pb, Hg,

Cd, Zn and to a lesser extent Mn, Cu, Cr and Fe. Igeo

values shows the general tendency proven by the EF

and Cf, but the classes of Igeo for Cr are different from

EF’s and Cf’s, indicating the precautions on the

leather tanning plants. Igeo values for Zn, Hg, Cr and Cd have decreased two contamination classes from

1994 to 2008, whereas Pb has remained the same and

Cu has decreased only one class.

Generally Cu, Zn, Pb, Hg and Cr contaminations

Figure 5. Linear relationships of Me/Al ratios vs. Al content (mg/kg) of Inner Izmir Bay. Table 7. The results of R- Mod Factor analysis on the raw data. Four factor has been extracted (bold)

Factor Number Eigenvalue Percent of Variance Cumulative Percentage

1 4,25487 35,457 35,457 2 2,63692 21,974 57,432 3 1,57191 13,099 70,531 4 1,07238 8,936 79,467 5 0,830242 6,919 86,386

6 0,57282 4,774 91,159 7 0,409095 3,409 94,569 8 0,250004 2,083 96,652 9 0,193446 1,612 98,264 10 0,122788 1,023 99,287 11 0,0548908 0,457 99,745 12 0,030643 0,255 100

146 E.Y. ÖZKAN / Turk. J. Fish. Aquat. Sci. 12: 135-147 (2012)

were below ERM values, whereas only Cd

contaminations had below ERL values indicating that the preindustrial background value in Izmir Bay

sediments is well below the crustal value. There is a

strong accumulation of this metal but it does not reach

to highly toxic levels.

Acknowledgements

I would like to thanks Prof. Dr. H. Baha

Buyukisik for his help in statistical analysis.

References Abrahim, G.M.S. and Parker, R.J. 2008. Assessment of

heavy metal enrihment factors and degree of contamination in marine sediments from Tamaki

Estuary, Auckland, New Zealand. Environmental Monitoring and Assessment, 136: 227-238. doi: 10.1007/s10661-007-9678-2

Aksu, A.E., Yaşar, D. and Uslu, O. 1998. Assessment of marine pollution in Izmir Bay: Heavy metal and organic compound concentrations in surficial sediments. Translations and Journal of Engineering and Environmental Science, 22:387-415.

Angelidis, M.O. and Aloupi, M. 2000. Geochemical study of coastal sediments influenced by river –transported pollution: Southern Evoikos Gulf, Greece. Marine Pollution Bulletin, 40(1): 77-82. doi: 10.1016/S0025-326X(99)00174-5

Atgin, R.S., El-Agha, O., Zararsız, A., Kocataş, A., Parlak,

H. and Tuncel, G. 2000. Investigation of the sediment pollution in Izmir Bay: trace elements. Spectrochimica Acta Part B, 55: 1151-1164. doi: 10.1016/S0584-8547(00)00231-7

Billon, G., Ouddane, B., Recourt, P. and Boughriet A. 2002. Depth variability and some geochemical characteristics of Fe, Mn, ca, Mg, Sr, P, Cd and Zn in anoxic sediments from Authie Bay. Estuarine Coastal

and Shelf Science, 22: 805-815. Birch, G., ed. C.D.a. Woodroffe, F. 2003. Coastal GIS

2003, Wollongong University Papers in Center of Maritime Policy, 14, Australia, Edition edn.

Dalman, O., Demirak, A. and Balci, A. 2006. Determination of heavy metals (Cd, Pb) and trace elements (Cu, Zn) in sediments and fish of the Southeastern Aegean Sea (Turkey) by atomic adsorption spectrometry. Food

Chemistry, 95: 157-162. doi: 10.1016/j.foodchem.2005.02.009 Ergin, M., Bodur, M.N., Ediger, V., Yemenicioğlu, S., Okyar, M. and Kubilay, N.N. 1993. Sources and dispersal of heavy metals in surface sediments along the Eastern Aegean Shelf. Boletino Di Oceanologia Teorica Applicata, 11(1): 27-43.

Esen, E., Küçüksezgin, F. and Uluturhan, E. 2010. Assessment of trace metal pollution in surface sediments of Nemrut Bay, Aegean Sea. Environmental Monitoring and Assessment, 160: 257-266.doi: 10.1007/s10661-008-0692-9

Fan, W.H., Wang, W.X. and Chen J.S. 2002. Geochemistry of Cd, Cr and Zn in highly contaminated sediments and its influences on assimilation by marine bivalves.

Environmental Science and Technology, 36: 5164-

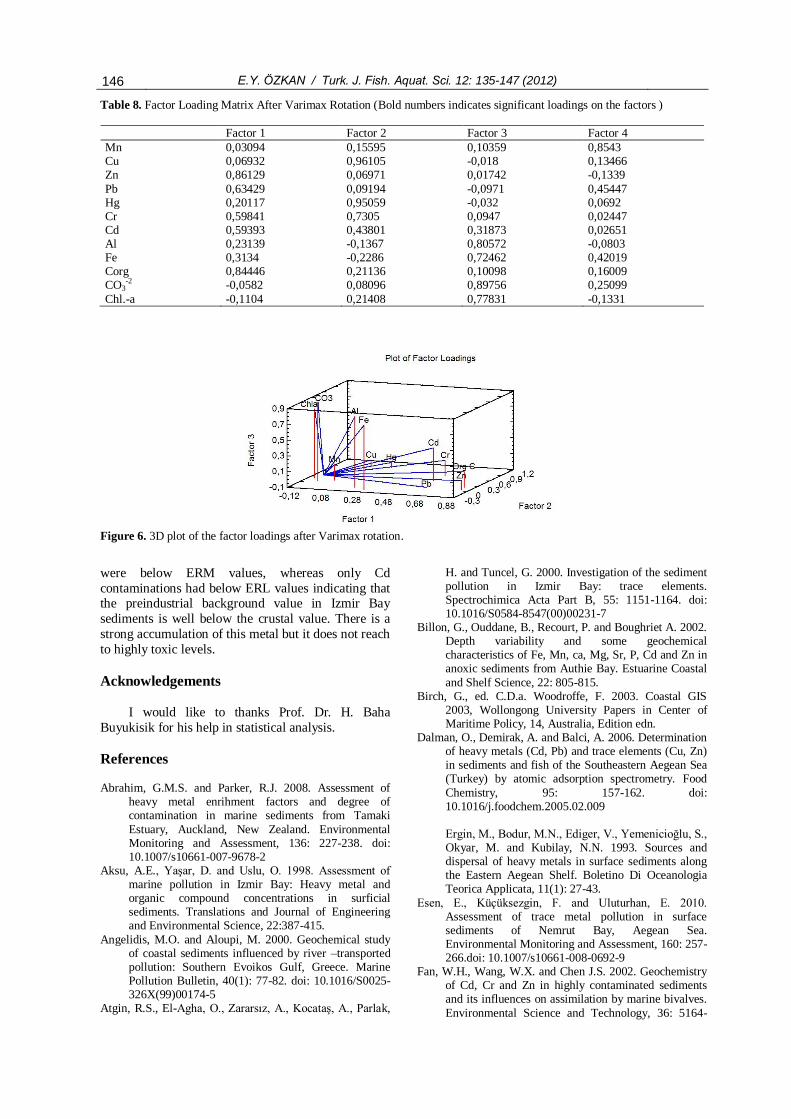
Table 8. Factor Loading Matrix After Varimax Rotation (Bold numbers indicates significant loadings on the factors )

Factor 1 Factor 2 Factor 3 Factor 4

Mn 0,03094 0,15595 0,10359 0,8543 Cu 0,06932 0,96105 -0,018 0,13466 Zn 0,86129 0,06971 0,01742 -0,1339

Pb 0,63429 0,09194 -0,0971 0,45447 Hg 0,20117 0,95059 -0,032 0,0692 Cr 0,59841 0,7305 0,0947 0,02447 Cd 0,59393 0,43801 0,31873 0,02651 Al 0,23139 -0,1367 0,80572 -0,0803 Fe 0,3134 -0,2286 0,72462 0,42019 Corg 0,84446 0,21136 0,10098 0,16009 CO3

-2 -0,0582 0,08096 0,89756 0,25099

Chl.-a -0,1104 0,21408 0,77831 -0,1331

Figure 6. 3D plot of the factor loadings after Varimax rotation.

E.Y. ÖZKAN / Turk. J. Fish. Aquat. Sci. 12: 135-147 (2012) 147

5171. doi: 10.1021/es020122m Folk, R.L. 1974. Petrology of Sedimentary Rocks. Hemphill

pres, Texas, 182 pp. Fukue, M., Nakamura T., Kato, Y. and Yamasaki S. 1999.

Degree of pollution for marine sediments. Engineering Geology, 53: 131-137. doi:

10.1016/S0013-7952(99)00026-5 Gaudette, H.E., Fligh, W.R., Tonner, L. and Folger, D.W.

1974. An inexpensive titration method for the determination of organic carbon in recent sediments. Jornal of sedimentary petrology, 44: 249-253.

Gaur, V.K., Sanjay, K.G., Pandey, S.D., Gopal, K. and Mısra, V. 2005. Distribution of heavy metals in sediment and water of River Gomti. Environmental

Monitoring and Assessment, 102: 419-433. doi: 10.1007/s10661-005-6395-6

Güven, D. and Akıncı, G. 2008. Heavy metals partitioning in the sediments of Izmir inner Bay. Journal of Environmental Sciences, 20: 413-418. doi: 10.1016/S1001-0742(08)62072-0

Hakanson, L. 1980. Ecological risk index for aquatic pollution control, a sedimetological approach. Water

Research, 14: 975-1001. doi: 10.1016/0043-1354(80)90143-8

Karageorgis, A.P., Nikolaidis, N.P., Karamanos, H. and Skoulikidis, N. 2003. Water and sediment quality assessment of the Axios River and its coastal environment. Continental Shelf Research, 23: 1929-1944. doi: 10.1016/j.csr.2003.06.009

Korfali, S.I. and Davies, B.E. 2004. Speciation of metals in

sediment and water in a river underline by limestone: role of carbonate species for purification capacity of rivers. Advances in Environmental Research, 8: 599-612. doi: 10.1016/S1093-0191(03)00033-9

Küçüksezgin, F. 2001. Distribution of heavy metals in the surficial sediments of Izmir Bay (Turkey). Toxicological and Environmental Chemistry, 80: 203-207. doi: 10.1080/02772240109359010

Küçüksezgin, F., Kontaş, A.,Altay, O. Uluturhan, E. and

Darılmaz, E. 2006. Assessment of marine pollution in Izmir Bay: Nutrient, heavy metal and total hydrocarbon concentrations. Environment International, 32: 41-51. doi: 10.1016/j.envint.2005.04.007

Long, E.R. and MacDonald, D.D. 1998. Recomended uses of emprically derived, sediment quality guidelines for marine and estuarine ecosystems. Human and

Ecological Risk Assessment, 4 (5): 1019-1039 doi: 10.1080/10807039891284956

Lorenzen, C. J. 1971. Chlorophyll-degradation products in sediments of Black Sea. Woods Hole Oceanographic Institution Contribution No. 2828: 426-428.

Luoma, S.N. 1983. Bioavailability of trace metals to aquatic organism – a review. Sci. Total Environ., 28: 1-22. doi: 10.1016/S0048-9697(83)80004-7

MacDonald, D.D., Car, R.S., Calder, F.D., Long, E.R. and Ingersoll C.R. 1996. Development and evaluation of sediment quality guidelines for Florida coastal waters. Ecotoxicology, 5: 253-278. doi: 10.1007/BF00118995

Matthiesen, H. 1998. Phosphate release from marine sediments: by diffusion, advection and resuspension. Ph.D. Thesis, Department of Chemistry University of Aarhus, Denmark, 131pp.

Müller, G. 1969. Index of geoaccumulation in the sediments of the Rhine River. Geojournal, 2: 108-118.

Natusch, D.F.S., Bauer, C.F., Matusiewicz, H., Evans, C.A., Baker J., Loh, A., Linton, R.W. and Hopke, P.K. 1975. Characterization of trace elements in fly ash. International conference on Heavy Metals in the Environment, Symposium Proceedings, October 27-31, Ontario, Canada, vol. 2. Part 2, 553-575pp.

Uluturhan, E. 2009. Heavy metal concentrations in surface sediments from two regions (Saros and Gökova Gulfs)

of the Eastern Aegean Sea. Environ Monit Assess, 165:675-684.doi: 10.1007/s10661-009-0978-6

Parizanganeh, A., Lokhan, V.C. and Jalalian, H. 2007. A geochemical and statistical approach for assessing heavy metal pollution in sediments from the southern Caspian coast. International Journal of Environmental Science Technique, 4(3): 351-358.

Pekey, H. 2006. The distribution and sources of heavy

metals in İzmit Bay surface sediments affected by a polluted stream. Marine Pollution Bulletin, 52: 1197-1208. doi: 10.1016/j.marpolbul.2006.02.012

Shepard, F.P. 1954. Nomenclature based on sand-silt-clay ratios. Journal of Sedimentary Petrology, 24: 151-15.

Sutherland, R.A. 1999. Bed sediment-associated trace metals in an urban stream, Oahu, Hawaii.

Environmental Geology, 39(6): 615-627. Taylor, S. R. 1972. Abundance of chemical elements in the

continental crust: A new table. Geochimica et Cosmochimica Acta, 28: 1273-1286. doi: 10.1016/0016-7037(64)90129-2

Turekian, K.K. and Wedepohl, D.H. 1961. Distribution of the elements in some major units of the earth’s crust. Bulletin Geological Society of America, 72: 175-192. doi: 10.1130/0016-

7606(1961)72[175:DOTEIS]2.0.CO;2 Turner, A. 2000. Trace metal contamination in sediment

from U.K. estuaries: An empricial evaluation of the role of hydrous iron and manganese oxides. Estuarine, Coastal and Shelf Science, 50: 355-371. doi: 10.1006/ecss.1999.0573

Wang, S., Jia, Y., Wang, S., Wang, X., Wang, H., Zhao, Z. and Liu, B. 2010. Fractionation of heavy metals in

shallow marine sediments from Jinzhou Bay, China. Journal of Environmental Sciences, 22: 23-31. doi: 10.1016/S1001-0742(09)60070-X

Wedepohl, K. 1995. The composition of the continental crust. Geochimica et Cosmocheimica Acta, 59: 1217-1232. doi: 10.1016/0016-7037(95)00038-2

Wen, L.S., Warnken, K.W. and Santschi, P.H. 2008. The role of organic carbon, iron, and aluminium

oxyhydroxides as trace metal carriers: Comparison between the Trinity river and Trinity river estuary (Galveston Bay, Texas). Marine Chemistry 112:20-

37. doi: 10.1016/j.marchem.2008.06.003


Recommended