Abstract—The Standard Penetration Test (SPT) is the most common in situ test for soil investigations. On the other hand, the Cone Penetration Test (CPT) is considered one of the best investigation tools. Due to the fast and accurate results that can be obtained it complaints the SPT in many applications like field explorations, design parameters, and quality control assessments. Many soil index and engineering properties have been correlated to both of SPT and CPT. Various foundation design methods were developed based on the outcome of these tests. Therefore it is vital to correlate these tests to each other so that either one of the tests can be used in the absence of the other, especially for preliminary evaluation and design purposes. The primary purpose of this study was to investigate the relationships between the SPT and CPT for different type of sandy soils in Florida. Data for this research were collected from number of projects sponsored by the Florida Department of Transportation (FDOT), six sites served as the subject of SPT-CPT correlations. The correlations were established between the cone resistance (q c ), sleeve friction (f s ) and the uncorrected SPT blow counts (N) for various soils. A positive linear relationship was found between q c , f s and N for various sandy soils. In general, qc versus N showed higher correlation coefficients than f s versus N. qc/N ratios were developed for different soil types and compared to literature values, the results of this research revealed higher ratios than literature values. Keywords—In situ tests, Correlation, SPT, CPT. I. INTRODUCTION OIL is naturally heterogeneous and discontinuous material that is composed of various degraded minerals and organic matter. Soil is deposited by several natural actions such as mechanical and chemical weathering on different kinds of rocks. These actions produce various sedimentation patterns and formations. Soil is composed of different solid minerals of finite gradations, gases and water that give different behaviors when subjected to vertical or horizontal forces. The soil in central Florida, for instance, is varying in types and stratigraphy. Therefore, it is a difficult task for engineers to generalize a soil profile that can be developed and used in foundation design. In situ soil investigations give readily, relatively economic, and reliable results that can aid engineer’s decisions and judgments on the subsurface features and their choice of foundation type. The variability of in situ Fauzi Jarushi is with the Civil Engineering Department, Tripoli University, Tripoli, Libya (phone: +218917630068; e-mail: [email protected]). S. AlKaabim is with Amerapex Corporation, Iraq (e-mail: [email protected]). Paul Cosentino is with the Civil Engineering Department, Florida Institute of Technology, Florida, USA (phone: +1321674-7555, fax: 321-6747565, e- mail: [email protected]). test equipment, procedures, and design guidelines associated with each test sparks the approach of correlation. Many in situ tests’ parameters have been correlated to many of soil engineering properties by means of indirect measurements. Furthermore, these in situ tests have also been correlated to other tests in order to use them for primary evaluation or initial design purposes. Numerous geotechnical researchers have presented relationships between the two most common used in situ soil investigation tests, the SPT and the CPT. These relationships help engineers in adopting empirical methods to evaluate and analyze soil performance by converting the available database of either one of the two tests into the other test’s parameter(s). A significant amount of published literature suggests linear statistical correlations between the two tests variables: N blow count of the SPT, and cone tip resistance (q c ) of the CPT. II. DATA SELECTION The chosen data was obtained from soil investigations for FDOT major roadwork projects. The closest available testing locations were chosen to establish the SPT – CPT correlations for each site. Locations of these sites are superimposed on Florida map as shown in Fig. 1. Three variables are representative of the data used in this research: SPT N (blows/0.3m), CPT tip resistance q c (MPa) and sleeve resistance f s (kPa). The data also included SPT boring log. Each boring log contained a soil profile with soil type classifications according to the Unified Soil Classification System (USCS); these classifications were based on laboratory tests (i.e., sieve analysis, Atterberg limits). III. HISTORY OF SPT – CPT CORRELATIONS Many researchers have pointed out the importance of SPT - CPT correlations, [13] show that there is a need for reliable CPT/SPT correlations so that CPT data can be used in existing SPT-based design approaches. Kulhawy and Mayne ] 8 [ emphasize on the advantages of having a procedure to interrelate N and qc. These tests represent the most common in situ soil testing used worldwide and both of them representing soil resistance to penetration (although the SPT is dynamic and the CPT is quasi-static). Back in the late 1950s and early 1960s, several researchers like [11], [12] suggested constant values of qc/N for different soil types. A number of researchers proposed that the qc/N ratio is a function of the mean grain size (D50) of the soil. They concluded that the smaller the qc/N ratio, the finer grained the soil. The proposed classification chart by [14] was recommended to estimate the mean particle size. Clearly, the Fauzi Jarushi, S. AlKaabim, Paul Cosentino A New Correlation between SPT and CPT for Various Soils S World Academy of Science, Engineering and Technology International Journal of Environmental, Chemical, Ecological, Geological and Geophysical Engineering Vol:9, No:2, 2015 101 International Scholarly and Scientific Research & Innovation 9(2) 2015 scholar.waset.org/1999.6/10000578 International Science Index, Geological and Environmental Engineering Vol:9, No:2, 2015 waset.org/Publication/10000578
Transcript
Abstract—The Standard Penetration Test (SPT) is the most
common in situ test for soil investigations. On the other hand, the Cone Penetration Test (CPT) is considered one of the best investigation tools. Due to the fast and accurate results that can be obtained it complaints the SPT in many applications like field explorations, design parameters, and quality control assessments. Many soil index and engineering properties have been correlated to both of SPT and CPT. Various foundation design methods were developed based on the outcome of these tests. Therefore it is vital to correlate these tests to each other so that either one of the tests can be used in the absence of the other, especially for preliminary evaluation and design purposes.
The primary purpose of this study was to investigate the relationships between the SPT and CPT for different type of sandy soils in Florida. Data for this research were collected from number of projects sponsored by the Florida Department of Transportation (FDOT), six sites served as the subject of SPT-CPT correlations. The correlations were established between the cone resistance (qc), sleeve friction (fs) and the uncorrected SPT blow counts (N) for various soils.
A positive linear relationship was found between qc, fs and N for various sandy soils. In general, qc versus N showed higher correlation coefficients than fs versus N. qc/N ratios were developed for different soil types and compared to literature values, the results of this research revealed higher ratios than literature values.
Keywords—In situ tests, Correlation, SPT, CPT.
I. INTRODUCTION
OIL is naturally heterogeneous and discontinuous material that is composed of various degraded minerals and organic
matter. Soil is deposited by several natural actions such as mechanical and chemical weathering on different kinds of rocks. These actions produce various sedimentation patterns and formations. Soil is composed of different solid minerals of finite gradations, gases and water that give different behaviors when subjected to vertical or horizontal forces.
The soil in central Florida, for instance, is varying in types and stratigraphy. Therefore, it is a difficult task for engineers to generalize a soil profile that can be developed and used in foundation design. In situ soil investigations give readily, relatively economic, and reliable results that can aid engineer’s decisions and judgments on the subsurface features and their choice of foundation type. The variability of in situ
Fauzi Jarushi is with the Civil Engineering Department, Tripoli University,
Tripoli, Libya (phone: +218917630068; e-mail: [email protected]). S. AlKaabim is with Amerapex Corporation, Iraq (e-mail:
[email protected]). Paul Cosentino is with the Civil Engineering Department, Florida Institute
of Technology, Florida, USA (phone: +1321674-7555, fax: 321-6747565, e-mail: [email protected]).
test equipment, procedures, and design guidelines associated with each test sparks the approach of correlation. Many in situ tests’ parameters have been correlated to many of soil engineering properties by means of indirect measurements. Furthermore, these in situ tests have also been correlated to other tests in order to use them for primary evaluation or initial design purposes.
Numerous geotechnical researchers have presented relationships between the two most common used in situ soil investigation tests, the SPT and the CPT. These relationships help engineers in adopting empirical methods to evaluate and analyze soil performance by converting the available database of either one of the two tests into the other test’s parameter(s). A significant amount of published literature suggests linear statistical correlations between the two tests variables: N blow count of the SPT, and cone tip resistance (qc) of the CPT.
II. DATA SELECTION
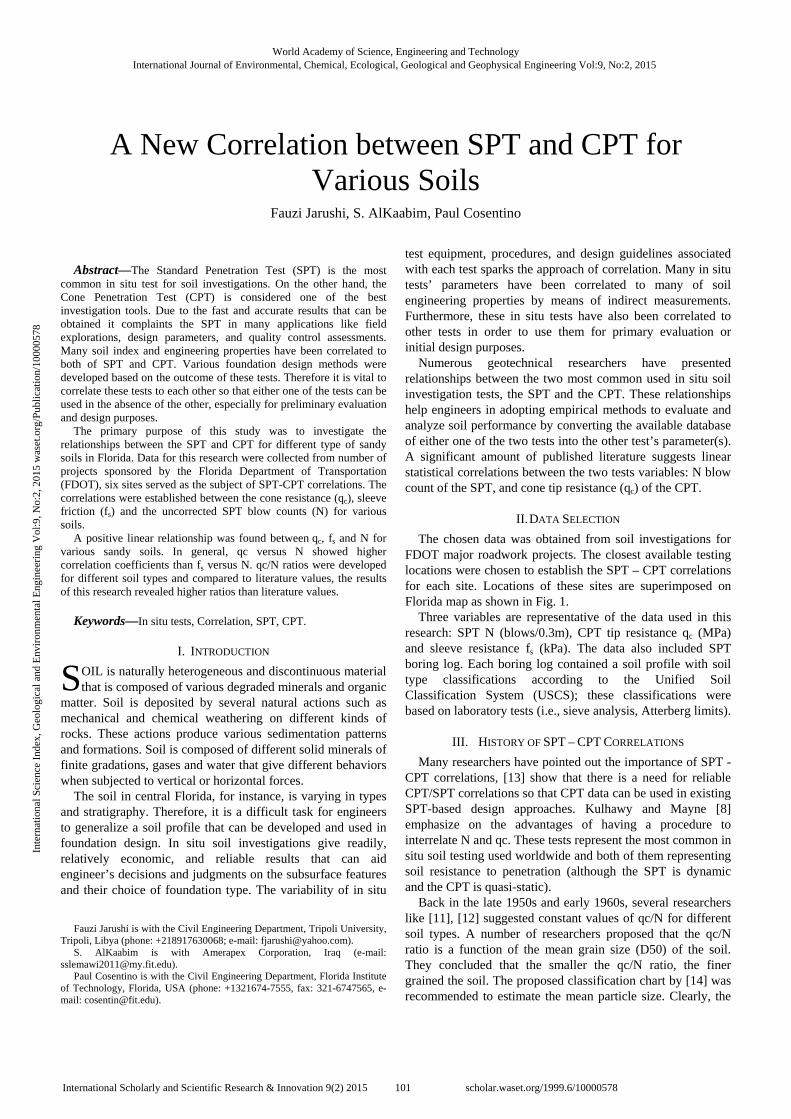
The chosen data was obtained from soil investigations for FDOT major roadwork projects. The closest available testing locations were chosen to establish the SPT – CPT correlations for each site. Locations of these sites are superimposed on Florida map as shown in Fig. 1.
Three variables are representative of the data used in this research: SPT N (blows/0.3m), CPT tip resistance qc (MPa) and sleeve resistance fs (kPa). The data also included SPT boring log. Each boring log contained a soil profile with soil type classifications according to the Unified Soil Classification System (USCS); these classifications were based on laboratory tests (i.e., sieve analysis, Atterberg limits).
III. HISTORY OF SPT – CPT CORRELATIONS
Many researchers have pointed out the importance of SPT - CPT correlations, [13] show that there is a need for reliable CPT/SPT correlations so that CPT data can be used in existing SPT-based design approaches. Kulhawy and Mayne ]8 [emphasize on the advantages of having a procedure to interrelate N and qc. These tests represent the most common in situ soil testing used worldwide and both of them representing soil resistance to penetration (although the SPT is dynamic and the CPT is quasi-static).
Back in the late 1950s and early 1960s, several researchers like [11], [12] suggested constant values of qc/N for different soil types. A number of researchers proposed that the qc/N ratio is a function of the mean grain size (D50) of the soil. They concluded that the smaller the qc/N ratio, the finer grained the soil. The proposed classification chart by [14] was recommended to estimate the mean particle size. Clearly, the
Fauzi Jarushi, S. AlKaabim, Paul Cosentino
A New Correlation between SPT and CPT for Various Soils
S
World Academy of Science, Engineering and TechnologyInternational Journal of Environmental, Chemical, Ecological, Geological and Geophysical Engineering Vol:9, No:2, 2015
101International Scholarly and Scientific Research & Innovation 9(2) 2015 scholar.waset.org/1999.6/10000578
qc/N ratio increases with increasing grain size (D50); conversely, the ratio decreases with increasing fine material. Scatter in data tends to increase with the increase in sand grains size (D50 1.0 mm). This may related to the significant effect of large particles on the penetration. Other investigators reported that the correlation could be more relevant by relating the fine contents (FC) to the qc/N ratio [2]. Similarly, their study results indicate that the qc/N ratio is smaller with sands of high fines content than for clean sands. Kulhawy and Mayne [8] have compiled a number of studies in one graph to verify a general trend between the qc/N ratio and the fines content. The N-values used in this research were the uncorrected due to some limitation of the data.
Fig. 1 Current Study Sites Locations [22]
A. Factors Affecting SPT-CPT Correlations
Many studies have pointed out several factors that could affect the SPT/CPT relationship. Schmertmann [17] and Kovacs [7] showed that the amount of energy delivered to the drill rods is an important factor affecting the N-value. Douglas [20] has reported that the qc/N ratio is significantly affected by SPT hammer type and rather with soil density. Study conducted by [6] has shown that the qc/N depends on the fines content of sandy soil. They concluded that permeability and modification of compressibility of the sand are the major factors that may affect qc/N ratio. Sanglerat [23] reviewed and presented a number of studies implemented in several countries. Many of these studies have assigned a constant ratio of qc/N for each soil type; for instance, sandy soils have mostly qc/N ratios larger than 4, while clays have ratios less than 4. Furthermore, these studies have drawn important conclusions that soil compactness and relative density increase would decrease qc/N ratio. Table I summarizes the previous studies.
TABLE I HISTORY OF SPT-CPT CORRELATIONS
Researcher(s) SPT
Hammer type N Cone type Relationship
Robertson [15] Donut & Safety
Mostly Safety
N55 N55
Electric Electric
qc/N = function (D50)
Kasim [6]& Chin [2]
N/A Safety Donut
N/A N55 N55
N/A Electric Electric
qc/N = function (FC)
Robertson [15] Lunne [10]
N/A
N/A
N60
N/A
Electric
N/A
Soil classification chart with suggested qc/N ratio for each soil behavior type
Meyerhof [12] N/A N/A N/A Suggested constant values qc/N or (qc+fs)/N in different soil types for
Meigh [11] N/A N55 N/A
Schmertmann [16]
N/A
Uncorrected N55
Mechanical Electric
Chin [2] Donut N/A
N60 N/A
Danziger [4]& Akca [1]
Automatic N60 Mechanical
IV. METHODOLOGY
A. CPT and SPT Tests
The first type of cone penetration test was made by P. Barentsen in 1932 in the Netherlands [10]. Although many different styles and configurations have been used, the current standard grew out from the Netherlands model, so it is sometimes called the Dutch Cone [21]. Two types of CPT were developed, mechanical cone and electrical cone. In 1953, Begemann improved the Dutch cone by adding the “friction jacket” behind the cone, to measure the local skin friction, fs, in addition to the tip resistance, qc. The CPT involves pushing 10 cm2, 60° cone through the ground at a rate of 1-2 cm/s. The total force acting on the cone divided by the projected area of the cone (10 cm2) is the point resistance (qc). This force or resistance is measured by load cells located just behind the tapered cone. Theoretically, the tip resistance is related to the undrained shear strength of a saturated cohesive material, while the sleeve friction is theoretically related to the friction of the horizon being penetrated [15].
The SPT is considered the oldest in situ soil test technique. Its early version dates back to the beginning of the 19th century. The basic SPT implementation procedure is to force a thick, hollow tube to penetrate into the soil by applying an external driving force while calculating the soil resistance in terms of blow count. During the late 1920s and early 1930s, the first trial that aimed to standardize this test procedure was developed by Harry Mohr. He recommended using a larger diameter split spoon sampler 5 cm in diameter and counting the number of blows per 300 mm of penetration, using a 64-kg hammer with a drop distance of 76 cm.
As the SPT test progresses, soil samples and groundwater information are also collected. A record is made of the number of blows required to drive each 150 mm segment into the soil. This is done until 450 mm depth is achieved or otherwise penetration refusal. The first record of advance (seating) is
World Academy of Science, Engineering and TechnologyInternational Journal of Environmental, Chemical, Ecological, Geological and Geophysical Engineering Vol:9, No:2, 2015
102International Scholarly and Scientific Research & Innovation 9(2) 2015 scholar.waset.org/1999.6/10000578
usually discarded (first 150 mm), while the second and third increments are recorded and summed as the number of blows N per 300 mm.
All of the selected sites were tested with safety hammers during the SPT sampling. Unfortunately, no detailed information regarding the borehole diameter and the rod length used to perform the SPT was available. These parameters are used to correct the SPT results for field procedures to yield more reliable and consistent findings.
On the other hand, the CPT data in cohesionless soils, which are the dominant type of soils in the studied sites, does not require corrections.
B. Data Matching
The average qc and fs values were compared with the SPT N values located at the same elevation.
Because the SPT results are generally taken at specified intervals of depth, usually second 300 mm and the sequence intervals are larger than those provided by the CPT; the SPT N-values were selected as the reference for the corresponding CPT values.
C. Proposed Correlations
The correlation process involved separating each type of soil from all boreholes and combining them into a single analysis.
Many suggested verbal labels to describe the strength of the relationship are available, yet no universally accepted single scale was found. Obviously, the closer to 1 (+ or -) a correlation coefficient is, then the stronger the relationship. The nearer to 0 (means no relationship), then the weaker is the correlation [3]. The following strength scale was used to describe the correlation strength throughout this research: 1 (Perfect); 0.7 to 0.9 (Strong); 0.6 to 0.4 (Moderate); 0.1 to 0.3 (Weak) and 0 (No correlation).
V. RESULTS AND DISCUSSION
A. CPT qc versus SPT N
The majority of literature was based on qc and N relationships. The qc value is considered to be more consistent than fs [9]. In the current research, sixteen different test locations were evaluated to find probable qc versus N trends. Five common soil types between the sixteen sites have been identified as: 1) Fine Sand (SP) 2) Silty Fine Sand (SM) 3) Clayey Fine Sand (SC) 4) Silty Clayey Fine Sand SM/SC, and 5) Fine Sand with Silt (SP-SM).
Other soil types (i.e., Clay (CH and CL)) were regarded as infrequent, and if present, they consisted of thin layers. Therefore, this data would provide poor quality correlations. The total depth of the SPT boring was correlated to the entire CPT sounding depth.
The following sections present the results for each type of soil:
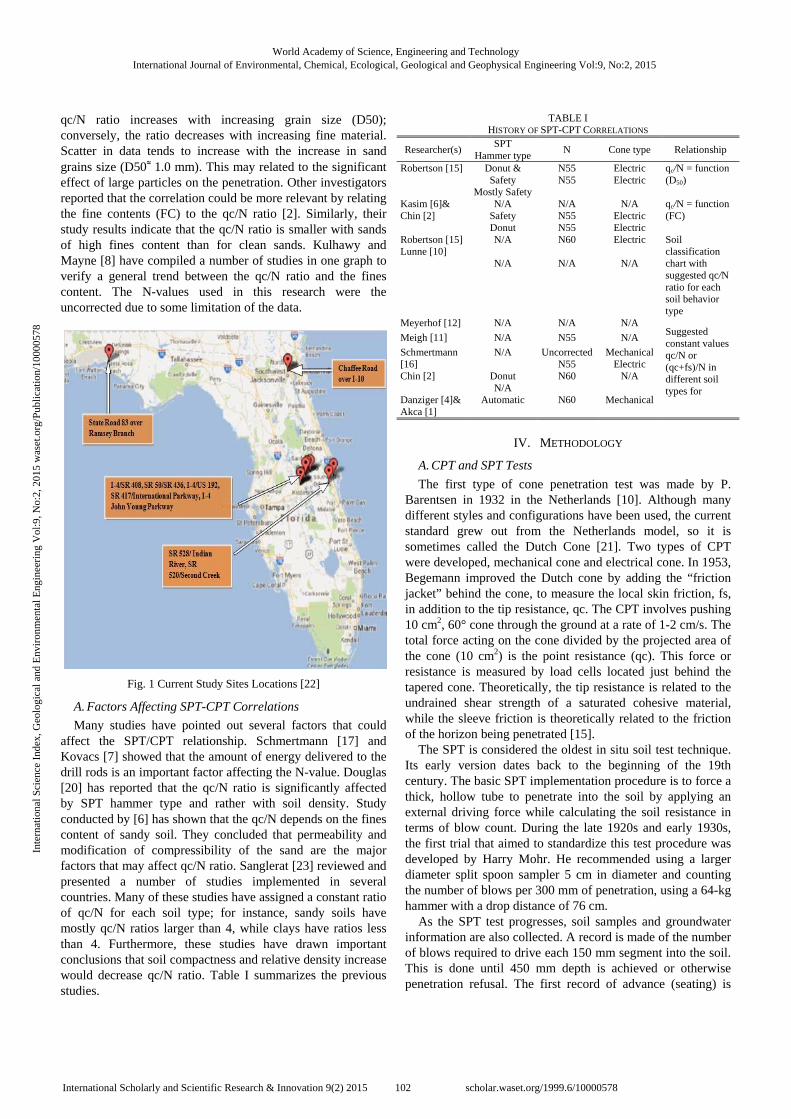
Fine Sand (SP): This soil has a poor gradation, excellent
drainage characteristics, good shear strength, and very low compressibility when compacted and saturated [5], produced a positive correlation between qc and N. A total of 58 data pairs was used to determine the relationship between the two variables as shown in Fig. 2. The SPT N has 1 and 57 as a lower and upper limit, respectively. The qc values ranged between 1 and 25 MPa.
Fig. 2 Relationship between qc and N for Fine Sand (SP) soil
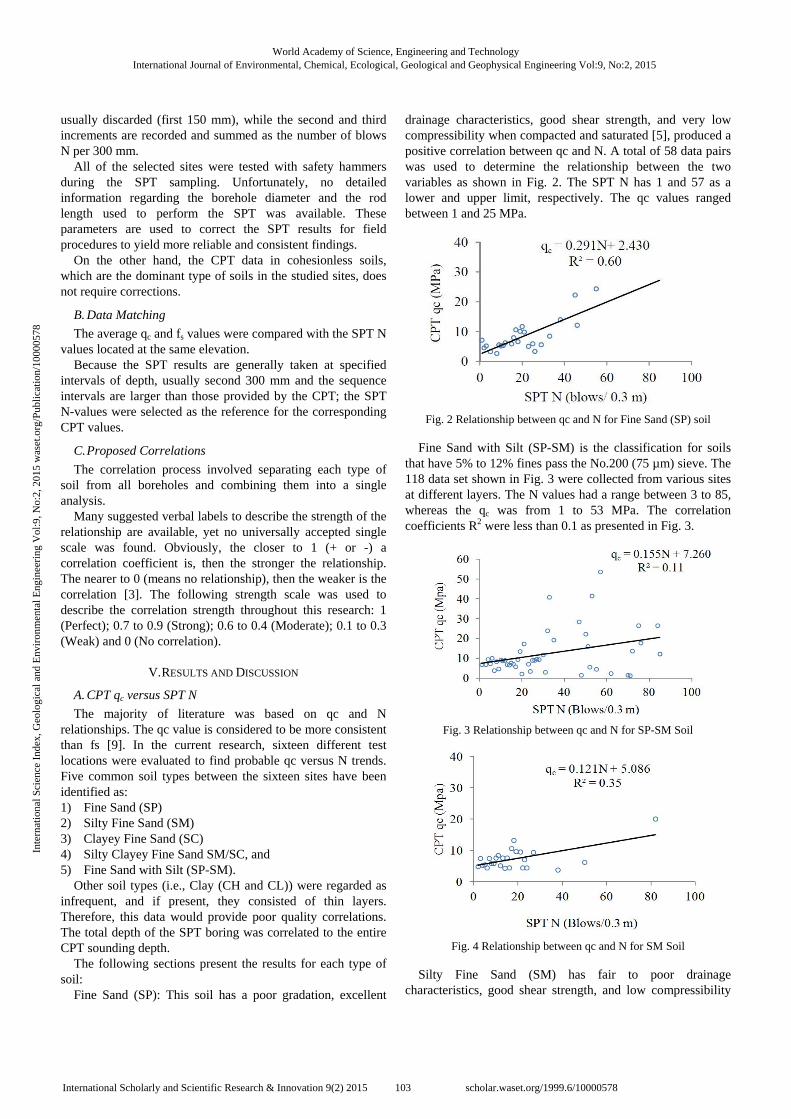
Fine Sand with Silt (SP-SM) is the classification for soils that have 5% to 12% fines pass the No.200 (75 µm) sieve. The 118 data set shown in Fig. 3 were collected from various sites at different layers. The N values had a range between 3 to 85, whereas the qc was from 1 to 53 MPa. The correlation coefficients R2 were less than 0.1 as presented in Fig. 3.
Fig. 3 Relationship between qc and N for SP-SM Soil
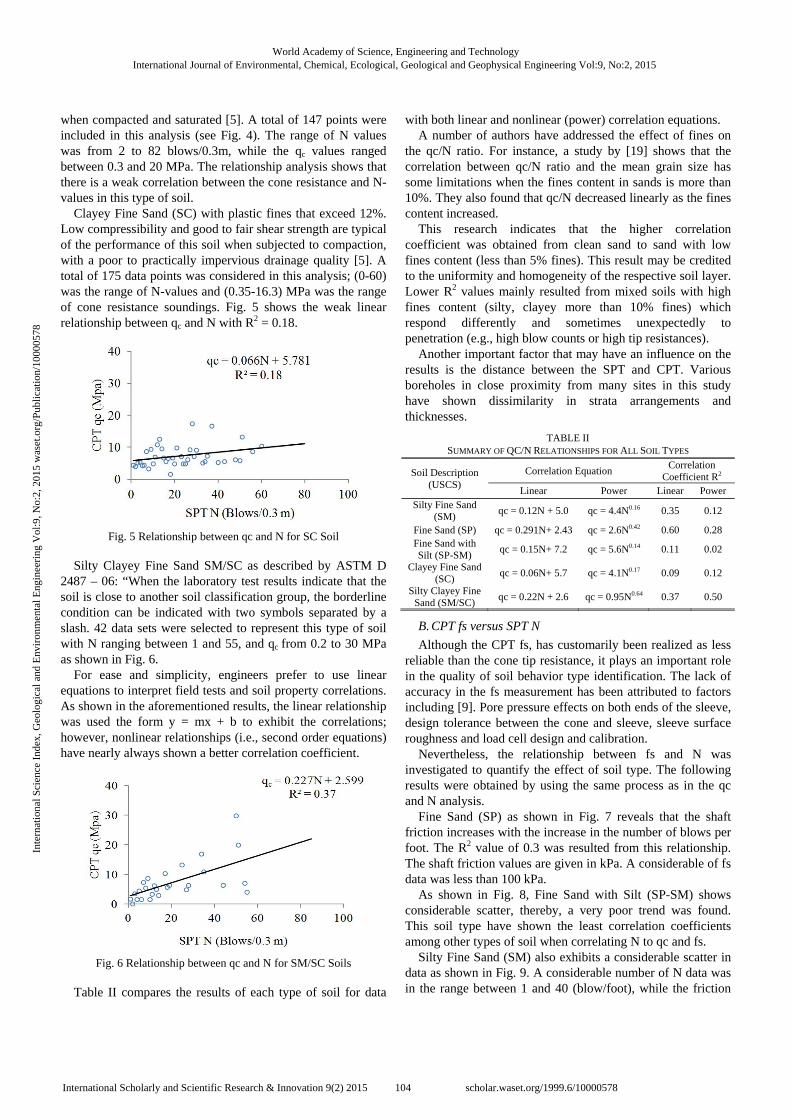
Fig. 4 Relationship between qc and N for SM Soil
Silty Fine Sand (SM) has fair to poor drainage characteristics, good shear strength, and low compressibility
World Academy of Science, Engineering and TechnologyInternational Journal of Environmental, Chemical, Ecological, Geological and Geophysical Engineering Vol:9, No:2, 2015
103International Scholarly and Scientific Research & Innovation 9(2) 2015 scholar.waset.org/1999.6/10000578
when compacted and saturated ]5[ . A total of 147 points were included in this analysis (see Fig. 4). The range of N values was from 2 to 82 blows/0.3m, while the qc values ranged between 0.3 and 20 MPa. The relationship analysis shows that there is a weak correlation between the cone resistance and N-values in this type of soil.
Clayey Fine Sand (SC) with plastic fines that exceed 12%. Low compressibility and good to fair shear strength are typical of the performance of this soil when subjected to compaction, with a poor to practically impervious drainage quality ]5[ . A total of 175 data points was considered in this analysis; (0-60) was the range of N-values and (0.35-16.3) MPa was the range of cone resistance soundings. Fig. 5 shows the weak linear relationship between qc and N with R2 = 0.18.
Fig. 5 Relationship between qc and N for SC Soil Silty Clayey Fine Sand SM/SC as described by ASTM D
2487 – 06: “When the laboratory test results indicate that the soil is close to another soil classification group, the borderline condition can be indicated with two symbols separated by a slash. 42 data sets were selected to represent this type of soil with N ranging between 1 and 55, and qc from 0.2 to 30 MPa as shown in Fig. 6.
For ease and simplicity, engineers prefer to use linear equations to interpret field tests and soil property correlations. As shown in the aforementioned results, the linear relationship was used the form y = mx + b to exhibit the correlations; however, nonlinear relationships (i.e., second order equations) have nearly always shown a better correlation coefficient.
Fig. 6 Relationship between qc and N for SM/SC Soils Table II compares the results of each type of soil for data
with both linear and nonlinear (power) correlation equations. A number of authors have addressed the effect of fines on
the qc/N ratio. For instance, a study by [19] shows that the correlation between qc/N ratio and the mean grain size has some limitations when the fines content in sands is more than 10%. They also found that qc/N decreased linearly as the fines content increased.
This research indicates that the higher correlation coefficient was obtained from clean sand to sand with low fines content (less than 5% fines). This result may be credited to the uniformity and homogeneity of the respective soil layer. Lower R2 values mainly resulted from mixed soils with high fines content (silty, clayey more than 10% fines) which respond differently and sometimes unexpectedly to penetration (e.g., high blow counts or high tip resistances).
Another important factor that may have an influence on the results is the distance between the SPT and CPT. Various boreholes in close proximity from many sites in this study have shown dissimilarity in strata arrangements and thicknesses.
TABLE II SUMMARY OF QC/N RELATIONSHIPS FOR ALL SOIL TYPES
Soil Description (USCS)
Correlation Equation Correlation
Coefficient R2 Linear Power Linear Power
Silty Fine Sand (SM)
qc = 0.12N + 5.0 qc = 4.4N0.16 0.35 0.12
Fine Sand (SP) qc = 0.291N+ 2.43 qc = 2.6N0.42 0.60 0.28 Fine Sand with Silt (SP-SM)
qc = 0.15N+ 7.2 qc = 5.6N0.14 0.11 0.02
Clayey Fine Sand (SC)
qc = 0.06N+ 5.7 qc = 4.1N0.17 0.09 0.12
Silty Clayey Fine Sand (SM/SC)
qc = 0.22N + 2.6 qc = 0.95N0.64 0.37 0.50
B. CPT fs versus SPT N
Although the CPT fs, has customarily been realized as less reliable than the cone tip resistance, it plays an important role in the quality of soil behavior type identification. The lack of accuracy in the fs measurement has been attributed to factors including [9]. Pore pressure effects on both ends of the sleeve, design tolerance between the cone and sleeve, sleeve surface roughness and load cell design and calibration.
Nevertheless, the relationship between fs and N was investigated to quantify the effect of soil type. The following results were obtained by using the same process as in the qc and N analysis.
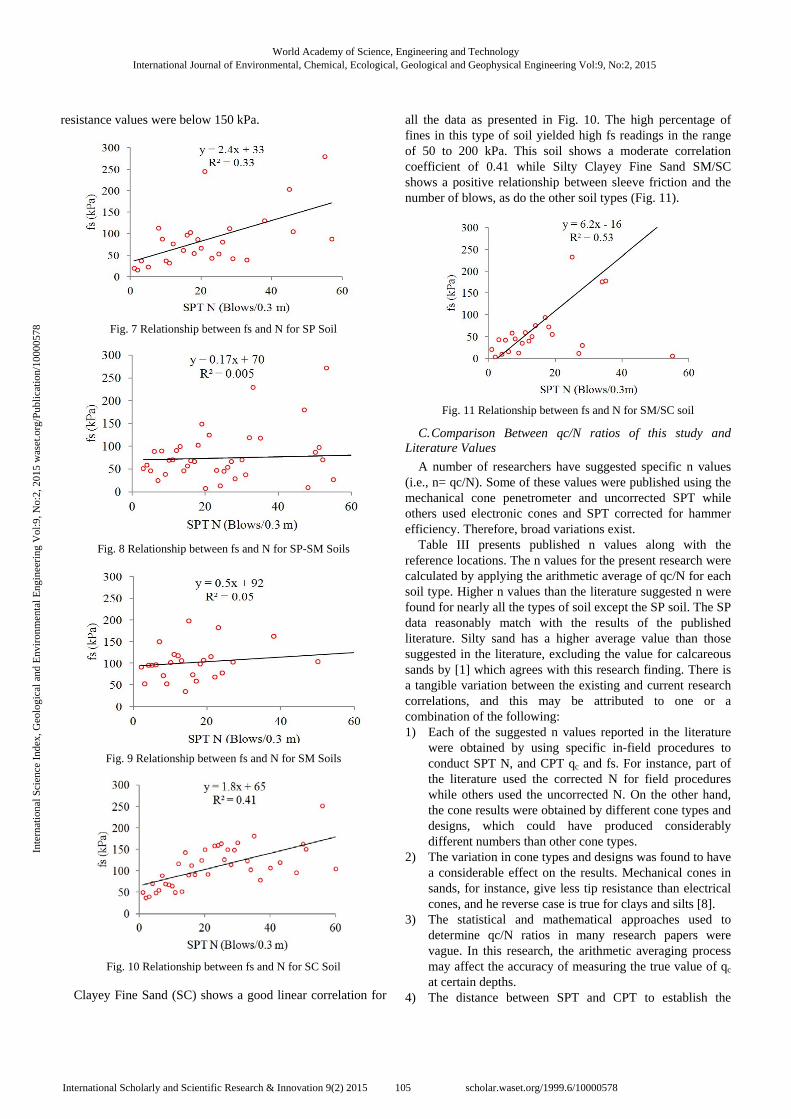
Fine Sand (SP) as shown in Fig. 7 reveals that the shaft friction increases with the increase in the number of blows per foot. The R2 value of 0.3 was resulted from this relationship. The shaft friction values are given in kPa. A considerable of fs data was less than 100 kPa.
As shown in Fig. 8, Fine Sand with Silt (SP-SM) shows considerable scatter, thereby, a very poor trend was found. This soil type have shown the least correlation coefficients among other types of soil when correlating N to qc and fs.
Silty Fine Sand (SM) also exhibits a considerable scatter in data as shown in Fig. 9. A considerable number of N data was in the range between 1 and 40 (blow/foot), while the friction
World Academy of Science, Engineering and TechnologyInternational Journal of Environmental, Chemical, Ecological, Geological and Geophysical Engineering Vol:9, No:2, 2015
104International Scholarly and Scientific Research & Innovation 9(2) 2015 scholar.waset.org/1999.6/10000578
Fig. 8 Relationship between fs and N for SP-SM Soils
Fig. 9 Relationship between fs and N for SM Soils
Fig. 10 Relationship between fs and N for SC Soil
Clayey Fine Sand (SC) shows a good linear correlation for
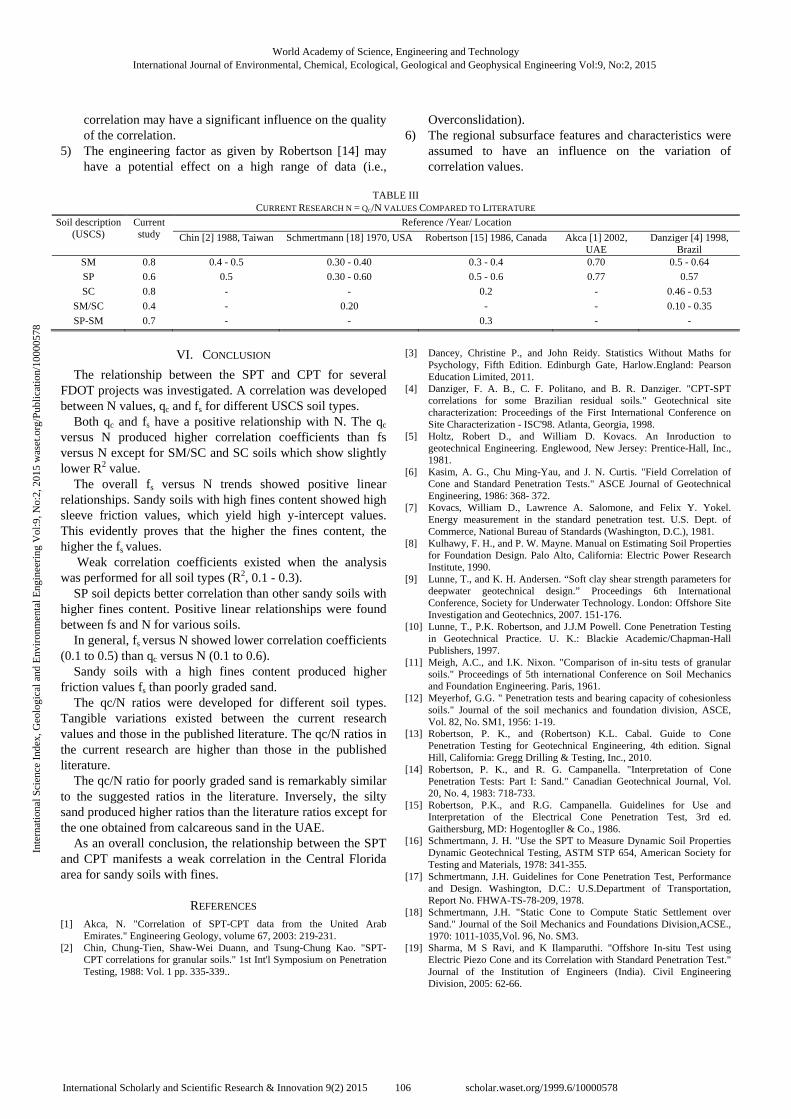
all the data as presented in Fig. 10. The high percentage of fines in this type of soil yielded high fs readings in the range of 50 to 200 kPa. This soil shows a moderate correlation coefficient of 0.41 while Silty Clayey Fine Sand SM/SC shows a positive relationship between sleeve friction and the number of blows, as do the other soil types (Fig. 11).
Fig. 11 Relationship between fs and N for SM/SC soil
C. Comparison Between qc/N ratios of this study and Literature Values
A number of researchers have suggested specific n values (i.e., n= qc/N). Some of these values were published using the mechanical cone penetrometer and uncorrected SPT while others used electronic cones and SPT corrected for hammer efficiency. Therefore, broad variations exist.
Table III presents published n values along with the reference locations. The n values for the present research were calculated by applying the arithmetic average of qc/N for each soil type. Higher n values than the literature suggested n were found for nearly all the types of soil except the SP soil. The SP data reasonably match with the results of the published literature. Silty sand has a higher average value than those suggested in the literature, excluding the value for calcareous sands by [1] which agrees with this research finding. There is a tangible variation between the existing and current research correlations, and this may be attributed to one or a combination of the following: 1) Each of the suggested n values reported in the literature
were obtained by using specific in-field procedures to conduct SPT N, and CPT qc and fs. For instance, part of the literature used the corrected N for field procedures while others used the uncorrected N. On the other hand, the cone results were obtained by different cone types and designs, which could have produced considerably different numbers than other cone types.
2) The variation in cone types and designs was found to have a considerable effect on the results. Mechanical cones in sands, for instance, give less tip resistance than electrical cones, and he reverse case is true for clays and silts ]8[ .
3) The statistical and mathematical approaches used to determine qc/N ratios in many research papers were vague. In this research, the arithmetic averaging process may affect the accuracy of measuring the true value of qc at certain depths.
4) The distance between SPT and CPT to establish the
World Academy of Science, Engineering and TechnologyInternational Journal of Environmental, Chemical, Ecological, Geological and Geophysical Engineering Vol:9, No:2, 2015
105International Scholarly and Scientific Research & Innovation 9(2) 2015 scholar.waset.org/1999.6/10000578
The relationship between the SPT and CPT for several FDOT projects was investigated. A correlation was developed between N values, qc and fs for different USCS soil types.
Both qc and fs have a positive relationship with N. The qc versus N produced higher correlation coefficients than fs versus N except for SM/SC and SC soils which show slightly lower R2 value.
The overall fs versus N trends showed positive linear relationships. Sandy soils with high fines content showed high sleeve friction values, which yield high y-intercept values. This evidently proves that the higher the fines content, the higher the fs values.
Weak correlation coefficients existed when the analysis was performed for all soil types (R2, 0.1 - 0.3).
SP soil depicts better correlation than other sandy soils with higher fines content. Positive linear relationships were found between fs and N for various soils.
In general, fs versus N showed lower correlation coefficients (0.1 to 0.5) than qc versus N (0.1 to 0.6).
Sandy soils with a high fines content produced higher friction values fs than poorly graded sand.
The qc/N ratios were developed for different soil types. Tangible variations existed between the current research values and those in the published literature. The qc/N ratios in the current research are higher than those in the published literature.
The qc/N ratio for poorly graded sand is remarkably similar to the suggested ratios in the literature. Inversely, the silty sand produced higher ratios than the literature ratios except for the one obtained from calcareous sand in the UAE.
As an overall conclusion, the relationship between the SPT and CPT manifests a weak correlation in the Central Florida area for sandy soils with fines.
REFERENCES [1] Akca, N. "Correlation of SPT-CPT data from the United Arab
CPT correlations for granular soils." 1st Int'l Symposium on Penetration Testing, 1988: Vol. 1 pp. 335-339..
[3] Dancey, Christine P., and John Reidy. Statistics Without Maths for Psychology, Fifth Edition. Edinburgh Gate, Harlow.England: Pearson Education Limited, 2011.
[4] Danziger, F. A. B., C. F. Politano, and B. R. Danziger. "CPT-SPT correlations for some Brazilian residual soils." Geotechnical site characterization: Proceedings of the First International Conference on Site Characterization - ISC'98. Atlanta, Georgia, 1998.
[5] Holtz, Robert D., and William D. Kovacs. An Inroduction to geotechnical Engineering. Englewood, New Jersey: Prentice-Hall, Inc., 1981.
[6] Kasim, A. G., Chu Ming-Yau, and J. N. Curtis. "Field Correlation of Cone and Standard Penetration Tests." ASCE Journal of Geotechnical Engineering, 1986: 368- 372.
[7] Kovacs, William D., Lawrence A. Salomone, and Felix Y. Yokel. Energy measurement in the standard penetration test. U.S. Dept. of Commerce, National Bureau of Standards (Washington, D.C.), 1981.
[8] Kulhawy, F. H., and P. W. Mayne. Manual on Estimating Soil Properties for Foundation Design. Palo Alto, California: Electric Power Research Institute, 1990.
[9] Lunne, T., and K. H. Andersen. “Soft clay shear strength parameters for deepwater geotechnical design.” Proceedings 6th International Conference, Society for Underwater Technology. London: Offshore Site Investigation and Geotechnics, 2007. 151-176.
[10] Lunne, T., P.K. Robertson, and J.J.M Powell. Cone Penetration Testing in Geotechnical Practice. U. K.: Blackie Academic/Chapman-Hall Publishers, 1997.
[11] Meigh, A.C., and I.K. Nixon. "Comparison of in-situ tests of granular soils." Proceedings of 5th international Conference on Soil Mechanics and Foundation Engineering. Paris, 1961.
[12] Meyerhof, G.G. " Penetration tests and bearing capacity of cohesionless soils." Journal of the soil mechanics and foundation division, ASCE, Vol. 82, No. SM1, 1956: 1-19.
[13] Robertson, P. K., and (Robertson) K.L. Cabal. Guide to Cone Penetration Testing for Geotechnical Engineering, 4th edition. Signal Hill, California: Gregg Drilling & Testing, Inc., 2010.
[14] Robertson, P. K., and R. G. Campanella. "Interpretation of Cone Penetration Tests: Part I: Sand." Canadian Geotechnical Journal, Vol. 20, No. 4, 1983: 718-733.
[15] Robertson, P.K., and R.G. Campanella. Guidelines for Use and Interpretation of the Electrical Cone Penetration Test, 3rd ed. Gaithersburg, MD: Hogentogller & Co., 1986.
[16] Schmertmann, J. H. "Use the SPT to Measure Dynamic Soil Properties Dynamic Geotechnical Testing, ASTM STP 654, American Society for Testing and Materials, 1978: 341-355.
[17] Schmertmann, J.H. Guidelines for Cone Penetration Test, Performance and Design. Washington, D.C.: U.S.Department of Transportation, Report No. FHWA-TS-78-209, 1978.
[18] Schmertmann, J.H. "Static Cone to Compute Static Settlement over Sand." Journal of the Soil Mechanics and Foundations Division,ACSE., 1970: 1011-1035,Vol. 96, No. SM3.
[19] Sharma, M S Ravi, and K Ilamparuthi. "Offshore In-situ Test using Electric Piezo Cone and its Correlation with Standard Penetration Test." Journal of the Institution of Engineers (India). Civil Engineering Division, 2005: 62-66.
World Academy of Science, Engineering and TechnologyInternational Journal of Environmental, Chemical, Ecological, Geological and Geophysical Engineering Vol:9, No:2, 2015
106International Scholarly and Scientific Research & Innovation 9(2) 2015 scholar.waset.org/1999.6/10000578
[20] Douglas, B.J. and Olsen, R.S. (1981). “Soil classification using electric cone penetrometer,” Symposium on Cone Penetration Testing and Experience. Proceedings of the ASCE National Convention, St. Louis, 209-227.
[21] Coduto, D. P. ( 2001). Foundation Design: Principles and Practices. Upper Saddle River: Prentice Hall.
[22] Courtesy of Google Maps, 2013. [23] Sanglerat, G., The Penetrometer and Soil Exploration, Elsevier
Publishing Company, New York, N.Y., 1972.
World Academy of Science, Engineering and TechnologyInternational Journal of Environmental, Chemical, Ecological, Geological and Geophysical Engineering Vol:9, No:2, 2015
107International Scholarly and Scientific Research & Innovation 9(2) 2015 scholar.waset.org/1999.6/10000578