A NEW CORRELATION FOR ROUND DUCT AND UNIFORM HEATING-COMPARISON WITH WORLD DATA ySw PIÜ1P L. BIASI**, G.C. CLERICI**, S. GARRIBA***, R. SALA* and A. TOZZI** 1967 EURATOM/US Agreement for Cooperation EURAEC Report No. 1874 prepared by ARS, SpA Società Applicazioni Ricerche Scientifiche, Milan - Italy Euratom Contract No. 106-66-12 TEEI 'M
Transcript
A NEW CORRELATION FOR ROUND DUCT AND UNIFORM HEATING-COMPARISON WITH WORLD DATA
ySw PIÜ1P
L. BIASI**, G.C. CLERICI**, S. GARRIBA***, R. SALA* and A. TOZZI**
1967
EURATOM/US Agreement for Cooperation
EURAEC Report No. 1874 prepared by ARS, SpA Società Applicazioni Ricerche Scientifiche, Milan - Italy
Euratom Contract No. 106-66-12 TEEI
'M
RfiÍítá'HSBiAÍ l ^ ' 1 F .1 r r r i-cinn , uocument was prepared under the sponsorship ot the L-ommission o
the European Atomic Energy Community (Euratom) in pursuance of the joint programme laid down by the Agreement for Cooperation signed on 8 November 1958 between the Government of the United States of America and the European Atomic Energy Community.
_uratom Commission, nor the Government contractors or any person acting on their behalf :
It is specified that neither the E of the United States, their contrae
i akes any warranty or representation, express or implied, with respect to the accuracy; completeness, or usefulness of the information contained in this document, or that the use of any information, apparatus, method, or process disclosed in this document may not infringe privately owned right,; or %3Si Assume any liability with respect to the use of, or for damages resulting from the use of any information, apparatus, method or process disclosed in this document
ί'·Λΐ'Β\.ιι·!*ΙβΗΐ. i'.l:)>Ski'N,i . Λ r kXVl
ilKiililllliîSiiii^ ¿t.::*!·!*!
MÉjgjtóí ι,«?
This report is on sale at the addresses listed on cover page 4
at the price of F F 7. FB 7 0 . - D M 5.60 Lit. 870 FI. 5
ι·»*» »I
When ordering, please quote the EUR number and the title, whic
indicated on the cover of each report indicated on Tne cover or eacn repon.
|1|£ ¡SRAimmm S
m.
SMEETS
, September
tøj
This document was reproduced on the basis of the best available Co
!« Mm*» ■sm ^-'VWftm rkif'iiL·'^ Mà&
;U,.*$íi ä-ö?!} fctfíi
liiiiiiiilieiiill
EUR 3376 e
A NEW CORRELATION FOR ROUND DUCT AND UNIFORM HEATING - COMPARISON WITH WORLD DATA by L. B1ASI** G.C. CLERICI**, S. GARRIBA***, R. SALA* and A. TOZZI*
*ARS, SpA **ARS, SpA and University of Milan
***CESNEF
European Atomic Energy Community - EURATOM EURATOM/US Agreement for Cooperation EURAEC Report No. 1874 prepared by ARS, Spa Società Applicazioni Ricerche Scientifiche, Milan (Italy) Euratom Contract No. 106-66-12 TEE1 Brussels, September 1967 - 56 Pages - 37 Figures - FB 70
A new correlation, having a large range or validity and applicable
EUR 3376 e
A NEW CORRELATION FOR ROUND DUCT AND UNIFORM HEATING - COMPARISON WITH WORLD DATA by L. B1ASI** G.C. CLERICI**, S. GARRIBA***, R. SALA* and A. TOZZI*
*ARS, SpA **ARS, SpA and University of Milan
***CESNEF
European Atomic Energy Community - EURATOM EURATOM/US Agreement for Cooperation EURAEC Report No. 1874 prepared by ARS, Spa Società Applicazioni Ricerebe Scientifiche, Milan (Italy) Euratom Contract No. 106-66-12 TEEI Brussels, September 1967 - 56 Pages - 37 Figures - FB 70
A new correlation, having a large range of validity and applicable
EUR 3376 e
A NEW CORRELATION FOR ROUND DUCT AND UNIFORM HEATING - COMPARISON WITH WORLD DATA by L. BIASI** G.C. CLERICI**, S. GARRIBA***, R. SALA* and A. TOZZI*
*ARS, SpA **ARS, SpA and University of Milan
***CESNEF
European Atomic Energy Community - EURATOM EURATOM/US Agreement for Cooperation EURAEC Report No. 1874 prepared by ARS, Spa Società Applicazioni Ricerche Scientifiche, Milan (Italy) Euratom Contract No. 106-66-12 TEEI Brussels, September 1967 - 56 Pages - 57 Figures - FB 70
A new correlation, having a large range of validity and applicable
to circular ducts with uniform heat flux distribution, shall be presented. This correlation is compared with most burnout data with negative inlet quality (X < O ) existing in the world. The mean quadratic errore, over
in 4551 experimental data coming from various laboratories, is 7.26 %, and the 85.5 % of these data has an error less than 10 %. At last 576 data, which are external to the validity range, are examined and some corrective factors are suggested in order to extend the validity range of the correlation.
to circular ducts with uniform heat flux distribution, shall be presented. 1 his correlation is compared with most burnout data with negative inlet quality (X < O ) existing in the world. The mean quadratic error π , over
in 4551 experimental data coming from various laboratories, is 7.26 %, and the 85.5 % of these data has an error less than 10 %. A t last 576 data, which are external to the validity range, are examined and some corrective factors are suggested in order to extend the validity range of the correlation.
to circular ducts with uniform heat flux distribution, shall be presented. This correlation is compared with most burnout data with negative inlet quality (X < O ) existing in the world. The mean quadratic error a, over
in 4551 experimental data coming from various laboratories, is 7.26 %, and tbe 85.5 % of these data has an error less than 10 %. At last 576 data, which are external to the validity range, are examined and some corrective factors are suggested in order to extend the validity range of the correlation.
EUR 3376 e
EUROPEAN ATOMIC ENERGY COMMUNITY - EURATOM
A NEW CORRELATION FOR ROUND DUCT AND UNIFORM HEATING-COMPARISON WITH WORLD DATA
by
L BIASI**, G.C. CLERICI**, S. GARRIBA***, R. SALA* and A. TOZZI**
*ARS, SpA
* * ARS, SpA and University of Milan
'**CESNEF
1 9 6 7
EURATOM/US Agreement for Cooperation
EURAEC Report No. 1874 prepared by ARS, SpA Società Applicazioni Ricerche Scientifiche, Milan - Italy
Euratom Contract No. 106-66-12 TEEI
SUMMARY
A new correlation, having a large range of validity and applicable to circular ducts with uniform heat flux distribution, shall be presented. This correlation is compared with most burnout data with negative inlet quality (X < O ) existing in the world. The mean quadratic errore, over
in 4551 experimental data coming from various laboratories, is 7.26 %, and the 85.5 % of these data has an error less than 10 %. At last 576 data, which are external to the validity range, are examined and some corrective factors are suggested in order to extend the validity range of the correlation.
KEYWORDS
BURNOUT TUBES STATISTICS ERRORS HEATING NUMER1CALS HEAT TRANSFER
Correlation function
TABLE OF CONTENTS
$ 1- Introduction pag. 5 $ 2- Critical heat flux correlation pag. 7 t 3- Range of validity pag. 12 I 4- Comparison with the experimental
data. pag, 13 $ 5- Examination of the data vhich are
external to the validity range pag. k3
Nomenclature pag. 53 Bibliography pag. 54
ACINOtfLEOHENT
Prof.M.Silvestri gave his time generously to discuss the program during the course of the investigation. Prof.S.Albertoni provided encouragement and suggestion in the writing of this report.
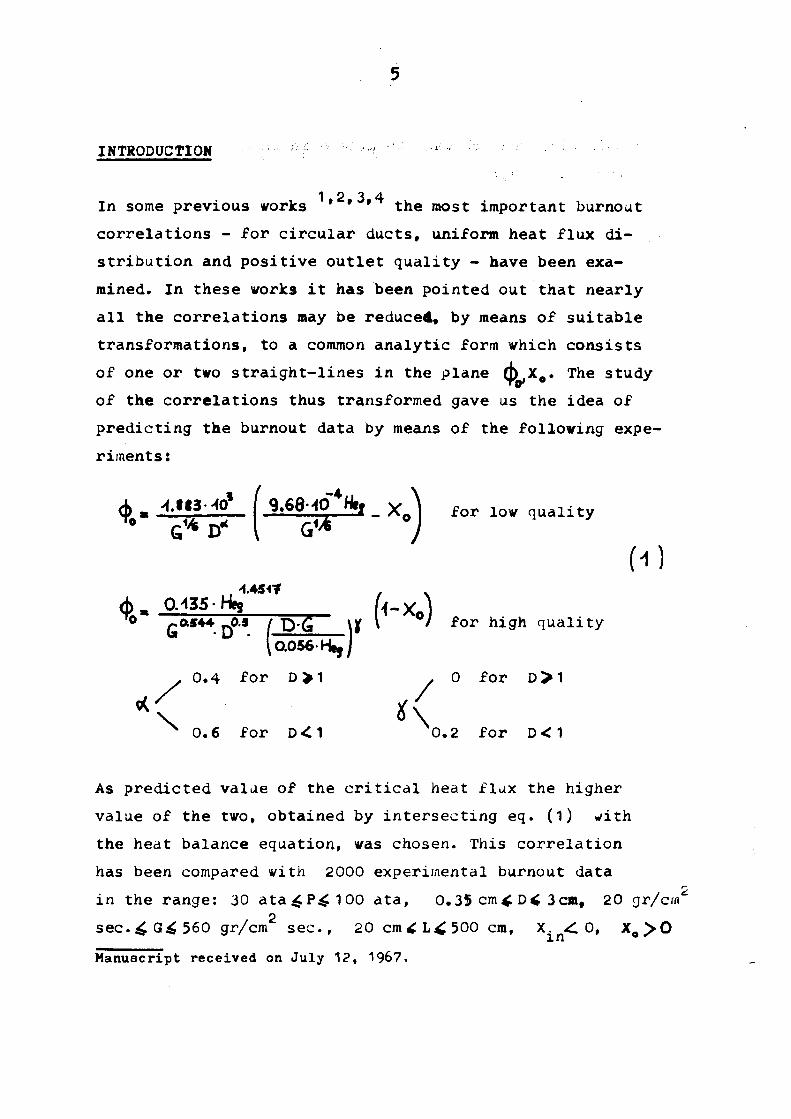
INTRODUCTION
1 2 3 4 In some previous works ' * ' the most important burnout
correlations for circular ducts, uniform heat flux di
stribution and positive outlet quality have been exa
mined. In these works it has been pointed out that nearly
all the correlations may be reduced, by means of suitable
transformations, to a common analytic form which consists
of one or two straightlines in the plane φ^Χβ· Tlle
study
of the correlations thus transformed gave us the idea of
predicting the burnout data by means of the following expe
riments:
for low quality
M 4.45-1?
4 . Q-^5H
?' ^_ A-xQ) 0 r
f t Wn°
: s /p-G \y \ '
1.056· H^ [ox
for high quality
<*
. 0.4 for D>1 y 0 f o r D>1
^ 0 . 6 fo r D<1 0.2 for D<1
As predicted value of the critical heat flux the higher
value of the two, obtained by intersecting eq. (1) */ith
the heat balance equation, was chosen. This correlation
has been compared with 2000 experimental burnout data
in the range: 30 ata^P^MOO ata, 0.35 cm¿ D* 3cm, 20 gr/cm 2
sec.^G^560 gr/cm sec, 20 cm ̂ L ^ 500 cm, X. ¿. 0, X 0 > 0
Manuscript received on July 12, 1967.
The main aims that we want to attain in the present work are the following:
i) To simplify the form of eq. (1) ii) To increase the parameters validity range. iii) To increase the number of the experimental burnout
data for the comparisons, iiii) To improve the accuracy of predictions.
2. CRITICAL HEAT FLUX CORRELATION
The empirical correlation proposed is the following!
Φ. >1·βς?3· 4<f
D" G V« yfp)
φ . 3.7810^(Ρ) % ij4 G06
Vi
1 - Xo
- ΧΌ for low quality
w i t h o< /
\
0.4 for D>1
0.6 for D O
fa) for high quality
Eq. (2) consists of two straight-lines, whose intersection point does not take place at constant outlet quality, but depends on pressure Ρ and mass flowrate G:
2.CH · h M M
As "a.priori"it is not possible to divide the validity range of these two straight-lines, we have thought of taking, as the predicted burnout point, the higher of the two values obtained by means of the intersection of eq.(2) with the heat balance equation:
t- -̂ τφο-*.») (4)
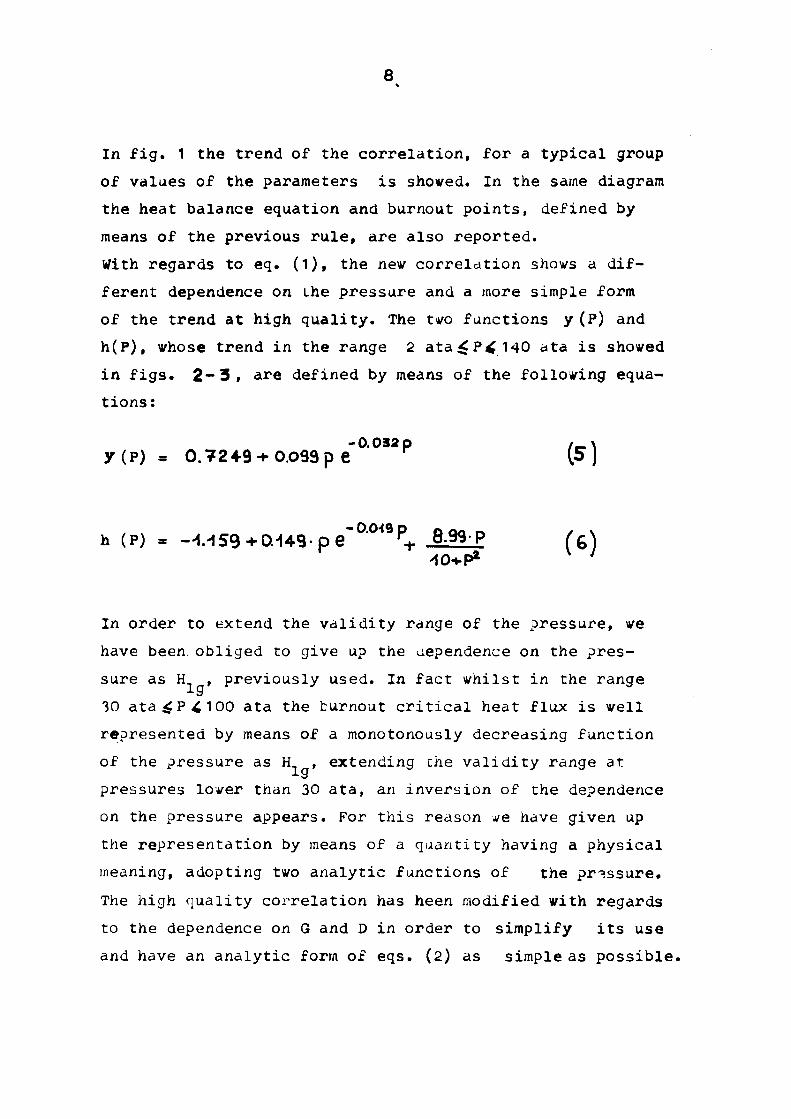
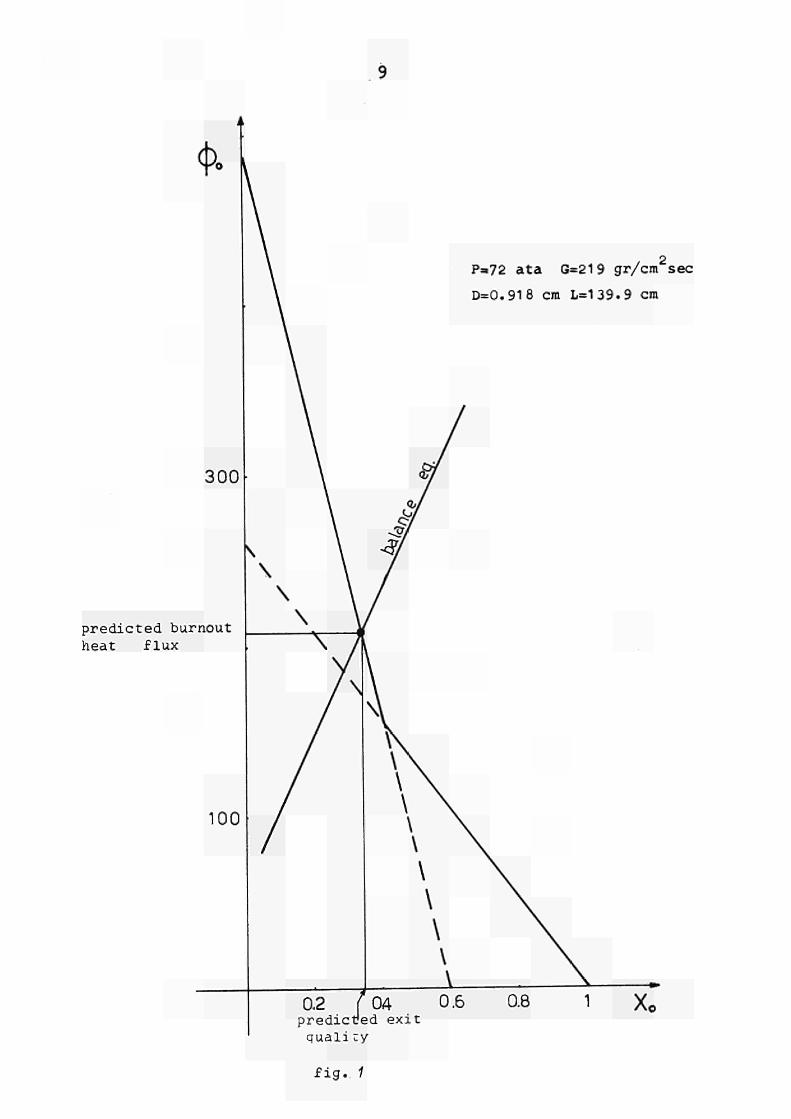
8
In fig. 1 the trend of the correlation, for a typical group
of values of the parameters is showed. In the same diagram
the heat balance equation and burnout points, defined by
means of the previous rule, are also reported.
With regards to eq. (ï), the new correlation shows a dif
ferent dependence on Lhe pressure and a more simple form
of the trend at high quality. The two functions y(Ρ) and
h(P), whose trend in the range 2 ata^P^ 140 ata is showed
in figs. 23, are defined by means of the following equa
tions:
-Ü.032D /__\
y(p) * 0.?249 + O.o99pe \ß J
h (Ρ) = ->Ι.159+αί49·ρβ~ ' P+ 8.99 Ρ ($)
40+F* V J
In order to extend the validity range of the pressure, we have been, obliged to give up the dependence on the pressure as Η , previously used. In fact whilst in the range 30 ata ¿P 4100 ata the turnout critical heat flux is well represented by means of a monotonously decreasing function
of the pressure as Η , extending che validity range at
pressures lower than 30 ata, an inversion of the dependence
on the pressure appears. For this reason xe have given up
the representation by means of a quantity having a physical
meaning, adopting two analytic functions of the pressure.
The high quality correlation has heen modified with regards
to the dependence on G and D in order to simplify its use
and have an analytic form of eqs. (2) as simple as possible.
φ.
•i
Pa72 a t a G=S219 gr /cm s e c
D=0.918 cm L=139.9 cm
300
predicted burnout heat flux
100
0.2 ƒ 04 predicted exit quali cy fig.. 1
TO
50 100
f i g . 2
h(P)
50 100
f i g . 3
II
The main aims that we want to attain in the extension of the correlation are the following:
a) To obtain an expression valid in a large range of variability.
b) To arrive at a simple analytic form, which allows us a quick prediction.
In order to obtain this simplicity we have preferred to give up the accuracy, avoiding the introduction of more corrective factors or more correlations which are valid only in a restricted range, even it they have an higher accuracy. The use of some corrective factors has been adopted only for the interpretation of burnout data external to the validity range: most probably these data are referred to a different motion path.
12
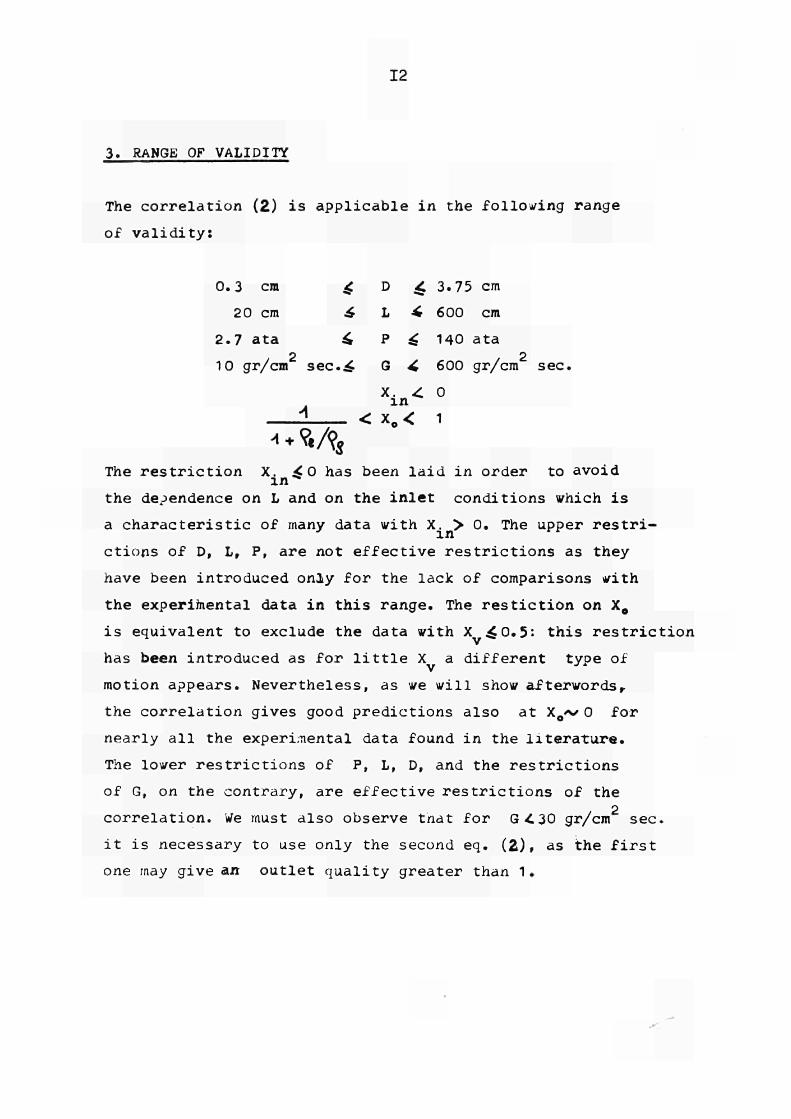
3. RANGE OF VALIDITY
The correlation (2) is applicable in the following range
of validity:
0.3 cm
20 cm
2.7 ata
10 gr/cm sec
Λ
¿ è
4
• ¿
<
D
L
Ρ
G
¿ 4
^
4
χ. <£
m χ« <
3.75 cm
600 cm
140 ata
600 gr/i
0
1
"♦V?, The restriction Χ. ¿ 0 has been laid in order to avoid
the dependence on L and on the inlet conditions which is
a characteristic of many data with X. > 0. The upper restri
ctions of D, L, P, are not effective restrictions as they
have been introduced only for the lack of comparisons with
the experimental data in this range. The restiction on Xe
is equivalent to exclude the data with X ^0.5: this restriction
has been introduced as for little X a different type of
motion appears. Nevertheless, as we will show afterwords,,
the correlation gives good predictions also at Χβ*>/ 0 for
nearly all the experimental data found in the literature.
The lower restrictions of P, L, D, and the restrictions
of G, on the contrary, are effective restrictions of the
correlation. We must also observe that for G ¿30 gr/cm sec.
it is necessary to use only the second eq. (2), as the first
one may give an outlet quality greater than 1.
13
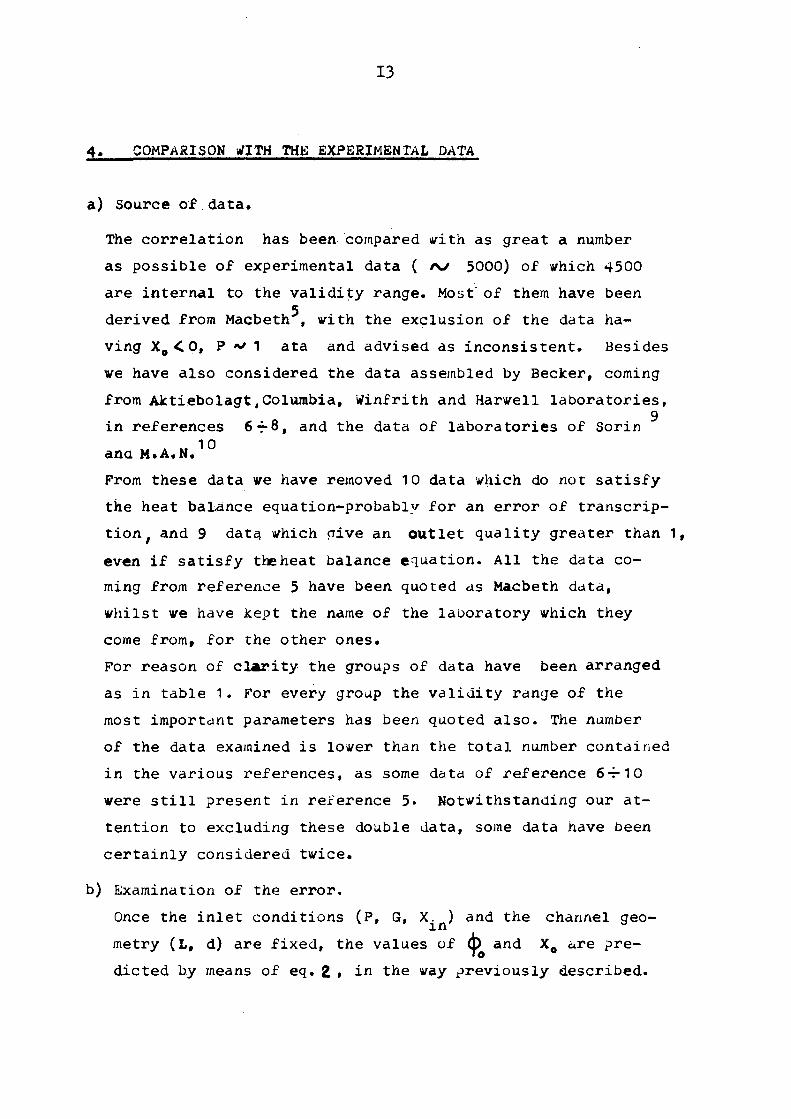
4. COMPARISON WITH THE EXPERIMENTAL DATA
a) Source of data.
The correlation has been compared with as great a number
as possible of experimental data ( A ^ 5000) of which 4500
are internal to the validity range. Most" of them have been
5
derived from Macbeth , with the exclusion of the data ha
ving Xe < 0, Ρ Λ/ 1 ata and advised as inconsistent. Besides
we have also considered the data assembled by Becker, coming
from Aktiebolagt.Columbia, tfinfrith and Harwell laboratories, 9
in references 6r8, and the data of laboratories of Sorin 10
ana M.A.N.
From these data we have removed 10 data which do not satisfy
the heat balance equationprobably for an error of transcrip
tion, and 9 data which crive an outlet quality greater than 1,
even if satisfy theheat balance equation. All the data co
ming from reference 5 have been quoted as Macbeth data,
whilst we have kept the name of the laooratory which they
corne from, for the other ones.
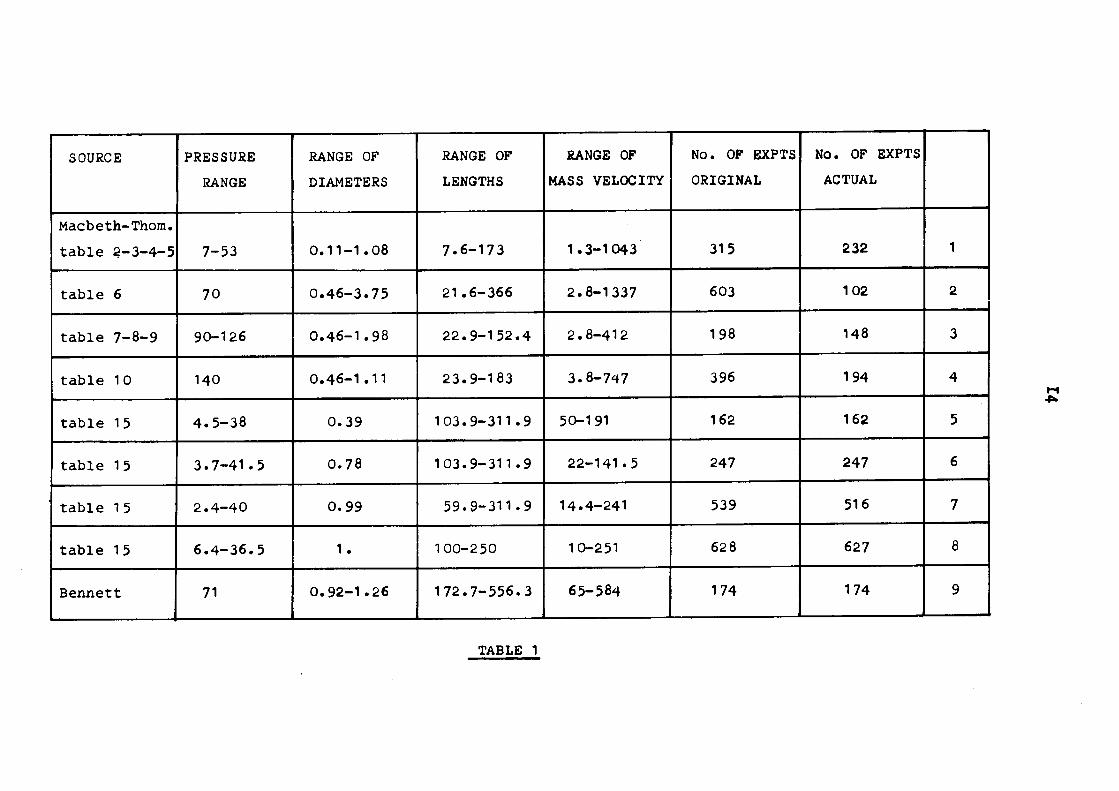
For reason of clarity the groups of data have been arranged
as in table 1. For every group the validity range of the
most important parameters has been quoted also. The number
of the data examined is lower than the total number contained
in the various references, as some data of reference 6r10
were still present in reference 5· Notwithstanding our at
tention to excluding these double data, some data have been
certainly considered twice.
b) Examination of the error.
Once the inlet conditions (P, G, Χ·η) and the channel geo
metry (L, d) are fixed, the values of Ò and Xe are pre
dicted by means of eq. 2 » in the way previously described.
SOURCE
Macbeth-Thorn,
t a b l e 2 - 3 - 4 - 5
t a b l e 6
t a b l e 7 - 8 - 9
t a b l e 10
t a b l e 15
t a b l e 15
t a b l e 15
t a b l e 15
B e n n e t t
PRESSURE
RANGE
7 - 5 3
70
90-126
140
4 . 5 - 3 8
3 . 7 - 4 1 . 5
2 . 4 - 4 0
6 . 4 - 3 6 . 5
71
RANGE OF
DIAMETERS
0 . 1 1 - 1 . 0 8
0 . 4 6 - 3 . 7 5
0 . 4 6 - 1 . 9 8
0 . 4 6 - 1 . 1 1
0 . 3 9
0 . 7 8
0 . 9 9
1 .
0 . 9 2 - 1 . 2 6
RANGE OF
LENGTHS
7 . 6 - 1 7 3
2 1 . 6 - 3 6 6
2 2 . 9 - 1 5 2 . 4
2 3 . 9 - 1 8 3
1 0 3 . 9 - 3 1 1 . 9
1 0 3 . 9 - 3 1 1 . 9
5 9 . 9 - 3 1 1 . 9
100-250
1 7 2 . 7 - 5 5 6 . 3
RANGE OF
MASS VELOCITY
1 . 3 - 1 0 4 3
2 . 8 - 1 3 3 7
2 . 8 - 4 1 2
3 . 8 - 7 4 7
50-191
2 2 - 1 4 1 . 5
1 4 . 4 - 2 4 1
10-251
65-584
No. OF EXPTS
ORIGINAL
315
603
198
396
162
247
539
628
174
No. OF EXPTS
ACTUAL
232
102
148
194
162
247
516
627
174
1
2
3
4
5
6
7
8
9
TABLE 1
SOURCE
tfinfrith
tfinfrith
Columbia
Becker
Becker
Becker
MAN
SORIN
t o t a l
PRESSURE
RANGE
70
70
5 2 . 7 - 7 0
2 8 - 9 6
2 . 7 - 2 2 . 7
70
3 2 . 5 - 1 4 1 . 5
8 0 . 7 - 1 4 5
RANGE OF
DIAMETERS
0 . 9 5 - 1 . 1 8
0 . 5 6 - 1 . 1 5
0 . 6 2 - 3 . 7 5
0 . 3 9 - 2 . 4 9
0 . 6 - 1 . 3 1
1 .
0 . 7 - 1 . 5 0
1 . 0 2 - 1 . 7 1
RANGE OF
LENGTHS
8 4 . 1 - 3 6 6
2 1 . 6 - 2 0 0 . 7
6 1 - 1 9 7 . 2
4 0 - 3 5 0
4 0 - 3 0 0
500
2 8 - 9 8
7 8 . 5 - 1 3 1 . 7
RANGE OF
MASS VELOCITY
1 9 9 - 4 1 1 . 5
4 0 . 5 - 4 4 0
6 4 - 5 5 8 . 6
1 4 . 4 - 5 0 0
1 0 . 2 - 2 6 4
7 2 . 5 - 3 0 5
9 3 . 8 - 3 6 1 . 5
4 8 - 3 1 4
No. OF EXPTS.
ORIGINAL
136
303
196
928
312
10
261
153
5561
No. OF EXPTS.
ACTUAL
132
284
167
917
311
10
230
98
4551
10
11
12
13
14
15
16
17
H
TABLE 1 (CONT.)
16
The error percent is determined with the following equation:
C; m S m 7 Φ° .100 where φ is the experimental value CPm ,
of the critical^burnout heat flux, whilst φ is the calcu
lated one. The mean error £ and the mean quadratic error O*
have been calculated as £ · ^ Síí δ*« ƒ - í í
η V η
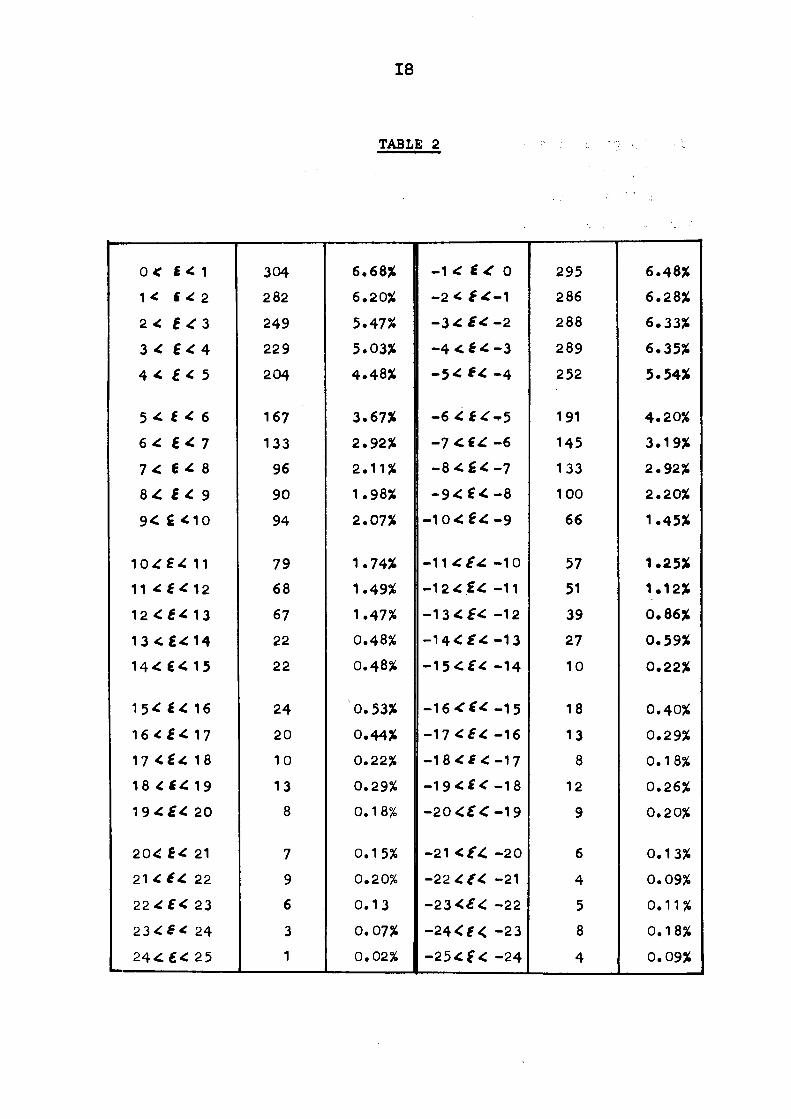
In table 2 there is the total number of data, the number
of data having an error less than 1%, the number of
data having an error between 1% and 2% and so on.
The results are Summarized in table 3, and in fig. 4 are
compared with the normal distribution of Gauss.
Out of 4551 experimental data we have a mean er
ror £ » 0.124, a mean quadratic error O" = 7.26% and the
85.5/4 of the data exhibits an error less than 10%.
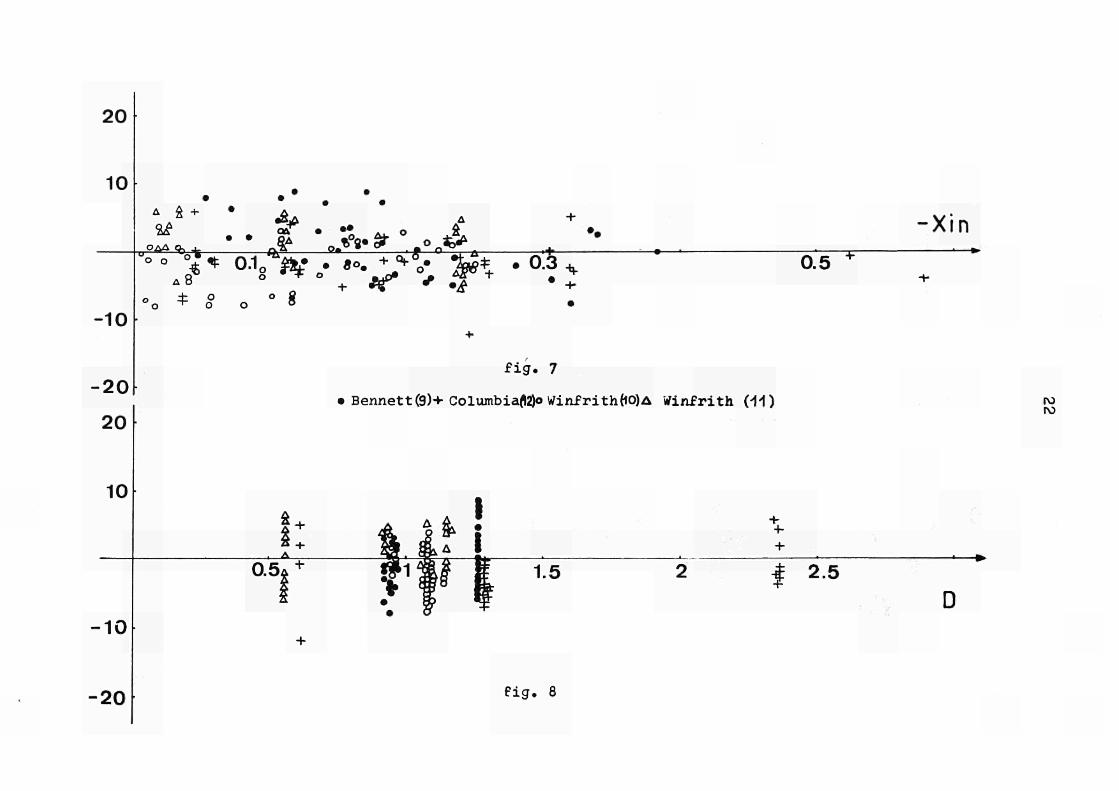
c) The error distribution versus tae various parameters.
For the sake of semplicity,the dependence of the errors on the
various parameters has been examined only for a restricted
range of the data. The error distribution versus D, G, L,
X. , for Ρ = 70 ata and 0.2 <X0< 0.3 is given in figs.
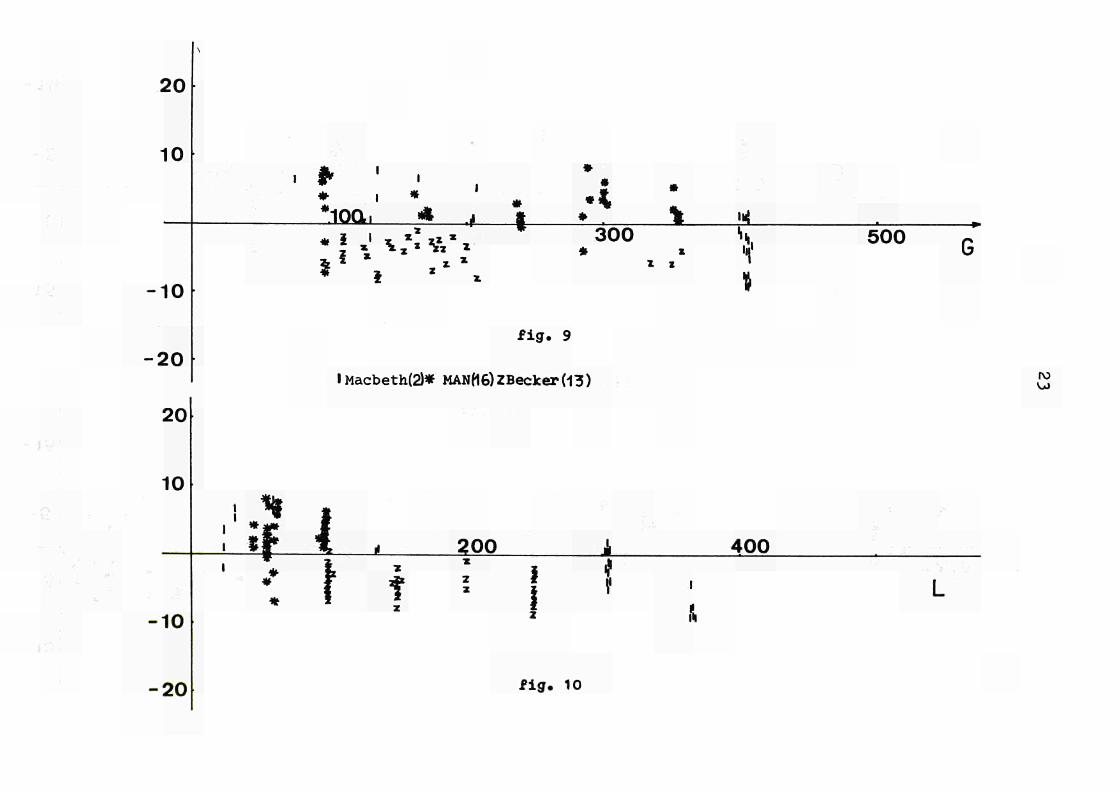
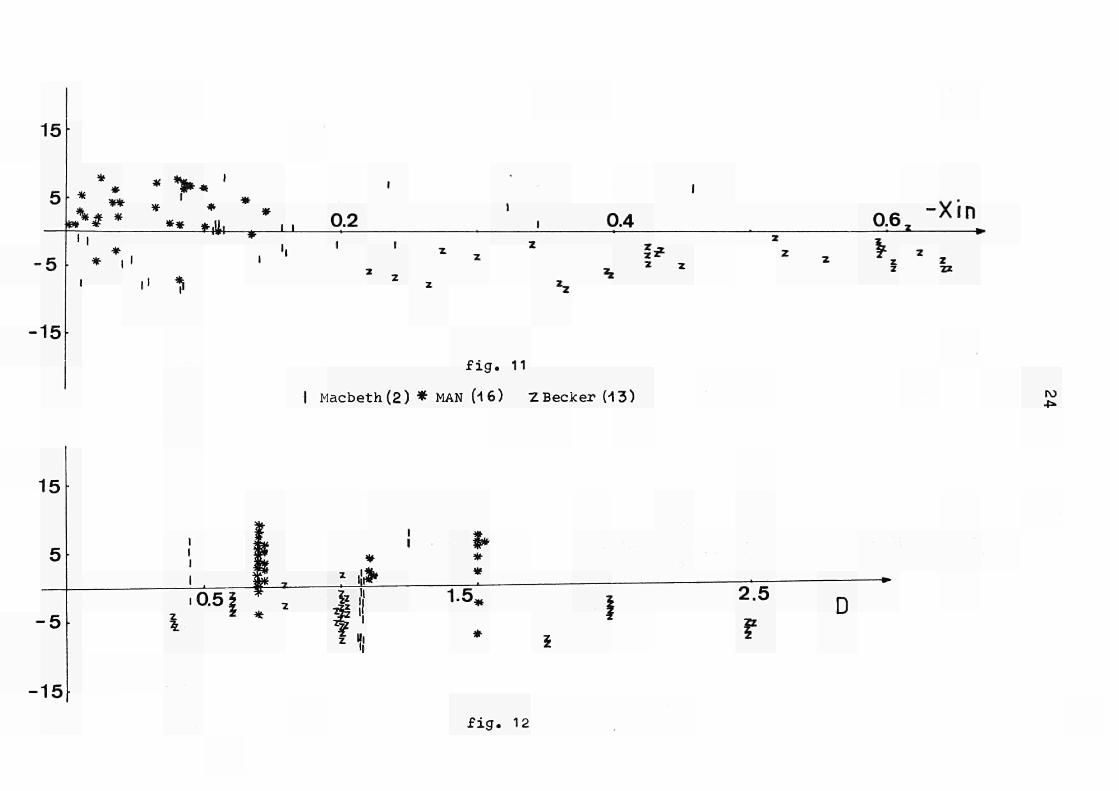
5 * 1 2 . Examining the diagrams in which the data of all the
laboratories are reported, it appears that the systematic error is
negligible, whilst the data of a single laDoratory exhibits
(figs. 9Í12) a separation of the errors: for instance at
Ρ = 70 ata, 0.2*Xo<0.3 Becker's data are overestimated
whilst Man's data are underestimated. For this reason it
is possible to improve the error of a single laboratory ap
preciably, but it is very difficult to improve the accuracy
of the predictions on the whole, if we give the same weight
to the various laboratories. For example a group of 132 data
of tfinfrith, which has at present a mean quadratic error
equal to 7.75%, gave an error Ç equal to 6% with a correla
tion previously checked.
17
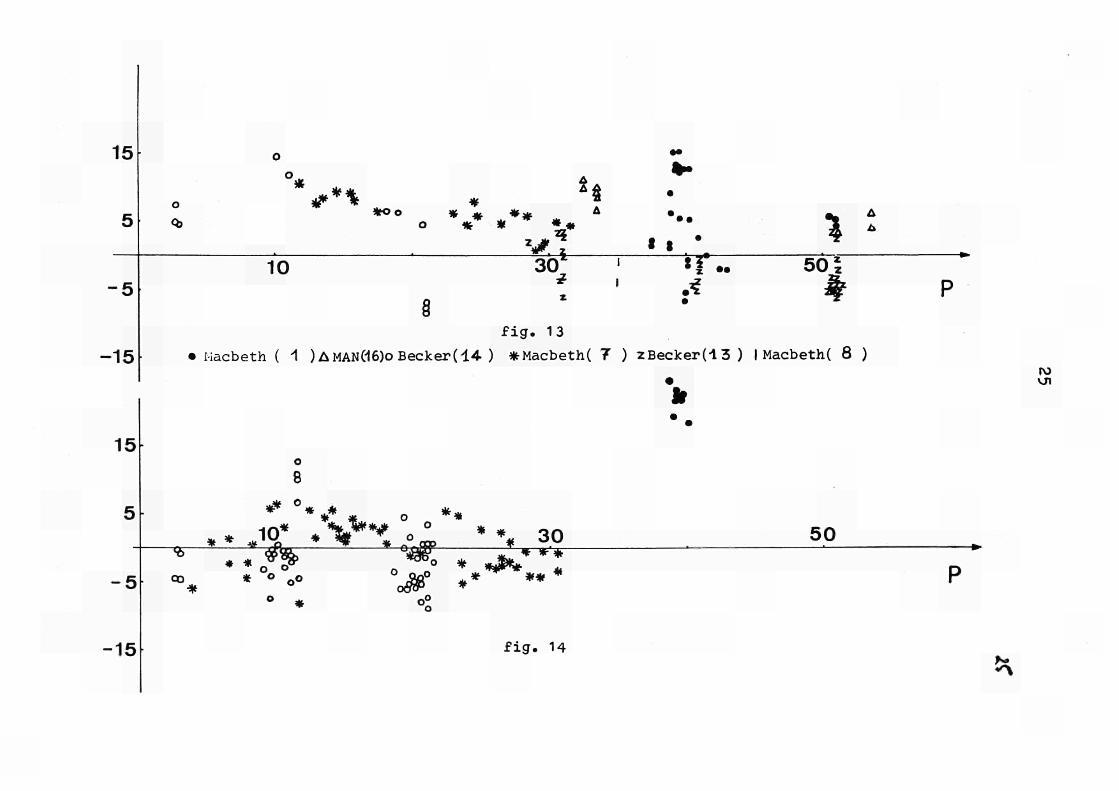
Fig. 13 gives the error distribution versus P, P<70 ata and
0.2¿X9<0.3, figs 14f"15 give the error distribution versus
P, P O O ata and 0.7^Χβ<0·8. Fig. 16 gives the error di
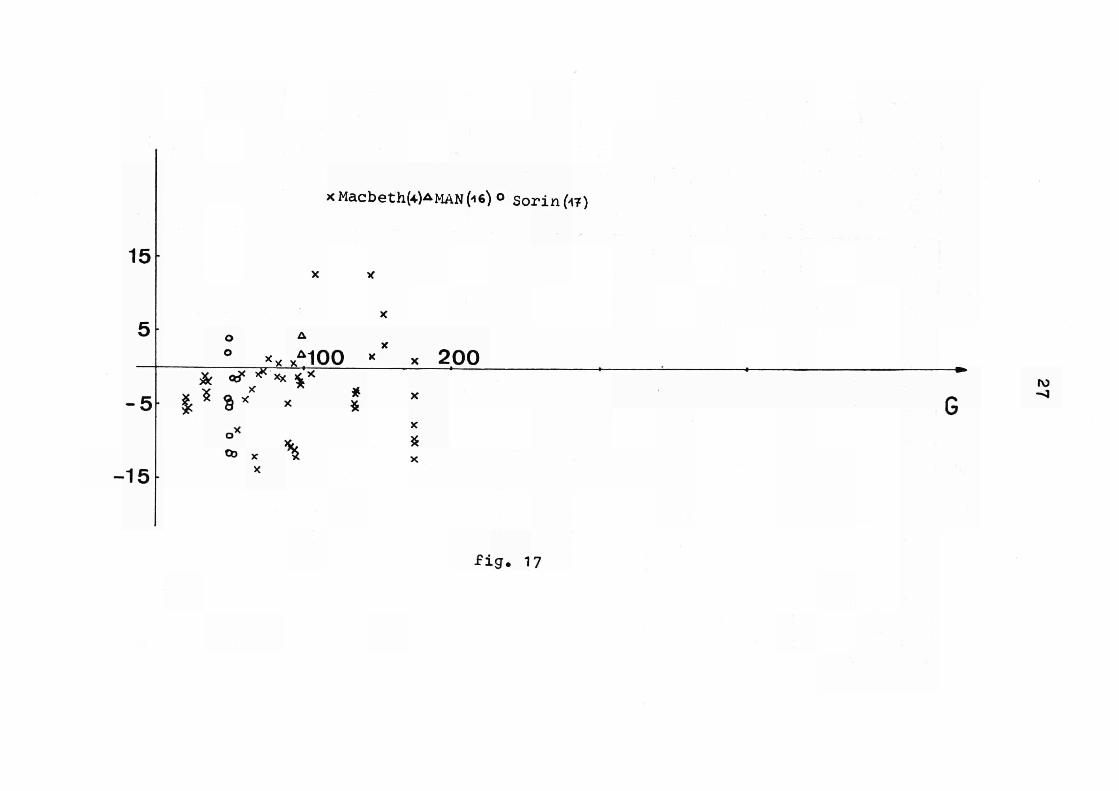
stribution versus P, P>70 ata and 0.2<Xo< 0.3. Fig. 17
gives the error distribution versus β, at Ρ » 140 ata and 0.2< X0<
0.3.Obviously it is questionable to consider only the data
with O.2^X0<O.3 as this can point out systematic errors
which are not present out of the all of data in general when
th<° critical heat flux is not a linear function of X# and,
on the contrary, hides some errors which are present. The only
justification for this way of proceeding, is the difficultv
in handling a great number of data* and the lack of clearness
in a diagram which contains many points.
The form of representation adopted makes the comparisons
amongst the various groups of data easier.
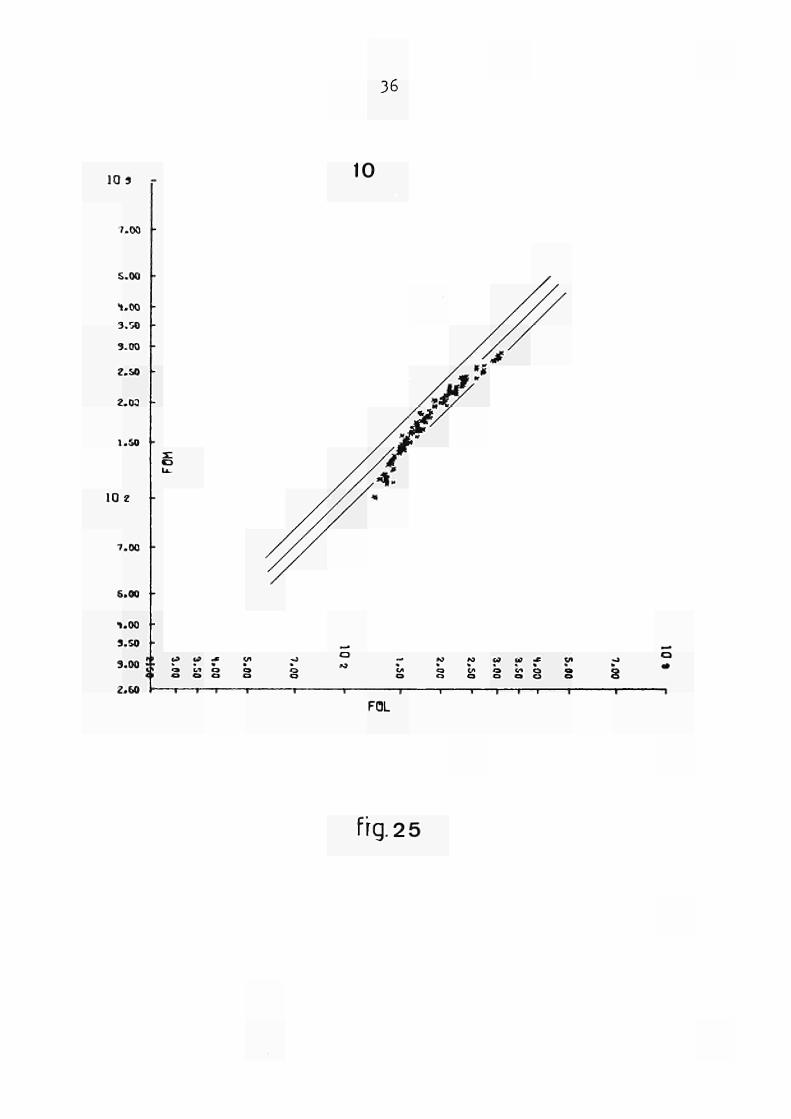
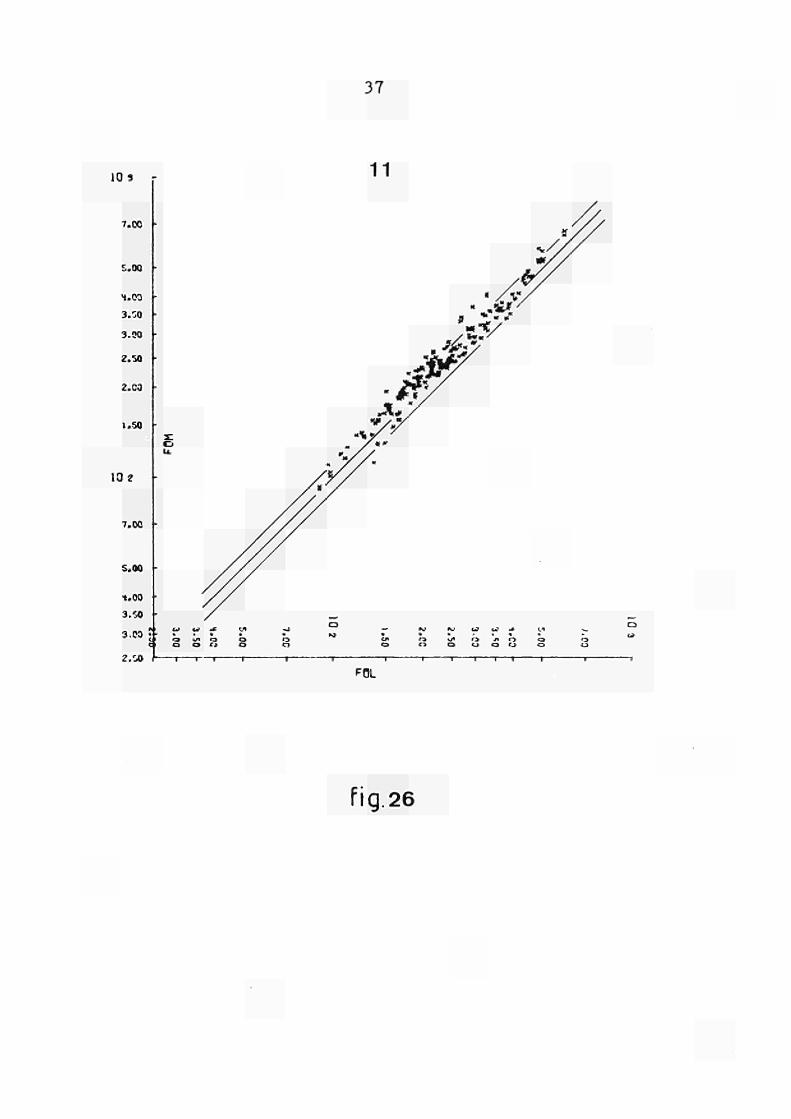
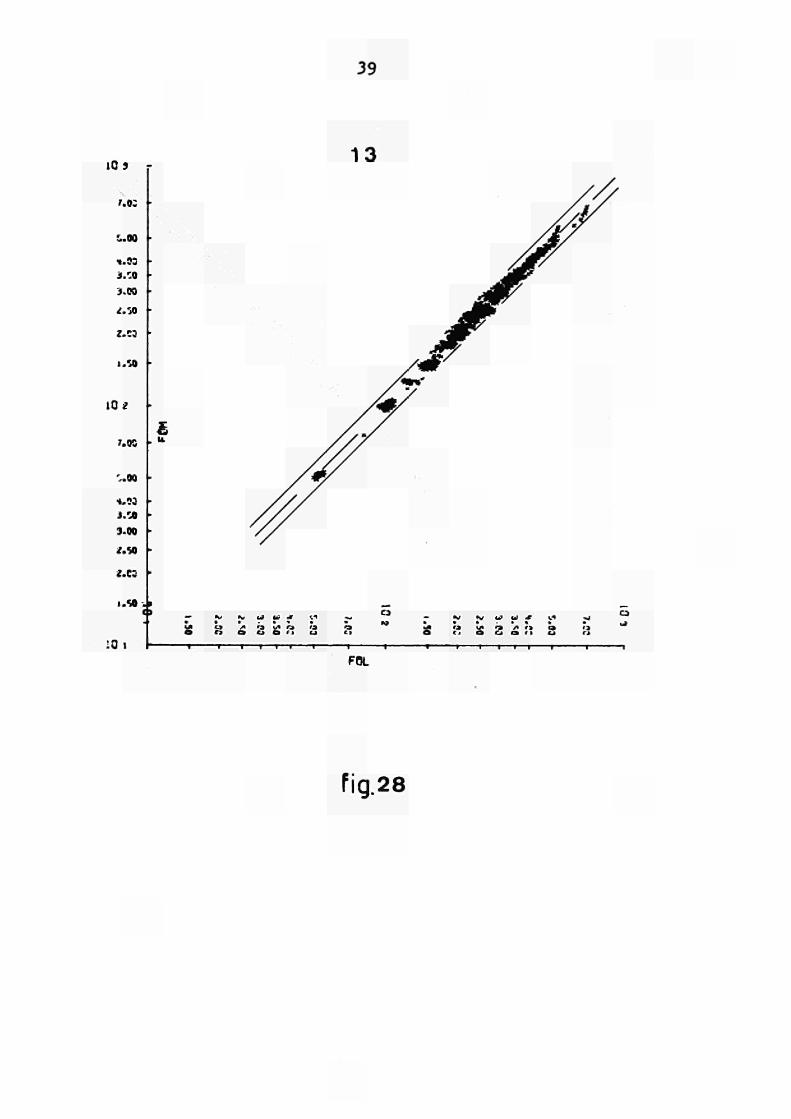
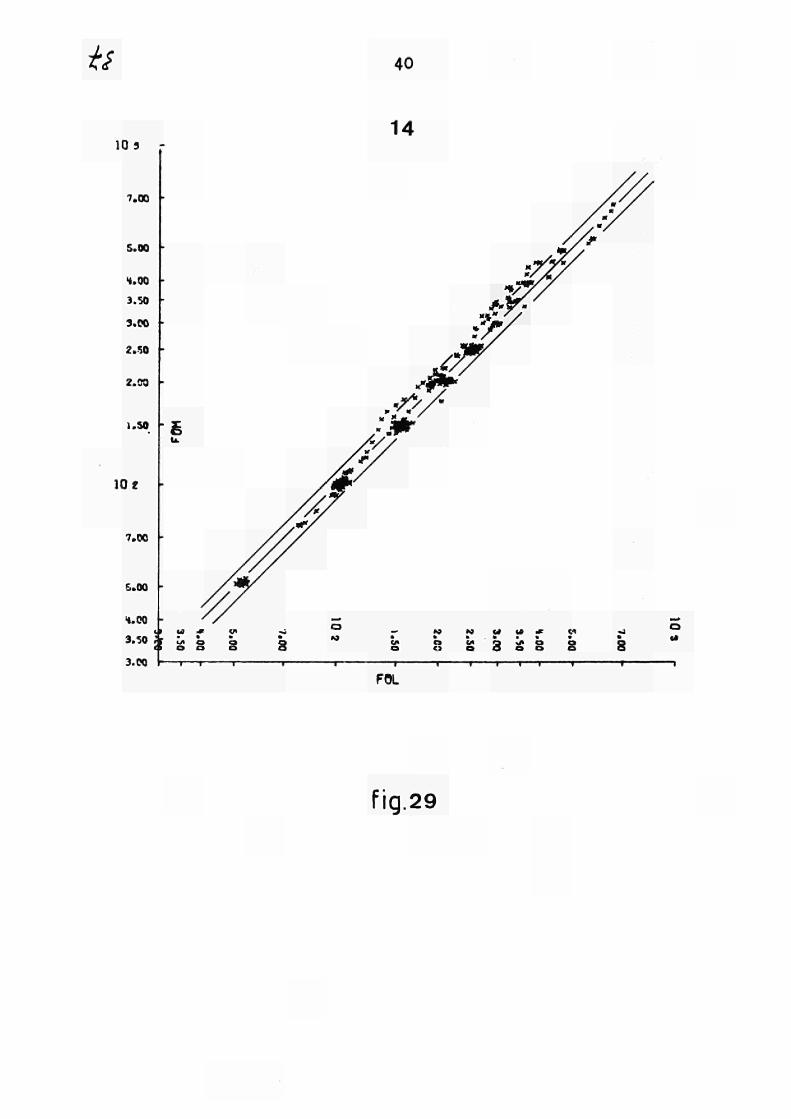
d) Examination of the errors in the single groups of data.
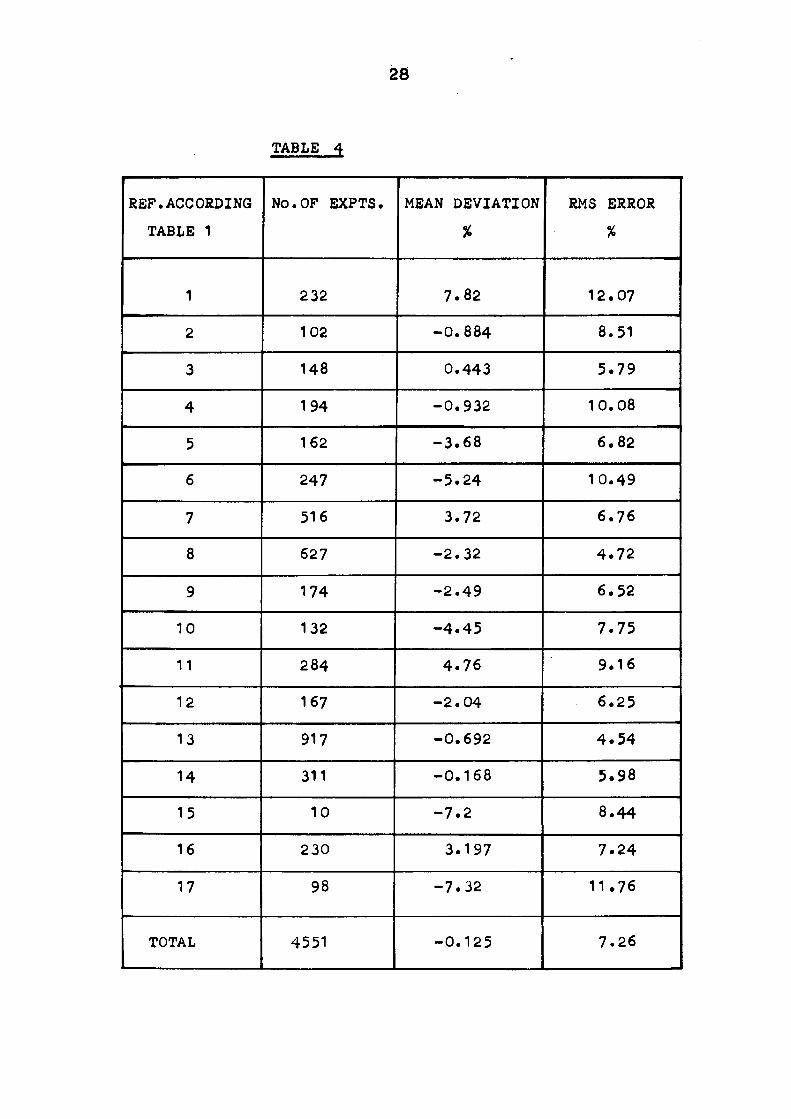
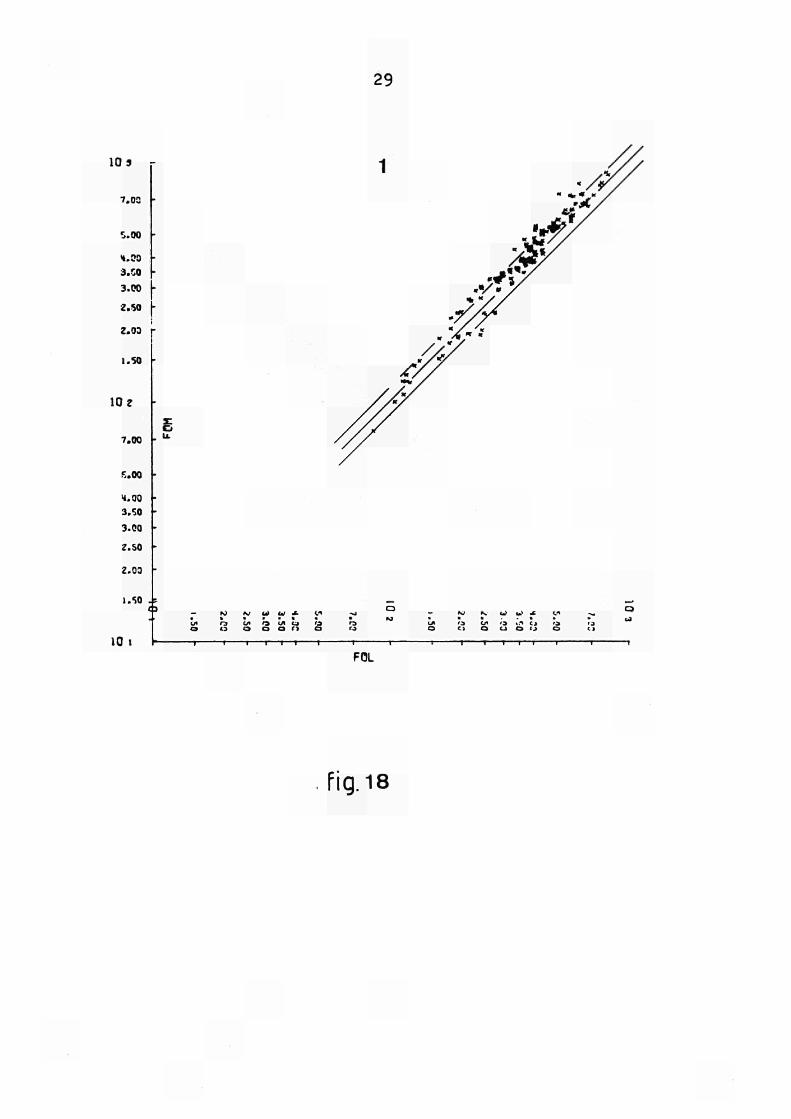
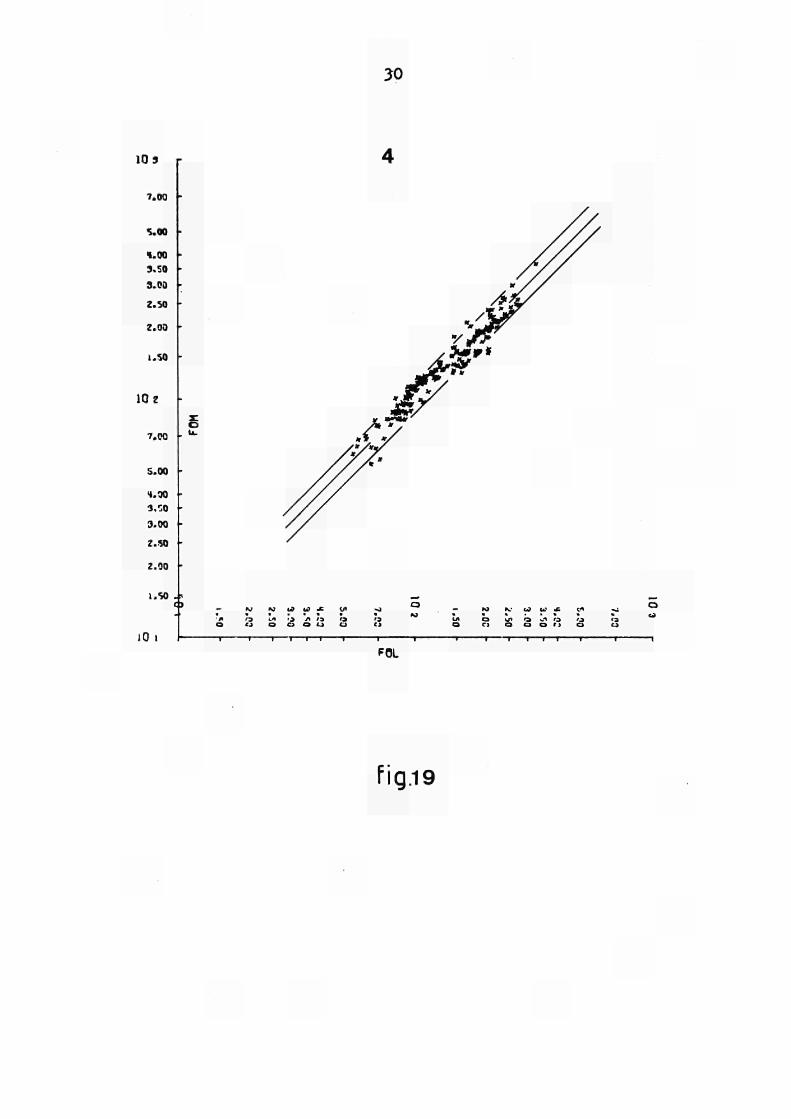
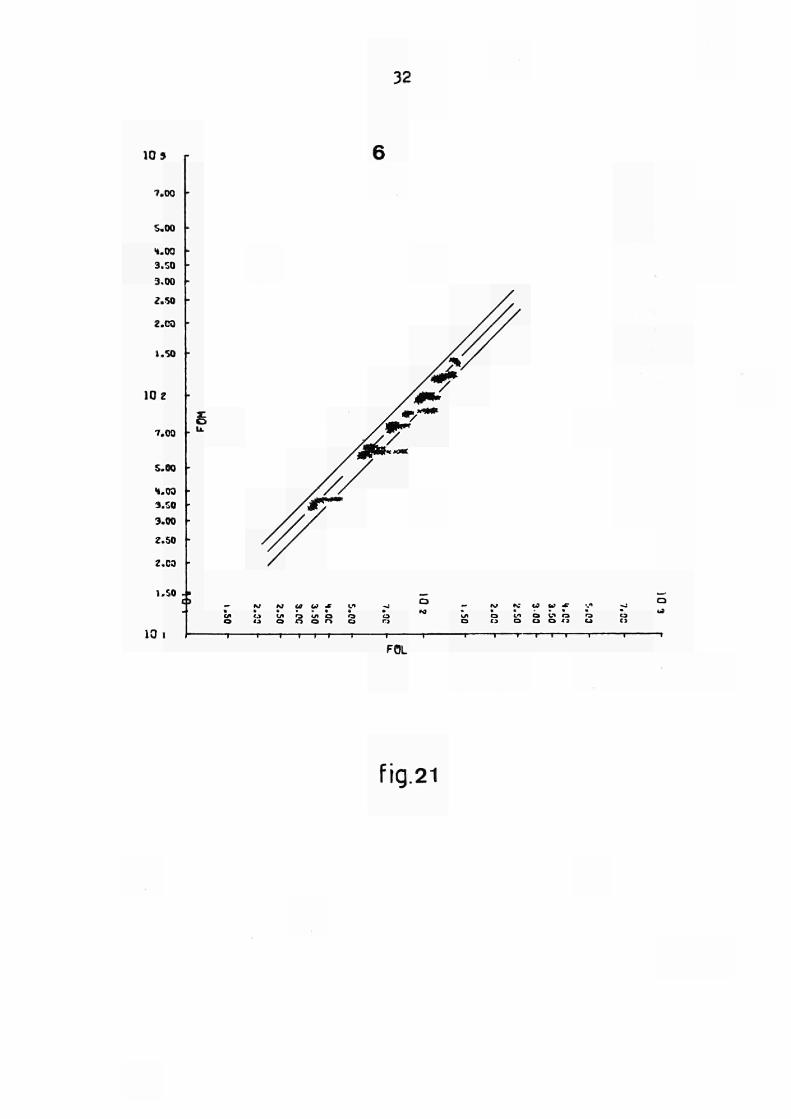
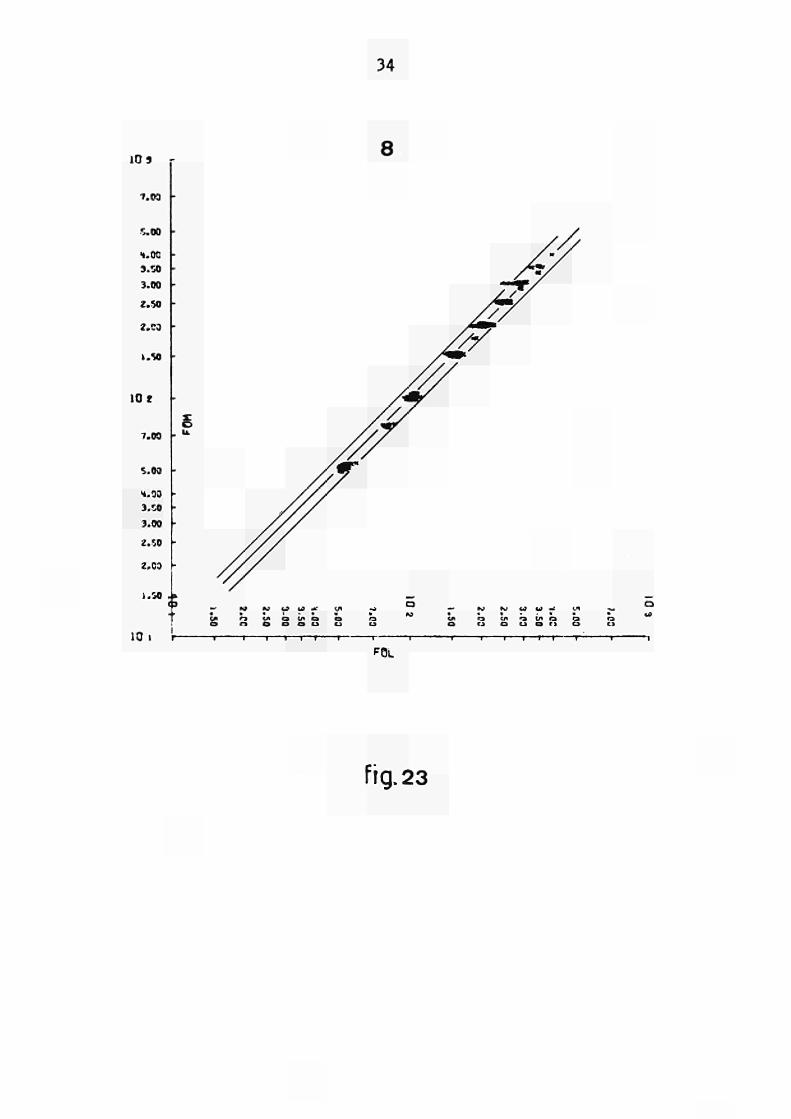
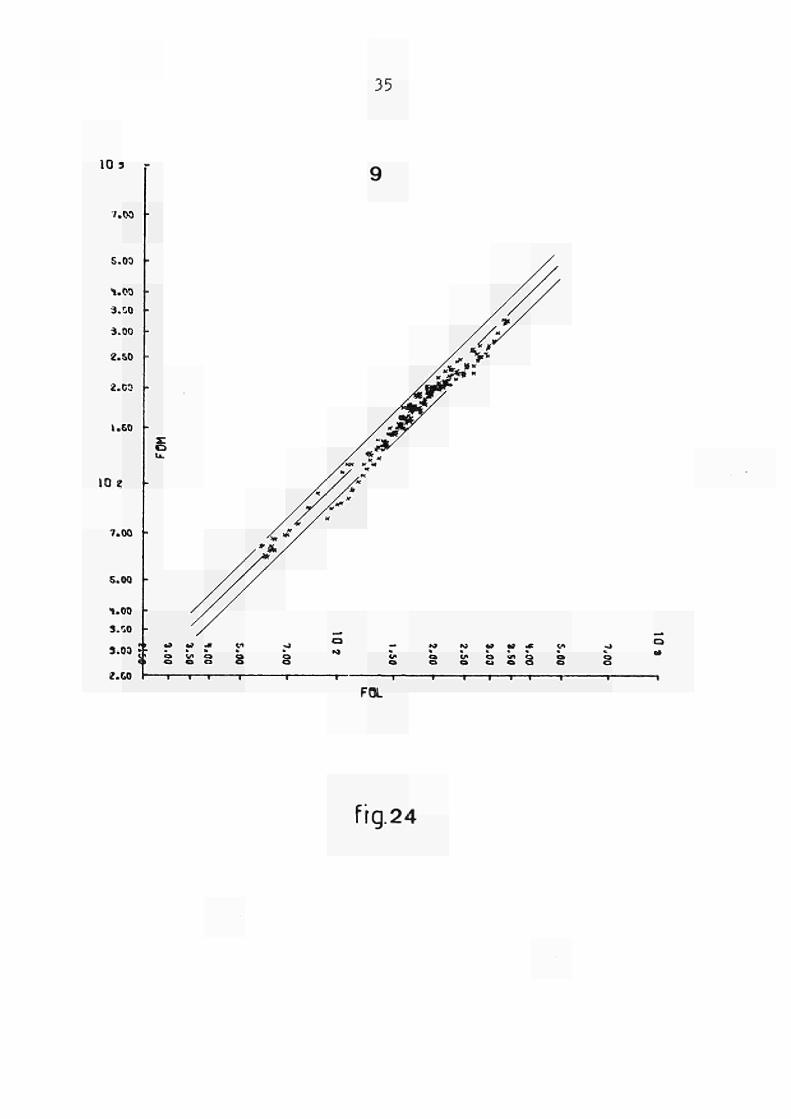
In table 4 we have reported the mean error £ , the mean
quadratic error 5 for every group of data, following the
subdivision of table 1. Figs. 18 4*31 give the values of the
fluxes calculated Versus the experimental ones in a biloga
rithmic scale. In table 4 one can see that few groups have
a mean quadratic error higher than 10%. Sometimes this er
ror is so high in owing to the presence of few data having
a strong shifting from the predictions. For instance 94 data
over 98 on the whole of the Sorin laboratory are predicted
with a mean quadratic error 0" equal to 8.7%, whilst the
Bennet t ( 9 ) + Columbia(42) O Wlnfr i th [AO) Δ tfinfrith (44) ro M
20
10
* ! 4-
A +
Ä +
Δ
4*100 * 300'
:
I s +
500
-10
t ι
-20 f ig . 6
20
10
Δ £ +·
■ΟΔΔ
V t • ·
αΓ · · · Sí ft°8·^ ° ^
0.5 +
-X in
O o
8
, ° 8
-10
ο ο
20
20
f i g . 7
• Bennet t (9)+Columbia(l2)o tfinf r i t h (ΙΟ)Δ Vinfr i th (Ί4) ro ro
10
-10
ft i
0.5< 1.5
+ +■
-f 2.5 -F D
-20 f ig. 8
20
10
- 1 0
!IÛOJ - * -
#
300 Α. ji
ι I ΐ *
500
20
20
f i g . 9
lMacbeth(2)* MAN(16)ZBecker(13) ro
10
-10
^ i-i 200
Î ζ ζ
i î 400
k
-20 f ig . 10
15
L * *
Jk- 0.2 0.4 0.6 -Xin ' ι
- 5
-15
* ι '
ΐ
ι ι ι* ζ ζ
f i g . 11
I Macbeth (2) * MAN (16) "Ζ Becker (4 3 )
ζ ζ ζ ζ ζ ζ
ro -ρ»
15
- 5
-15
0.5 Ι
* β» je Ι* f i!
i» * *
1.5
*
2.5
r D
f ig . 12
15
5
- 5
-15
o
<*> ° * * v V.!
10 30¡
§ f i g . 13
• Macbeth ( 4 )ΔΜΑΝ(16)ο Becker(14-) *Macbeth( 7
· ·
•
t t #
•
) zBecker(4 3 )
•
% ? 501
1 Macbeth( 8 )
Ρ
15
- 5
-15
o
8
10* ♦ V * * * o° * % 30 50 *> **fe, — ^ # ¿ H ^ OD * O o 0 Of * * * *
f ig . 14
° * «S
ro
5>
1 5 ¿Macbeth( 5 ) Z B e c k e r ( 4 3 ) *Macbeth( 6 ) I Macbeth( 8 )
ζ
<* lb ™ \¿, Ι ι ·* ZZZI ,| il ,| z
i ef ff 'li " · I t i ' ι '* f? 1 ^ ^ * Δ Δ* « " h * * * ' *
ι ,»Λ * Α Λ Δ Δ Δ ^ Δ * z z z
* f i g . 15
Γ . ι _ Δ . . Δ» . « * * » * ΑΑ - ζ * ζ
i « tl
* *ΜΑΝ (46)vsorinf l?)oMacbeth(3) ZBecker (43)
15f I
t i* α> ° o
co o o
-8 . · -ΗΒΓΛΡ * w
o v
f 90? ° 110 *» W-I30 - 5| v ■ v * >° 0 s,
^ v * * o 8
V
V v
v V
-15 f ig . 16
ζ
IO
xMacbeth(4)*MAN(i6)o s o r i n g )
15
o o
X X
- 5
-15
χ x
k100 200 « «
ro
o
χ \ X
f i g . 17
28
TABLE 4
REF.ACCORDING
TABLE 1
1
2
3
4
5
6
7
8
9
10
11
12
13
14
15
16
17
TOTAL
No.OF EXPTS.
232
102
148
194
162
247
516
627
174
132
284
167
917
311
10
230
98
4551
MEAN DEVIATION
%
7 .82
- 0 . 8 8 4
0 . 4 4 3
- 0 . 9 3 2
- 3 . 6 8
- 5 . 2 4
3 .72
- 2 . 3 2
- 2 . 4 9
- 4 . 4 5
4 . 7 6
- 2 . 0 4
- 0 . 6 9 2
- 0 . 1 6 8
- 7 . 2
3 .197
- 7 . 3 2
- 0 . 1 2 5
RMS ERROR
%
12.07
8.51
5.79
10.08
6.82
10.49
6.76
4.72
6.52
7.75
9.16
6.25
4.54
5.98
8.44
7.24
11.76
7.26
29
10 5 -
7.oa r
s.oo
«t.oo 3.G0
3.00
Z.50
2.03 Γ
Ι.SO -
10 Ζ
7.00
5.00
«.90 3.ςο '
3.00
Z.SO
2.03
Í.SO . !
10 ι
Ci li.
N i t O
o
* j
. O l
O
u>
o o
o i d
FOL
fig. 18
10 9 r
30
7.00
■s.oo
1.00
3.50
3.00
2 . »
2.00
i.50
10 2
7.00
S.OO
4.00
3,50
3.00
Ζ.ΐΟ
2.00
l . S O . »
10 ι
hj »s; u> ω ·*.
o o u W W ' • » O O Γ)
POL
fig.19
31
10 9
10 z -
Fig.20
10 9
7.00
S.00
32
1.00 3.30 3.00 2.S0
2.C0
l.SO
10 2
7.00
5.00
1.00 9.5P 3.00
Ζ .50
Z.CO
E iL·
l .SO - ·
10 ι o o η o r»
FOL
u w « Q l i Γ3 ca o * *
O
fig.21
33
10 3
7.00
t.OO 3.S0
3.00
2.S0
2.09
l.SO
E u. 10 2
fig.22
34
10 9
7.00
5.00 '
«.oc
3.S0
3.00
2.50
2.S3
l.SO
10 e
7.00
s.oo
* .03
3.50
3.00
2.50
2.03
l.SO J»
8
10 ι ι o o o
—i—ι—r—
tí u ^ 'n ¿n ò υ o r>
O
POL
fig. 23
35
10 3
7.00
S.00
1.00 3.50
3.00
2.50
2 . CO
1.50
10 2
7.00
5.00
1.00 3.50
3.03 Î;
2.50
O u.
<j w -« 1« CO
f
w k O O
1 1
3 1
o o
• 1
FOL
f'rg.24
36
10 3
7.00
5.00
1.00
3.50
3-00
2.50
2.03
1.50
102
7.00 -
6.00 -
1.00 ■
3.50 r
3.00
2.60
10
. . . O l/t O
α
S —τ
-
FOL
frg.25
37
10 3
7.0O
5.00
1.00
3.50
3.00
2.50
2.00
1.50
10 2
7.00
5.00
1,00
3.50
3.03 ;
2.50
a:
11
POL
fig.26
38
10 9
7.00
5.00
1.00
J.50
3.00
2.50
2.C0
l.SO
10 2
7.00
5.00
1.00
3.50
3.00
2.SO
2.C0 f
ι > « I
. .50 ï-
12
3 — ί
ο o -ι—r-
8 W -c vi Ci
FOL
fig.27
39
10 9
/.OC
5.00
1.93
3.50
3.00
¿.■Vt
Z.C3
l.SO ■
10 2
7 . « ■
'-.00 ■
1.93 ■
i.5Q ■
3.00 -
2.50
2.C3 h
l.SO φ
10 1
E u
13
Ν» ta UÌ Λ . . . . yi -3 t,. o
O O O '■ 'a
—r- — » —
* . i j
FOL
fig.28
is 40
14 10 9
7.00
S.00
H.OO
3.50
3.00
2.50
2.00
l .SO ë
10 ζ
7.00
5.00
1.00
3.50
3.00
_ . Οι
o I
FOL
ta
• Q C]
1
1«
. tn O
1
t *
3
»
tf rfr
• * v/* O
O o
%fi • s 1
« i
. 8 1
o ta
\
fig.29
41
16 10 9
7.00
5.00
1.03
3.50
3.00
Z.SO
2 . CO
1.50
10 2
7.00 -
5.00 -
1.00
3 .50
3.00
Ζ. 50
Ζ.03
1.50
l O ι
i\J 'S. W U' .*
O O f >
V tv t.' Λ
FOL
fig.30
1000
42
17
FOM
100
100 FOL 1000
fig.3i
43
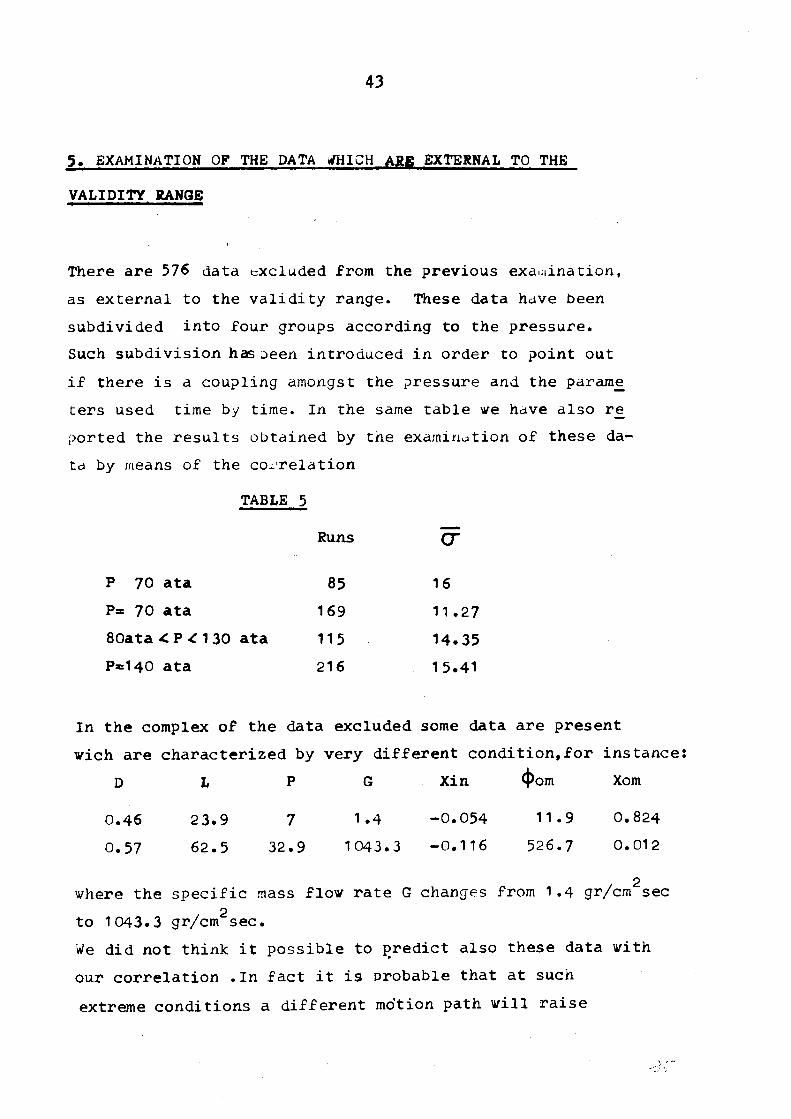
5. EXAMINATION OF THE DATA JUICH ARE EXTERNAL TO THE VALIDITY RANGE
There are 576 data excluded from the previous examination, as external to the validity range. These data have been subdivided into four groups according to the pressure. Such subdivision has oeen introduced in order to point out if there is a coupling amongst the pressure and the parame ters used time by time. In the same table ve have also re ported the results obtained by the examination of these data by means of the coxrelation
TABLE 5
Runs 0"
Ρ 70 ata 85 16 P= 70 ata 169 11.27 80ata <Ρ < 130 ata 115 14.35 P=140 ata 216 15.41
In the complex of the data excluded some data are present wich are characterized by very different condition,for instance!
D L P G Xin φοπι Xom
11.9 0.824 526.7 0.012
where the specific mass flow rate G changes from 1.4 gr/cm sec 2 to 1043.3 gr/cm sec.
tfe did not think it possible to predict also these data with our correlation .In fact it is probable that at such extreme conditions a different motion path will raise
0.46
0.57
23.9 62.5
7
32.9 1.4
1043.3 -0 .054 -0 .116
44
and different relation between the critical heat flux and
the various parameters will be set up. In any case the 576
data, external to the validity range, have been compared with
the predictions of the correlation. The shafting has been
examined by collecting the data in accordance with the rea
sons of the exclusion: G<10, G >600, D<£0.3, L<^20, X0<
As some data are external to the validity range for more than
a parameter, we have established an order of precedence first
collecting the data excluded for G, and then the data exclu
ded for D, for L and for Xe.
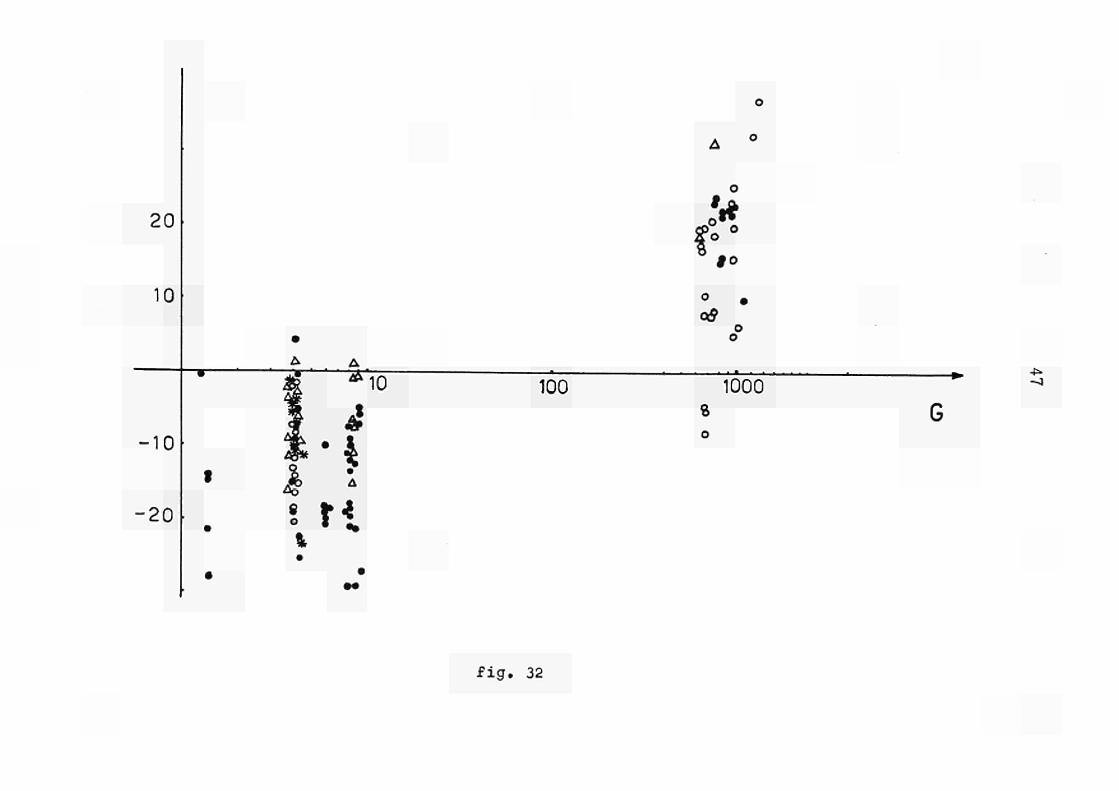
G>600
In fig.J2 we have reported the data with G>600 (33 data):
for values of G so high there are very low outlet qua
lities, so that many of chese data are excluded also for X0
which is less than 1/(1 ♦ **/γ„ )· The difference amongst the
flux experimentally measured and the flux predicted by the
correlation is strongly positive, except for three data.
A very simple correction may be introduced by multiplying
the critical heat flux, calculated by means of eq. 2, by
the corrective factor 1.15. In sucn a way the mean quadra
tic error changes from 19.2% to 12.35/É, obviously the great
value of the error is owing to the presence of the tree da
ta with strongly negative errors.
p
G O O gr/cm sec.
2 The 78 data with G<10 gr/cm sec. are reported also in
fig. 32,. Also in this case the error of the predictions
exhibits a constant sign and most of the data is overesti
mated, indipendent of the pressure. As we have found no de
pendence of the error on some parameters, we have tnought
**H
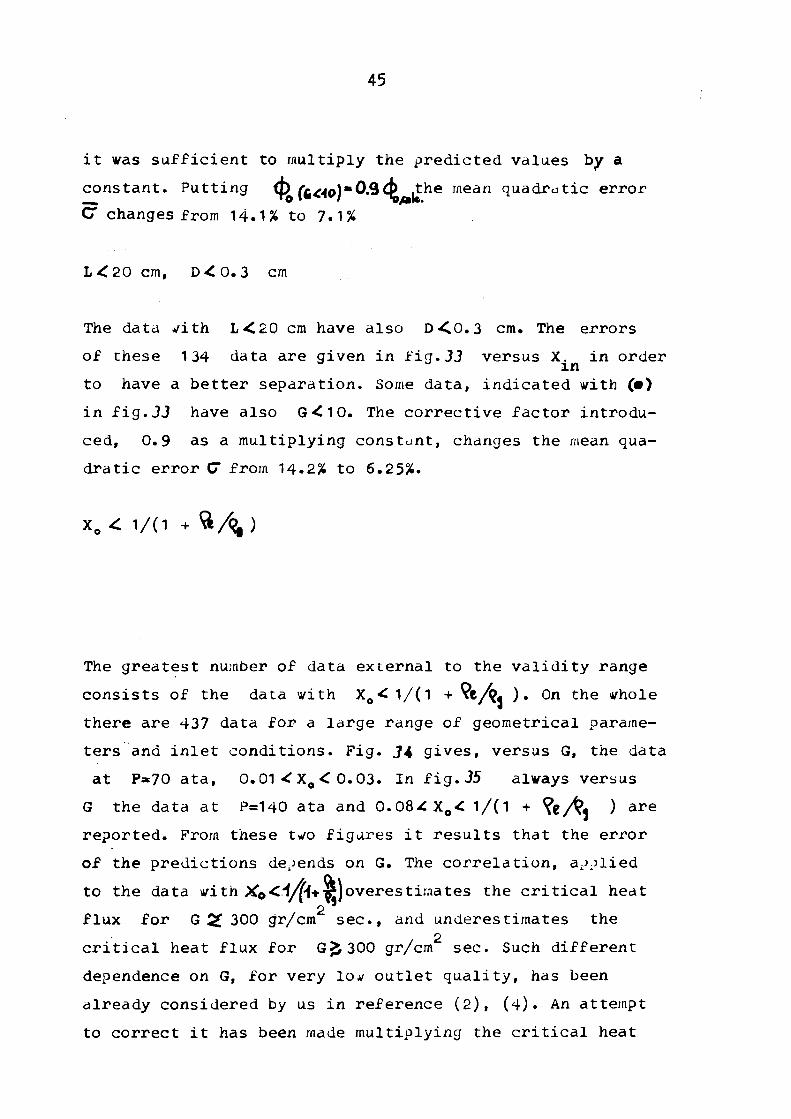
45
it was sufficient to multiply the predicted values by a
constant. Putting φ ffi*fo)"0.9Ó .the mean quadratic error
C changes f rom 14.1% to 7.1%
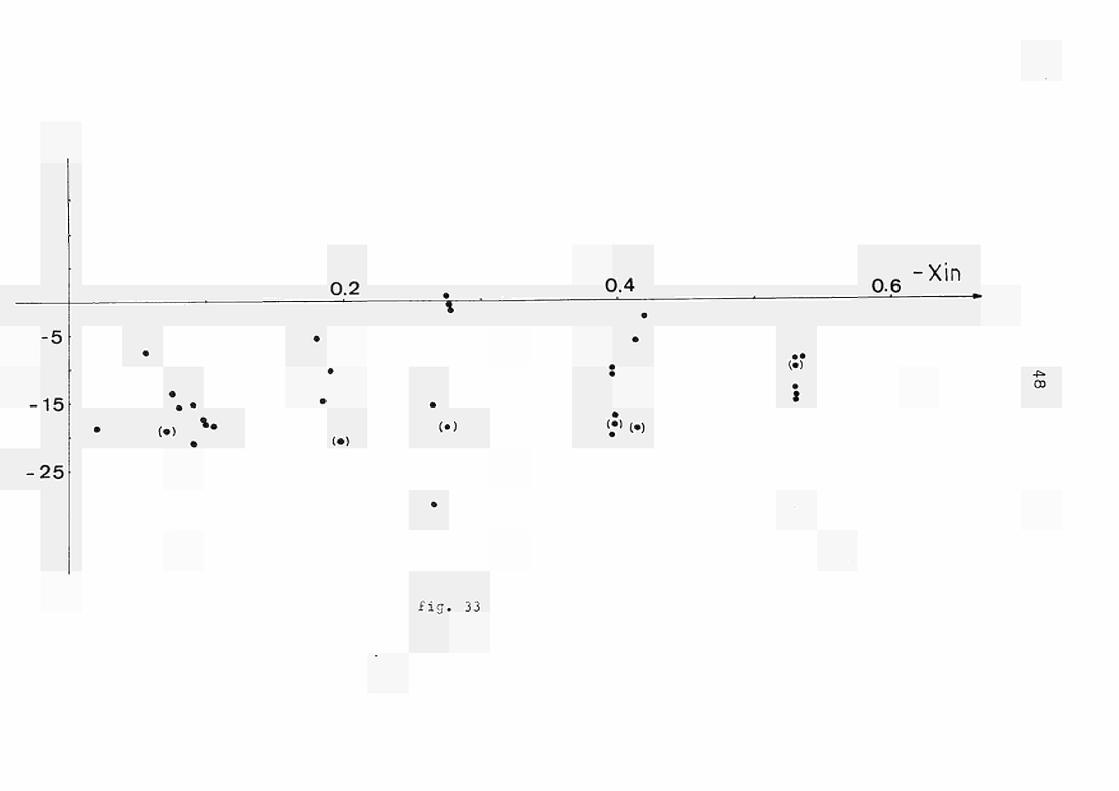
L<20 cm, D< 0.3 cm
The data ^ith L<20 cm have also D<0.3 cm. The errors
of these 134 data are given in fig.JJ versus X. in order
to have a better separation. Some data, indicated with (·)
in fig.JJ have also G O O . The corrective factor introdu
ced, 0.9 as a multiplying constant, changes the mean qua
dratic error (J from 14.2% to 6.25%.
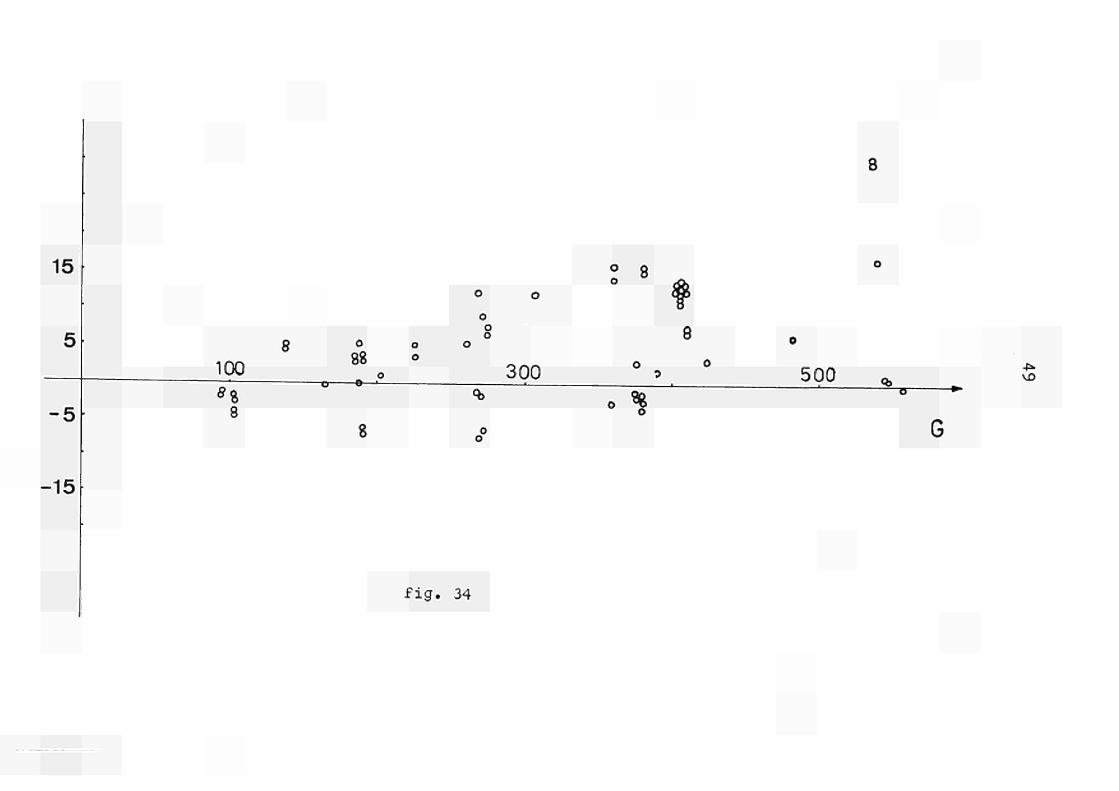
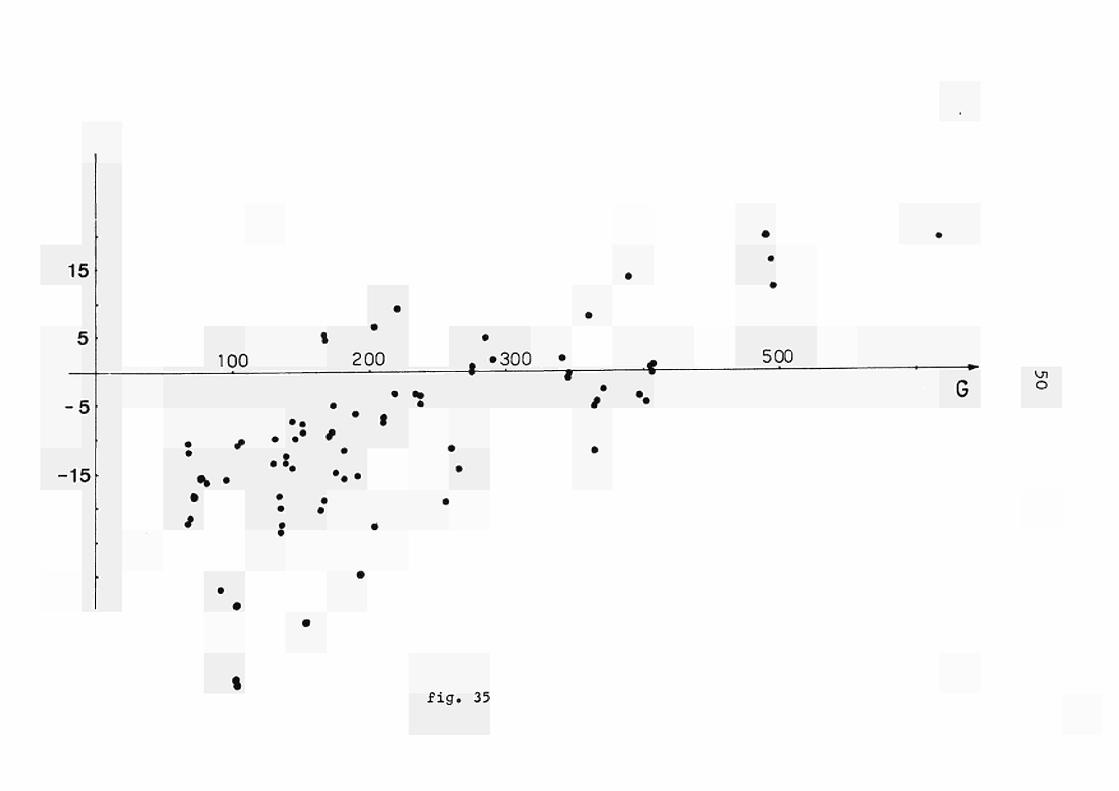
X 0 < 1/(1 + $ / ^ )
The greatest number of data external to the validity range
consists of the data with X0< 1/(1 + *&/$· )· θ Λ the whole
there are 437 data for a large range of geometrical parame
ters and inlet conditions. Fig. J4 gives, versus G, the data
at P=70 ata, 0.01<X0< 0.03. In fig.J5 always versus
G the data at P=140 ata and 0.08«¿ X0< 1/(1 + ?e/^« ) are
reported. From these two figures it results that the error
of the predictions depends on G. The correlation, applied
to the data with Χ0<'ί/|Ί+#)overestimates the critical heat 2 flux for G ̂ 300 gr/cm sec, and underestimates the 2 critical heat flux for GJ5 300 gr/cm sec. Such different
dependence on G, for very lo*/ outlet quality, has been already considered by us in reference (2), (4)· An attempt to correct it has been made multiplying the critical heat
46
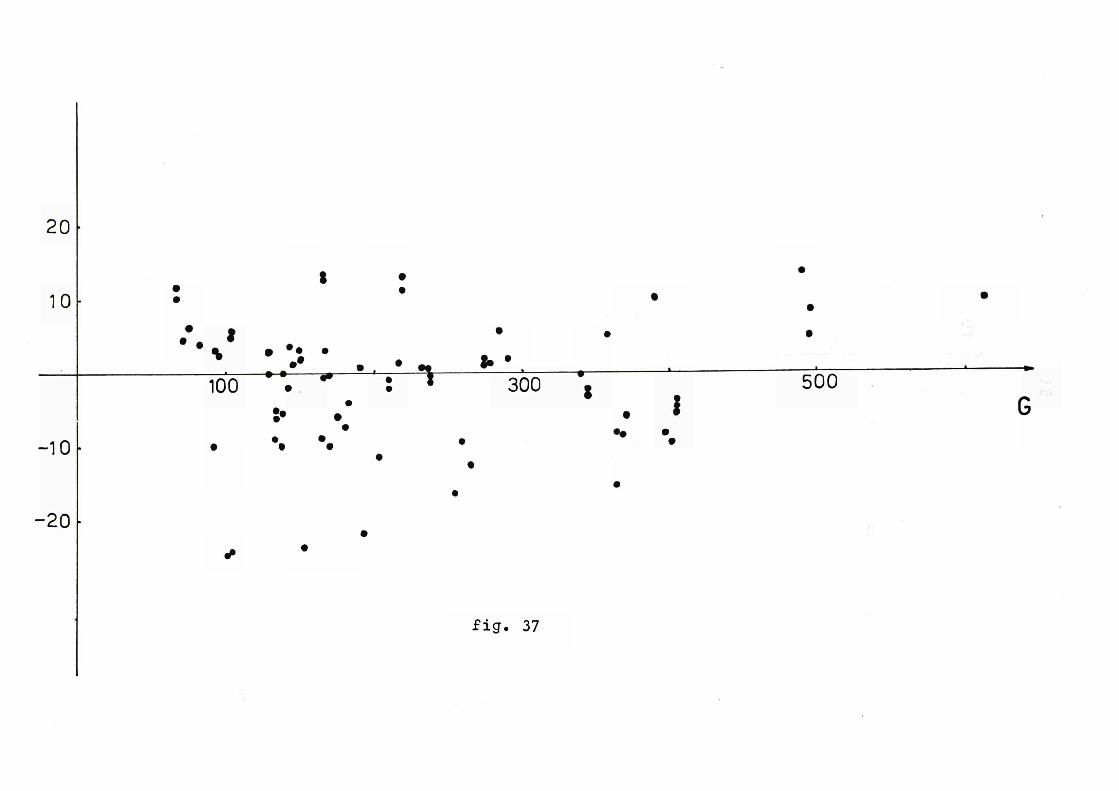
flux predicted by correlation by the corrective factor 0 15
η = 0.425 G .In figs. 36 and 37, we have reported the errors for the same points of figs. J4 andJ5-, after the introduction of the corrective factor. The mean quadratic error changes from 13.85% to 9.9%. In all the cases considered, when some corrective factors are introduced, it is necessary to calculate the outlet quality again.
20
10
-10
-20
h
I
•
•
•
à' *ιο
1 ** i·} ¿
Δ
? r i •
· ·
100
Ät
# o
o
o o
1000 ft
o
- 3
f i g . 32
-5
- 15
- 2 5
•
•
• • ·
•
0.2
•
•
•
( · ) ( · )
0.4
<·> C·)
0.6 - X i n
-Ρ» OD
f i g . 33
-15
f i g . 34
8
15
- 5
100
8
8 o 88
-o θ -
8
o o o o o
300
o o
°o 8
θ
%
500 -t*
15
- 5
-15
100 200 . ·300 · - I — r 500
o
• * . . · # * t / " ·
% ·
f ig . 35
20
10
-10
20
\ %
100
-
8
% o
0 . ö—■
8
8
8̂-ώ H
300 500 *
8
f i g . 36
20
10
-10
-20
% · ' · ·
100 ¿^Λ ι» ·
300 500
: · « · · .
f ig . 37
53
NOMENCLATURE
D diameter" cm
G specific mass flowrate gr/cm sec
H latent heat of vaporization joule/gr
L heated length cm
Ρ pressure ata
X. inlet quality in ^ J
X outlet quality
X volume flowrate quality
Ρ density gr/cm
φ critical heat flux watt/cm
Subscripts
g steam
1 liquid
54
BIBLIOGRAPHY
(1) - G.C.CLERICI-S.GARRIBA-R.SALA-A.TOZZI MA catalogue of burnout correlations for forced convection in the quality region·· EUR 3300.e - december 1966.
(2) - G.C.CLERICI-S.GARRIBA-R.SALA-A.TOZZI "Studies on linear correlations.Part 2M
To be printed as EUR report (3) - G.C.CLERICI-S.GARRIBA-R.SALA-A.TOZZI
"Alternative forms for some burnout correlations·· ENERGIA NUCLEARE -Volume 14 May 1967 Number 5
(4) - G.C.CLERICI-S.GARRIBA-R.SALA-A.TOZZI "Comparison between Beker correlation and some alternative linear forms" ENERGIA NUCLEARE -Volume 14 June 1967 Number 6
(5) - B.THOMPSON-R.V.MACBETH "A compilation of world data with accurate correlations" AEEW-R 356 1964.
(6) - K.M.BECKER"An analytical and experimental study of burnout conditions in vertical round tubes" AE-RTL-778 January 1965.
(7) - K.M.BECKER"A comparison of two burnout correlations" AE-RTL-799 August 1965.
(8) - K.M.BECKER»some remarks on correlating the Harwell round tube burnout data"AE-RTL-855 May 1966.
55
(9) F.BIANCONEA.CAMPANILEG.GALIMIM.GOFFI
"Forced convection burnout and hydrodynamic
instability experiments for water at high
pressure.Part 1" Rapporto τ/363 Marzo 1965. EUR 2^90. e.
(lO)F.MAYINGERO.SCHADE.WEISS "Investigation
into the critical heat flux in boiling"
Report N°090301 Contract N°05761RDD q.d.N°III.1.8
May 1966.
¿UR 33V?. e
¡m Κ^ΓιΓ
ifcjfi rt
ΐ»«*$! NOTICE TO THE READER
i ¡ υ
HÍÍ$:
Ml Sílaí m
AU Euratom reports are announced, as and when they are issued, in the monthly periodical EURATOM INFORMATION, edited by the Centre for Information and Documentation (CID). For subscription (1 year : US$ 15, £ 5.7) or free specimen copies please write to :
Handelsblatt GmbH
"Euratom Information"
Postfach 1102
D-4 Düsseldorf (Germany'
am |1'*3ΐί.''*
wz\ m
Håwsffli
I Office central de vente des publications
des Communautés européennes
2, Place de Metz
» !FT»iïlBt M l ' QtMtiilull if
Luxembourg
Ml
«S 4" '
i «
mm ¡in
mi\
l«M
Up
iWtftø
iiiiï
RM
WflWíi!/
Ι«*
•ï
:Í»BÍ
'mm
M
U<i«»«(
'U i l
if nil
t-W!ssiSi:*
M
iii '■
im. iigyiii
Hfilliliy To disseminate knowledge is to disseminate prosperity — I mean llfîllllllll <'ilfei-iifi
! general prosperity and not individual riches — and with prosperity
| disappears the greater part of the evil which is our heritage from
• darker times.
pfrl
itiiiflltw'
i S i S f frø,·
dffl
Alfred Nobel
m
tf
Stød
All Euratom reports are on sale at the offices listed below, at the prices given on the back of the front cover (when ordering, specify clearly the EUR number and the title of the report, which are shown on the front cover).
OFFICE CENTRAL DE VENTE DES PUBLICATIONS
DES COMMUNAUTES EUROPEENNES
2, place de Metz, Luxembourg (Compte chèque postal N° 191-90)
BELGIQUE — BELGIË
IH*·** ■ÉN
MONITEUR BELGE 40-42, rue de Louvain - Bruxe BELGISCH STAATSBLAD
Pli raft·
c<
UXEMBOURG OFFICE CENTRAL DE VENTE DES PUBLICATIONS DES COMMUNAUTES EUROPEENNES
Leuvenseweg 40-42, - Brussel 9, rue Goethe - Luxembourg
DEUTSCHLAND BUNDESANZ Postfach - Köln
îS ANZEIGER n i
Hli m
. 1.. FRANCE
SERVICE DE VENTE EN FRANCE DES PUBLICATIONS DES COMMUNAUTES EUROPEENNES 26, rue Desaix - Paris 15e