International Journal of Science and Research (IJSR) ISSN (Online): 2319-7064 Index Copernicus Value (2015): 78.96 | Impact Factor (2015): 6.391 Volume 6 Issue 5, May 2017 www.ijsr.net Licensed Under Creative Commons Attribution CC BY A New DC Charging Station to Control Power Flows on Low Voltage Grids Dario De Santis Department of Electrical and Information Engineering, Polytechnic University of Bari, Bari, Italy Abstract: With the development of power electronics and storage systems, the electric vehicles market has grown. So, for this reason low voltage electric grids are experiencing growth in the number of charging stations. There are several power levels to charge an electric vehicle with DC or AC voltage. This paper proposes a double three-phase power supply solution for DC charging stations to charge the vehicle battery and to control active and reactive power flows between two electric feeders using a low voltage UPFC. Keywords: Unified Power Flow Controller (UPFC), EV charging station, LV grids, STATCOM converter, SSSC converter 1. Introduction The EV (Electric Vehicle) has zero emission, it is silent and it has low maintenance costs. Furthermore, thanks to electrical motors (synchronous or induction motor) the EV has better performances than the endothermic engine (diesel or gasoline engine). The only limitation that electric vehicles have, is the electric battery, which reduces the maximal electrical power for electrical motors, reduces the driver range and increases the vehicle cost. On the market, there are electric vehicles with fuel-cells that use hydrogen fuel and/or lithium electric batteries. Nowadays the electric battery system is more convenient, and it is more efficient than the hydrogen system so, on the market this is the main technology for the EV. Thanks to the development of this type of storage, it is possible to reach a good result in terms of performances and the electrical vehicles market is now growing [1]. Hence the charging process and charging devices play a key role for electrical vehicles. On the market, there are two main typologies of charging stations; the AC charging station and the DC charging station [2]. The AC system uses a battery charger on board of the EV. The DC system can be charge the EV battery directly and it is easier to integrate renewable sources. Furthermore, the DC station is more flexible than the AC station for low voltage electric grids, because it is possible to use the AFE converter (Active Front End) to obtain the DC voltage and at the same time to control the reactive power or the voltage level in the PCC (Point of Common Coupling) of the charging station [3]. In this way, it is possible also to charge the EV and to provide ancillary services for the LV (Low Voltage) grid with a V2G (Vehicle to Grid) solution or with an auxiliary battery. However, in the DC charging station with AFE converter there is no possibility to control active and reactive power flows between the two LV feeders. This aspect is most important in low voltage electrical grids, when a power flow inversion occurs on one of two feeders, due to the distributed generation or when there is an overload problem on one of the two feeders. To solve these issues, it is possible to use a LV-UPFC (Low Voltage Unified Power Flow Controller) to control active and reactive power flows on the interline link [4]. In addition, it is possible to achieve the optimal management of the two feeders to obtain minimal active power losses. In this paper, the author proposes a new solution for the DC charging station with a double three-phase power supply to charge the EV and at the same time to control the power flow between the two feeders. These feeders are connected to independent low voltage grids, so one feeder is connected to its own transformer and the other is connected to another transformer. This is possible with a SSSC (Static Synchronous Series Compensator) converter with a three- phase series transformer and by an AFE converter in shunt connection. The active front end thus works as a STATCOM (Static Compensator) converter. So, this is the LV-UPFC configuration with a bidirectional DC/DC converter to charge the EV battery [5]. The power scheme of the proposed solution is shown in figure 1. With the SSSC, active and reactive power flows are managed between the two feeders and thanks to the STATCOM, it is possible to manage the active power flow between the EV and the LV grid with a V2G or G2V (Grid to Vehicle) solution. Furthermore, with the shunt converter it is possible to exchange reactive power with the electrical grid in the PCC. The reactive set-point is received from a central distribution system controller or from a voltage controller that it is able to maintain a voltage amplitude value in the PCC. This set- point must be received from a central controller in the same way as a reactive power set-point. The STATCOM converter ensures an active power balance for the SSSC thanks to the voltage control for the DC link capacitor. Therefore, the SSSC works with a PQ control system and the STATCOM works with a VDCQ control or with a VDC|VAC| control [4] [6]. In next paragraph the system overview with main electrical parameters is presented, and then control systems of the STATCOM, SSSC and DC/DC converters are explained using mathematical formulae. Matlab/Simulink software was used to test the control system and the power scheme of the proposed solution. Finally, results in terms of current waveform, active and reactive power are shown in the case of charging the EV and at the same time active and reactive power flows are managed between two feeders by SSSC. Paper ID: ART20173045 DOI: 10.21275/ART20173045 284
Transcript
International Journal of Science and Research (IJSR) ISSN (Online): 2319-7064
Index Copernicus Value (2015): 78.96 | Impact Factor (2015): 6.391
Volume 6 Issue 5, May 2017
www.ijsr.net Licensed Under Creative Commons Attribution CC BY
A New DC Charging Station to Control Power
Flows on Low Voltage Grids
Dario De Santis
Department of Electrical and Information Engineering, Polytechnic University of Bari, Bari, Italy
Abstract: With the development of power electronics and storage systems, the electric vehicles market has grown. So, for this reason
low voltage electric grids are experiencing growth in the number of charging stations. There are several power levels to charge an
electric vehicle with DC or AC voltage. This paper proposes a double three-phase power supply solution for DC charging stations to
charge the vehicle battery and to control active and reactive power flows between two electric feeders using a low voltage UPFC.
Keywords: Unified Power Flow Controller (UPFC), EV charging station, LV grids, STATCOM converter, SSSC converter
1. Introduction
The EV (Electric Vehicle) has zero emission, it is silent and
it has low maintenance costs. Furthermore, thanks to
electrical motors (synchronous or induction motor) the EV
has better performances than the endothermic engine (diesel
or gasoline engine). The only limitation that electric vehicles
have, is the electric battery, which reduces the maximal
electrical power for electrical motors, reduces the driver
range and increases the vehicle cost. On the market, there are
electric vehicles with fuel-cells that use hydrogen fuel and/or
lithium electric batteries. Nowadays the electric battery
system is more convenient, and it is more efficient than the
hydrogen system so, on the market this is the main
technology for the EV. Thanks to the development of this
type of storage, it is possible to reach a good result in terms
of performances and the electrical vehicles market is now
growing [1]. Hence the charging process and charging
devices play a key role for electrical vehicles. On the market,
there are two main typologies of charging stations; the AC
charging station and the DC charging station [2]. The AC
system uses a battery charger on board of the EV. The DC
system can be charge the EV battery directly and it is easier
to integrate renewable sources. Furthermore, the DC station
is more flexible than the AC station for low voltage electric
grids, because it is possible to use the AFE converter (Active
Front End) to obtain the DC voltage and at the same time to
control the reactive power or the voltage level in the PCC
(Point of Common Coupling) of the charging station [3]. In
this way, it is possible also to charge the EV and to provide
ancillary services for the LV (Low Voltage) grid with a V2G
(Vehicle to Grid) solution or with an auxiliary battery.
However, in the DC charging station with AFE converter
there is no possibility to control active and reactive power
flows between the two LV feeders. This aspect is most
important in low voltage electrical grids, when a power flow
inversion occurs on one of two feeders, due to the distributed
generation or when there is an overload problem on one of
the two feeders. To solve these issues, it is possible to use a
LV-UPFC (Low Voltage Unified Power Flow Controller) to
control active and reactive power flows on the interline link
[4]. In addition, it is possible to achieve the optimal
management of the two feeders to obtain minimal active
power losses.
In this paper, the author proposes a new solution for the DC
charging station with a double three-phase power supply to
charge the EV and at the same time to control the power flow
between the two feeders. These feeders are connected to
independent low voltage grids, so one feeder is connected to
its own transformer and the other is connected to another
transformer. This is possible with a SSSC (Static
Synchronous Series Compensator) converter with a three-
phase series transformer and by an AFE converter in shunt
connection. The active front end thus works as a STATCOM
(Static Compensator) converter. So, this is the LV-UPFC
configuration with a bidirectional DC/DC converter to
charge the EV battery [5]. The power scheme of the
proposed solution is shown in figure 1. With the SSSC,
active and reactive power flows are managed between the
two feeders and thanks to the STATCOM, it is possible to
manage the active power flow between the EV and the LV
grid with a V2G or G2V (Grid to Vehicle) solution.
Furthermore, with the shunt converter it is possible to
exchange reactive power with the electrical grid in the PCC.
The reactive set-point is received from a central distribution
system controller or from a voltage controller that it is able
to maintain a voltage amplitude value in the PCC. This set-
point must be received from a central controller in the same
way as a reactive power set-point. The STATCOM converter
ensures an active power balance for the SSSC thanks to the
voltage control for the DC link capacitor. Therefore, the
SSSC works with a PQ control system and the STATCOM
works with a VDCQ control or with a VDC|VAC| control [4]
[6].
In next paragraph the system overview with main electrical
parameters is presented, and then control systems of the
STATCOM, SSSC and DC/DC converters are explained
using mathematical formulae. Matlab/Simulink software was
used to test the control system and the power scheme of the
proposed solution. Finally, results in terms of current
waveform, active and reactive power are shown in the case
of charging the EV and at the same time active and reactive
power flows are managed between two feeders by SSSC.
Paper ID: ART20173045 DOI: 10.21275/ART20173045 284
International Journal of Science and Research (IJSR) ISSN (Online): 2319-7064
Index Copernicus Value (2015): 78.96 | Impact Factor (2015): 6.391
Volume 6 Issue 5, May 2017
www.ijsr.net Licensed Under Creative Commons Attribution CC BY
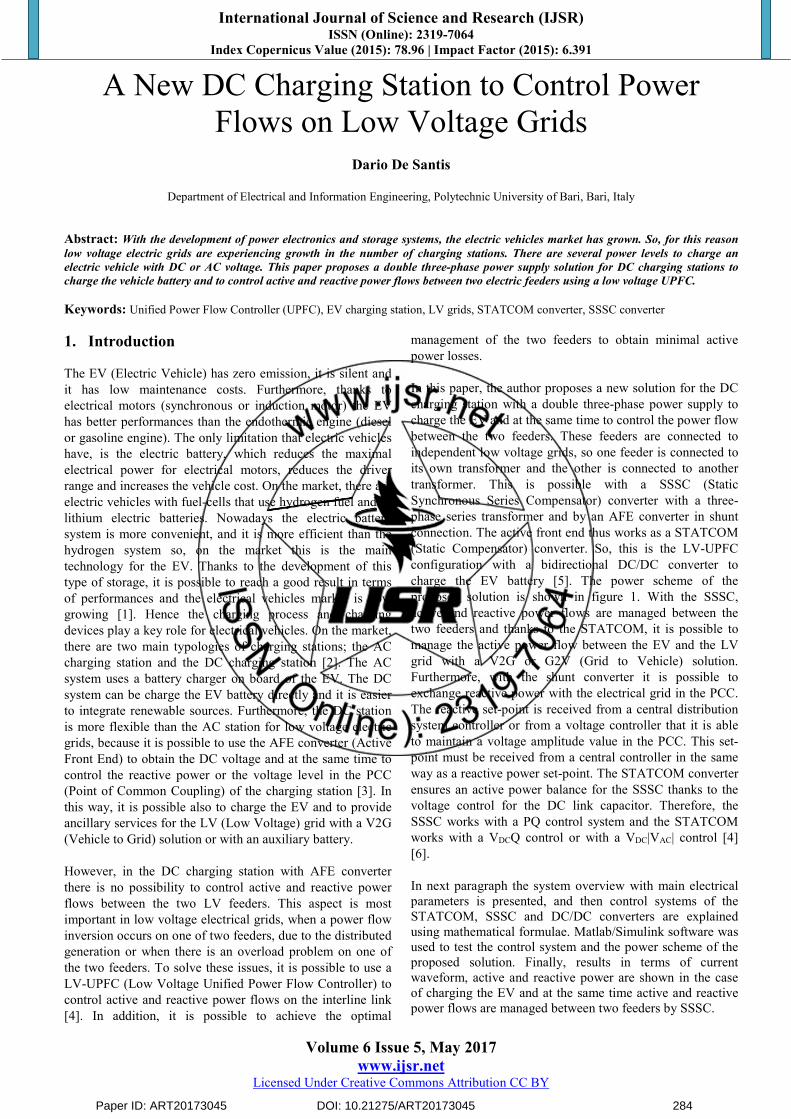
Figure 1: DC Charging station with LV-UPFC configuration
2. System Overview
In the DC charging station proposed, there is an AC/AC
conversion system connected between two feeders, with an
access to the DC link to charge the EV battery by an
integrated DC/DC converter. The AC/AC solution is
composed of the STATCOM converter, the SSSC converter
and the bi-directional chopper, with IGBT + diode
technology [7] where the switching frequency is equal to 10
kHz for all power electronics converters. For AC/DC
converters the 2-level configuration has been used.
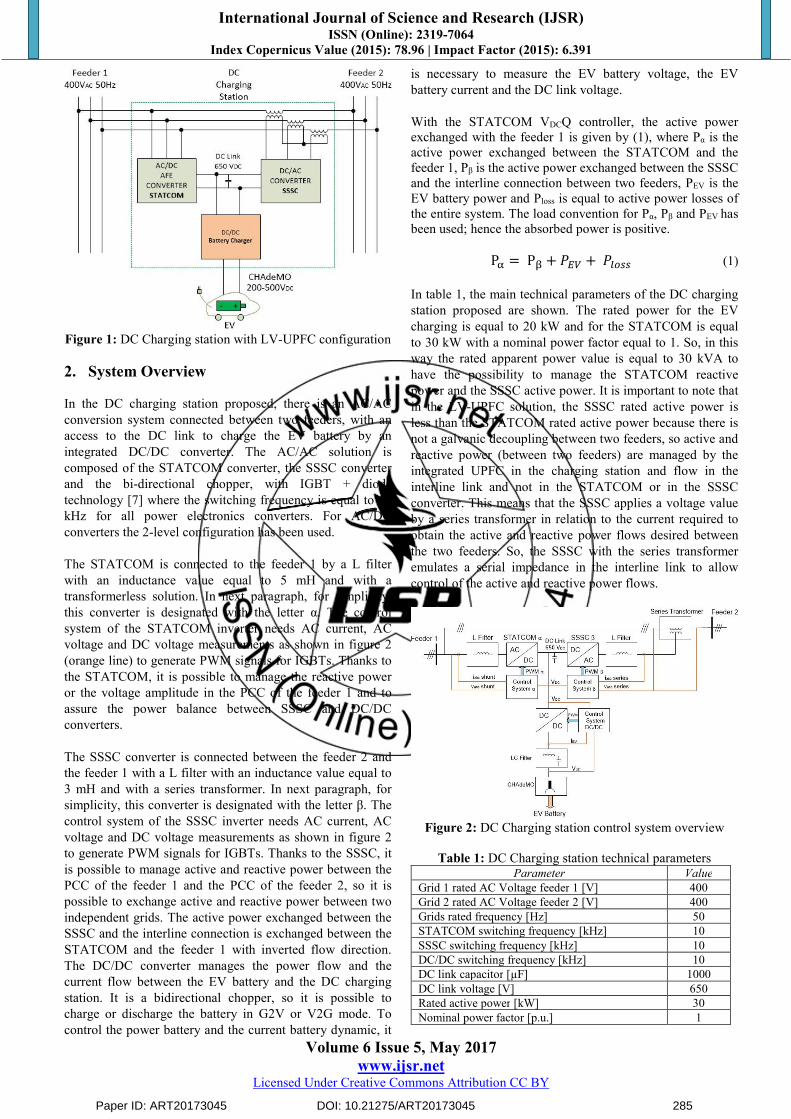
The STATCOM is connected to the feeder 1 by a L filter
with an inductance value equal to 5 mH and with a
transformerless solution. In next paragraph, for simplicity,
this converter is designated with the letter α. The control
system of the STATCOM inverter needs AC current, AC
voltage and DC voltage measurements as shown in figure 2
(orange line) to generate PWM signals for IGBTs. Thanks to
the STATCOM, it is possible to manage the reactive power
or the voltage amplitude in the PCC of the feeder 1 and to
assure the power balance between SSSC and DC/DC
converters.
The SSSC converter is connected between the feeder 2 and
the feeder 1 with a L filter with an inductance value equal to
3 mH and with a series transformer. In next paragraph, for
simplicity, this converter is designated with the letter β. The
control system of the SSSC inverter needs AC current, AC
voltage and DC voltage measurements as shown in figure 2
to generate PWM signals for IGBTs. Thanks to the SSSC, it
is possible to manage active and reactive power between the
PCC of the feeder 1 and the PCC of the feeder 2, so it is
possible to exchange active and reactive power between two
independent grids. The active power exchanged between the
SSSC and the interline connection is exchanged between the
STATCOM and the feeder 1 with inverted flow direction.
The DC/DC converter manages the power flow and the
current flow between the EV battery and the DC charging
station. It is a bidirectional chopper, so it is possible to
charge or discharge the battery in G2V or V2G mode. To
control the power battery and the current battery dynamic, it
is necessary to measure the EV battery voltage, the EV
battery current and the DC link voltage.
With the STATCOM VDCQ controller, the active power
exchanged with the feeder 1 is given by (1), where Pα is the
active power exchanged between the STATCOM and the
feeder 1, Pβ is the active power exchanged between the SSSC
and the interline connection between two feeders, PEV is the
EV battery power and Ploss is equal to active power losses of
the entire system. The load convention for Pα, Pβ and PEV has
been used; hence the absorbed power is positive.
P� = P� + �� + ���� (1)
In table 1, the main technical parameters of the DC charging
station proposed are shown. The rated power for the EV
charging is equal to 20 kW and for the STATCOM is equal
to 30 kW with a nominal power factor equal to 1. So, in this
way the rated apparent power value is equal to 30 kVA to
have the possibility to manage the STATCOM reactive
power and the SSSC active power. It is important to note that
in the LV-UPFC solution, the SSSC rated active power is
less than the STATCOM rated active power because there is
not a galvanic decoupling between two feeders, so active and
reactive power (between two feeders) are managed by the
integrated UPFC in the charging station and flow in the
interline link and not in the STATCOM or in the SSSC
converter. This means that the SSSC applies a voltage value
by a series transformer in relation to the current required to
obtain the active and reactive power flows desired between
the two feeders. So, the SSSC with the series transformer
emulates a serial impedance in the interline link to allow
control of the active and reactive power flows.
Figure 2: DC Charging station control system overview
Table 1: DC Charging station technical parameters Parameter Value
Grid 1 rated AC Voltage feeder 1 [V] 400
Grid 2 rated AC Voltage feeder 2 [V] 400
Grids rated frequency [Hz] 50
STATCOM switching frequency [kHz] 10
SSSC switching frequency [kHz] 10
DC/DC switching frequency [kHz] 10
DC link capacitor [µF] 1000
DC link voltage [V] 650
Rated active power [kW] 30
Nominal power factor [p.u.] 1
Paper ID: ART20173045 DOI: 10.21275/ART20173045 285
International Journal of Science and Research (IJSR) ISSN (Online): 2319-7064
Index Copernicus Value (2015): 78.96 | Impact Factor (2015): 6.391
Volume 6 Issue 5, May 2017
www.ijsr.net Licensed Under Creative Commons Attribution CC BY
EV charger rated power [kW] 20
EV battery DC Voltage range [V] 200-500
3. Mathematical Formulation
3.1. STATCOM Converter
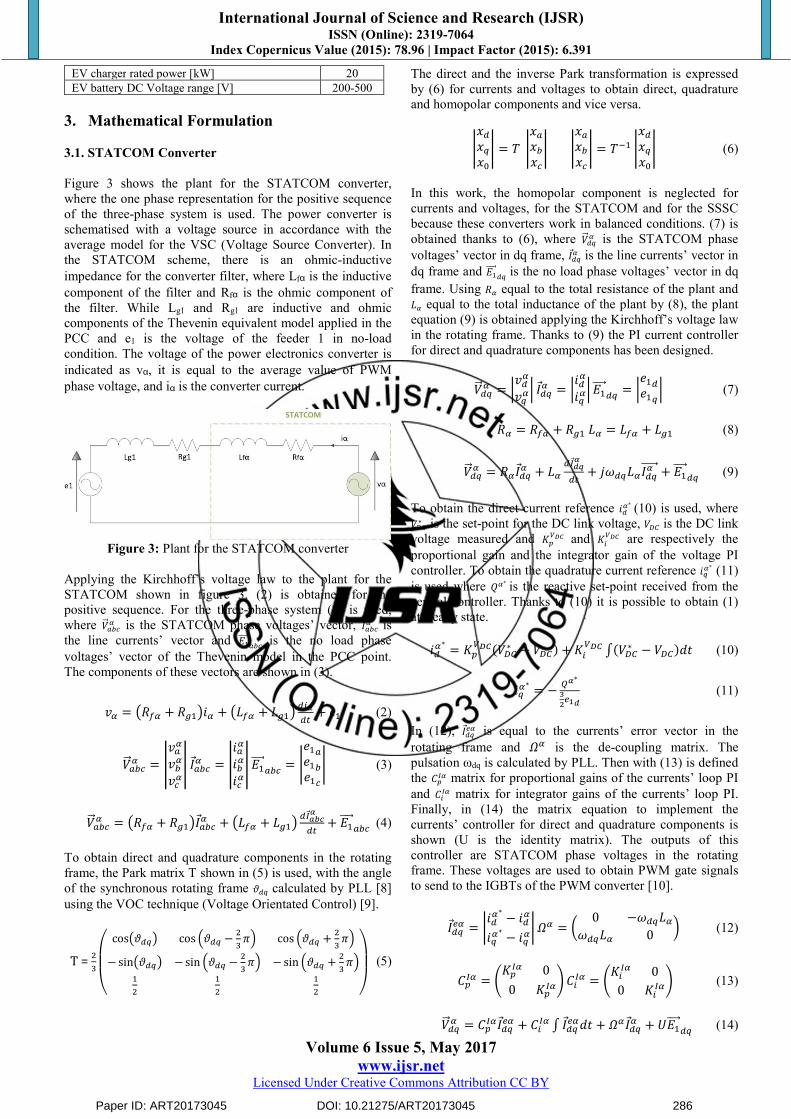
Figure 3 shows the plant for the STATCOM converter,
where the one phase representation for the positive sequence
of the three-phase system is used. The power converter is
schematised with a voltage source in accordance with the
average model for the VSC (Voltage Source Converter). In
the STATCOM scheme, there is an ohmic-inductive
impedance for the converter filter, where Lf� is the inductive
component of the filter and Rf� is the ohmic component of
the filter. While Lg1 and Rg1 are inductive and ohmic
components of the Thevenin equivalent model applied in the
PCC and e1 is the voltage of the feeder 1 in no-load
condition. The voltage of the power electronics converter is
indicated as v�, it is equal to the average value of PWM
phase voltage, and i� is the converter current.
Figure 3: Plant for the STATCOM converter
Applying the Kirchhoff’s voltage law to the plant for the
STATCOM shown in figure 3, (2) is obtained for the
positive sequence. For the three-phase system (4) is used,
where ������ is the STATCOM phase voltages’ vector, ������ is
the line currents’ vector and ���������� is the no load phase
voltages’ vector of the Thevenin model in the PCC point.
In (21), ���+Va is equal to the currents’ error vector in the
rotating frame and Xa is the de-coupling matrix. The
pulsation ωdq is calculated by PLL and it is equal to the
STATCOM control pulsation. Then with (22) is defined the YJ&a matrix for proportional gains of the currents’ loop PI and Y &a matrix for integrator gains of the currents’ loop PI.
Paper ID: ART20173045 DOI: 10.21275/ART20173045 287
International Journal of Science and Research (IJSR) ISSN (Online): 2319-7064
Index Copernicus Value (2015): 78.96 | Impact Factor (2015): 6.391
Volume 6 Issue 5, May 2017
www.ijsr.net Licensed Under Creative Commons Attribution CC BY
Finally, in (23) the matrix equation to implement the
currents’ controller for direct and quadrature components is
shown (U is the identity matrix). The outputs of this
controller are SSSC phase voltages in the rotating frame.
These voltages are used to obtain PWM gate signals to send
���+a = YJ&a���+Va + Y &a P ���+VaQR + Xa���+a + `N ,�����+ − ������+O (23)
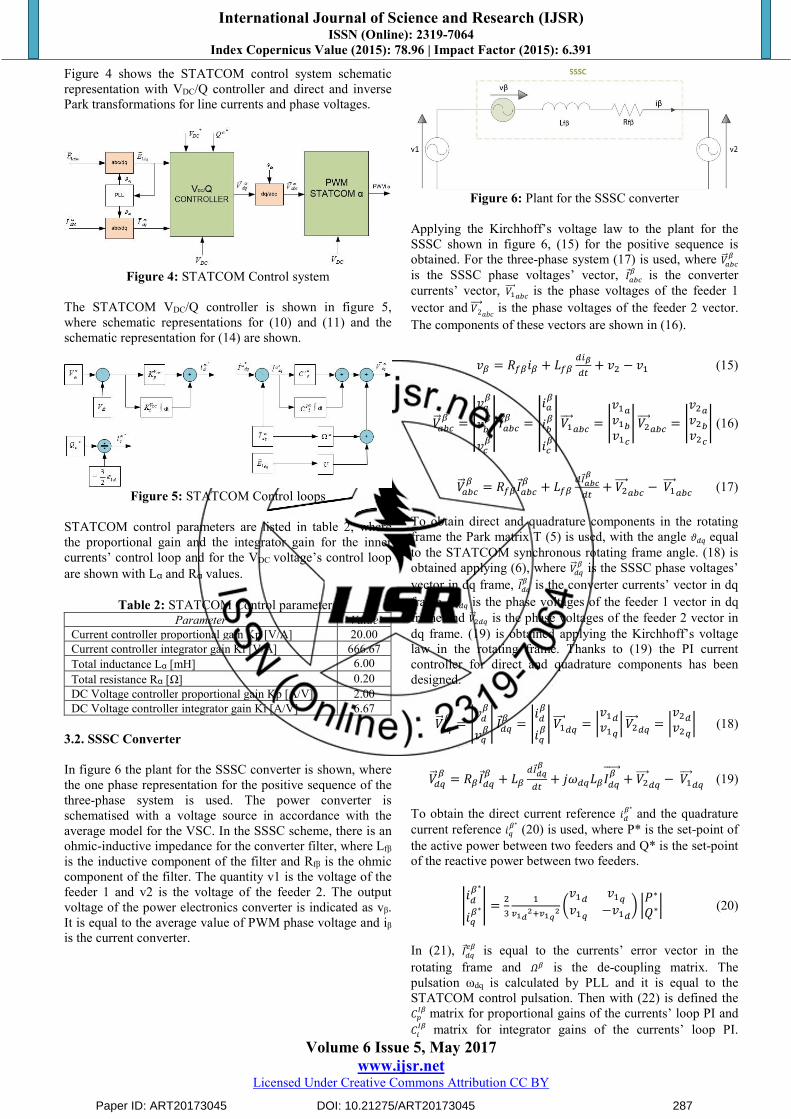
Figure 7 shows the SSSC control system schematic
representation with the P/Q controller and direct and inverse
Park transformations for line currents and phase voltages for
both feeders.
Figure 7: SSSC Control system
The SSSC P/Q controller is shown in figure 8, where the
schematic representation for (20) and (23) is shown.
Figure 8: SSSC Control loops
SSSC control parameters are listed in table 3, where the
proportional gain and the integrator gain for the inner
currents’ control loop are shown with Lβ and Rβ values.
Table 3: SSSC Control parameters Parameter Value
Current controller proportional gain Kp [V/A] 10.00
Current controller integrator gain Ki [V/A] 333.33
Inductance Lβ [mH] 3.00
Resistance Rβ [Ω] 0.10
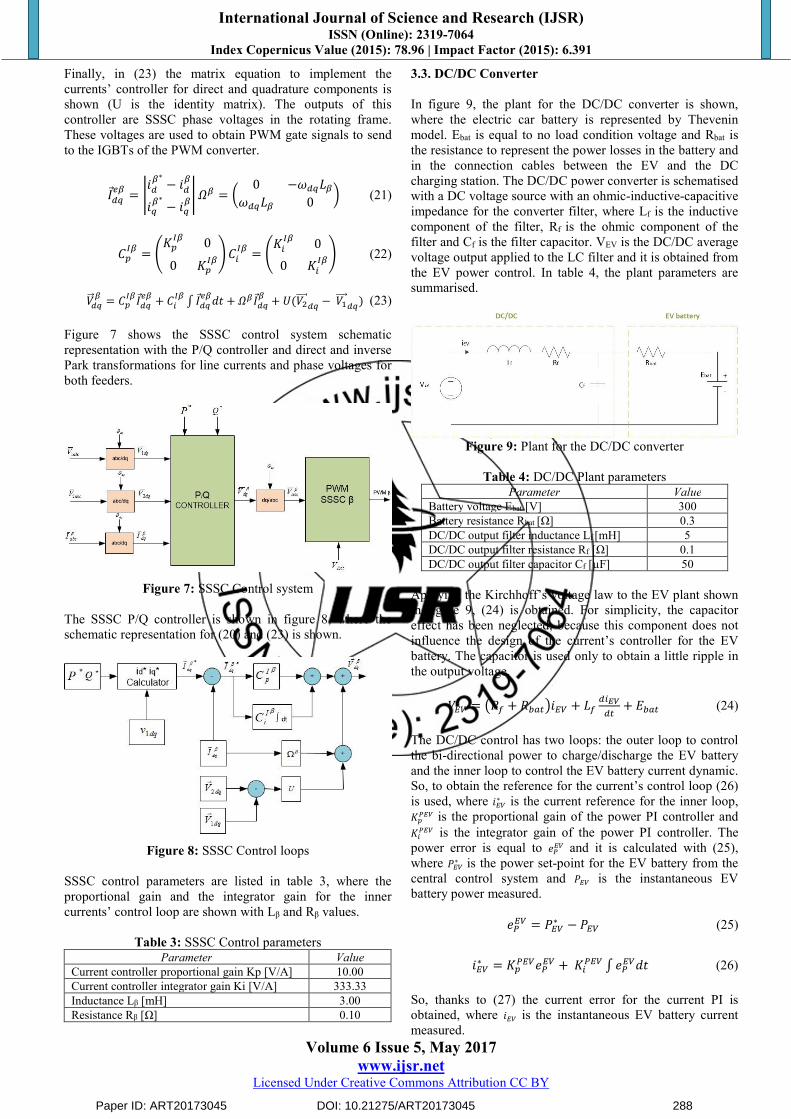
3.3. DC/DC Converter
In figure 9, the plant for the DC/DC converter is shown,
where the electric car battery is represented by Thevenin
model. Ebat is equal to no load condition voltage and Rbat is
the resistance to represent the power losses in the battery and
in the connection cables between the EV and the DC
charging station. The DC/DC power converter is schematised
with a DC voltage source with an ohmic-inductive-capacitive
impedance for the converter filter, where Lf is the inductive
component of the filter, Rf is the ohmic component of the
filter and Cf is the filter capacitor. VEV is the DC/DC average
voltage output applied to the LC filter and it is obtained from
the EV power control. In table 4, the plant parameters are
summarised.
Figure 9: Plant for the DC/DC converter
Table 4: DC/DC Plant parameters Parameter Value
Battery voltage Ebat [V] 300
Battery resistance Rbat [Ω] 0.3
DC/DC output filter inductance Lf [mH] 5
DC/DC output filter resistance Rf [Ω] 0.1
DC/DC output filter capacitor Cf [µF] 50
Applying the Kirchhoff’s voltage law to the EV plant shown
in figure 9, (24) is obtained. For simplicity, the capacitor
effect has been neglected, because this component does not
influence the design of the current’s controller for the EV
battery. The capacitor is used only to obtain a little ripple in
the output voltage.
� = ��� + ���"��� + �� � lm�" + ���" (24)
The DC/DC control has two loops: the outer loop to control
the bi-directional power to charge/discharge the EV battery
and the inner loop to control the EV battery current dynamic.
So, to obtain the reference for the current’s control loop (26)
is used, where ��∗ is the current reference for the inner loop, IJn� is the proportional gain of the power PI controller and I n� is the integrator gain of the power PI controller. The
power error is equal to #n� and it is calculated with (25),
where ��∗ is the power set-point for the EV battery from the
central control system and �� is the instantaneous EV
battery power measured.
#n� = ��∗ − �� (25)
��∗ = IJn�#n� + I n� P #n�QR (26)
So, thanks to (27) the current error for the current PI is
obtained, where �� is the instantaneous EV battery current
measured.
Paper ID: ART20173045 DOI: 10.21275/ART20173045 288
International Journal of Science and Research (IJSR) ISSN (Online): 2319-7064
Index Copernicus Value (2015): 78.96 | Impact Factor (2015): 6.391
Volume 6 Issue 5, May 2017
www.ijsr.net Licensed Under Creative Commons Attribution CC BY
With (28) the modulation index m is obtained for PWM,
where IJ&� and I &� is the proportional gain and the integrator
gain respectively for the PI current’s controller. Finally, the
output voltage � is given by (29).
#&� = ��∗ − �� (27)
o = IJ&�#&� + I &� P #&�QR + �('pKL (28)
� = o GH (29)
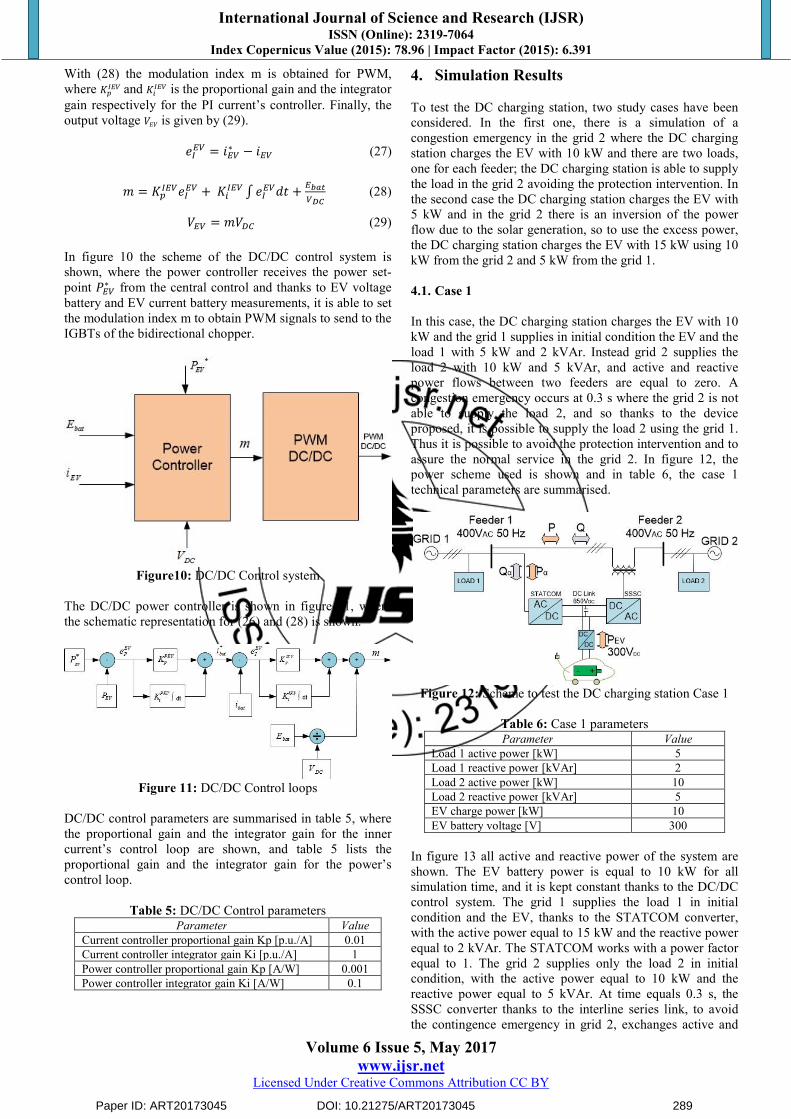
In figure 10 the scheme of the DC/DC control system is
shown, where the power controller receives the power set-
point ��∗ from the central control and thanks to EV voltage
battery and EV current battery measurements, it is able to set
the modulation index m to obtain PWM signals to send to the
IGBTs of the bidirectional chopper.
Figure10: DC/DC Control system
The DC/DC power controller is shown in figure 11, where
the schematic representation for (26) and (28) is shown.
Figure 11: DC/DC Control loops
DC/DC control parameters are summarised in table 5, where
the proportional gain and the integrator gain for the inner
current’s control loop are shown, and table 5 lists the
proportional gain and the integrator gain for the power’s
control loop.
Table 5: DC/DC Control parameters Parameter Value
Current controller proportional gain Kp [p.u./A] 0.01
Current controller integrator gain Ki [p.u./A] 1
Power controller proportional gain Kp [A/W] 0.001
Power controller integrator gain Ki [A/W] 0.1
4. Simulation Results
To test the DC charging station, two study cases have been
considered. In the first one, there is a simulation of a
congestion emergency in the grid 2 where the DC charging
station charges the EV with 10 kW and there are two loads,
one for each feeder; the DC charging station is able to supply
the load in the grid 2 avoiding the protection intervention. In
the second case the DC charging station charges the EV with
5 kW and in the grid 2 there is an inversion of the power
flow due to the solar generation, so to use the excess power,
the DC charging station charges the EV with 15 kW using 10
kW from the grid 2 and 5 kW from the grid 1.
4.1. Case 1
In this case, the DC charging station charges the EV with 10
kW and the grid 1 supplies in initial condition the EV and the
load 1 with 5 kW and 2 kVAr. Instead grid 2 supplies the
load 2 with 10 kW and 5 kVAr, and active and reactive
power flows between two feeders are equal to zero. A
congestion emergency occurs at 0.3 s where the grid 2 is not
able to supply the load 2, and so thanks to the device
proposed, it is possible to supply the load 2 using the grid 1.
Thus it is possible to avoid the protection intervention and to
assure the normal service in the grid 2. In figure 12, the
power scheme used is shown and in table 6, the case 1
technical parameters are summarised.
Figure 12: Scheme to test the DC charging station Case 1
Table 6: Case 1 parameters Parameter Value
Load 1 active power [kW] 5
Load 1 reactive power [kVAr] 2
Load 2 active power [kW] 10
Load 2 reactive power [kVAr] 5
EV charge power [kW] 10
EV battery voltage [V] 300
In figure 13 all active and reactive power of the system are
shown. The EV battery power is equal to 10 kW for all
simulation time, and it is kept constant thanks to the DC/DC
control system. The grid 1 supplies the load 1 in initial
condition and the EV, thanks to the STATCOM converter,
with the active power equal to 15 kW and the reactive power
equal to 2 kVAr. The STATCOM works with a power factor
equal to 1. The grid 2 supplies only the load 2 in initial
condition, with the active power equal to 10 kW and the
reactive power equal to 5 kVAr. At time equals 0.3 s, the
SSSC converter thanks to the interline series link, to avoid
the contingence emergency in grid 2, exchanges active and
Paper ID: ART20173045 DOI: 10.21275/ART20173045 289
International Journal of Science and Research (IJSR) ISSN (Online): 2319-7064
Index Copernicus Value (2015): 78.96 | Impact Factor (2015): 6.391
Volume 6 Issue 5, May 2017
www.ijsr.net Licensed Under Creative Commons Attribution CC BY
reactive power between the feeder 1 and the feeder 2, so
now, the grid 1 supplies the load 1, the load 2 and the EV
battery with 25 kW as active power and 7 kVAr as reactive
power, while as shown in figure 13 active and reactive power
supplied by grid 2 are equal to zero.
Figure 13: Active and Reactive Power Case 1
In figure 14, the PCC voltages of the feeder 1 are shown and
figure 15 shows the PCC voltages of the feeder 2. It is
possible to see a small decrease in PCC voltages in the
feeder 1 at time equals 0.3 s due to the increment of active
and reactive power supplied by grid 1, while in the PCC of
the feeder 2 it is possible to see a small increase in voltage
amplitudes at time equals 0.3 s due to the decrement of
active and reactive power supplied by grid 2.
Figure 14: PCC Phase Voltages Feeder 1 Case 1
Figure 15: PCC Phase Voltages Feeder 2 Case 1
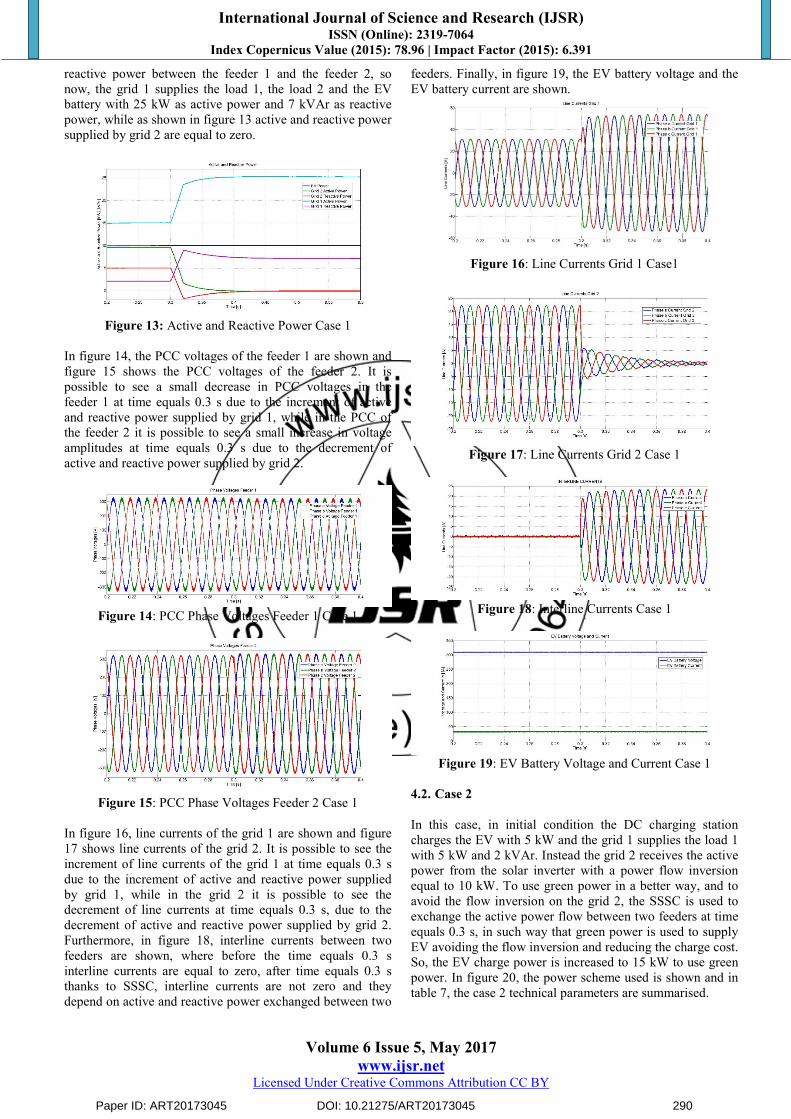
In figure 16, line currents of the grid 1 are shown and figure
17 shows line currents of the grid 2. It is possible to see the
increment of line currents of the grid 1 at time equals 0.3 s
due to the increment of active and reactive power supplied
by grid 1, while in the grid 2 it is possible to see the
decrement of line currents at time equals 0.3 s, due to the
decrement of active and reactive power supplied by grid 2.
Furthermore, in figure 18, interline currents between two
feeders are shown, where before the time equals 0.3 s
interline currents are equal to zero, after time equals 0.3 s
thanks to SSSC, interline currents are not zero and they
depend on active and reactive power exchanged between two
feeders. Finally, in figure 19, the EV battery voltage and the
EV battery current are shown.
Figure 16: Line Currents Grid 1 Case1
Figure 17: Line Currents Grid 2 Case 1
Figure 18: Interline Currents Case 1
Figure 19: EV Battery Voltage and Current Case 1
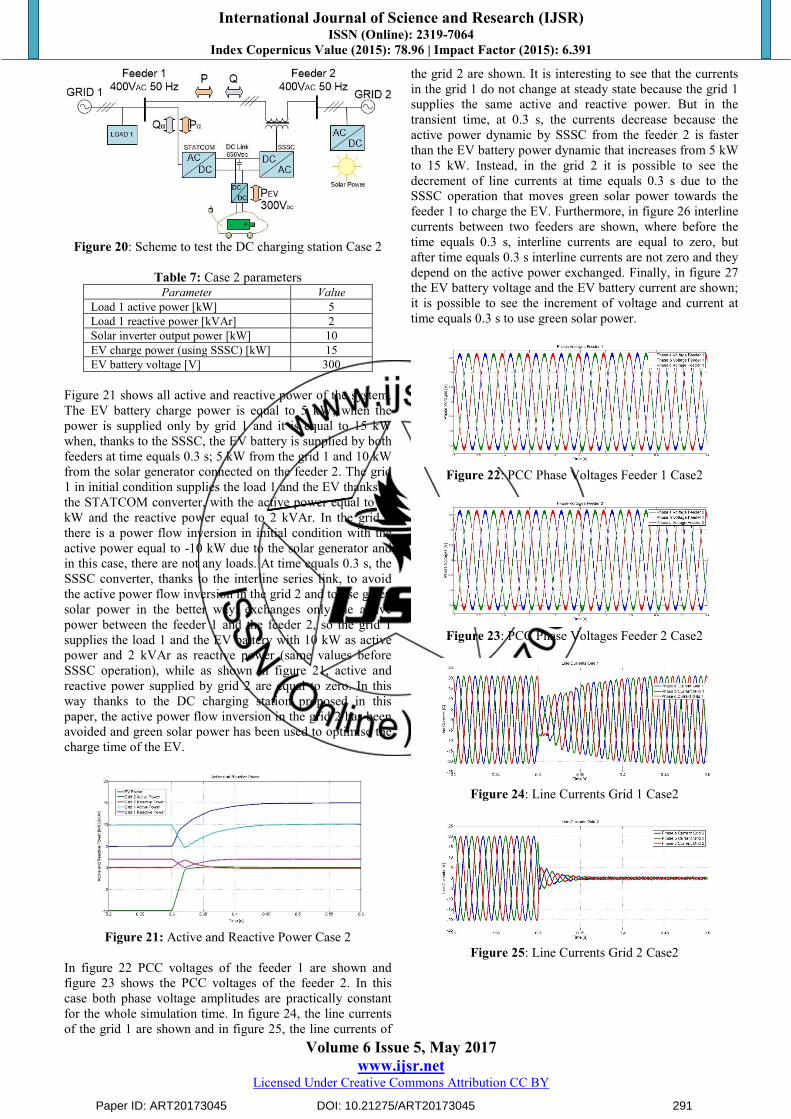
4.2. Case 2
In this case, in initial condition the DC charging station
charges the EV with 5 kW and the grid 1 supplies the load 1
with 5 kW and 2 kVAr. Instead the grid 2 receives the active
power from the solar inverter with a power flow inversion
equal to 10 kW. To use green power in a better way, and to
avoid the flow inversion on the grid 2, the SSSC is used to
exchange the active power flow between two feeders at time
equals 0.3 s, in such way that green power is used to supply
EV avoiding the flow inversion and reducing the charge cost.
So, the EV charge power is increased to 15 kW to use green
power. In figure 20, the power scheme used is shown and in
table 7, the case 2 technical parameters are summarised.
Paper ID: ART20173045 DOI: 10.21275/ART20173045 290
International Journal of Science and Research (IJSR) ISSN (Online): 2319-7064
Index Copernicus Value (2015): 78.96 | Impact Factor (2015): 6.391
Volume 6 Issue 5, May 2017
www.ijsr.net Licensed Under Creative Commons Attribution CC BY
Figure 20: Scheme to test the DC charging station Case 2
Table 7: Case 2 parameters Parameter Value
Load 1 active power [kW] 5
Load 1 reactive power [kVAr] 2
Solar inverter output power [kW] 10
EV charge power (using SSSC) [kW] 15
EV battery voltage [V] 300
Figure 21 shows all active and reactive power of the system.
The EV battery charge power is equal to 5 kW, when the
power is supplied only by grid 1 and it is equal to 15 kW
when, thanks to the SSSC, the EV battery is supplied by both
feeders at time equals 0.3 s; 5 kW from the grid 1 and 10 kW
from the solar generator connected on the feeder 2. The grid
1 in initial condition supplies the load 1 and the EV thanks to
the STATCOM converter, with the active power equal to 10
kW and the reactive power equal to 2 kVAr. In the grid 2
there is a power flow inversion in initial condition with the
active power equal to -10 kW due to the solar generator and
in this case, there are not any loads. At time equals 0.3 s, the
SSSC converter, thanks to the interline series link, to avoid
the active power flow inversion in the grid 2 and to use green
solar power in the better way, exchanges only the active
power between the feeder 1 and the feeder 2, so the grid 1
supplies the load 1 and the EV battery with 10 kW as active
power and 2 kVAr as reactive power (same values before
SSSC operation), while as shown in figure 21, active and
reactive power supplied by grid 2 are equal to zero. In this
way thanks to the DC charging station proposed in this
paper, the active power flow inversion in the grid 2 has been
avoided and green solar power has been used to optimise the
charge time of the EV.
Figure 21: Active and Reactive Power Case 2
In figure 22 PCC voltages of the feeder 1 are shown and
figure 23 shows the PCC voltages of the feeder 2. In this
case both phase voltage amplitudes are practically constant
for the whole simulation time. In figure 24, the line currents
of the grid 1 are shown and in figure 25, the line currents of
the grid 2 are shown. It is interesting to see that the currents
in the grid 1 do not change at steady state because the grid 1
supplies the same active and reactive power. But in the
transient time, at 0.3 s, the currents decrease because the
active power dynamic by SSSC from the feeder 2 is faster
than the EV battery power dynamic that increases from 5 kW
to 15 kW. Instead, in the grid 2 it is possible to see the
decrement of line currents at time equals 0.3 s due to the
SSSC operation that moves green solar power towards the
feeder 1 to charge the EV. Furthermore, in figure 26 interline
currents between two feeders are shown, where before the
time equals 0.3 s, interline currents are equal to zero, but
after time equals 0.3 s interline currents are not zero and they
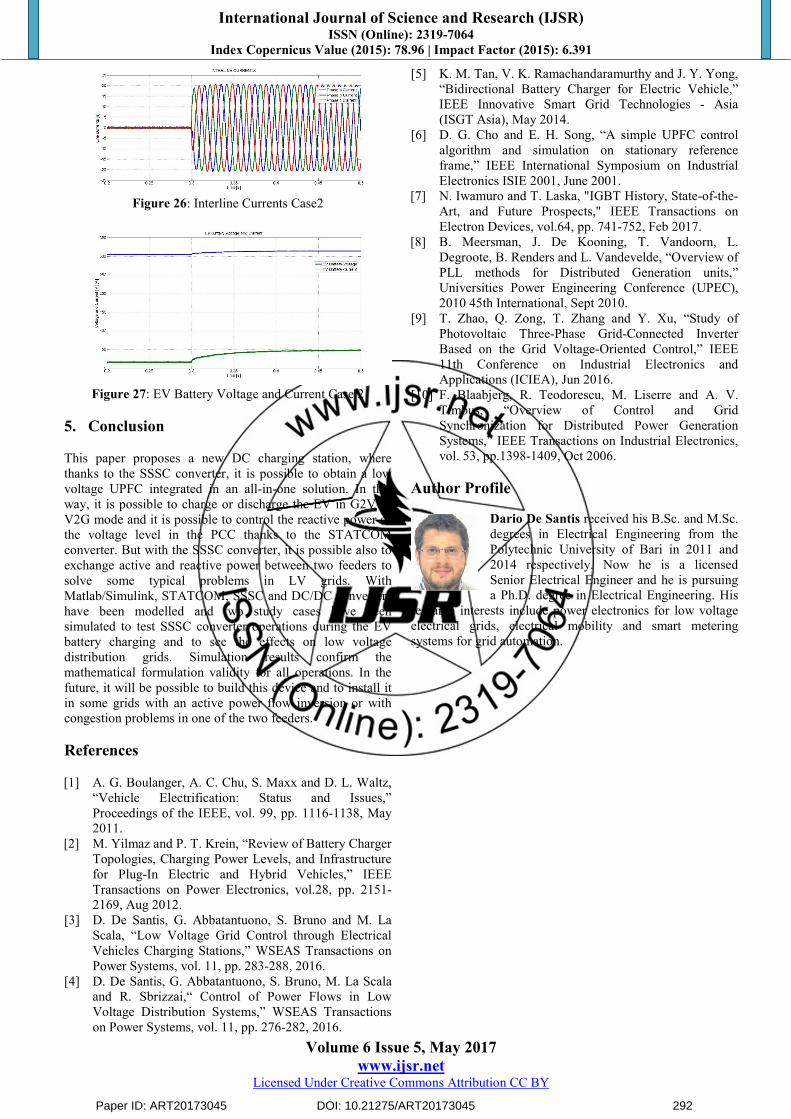
depend on the active power exchanged. Finally, in figure 27
the EV battery voltage and the EV battery current are shown;
it is possible to see the increment of voltage and current at
time equals 0.3 s to use green solar power.
Figure 22: PCC Phase Voltages Feeder 1 Case2
Figure 23: PCC Phase Voltages Feeder 2 Case2
Figure 24: Line Currents Grid 1 Case2
Figure 25: Line Currents Grid 2 Case2
Paper ID: ART20173045 DOI: 10.21275/ART20173045 291
International Journal of Science and Research (IJSR) ISSN (Online): 2319-7064
Index Copernicus Value (2015): 78.96 | Impact Factor (2015): 6.391
Volume 6 Issue 5, May 2017
www.ijsr.net Licensed Under Creative Commons Attribution CC BY
Figure 26: Interline Currents Case2
Figure 27: EV Battery Voltage and Current Case 2
5. Conclusion
This paper proposes a new DC charging station, where
thanks to the SSSC converter, it is possible to obtain a low
voltage UPFC integrated in an all-in-one solution. In this
way, it is possible to charge or discharge the EV in G2V or
V2G mode and it is possible to control the reactive power or
the voltage level in the PCC thanks to the STATCOM
converter. But with the SSSC converter, it is possible also to
exchange active and reactive power between two feeders to
solve some typical problems in LV grids. With
Matlab/Simulink, STATCOM, SSSC and DC/DC converters
have been modelled and two study cases have been
simulated to test SSSC converter operations during the EV
battery charging and to see the effects on low voltage
distribution grids. Simulation results confirm the
mathematical formulation validity for all operations. In the
future, it will be possible to build this device and to install it
in some grids with an active power flow inversion or with
congestion problems in one of the two feeders.
References
[1] A. G. Boulanger, A. C. Chu, S. Maxx and D. L. Waltz,
“Vehicle Electrification: Status and Issues,”
Proceedings of the IEEE, vol. 99, pp. 1116-1138, May
2011.
[2] M. Yilmaz and P. T. Krein, “Review of Battery Charger
Topologies, Charging Power Levels, and Infrastructure
for Plug-In Electric and Hybrid Vehicles,” IEEE
Transactions on Power Electronics, vol.28, pp. 2151-
2169, Aug 2012.
[3] D. De Santis, G. Abbatantuono, S. Bruno and M. La
Scala, “Low Voltage Grid Control through Electrical
Vehicles Charging Stations,” WSEAS Transactions on
Power Systems, vol. 11, pp. 283-288, 2016.
[4] D. De Santis, G. Abbatantuono, S. Bruno, M. La Scala
and R. Sbrizzai,“ Control of Power Flows in Low
Voltage Distribution Systems,” WSEAS Transactions
on Power Systems, vol. 11, pp. 276-282, 2016.
[5] K. M. Tan, V. K. Ramachandaramurthy and J. Y. Yong,
“Bidirectional Battery Charger for Electric Vehicle,”
IEEE Innovative Smart Grid Technologies - Asia
(ISGT Asia), May 2014.
[6] D. G. Cho and E. H. Song, “A simple UPFC control
algorithm and simulation on stationary reference
frame,” IEEE International Symposium on Industrial
Electronics ISIE 2001, June 2001.
[7] N. Iwamuro and T. Laska, "IGBT History, State-of-the-
Art, and Future Prospects," IEEE Transactions on
Electron Devices, vol.64, pp. 741-752, Feb 2017.
[8] B. Meersman, J. De Kooning, T. Vandoorn, L.
Degroote, B. Renders and L. Vandevelde, “Overview of
PLL methods for Distributed Generation units,”
Universities Power Engineering Conference (UPEC),
2010 45th International, Sept 2010.
[9] T. Zhao, Q. Zong, T. Zhang and Y. Xu, “Study of
Photovoltaic Three-Phase Grid-Connected Inverter
Based on the Grid Voltage-Oriented Control,” IEEE
11th Conference on Industrial Electronics and
Applications (ICIEA), Jun 2016.
[10] F. Blaabjerg, R. Teodorescu, M. Liserre and A. V.
Timbus, “Overview of Control and Grid
Synchronization for Distributed Power Generation
Systems,” IEEE Transactions on Industrial Electronics,
vol. 53, pp.1398-1409, Oct 2006.
Author Profile
Dario De Santis received his B.Sc. and M.Sc.
degrees in Electrical Engineering from the
Polytechnic University of Bari in 2011 and
2014 respectively. Now he is a licensed
Senior Electrical Engineer and he is pursuing
a Ph.D. degree in Electrical Engineering. His
research interests include power electronics for low voltage
electrical grids, electrical mobility and smart metering
systems for grid automation.
Paper ID: ART20173045 DOI: 10.21275/ART20173045 292