10
Douglas Deans A Geostationary Weather Satellite Station A New Geostationary Weather Satellite Station by Douglas Deans
| Date post: | 25-Aug-2018 |
| Category: |
Documents |
| Upload: | nguyenthien |
| View: | 221 times |
| Download: | 1 times |
Douglas Deans A Geostationary Weather Satellite Station
A NewGeostationary
Weather SatelliteStation
by Douglas Deans
Douglas Deans A Geostationary Weather Satellite Station
1
A New Geostationary Weather Satellite StationDouglas Deans
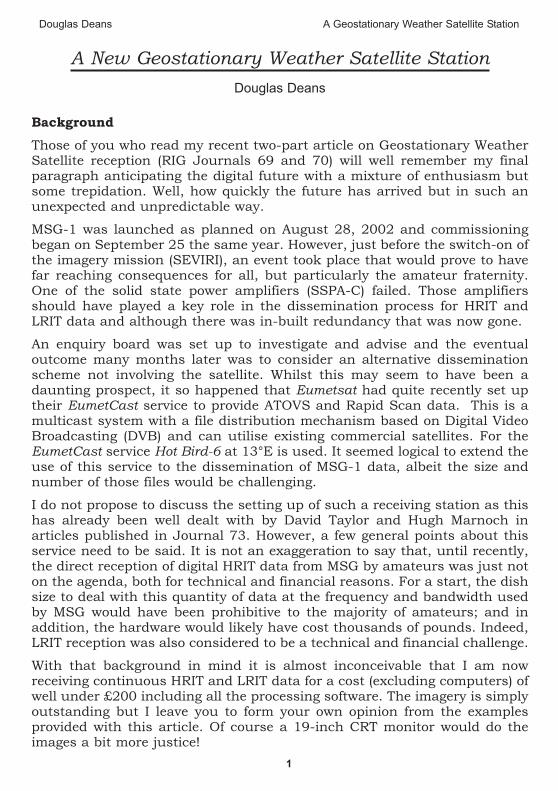
BackgroundThose of you who read my recent two-part article on Geostationary WeatherSatellite reception (RIG Journals 69 and 70) will well remember my finalparagraph anticipating the digital future with a mixture of enthusiasm butsome trepidation. Well, how quickly the future has arrived but in such anunexpected and unpredictable way.
MSG-1 was launched as planned on August 28, 2002 and commissioningbegan on September 25 the same year. However, just before the switch-on ofthe imagery mission (SEVIRI), an event took place that would prove to havefar reaching consequences for all, but particularly the amateur fraternity.One of the solid state power amplifiers (SSPA-C) failed. Those amplifiersshould have played a key role in the dissemination process for HRIT andLRIT data and although there was in-built redundancy that was now gone.
An enquiry board was set up to investigate and advise and the eventualoutcome many months later was to consider an alternative disseminationscheme not involving the satellite. Whilst this may seem to have been adaunting prospect, it so happened that Eumetsat had quite recently set uptheir EumetCast service to provide ATOVS and Rapid Scan data. This is amulticast system with a file distribution mechanism based on Digital VideoBroadcasting (DVB) and can utilise existing commercial satellites. For theEumetCast service Hot Bird-6 at 13°E is used. It seemed logical to extend theuse of this service to the dissemination of MSG-1 data, albeit the size andnumber of those files would be challenging.
I do not propose to discuss the setting up of such a receiving station as thishas already been well dealt with by David Taylor and Hugh Marnoch inarticles published in Journal 73. However, a few general points about thisservice need to be said. It is not an exaggeration to say that, until recently,the direct reception of digital HRIT data from MSG by amateurs was just noton the agenda, both for technical and financial reasons. For a start, the dishsize to deal with this quantity of data at the frequency and bandwidth usedby MSG would have been prohibitive to the majority of amateurs; and inaddition, the hardware would likely have cost thousands of pounds. Indeed,LRIT reception was also considered to be a technical and financial challenge.
With that background in mind it is almost inconceivable that I am nowreceiving continuous HRIT and LRIT data for a cost (excluding computers) ofwell under £200 including all the processing software. The imagery is simplyoutstanding but I leave you to form your own opinion from the examplesprovided with this article. Of course a 19-inch CRT monitor would do theimages a bit more justice!
2
Douglas Deans A Geostationary Weather Satellite Station
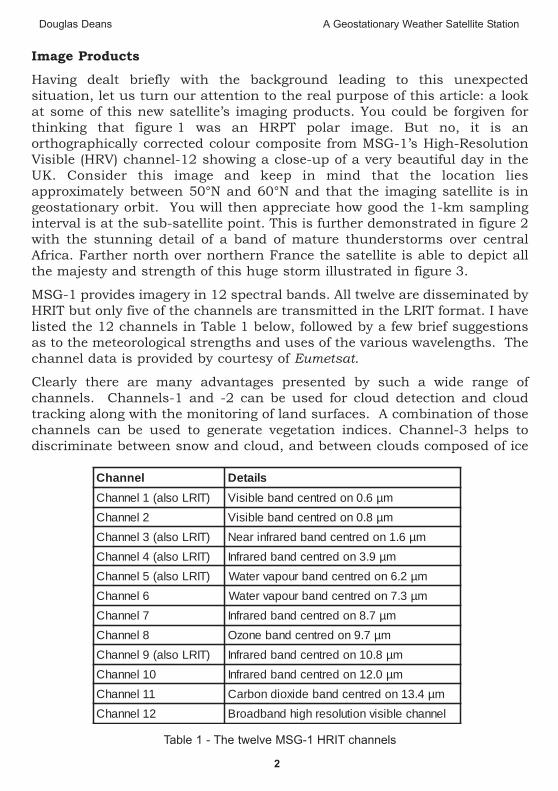
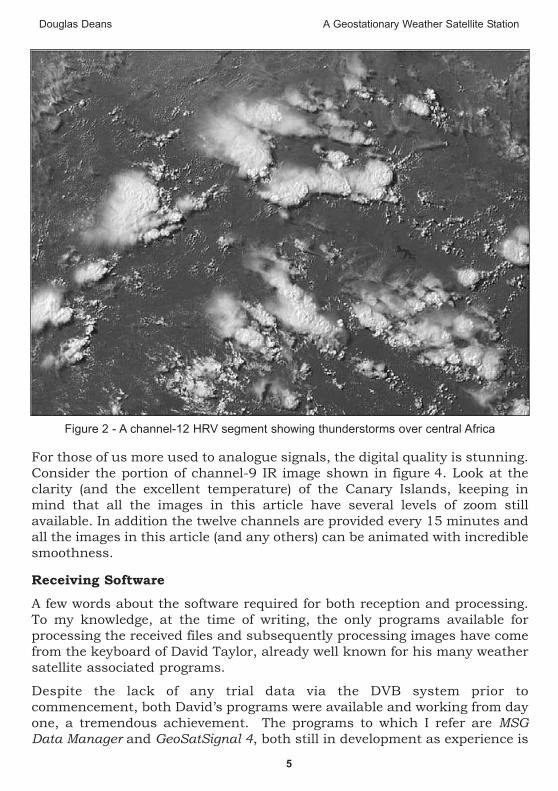
Image ProductsHaving dealt briefly with the background leading to this unexpectedsituation, let us turn our attention to the real purpose of this article: a lookat some of this new satellite’s imaging products. You could be forgiven forthinking that figure 1 was an HRPT polar image. But no, it is anorthographically corrected colour composite from MSG-1’s High-ResolutionVisible (HRV) channel-12 showing a close-up of a very beautiful day in theUK. Consider this image and keep in mind that the location liesapproximately between 50°N and 60°N and that the imaging satellite is ingeostationary orbit. You will then appreciate how good the 1-km samplinginterval is at the sub-satellite point. This is further demonstrated in figure 2with the stunning detail of a band of mature thunderstorms over centralAfrica. Farther north over northern France the satellite is able to depict allthe majesty and strength of this huge storm illustrated in figure 3.
MSG-1 provides imagery in 12 spectral bands. All twelve are disseminated byHRIT but only five of the channels are transmitted in the LRIT format. I havelisted the 12 channels in Table 1 below, followed by a few brief suggestionsas to the meteorological strengths and uses of the various wavelengths. Thechannel data is provided by courtesy of Eumetsat.
Clearly there are many advantages presented by such a wide range ofchannels. Channels-1 and -2 can be used for cloud detection and cloudtracking along with the monitoring of land surfaces. A combination of thosechannels can be used to generate vegetation indices. Channel-3 helps todiscriminate between snow and cloud, and between clouds composed of ice
lennahC sliateD
)TIRLosla(1lennahC mµ6.0nodertnecdnabelbisiV
2lennahC mµ8.0nodertnecdnabelbisiV
)TIRLosla(3lennahC mµ6.1nodertnecdnabderarfniraeN
)TIRLosla(4lennahC mµ9.3nodertnecdnabderarfnI
)TIRLosla(5lennahC mµ2.6nodertnecdnabruopavretaW
6lennahC mµ3.7nodertnecdnabruopavretaW
7lennahC mµ7.8nodertnecdnabderarfnI
8lennahC mµ7.9nodertnecdnabenozO
)TIRLosla(9lennahC mµ8.01nodertnecdnabderarfnI
01lennahC mµ0.21nodertnecdnabderarfnI
11lennahC mµ4.31nodertnecdnabedixoidnobraC
21lennahC lennahcelbisivnoituloserhgihdnabdaorB
Table 1 - The twelve MSG-1 HRIT channels
Douglas Deans A Geostationary Weather Satellite Station
3
crystals and water droplets. Channel-4 is ideal for detecting low cloud andfog at night and can also be used for the measurement of land and seatemperatures at night. Channels-5 and -6 measure the mid-atmospherewater vapour while channel-7 also helps to discriminate between ice andwater clouds.
Channel-8 is responsive to ozone concentration in the lower stratosphere,channels-9 and -10, used together, help to reduce atmospheric effects whenmeasuring surface and cloud top temperatures whilst channel-11 is thecarbon dioxide absorption channel. The high-resolution visible channel-12has a sampling interval of 1kilometre.
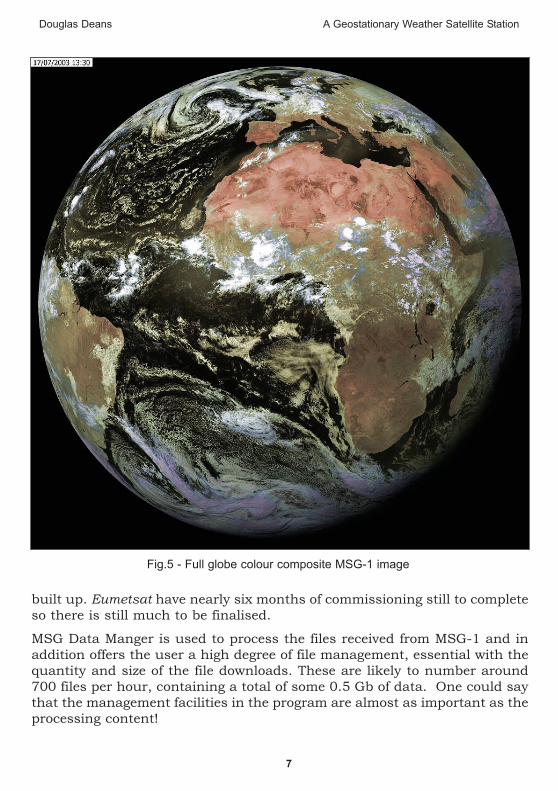
For amateur purposes there seems little point in saving all 12 channels. Aselection of a visible, water vapour and IR along with the HRV seems a goodmix, and also provides excellent colour composites as demonstrated infigure 5 (see centre pages). However, if for example there were a need to viewfog details etc. then the relevant channel(s) can be selected to help. This isso easy to do with quarter hour scans.
Figure 1 - MSG-1 channel-12 High Resolution image of Great Britain
4
Douglas Deans A Geostationary Weather Satellite Station
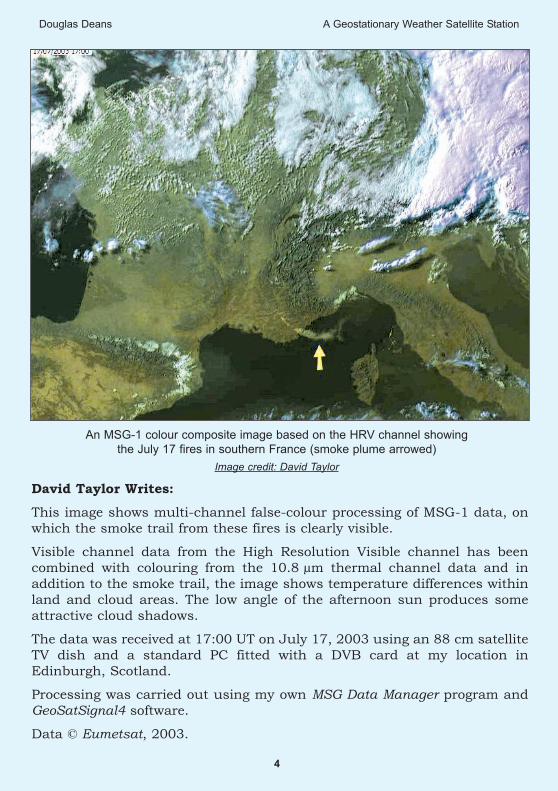
An MSG-1 colour composite image based on the HRV channel showingthe July 17 fires in southern France (smoke plume arrowed)
Image credit: David Taylor
David Taylor Writes:This image shows multi-channel false-colour processing of MSG-1 data, onwhich the smoke trail from these fires is clearly visible.
Visible channel data from the High Resolution Visible channel has beencombined with colouring from the 10.8 µm thermal channel data and inaddition to the smoke trail, the image shows temperature differences withinland and cloud areas. The low angle of the afternoon sun produces someattractive cloud shadows.
The data was received at 17:00 UT on July 17, 2003 using an 88 cm satelliteTV dish and a standard PC fitted with a DVB card at my location inEdinburgh, Scotland.
Processing was carried out using my own MSG Data Manager program andGeoSatSignal4 software.
Data © Eumetsat, 2003.
Douglas Deans A Geostationary Weather Satellite Station
5
Figure 2 - A channel-12 HRV segment showing thunderstorms over central Africa
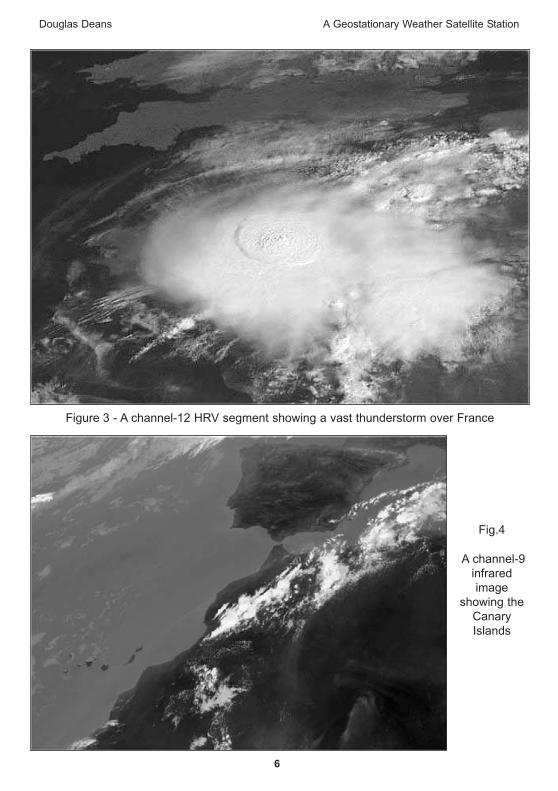
For those of us more used to analogue signals, the digital quality is stunning.Consider the portion of channel-9 IR image shown in figure 4. Look at theclarity (and the excellent temperature) of the Canary Islands, keeping inmind that all the images in this article have several levels of zoom stillavailable. In addition the twelve channels are provided every 15 minutes andall the images in this article (and any others) can be animated with incrediblesmoothness.
Receiving SoftwareA few words about the software required for both reception and processing.To my knowledge, at the time of writing, the only programs available forprocessing the received files and subsequently processing images have comefrom the keyboard of David Taylor, already well known for his many weathersatellite associated programs.
Despite the lack of any trial data via the DVB system prior tocommencement, both David’s programs were available and working from dayone, a tremendous achievement. The programs to which I refer are MSGData Manager and GeoSatSignal 4, both still in development as experience is
6
Douglas Deans A Geostationary Weather Satellite Station
Figure 3 - A channel-12 HRV segment showing a vast thunderstorm over France
Fig.4
A channel-9infraredimage
showing theCanaryIslands
Douglas Deans A Geostationary Weather Satellite Station
7
Fig.5 - Full globe colour composite MSG-1 image
built up. Eumetsat have nearly six months of commissioning still to completeso there is still much to be finalised.
MSG Data Manger is used to process the files received from MSG-1 and inaddition offers the user a high degree of file management, essential with thequantity and size of the file downloads. These are likely to number around700 files per hour, containing a total of some 0.5 Gb of data. One could saythat the management facilities in the program are almost as important as theprocessing content!
8
Douglas Deans A Geostationary Weather Satellite Station
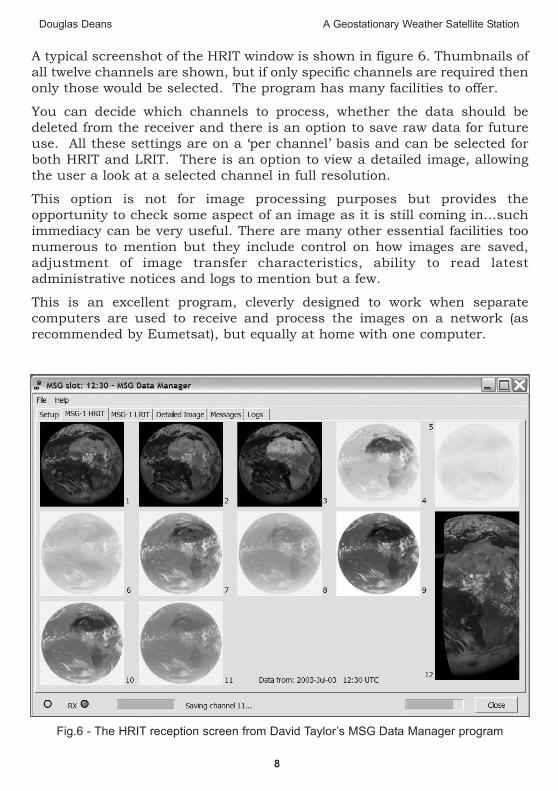
Fig.6 - The HRIT reception screen from David Taylor’s MSG Data Manager program
A typical screenshot of the HRIT window is shown in figure 6. Thumbnails ofall twelve channels are shown, but if only specific channels are required thenonly those would be selected. The program has many facilities to offer.
You can decide which channels to process, whether the data should bedeleted from the receiver and there is an option to save raw data for futureuse. All these settings are on a ‘per channel’ basis and can be selected forboth HRIT and LRIT. There is an option to view a detailed image, allowingthe user a look at a selected channel in full resolution.
This option is not for image processing purposes but provides theopportunity to check some aspect of an image as it is still coming in…suchimmediacy can be very useful. There are many other essential facilities toonumerous to mention but they include control on how images are saved,adjustment of image transfer characteristics, ability to read latestadministrative notices and logs to mention but a few.
This is an excellent program, cleverly designed to work when separatecomputers are used to receive and process the images on a network (asrecommended by Eumetsat), but equally at home with one computer.
Douglas Deans A Geostationary Weather Satellite Station
9
For subsequent processing of images David has further developed hisGeoSatSignal program, already well known to many, to process the MSGimages. GeoSatSignal 4 now does for MSG what GeoSatSignal did for theother geostationary satellites. The results are beautiful close up images suchas the one shown in fig.1, amazing colour composites, and incredible butterysmooth 15 minute animations of anything you choose.
ConclusionWith nearly six months of the trial remaining there is still much to be doneby Eumetsat and a great deal to be learned by all of us. It is an exciting timeand a great privilege, as an amateur, to be taking part and experiencing firsthand the trials and tribulations of commissioning not just a new satellite buta completely new and unexpected dissemination system.
HRIT data is simply the best there is anywhere in the world at the moment,and I still have to pinch myself when I see it flowing freely into my computer.


