Scientific Papers (www.scientificpapers.org) Journal of Knowledge Management, Economics and Information Technology 1 Vol. III, Issue 6 December 2013 A New Heart Arrhythmia’s Detection Algorithm Authors: Farid Rezazadeh, Department of Computer Engineering, Faculty of Engineering, [email protected], Seyed Amin Hosseini Seno, Computer Network Research Laboratory, Ferdowsi University of Mashhad, [email protected]In this paper we present the RRP algorithm with new adaptive method with new solution to resolve respective problem RR interval algorithm in heart signal processing. At first we focus on some previous research, to conclude that, the important ECG processing algorithms discussed on deviation of ST section, width, height and duration of ORS complex of heart signal, efficient diagnosis, noise filtering contain baseline shifts, muscle artefacts and electrode motion. Also RRP algorithm include three parts of signal processing, determination signal features and compare with previously established patient heart signal. In the last stage, using adaptive threshold values for peak detection routines were used for the heart patients with various conditions. The algorithm efficiency is simulated and compared with conventional RR interval algorithm by MATLAB. Keywords: ECG; heart; QRS Detection; RRP algorithm Introduction ECG is a graphical representation of the heart impulses. A conventional ECG waves formed under contract with the letters P, Q, R, S, T, have been named. Result of impulses natural speed and direction makes normal sinus rhythm. Otherwise, represent the heart disease.
Transcript
Scientific Papers (www.scientificpapers.org) Journal of Knowledge Management, Economics and Information Technology
1
Vol. III, Issue 6 December 2013
A New Heart Arrhythmia’s Detection Algorithm
Authors: Farid Rezazadeh, Department of Computer Engineering, Faculty of Engineering, [email protected], Seyed Amin Hosseini Seno, Computer Network Research Laboratory, Ferdowsi University of Mashhad, [email protected]
In this paper we present the RRP algorithm with new adaptive method with new solution to resolve respective problem RR interval algorithm in heart signal processing. At first we focus on some previous research, to conclude that, the important ECG processing algorithms discussed on deviation of ST section, width, height and duration of ORS complex of heart signal, efficient diagnosis, noise filtering contain baseline shifts, muscle artefacts and electrode motion. Also RRP algorithm include three parts of signal processing, determination signal features and compare with previously established patient heart signal. In the last stage, using adaptive threshold values for peak detection routines were used for the heart patients with various conditions. The algorithm efficiency is simulated and compared with conventional RR interval algorithm by MATLAB. Keywords: ECG; heart; QRS Detection; RRP algorithm
Introduction
ECG is a graphical representation of the heart impulses. A conventional ECG waves formed under contract with the letters P, Q, R, S, T, have been named. Result of impulses natural speed and direction makes normal sinus rhythm. Otherwise, represent the heart disease.
A New Heart Arrhythmia’s Detection Algorithm
2
Vol. III, Issue 6 December 2013
Waves, Q, R, S forms a group together as QRS complexes are discussed. The Complex QRS, ventricular electrical depolarization wave (contraction of the ventricles) show. The Broad QRS duration indicates abnormal or prolonged ventricular polarization.
Segment ST, this piece of time between the completion and start depolarization ventricular muscle. This item may be a transient ischemia and muscle damage goes up or down.
T wave represents ventricular depolarization, if it is negative definite MI.
In sinus tachycardia as shown in fig 1, the production rate is faster than 100 beats per minute and In sinus bradycardia the production rate is less than 60 beats per minute, but the signal will be guided by the normal route.
Normal Sinus Rhythm
Sinus Tachycardia
Sinus Bradycardia Figure 1: A sample graph for Heart Disease[24]
Tachycardia, arrhythmia include irreducible, ventricular
Sinus bradycardia include Stop arrhythmia, ventricular escape rhythm at Block Level 3, Block mobitz type II.
Literature review
In the last decade, a lot of new techniques have been proposed for the detection of QRS complexes, for example, algorithms based on artificial neural networks, genetic algorithms, and wavelet transforms, filter banks and hierarchical methods based on nonlinear transformations.
A New Heart Arrhythmia’s Detection Algorithm
3
Vol. III, Issue 6 December 2013
The primary research
A. Characteristics of the signal processing algorithms Biological signal processing is done in 4 steps: Signal Measuring and Registering. Signal Conversion. Estimate the signal parameters. Interpretation or classification of signals Signals that are produced by body organs are mixed with each other or by noise, separating the desired signal from mixed signal and extract the useful signal is kind of Signal processing. The main parts of the algorithm are:
• To obtain maximum value of signal to noise ratio, recording should be near to the signal source
• Detection method based on the least amount of false positives (FP) and the minimum value of false negative (FN) be used.
• Noise removing with using filters. The band of ECG signal frequency is between 15 to 150 Hz, muscle activity Noise Frequency is above 150 Hz; baseline oscillation frequency is lower than 1 Hz (Baseline noise through electrode get in touch impedance and body changes).
B. Using a standard database MIT / BIH Arrhythmia for evaluation algorithms
An efficient algorithm for detecting and classifying the ECG to detect and classify certain cardiac arrhythmia's An efficient algorithm for detecting and classifying the ECG to detect and classify certain cardiac dangerous arrhythmia's is divided to in multiple stage .
In the first stage , the QRS complex detection do filters techniques Then QRS peak detection method try to find Start and end points of the QRS complex . The information obtained using data annotation famous MIT/BIH Arrhythmia Database is evaluated. In this algorithm Cardiac signal characterization is also possible, even in the presence of noise and interference signal.
A New Heart Arrhythmia’s Detection Algorithm
4
Vol. III, Issue 6 December 2013
C. First detection algorithm As noted in Section A, ECG frequency band is between 15 to 150 Hz. Baseline oscillation frequencies below 1 Hz and above 150 Hz frequency noise is caused by the muscles. The preprocessing algorithm is divided into two parts.
• Filter : feature extraction stage with linear and nonlinear filters • peak detection : To find the location & duration of the peak signal The decision algorithm is divided into three phases • Ventilation : threshold values are determined
Based on peak detection, signal levels and signal to noise ratio (Two sets threshold values are used to detect heart signals (a) filter threshold values (b) integrated window threshold values)
• Learning: The RR interval Average value and the heart rate limit bound.
• QRS detection : QRS wave detection and differentiation of T -wave measurements
D. Preprocessing algorithms Event Vector measurements
The best ECG signal to noise ratio produces by event vector which One of the simplest and most common noise simulation methods, with normal distribution assumption.
• The ECG signals starter point’s mark. • The parallel average is applied on all signals.
The size of result signal is multiple size of the main waveform. If the number of signals increased then the enhanced signal is obtained and will lead to better result.
E. Fetal heart rate Bit calculation algorithm Fetal heart rate is one of the few signals which may register as a non-invasive. In many cases the only available information source is the power spectrum of fetal heart rate. The fetal heart rate algorithm is performed in two stages.
• Filter: the best estimation frequency for low pass filter is 2 Hz. the output waveforms is some bumps without any sharp point.
A New Heart Arrhythmia’s Detection Algorithm
5
Vol. III, Issue 6 December 2013
• Autocorrelation: the bit rate is obtained with frequency domain autocorrelation. Heart rate corresponds to distance between the cardiac cycle (n) and the cardiac cycle earlier (n-1).
F. Comparison of algorithms MOBD ، Hamilton-Tompkins ، Okada
1. MOBD: Algorithm MOBD (Multiplication Of the Backward
Deference) : a low response time with Adequate accuracy is performed in three phases
• Reduce the number of bits • the calculation of non-linear conversion
If the formula results sign suddenly changes (by noise signal) then
the output value will be zero. • Interpretation the result value with threshold value achieved by
standard database to limit the range of information.
2. Hamilton-Tompkins : Algorithms Hamilton- Tompkins : a high accuracy with high response time is performed in two phases
• The linear and nonlinear signal processing, include filter and preparation of the Event Vector by combination low pass with high pass filter, Real Time execution needs integer calculation. The Chi-squares nonlinear function of each data point output.
• The classification rules based on the signal and noise signal slope, amplitude and width numerical analysis .Peak Level threshold value is usually half of the maximum value.
3. Okada: OKADA Algorithm: a fast response time with high accuracy.
Only focus on trying to remove noise by digital filter and also eliminates the noise component of the signal and therefore useful accuracy comes down But the speed is very high.
A New Heart Arrhythmia’s Detection Algorithm
6
Vol. III, Issue 6 December 2013
G. TDE(Time Delay Estimation) Algorithm Signal processing method with TDE (Time Delay Estimation) technique based on GCC (Generalized cross correlation), zero mean Gaussian noise models is closer to reality. The malicious and reflections noise factors tolerant could cause decrease efficiency. The bit rate algorithm is performed in two steps.
1. Filter: there is an estimate capped by a low pass filter with 2 Hz cut-off frequency. The filtered waveform is without spines. The cardiac cycle time positions pattern, implement by overall estimate peak detector rough.
2. Autocorrelation: the bit rate is obtained with frequency domain autocorrelation. Heart rate corresponds to distance between the cardiac cycle (n) and the cardiac cycle earlier (n-1). • The distance between cardiac cycle (n) positions and cardiac
earlier cycle (n-1) positions after fixed time delay, generates the heart rate.
• Similarly, the next cardiac cycle (n+1) position is defined with the delay time interval.
• In all the test data, milliseconds delay D, is the boundary between two consecutive cycles, which cause the heart rate limits based on the bit.
• The fixed time delay start depends on heart rate and estimated time equally between cycles (n+1), cycle (n-1).
• The time shift is equal to time between two successive cycles is inversely proportional to heart rate.
• The registration and transfer of all critical signals or noise disturbance enters needs to essential method for increasing the signal to noise ratio is.
H. QRS peak detection algorithm using LABVIEW software and
processor WINDAG
1. Boost: Download and boost ECG circuit: • ECG signal actually contains the difference of two signals from
two distinct reference of a body part , usually located on the right ankle , and the filter strengthen the AD705
A New Heart Arrhythmia’s Detection Algorithm
7
Vol. III, Issue 6 December 2013
• Both left and right sides of the heart signal is received. Cardiac signals can easily get with the AD620, and then get up difference between the two signals.
• The boost ECG signal, Needs the big gain amplifier. 2. Interface circuit:
• USART asynchronous serial communication protocols are used. • The voltage levels converters such as Max233; Max232 chip with
5 volt power supply is used. • RS232 serial port is used for serial communication • the ECG amplified signal applies to detection algorithm , as
follows: A:The hearts analog signal obtained B: the analog signal should be converted to digital C: the information should be encoded serially before send. D: the LABVIEW pass filter is as the embedded block. F: the automatic peak detection threshold is based on
cardiac signals characteristics. 3. View : the signal presentation in LABVIEW display
I. ECG ASPARS algorithm is a three-stage High Resolution QRS
Detection model. Algorithm can be divided into three stages:
1. Estimation: The initial estimation obtains the valid R wave points. 2. Squares: Chi-squares non-linear function for computes. The average
values for each data points with 20 KHZ sampling rate. The classification rules are based on numerical slope, amplitude and width signal analysis. Peak Level is used to distinguish noise from signal, which is usually half of the maximum peak to peak values.
3. Peak detection: data extraction of the R wave with a peak detection window which is placed on the center of valid points.
Pattern recognition methods
The classes of patterns are pre specified ratio, Classifier algorithm called pattern recognition which makes the class attribute pattern. Pattern recognition techniques have generally fall into three categories:
A New Heart Arrhythmia’s Detection Algorithm
8
Vol. III, Issue 6 December 2013
1. Statistical methods: patterns and classes are generated with probability distribution.
2. Structure (analytic): patterns and classes are characterized by formal structures. In these methods, the basic units are defined as Primitive. All models are expressed in terms of the inter relationships between Primitive Grammar. In most cases, these methods are applied to certain structural pattern.
3. ANN: artificial neural networks, each pattern are described in terms of several characteristics. Point’s attributes are considered in a multidimensional space. Feature space is divided into several regions corresponding to each class. Pre specified classes in supervised classification by training data determine the boundaries of different classes, there confirm the marked areas. Template feature vector obtained through measurement or observation. in general , Pattern recognition includes the following system components : • filter : Register sensors and preprocessing • Patterns: Feature Extraction which specifies the attributes.
Suitable properties have two important properties: First, all models have the collection properties which belong to the same class. Second, the patterns are belonged to other classes do not have those features.
• Classifier: classifier which has feature space into regions are labeled and related to each class partitions. The classifier is characterized by the collection set of discrete functions.
• Monitor: the Monitor provides information about the training data.
In unsupervised learning data is corresponded to classes without any initial information. In the clustering step, basically, similar to supervised learning, the data is placed in different clusters.
A. Error back propagation algorithm (BPA) used in neural networks.
Artificial neural networks (ANNs) networks are inspired by living organisms that are used in pattern recognition. ANN classification Decision making process in medical data characteristics is suitable. Usually, multilayer neural networks using error back propagation algorithm (BPA) which is the
A New Heart Arrhythmia’s Detection Algorithm
9
Vol. III, Issue 6 December 2013
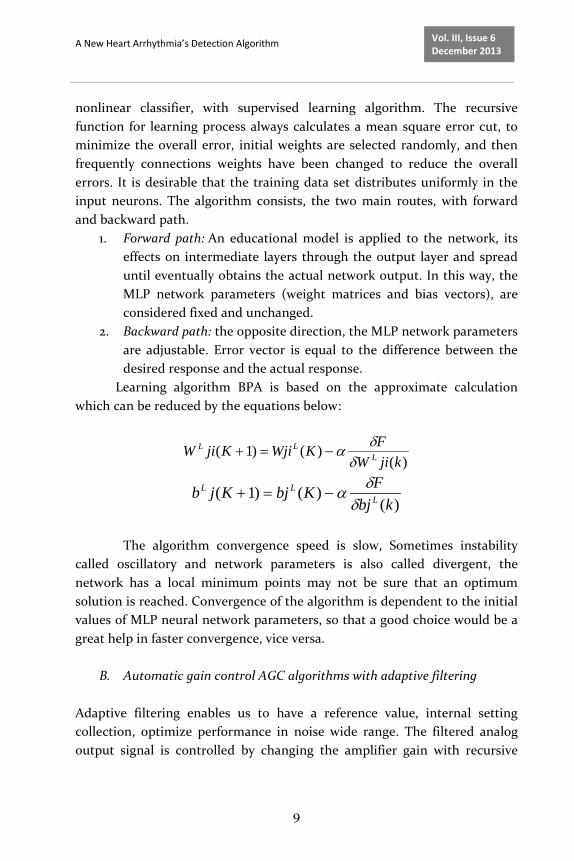
nonlinear classifier, with supervised learning algorithm. The recursive function for learning process always calculates a mean square error cut, to minimize the overall error, initial weights are selected randomly, and then frequently connections weights have been changed to reduce the overall errors. It is desirable that the training data set distributes uniformly in the input neurons. The algorithm consists, the two main routes, with forward and backward path.
1. Forward path: An educational model is applied to the network, its effects on intermediate layers through the output layer and spread until eventually obtains the actual network output. In this way, the MLP network parameters (weight matrices and bias vectors), are considered fixed and unchanged.
2. Backward path: the opposite direction, the MLP network parameters are adjustable. Error vector is equal to the difference between the desired response and the actual response.
Learning algorithm BPA is based on the approximate calculation which can be reduced by the equations below:
)()()1(
kjiWFKWjiKjiW L
LL
δδα−=+
)()()1(
kbjFKbjKjb L
LL
δδα−=+
The algorithm convergence speed is slow, Sometimes instability
called oscillatory and network parameters is also called divergent, the network has a local minimum points may not be sure that an optimum solution is reached. Convergence of the algorithm is dependent to the initial values of MLP neural network parameters, so that a good choice would be a great help in faster convergence, vice versa.
B. Automatic gain control AGC algorithms with adaptive filtering Adaptive filtering enables us to have a reference value, internal setting collection, optimize performance in noise wide range. The filtered analog output signal is controlled by changing the amplifier gain with recursive
A New Heart Arrhythmia’s Detection Algorithm
10
Vol. III, Issue 6 December 2013
algorithm, In fact, algorithm are presented as gain amplifiers automatic code to set the adaptive digital filter threshold values .
C. QRS Detection Algorithm with FPGA FPGA consists an array include hundreds of configurable blocks, which can run all kinds of digital logic functions with blocks connection wires. The logical functions performed by each blocks and the electronic switch controls wiring between blocks. The switch configuration is determined in the FPGA configuration memory cells contents. FPGA is used in the cardiac signals analysis and diagnose heart defects by wavelet transform with ALS Adaptive Lifting Scheme implementation, Split into three stages.
1. Split: To break even and odd signal into two signals from ECG signal successive samples.
2. Filter: The noise which is reduced with update the step pass filter. 3. Detection: Predict step which improve the detection accuracy.
D. Mapping algorithm with delay Phase Portrait
1. Register: to receive signals from the sensors and data mapping in
two dimension space. 2. Filter: low-pass filter with preprocessing and computation Phase
Portrait 3. Peak detection: if R peak value is bigger than threshold value then
QRS decision rules runs, otherwise if the R peak value is bigger than RR intervals mean value then reduces the threshold value and also decision rules runs.
E. Multivariate cardiac signals analysis algorithms
1. Register : to receive signals from sensors 2. filter : Pre-processing and filtering 3. Pattern: Feature Extraction which specifies the attributes. 4. Classifiers : which has feature space into regions 5. Training: Supervisor will provide information about each categories
training data. Accordingly, the feature space regions boundaries will be determined.
A New Heart Arrhythmia’s Detection Algorithm
11
Vol. III, Issue 6 December 2013
6. Learning: unsupervised learning is without any initial information about the class corresponds data.
Wavelet transforms methods
Fourier transforms to obtain the filtered signal in the time domain. Unwanted and undesired frequency components from the signal frequency spectrum are removed. Finally the inverse Fourier transform executes. The main idea is that the signal frequency spectrum made up a trigonometric functions combination which is converted by Fourier transforms Frequency and then inverse Fourier transform.
A. MALLAT Algorithm with wavelet transforms dyadic discrete MALLAT algorithm is more suitable for discrete signals with discrete wavelet transform may be implemented by the number of times. The high and low pass filters make impulse response with finite length . The down sampling action removes redundancy from signal and can increases pass
filter later stage signal scale . MALLAT algorithm with wavelet transition delayed can detects the heart defects by octet equivalent filter bank.
B. The algorithm combines Wavelet transform with QRS wave detector
Method implementation Wavelet transform with Analog QRS wave detector with Gabor wavelet filter, constant circuit, Peak detector and comparator. Adjustable threshold value is calculated according to the following formula
The main idea of Wavelet transform is analysis a signal from various
views on scale and location parameters. In addition, in order to avoid redundancy, the scale parameter select along the sequence of binary
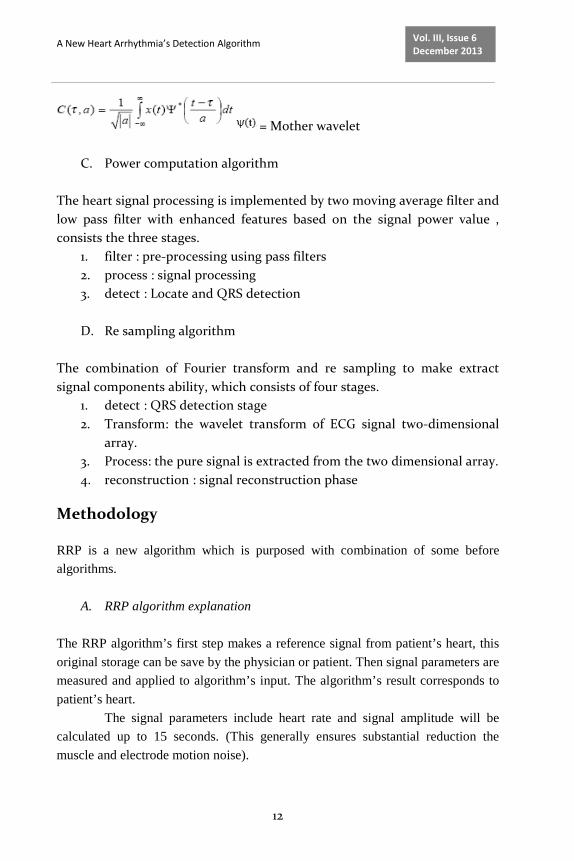
The Wavelet transform function compute from this formula
A New Heart Arrhythmia’s Detection Algorithm
12
Vol. III, Issue 6 December 2013
= Mother wavelet
C. Power computation algorithm The heart signal processing is implemented by two moving average filter and low pass filter with enhanced features based on the signal power value , consists the three stages.
1. filter : pre-processing using pass filters 2. process : signal processing 3. detect : Locate and QRS detection
D. Re sampling algorithm
The combination of Fourier transform and re sampling to make extract signal components ability, which consists of four stages.
1. detect : QRS detection stage 2. Transform: the wavelet transform of ECG signal two-dimensional
array. 3. Process: the pure signal is extracted from the two dimensional array. 4. reconstruction : signal reconstruction phase
Methodology
RRP is a new algorithm which is purposed with combination of some before algorithms.
A. RRP algorithm explanation The RRP algorithm’s first step makes a reference signal from patient’s heart, this original storage can be save by the physician or patient. Then signal parameters are measured and applied to algorithm’s input. The algorithm’s result corresponds to patient’s heart.
The signal parameters include heart rate and signal amplitude will be calculated up to 15 seconds. (This generally ensures substantial reduction the muscle and electrode motion noise).
A New Heart Arrhythmia’s Detection Algorithm
13
Vol. III, Issue 6 December 2013
B. Two algorithm’s assumptions: 1. tachycardia : To ensure that we suppose , wherever heart rate is greater
than 100 beats per minute (in both normal and alarm status), arrhythmia or tachycardia rhythm is issued
2. Bradycardia: To ensure that we suppose, whenever the heart rate is lower than 60 beats per minute in both the state’s normal rhythm arrhythmia and bradycardia is issued.
C. Algorithm steps : 1. filter low : remove Baseline Noise 2. Least Square : Remove the noise filter (zero phase) and Least Squares
(Least Sq.) with appropriate sampling frequency 3. Resample : Interpolation calculated using the Resample FFT points 4. filter high : Noise muscle electrode movement 5. RR interval: Calculate the RR interval calculations based on peak
detection threshold values based on a patient’s signal. 6. Sliding window: Calculate the minimum and maximum frequency values
for heart signal sliding window. 7. Process 1: calculate the RR interval parameters sinus tachycardia, sinus
arrest or heart diagnosed as Function absence of atrial sinus node is known from bradycardia status.
8. Process 2: control and distinguish the QRS, P, T wave for Diagnosis arrhythmias from tachycardia.
9. process 3 : Risk rate was normalized to the corresponding alarm will be issued
Research simulation
RRP algorithm has been compared with MATLAB simulation. Initially, the heart signal with different noise is simulated in MATLAB as shown in fig 2:
A New Heart Arrhythmia’s Detection Algorithm
14
Vol. III, Issue 6 December 2013
Figure 2: Heart signal with noise diagram In the next stage, the baseline noise is removed by subtracting the
average signal with formula: Using ECG - mean (ECG) as shown in fig 3
Figure 3: Remove Baseline Noise diagram
In next stage, the zero phase digital filter is applied to ECG signal processing the without Baseline Noise in both the forward and backward directions. The result has many characteristics such as reduce noise and
A New Heart Arrhythmia’s Detection Algorithm
15
Vol. III, Issue 6 December 2013
preserves the QRS complex at the same time without making delay .as shown in fig 4 , FILTFILT function in MATLAB simulates it.
Figure 4: Zero phase noise removal filter and Least Squares diagram
In the next stage, one dimensional interpolation with Fourier
transform (FFT based) method applies to calculate the Resample two percentage points. As shown in fig 5 INTERPFT function in MATLAB simulates it.
Figure 5: Interpolation FFT Resample method
In the next stage, one dimensional median filter is applied with the sliding window which replace the center value by mean pick points value( That’s a nonlinear method ). As shown in fig 6, INTERPFT function in MATLAB simulates it.
A New Heart Arrhythmia’s Detection Algorithm
16
Vol. III, Issue 6 December 2013
Figure 6: Noise filter with least squares and 2 Hz sample frequency
In the next stage, the conventional thresholds values are applied to
peak detection routines. As shown in fig 7, with MATLAB Programming simulates it.
Figure 7: RR interval calculated based on peak detection calculations
In the next stage, the conventional thresholds values are applied to peak detection routines for patient's heart signal. As shown in fig 8, with MATLAB Programming simulates it. Which is useless result for Established heart disease?
A New Heart Arrhythmia’s Detection Algorithm
17
Vol. III, Issue 6 December 2013
Figure 8: Calculations based on a patient's RR interval peak detection
If certain threshold values derived from patient’s heart are changed
the result for the patient's heart signal, as shown in fig 9, with MATLAB Programming simulates it. Which is useful result for Established heart disease?
Figure 9: Calculations based on a patient's RR interval peak detection with
adaptive parameters
Conclusions
In this paper, some important algorithms in the cardiac arrhythmias, time and frequency field and by linear and nonlinear functions was described. At the end, the combination of these algorithms which provides a new
A New Heart Arrhythmia’s Detection Algorithm
18
Vol. III, Issue 6 December 2013
algorithm with more flexibility in heart pulse counting and QRS, T, P wave detection. Obviously this method has been as a diagnostic tool to assist physicians in cardiac disease analyzing. However in generally, these tools result never has 100% recognition accuracy. The accuracy of these tools depends on several factors; include the threshold values which are main matter in this new algorithm. Of course, as the simulation results presented demonstrates, the RRP algorithm’s accuracy and efficiency is high. As a general conclusion it can be said that the RRP algorithm can be used as a diagnostic tool for heart health trustworthy.
References
[1] J PAN, (MARCH 1985), A Real-Time QRS Detection Algorithm-mirel VOL. BME-32. NO. 3. MARCH 1985 Biomedical Engineering, IEEE Transactions
[2] Quantitative investigation of QRS detection rules using the MIT/BIH arrhythmia database by PS HAMILTON VOL. BME-33. NO. 12. DECEMBER 1986 Biomedical Engineering, IEEE Transactions.
[3] R. Czekanowski, R. Zarembast Department of Gynecology and Obstetrics Praski Hospital Warsaw, Poland Critter Int 2002; 16(4): 113-18. J. Perinat. Med. 15 (1987) Suppl. 1.
[4] A COMPARISON OF THREE QRS DETECTION ALGORITHMS. USING THE AHA ECG DATABASE. Seth Suppappola and Ying Sun. Department of Electrical Engineering, University of Rhode Island, Kingston, RI 02881-0805 Seth Suppappola and Ying Sun.
[5] Electrocardiographic Detection of Left Ventricular Hypertrophy by the Simple QRS Voltage-Duration Product THOMAS J. MOLLOY, MD, PETER M. AKIN, MD, FACC, RICHARD B. DEVEREUX, MD, FACC, PAUL KLIGFIELD, MD, FAce. JACC Vol. 20, No.5 November I, 1992:1180-6.
[6] Correspondence Atime Delay Estimator Based on the Signal Integral: Theoretical Performance and Testing on ECG Signals-Pablo Laguna, Raimon Jane and Pere Caminal IEEE TRANSACTIONS ON Signal Processing Vol.42 , No 11 November 1994.
[7] Effects of Autonomic Stimulation and Blockade on Signal-Averaged P Wave Duration ASIM N. CHEEIVlA, MD, MIRZA W. AHMED,
A New Heart Arrhythmia’s Detection Algorithm
19
Vol. III, Issue 6 December 2013
MD,/ELAN H. KADISH, MD, FACC, JEFFREY J. GOLDBERGER, MD, FACCChicago, Illinois JACC Vol. 26, No. 2 August 1995:497-502.
[8] A New Neural Network Sytem for Arrhythmias Classification N.lzeboudjen,center de Developpment des Technologies Avancees Laboratoire Microelectroique 128 ,Mohamad Gacem. EI madania Alger-Algerie –A farah, Ecole Nationale Polytechniques Departemant Electronique 10,avenue Hassen Badi harrach,Alger-Algerie.
[9] A Real-Time Microprocessor QRS Detector System with a 1-ms Timing Accuracy for the Measurement of Ambulatory HRV Antti Ruha,* Member, IEEE, Sami Sallinen, Member, IEEE, and Seppo Nissila IEEE TRANSACTIONS ON BIOMEDICAL ENGINEERING, VOL. 44, NO. 3 MARCH 1997.
[10] A FPGA-Based RealTime QRS Complex Detection Sytem Using Adaptive Lifting Schema –hang Yu.Lixiao Ma.Ru wang.Lai Jiang.Yan Li,Zhen Ji,Yan PingKun and Wang Fei.
[11] ACTS: Automated Calculation of Tachograms and Systograms F. BECKERS, A.E. AUBERT, D. RAMAEKERS, H. ECTOR, F. VAN DE WERF Dept of Cardiology, University Hospital Gasthuisberg, K.U. Leuven, Belgium.
[12] Evaluation of a Wavelet-Based ECG Waveform Detector on the QT Database – JP Martinez,s Olmos,P laguna – Electronics Engineering and Communications Dpt.,University of Zaragoza, Spain.
[14] ANALOG WAVELET TRANSFORM EMPLOYING DYNAMIC TRANSLINEAR CIRCUITS FOR CARDIAC SIGNAL CHARACTERIZATION Sandro A. P. Haddad1, Richard Houben2 and Wouter A. Serdijn1 Electronics Research Laboratory, Faculty of Information Technology and Systems, Delft University of Technology Mekelweg 4, 2628 CD Delft, The Netherlands Email: {s.haddad,w.a.serdijn} @its.tudelft.nl 2 Bakken Research Center
[15] High-Resolution QRS Detection Algorithm for Sparsely Sampled ECG Recordings Timo Bragge, Mika P. Tarvainen, and Pasi A. Karjalainen August 31, 2004 Report No. 1/2004 This manuscript has been submitted to IEEE Trans Biomed Eng University of Kuopio _ Department of Applied Physics P.O.Box 1627, FIN-70211 Kuopio, Finland University of Kuopio Department of Applied Physics Report Series ISSN 0788-4672.
[16] Evaluation of real-time QRS detection algorithms in variable contexts F. Portet IRISA - Institut de Recherche en Informatique et Systèmes Aléatoires And with LTSI - Laboratoire Traitement du Signal et de l’Image Unité INSERM 642 Université de Rennes 1 Campus Beaulieu 35042 Rennes France Author manuscript, published in "Medical & biological engineering & computing. 43, 3 (2005) 381-387".
[17] A NEW QRS DETECTION AND ECG SIGNAL EXTRACTION TECHNIQUE FOR FETAL MONITORING By SUPARERK JANJARASJITT Submitted in partial fulfillment of the requirements For the degree of Doctor of Philosophy Dissertation Advisor: Marc Buchner Department of Electrical Engineering and Computer Science CASE WESTERN RESERVE UNIVERSITY May, 2006.
[18] Relative subjective count and assessment of interruptive technologies applied to mobile monitoring of stress Rosalind W. Picarda,_, Karen K. Liub aMIT Media Laboratory, 20 Ames St. E15-020a, Cambridge, MA 02142, USA bMicrosoft Corporation, 1 Microsoft Way, Redmond, WA, USA Int. J. Human-Computer Studies 65 (2007) 361–375
[19] Diagnosing Dangerous Arrhythmia of Patients by Automatic Detecting of QRS Complexes in ECG Jia-Rong Yeh 1 Ai-Hsien Li2 Jiann-Shing Shieh 1 Yen-An Su 1 Chi-Yu Yang2 International Journal of Biological and Life Sciences 4:4 2008.
[20] A Zig Bee-based ECG transmission for a low cost solution in home care services delivery F. Vergari, V. Auteri, C. Corsi, C. Lamberti Dipartimento di Elettronica, Informatica e Sistemistica (DEIS) ALMA MATER STUDIORUM, Universita’ di Bologna Viale
A New Heart Arrhythmia’s Detection Algorithm
21
Vol. III, Issue 6 December 2013
Risorgimento, 2. 40136 BOLOGNA Mediterranean Journal of Pacing and Electrophysiology.
[21] PORTABLE HEART ATTACK WARNING SYSTEM BY MONITORING THE ST SEGMENT VIA SMARTPHONE ELECTROCARDIOGRAM PROCESSING by Joseph John Oresko II B.S. Electrical Engineering Technology and B.S. Mechanical Engineering Technology, University of Pittsburgh at Johnstown, 2007 Submitted to the Graduate Faculty of Swanson School of Engineering in partial fulfillment of the requirements for the degree of Master of Science in Electrical Engineering University of Pittsburgh 2010.
[22] Droid Jacket: Using an Android based smartphone for Team Monitoring Márcio F.M. Colunas, José M. Amaral Fernandes, Ilídio C. Oliveira, João P. Silva Cunha, Senior Member, IEEE Institute of Electronics Engineering and Telematics (IEETA), Dep. of Electronics, Telecommunications and Informatics University of Aveiro Aveiro, Portugal Accepted for publication at the 7th International Wireless Communications and Mobile Computing Conference – IWCMC 2011 (IEEE Sponsored)
[23] The Deployment of Novel Techniques for Mobile ECG Monitoring Jiunn Huei Yap1, Yun-Hong Noh1 and Do-Un Jeong2* 1 Department of Ubiquitous IT Engineering, Graduate School, Dongseo University, Busan, South Korea 2* Division of Computer & Information Engineering, Graduate School, Dongseo University, Busan, South Korea 2*[email protected] (corresponding author) International Journal of Smart Home Vol. 6, No. 4, October, 2012.
[25] Assessment of Reliability of Hamilton-Tompkins Algorithm to ECG Parameter Detection Saeka Rahman Dhaka University, Bangladesh Mohammad Anwar Rahman University of Southern Mississippi Hattiesburg, MS, USA Proceedings of the 2012 International Conference on Industrial Engineering and Operations Management Istanbul, Turkey, July 3 – 6, 2012
A New Heart Arrhythmia’s Detection Algorithm
22
Vol. III, Issue 6 December 2013
[26] FPGA based Heart Arrhythmia’s Detection Algorithm Sheikh Md. Rabiul Islam, A. F. M. Nokib Uddin, Md. Billal Hossain, Md. Imran Khan Dept. of Electronics and Communication Engineering Khulna University of Engineering &Technology Khulna, Bangladesh ACEEE Int. J. on Information Technology, Vol. 3, No. 1, March 2013