A new instrument for measuring student beliefs about physics and learning physics: the Colorado Learning Attitudes about Science Survey W. K. Adams, K. K. Perkins, N. S. Podolefsky, M. Dubson, N. D. Finkelstein, and C. E. Wieman Department of Physics, University of Colorado, Boulder, Colorado 80309, USA Abstract: The Colorado Learning Attitudes about Science Survey (CLASS) is a new instrument designed to measure student beliefs about physics and about learning physics. This instrument extends previous work by probing additional aspects of student beliefs and by using wording suitable for students in a wide variety of physics courses. The CLASS has been validated using interviews, reliability studies, and extensive statistical analyses of responses from over 5000 students. In addition, a new methodology for determining useful and statistically robust categories of student beliefs has been developed. This paper serves as the foundation for an extensive study of how student beliefs impact and are impacted by their educational experiences. For example, this survey measures: that most teaching practices cause substantial drops in student scores; that a student’s likelihood of becoming a physics major correlates with their ‘Personal Interest’ score; and that, for a majority of student populations, women’s scores in some categories, including ‘Personal Interest’ and ‘Real World Connections’, are significantly different than men’s scores. 01.40.Di, 01.40.Fk, 01.40.Gm I. INTRODUCTION Over the last decade, researchers in science education have identified a variety of student attitudes and beliefs that shape and are shaped by student classroom experience. 1234 Work by House and Sadler et al. 567 indicate that students’ expectations are better predictors of college science performance than the amount of high school science or math they completed. House found that students’ achievement expectations and academic self-concept were more significant predictors of chemistry achievement than were students’ prior achievement and their prior instructional experience. Sadler and Tai found that professor gender matching student gender was second only to quality of high school physics course in
Transcript
A new instrument for measuring student beliefs about physics and learning physics: the Colorado Learning Attitudes about
Science Survey
W. K. Adams, K. K. Perkins, N. S. Podolefsky, M. Dubson, N. D. Finkelstein, and C.
E. Wieman Department of Physics, University of Colorado, Boulder, Colorado 80309, USA
Abstract: The Colorado Learning Attitudes about Science Survey (CLASS) is a new instrument designed to measure student beliefs about physics and about learning physics. This instrument extends previous work by probing additional aspects of student beliefs and by using wording suitable for students in a wide variety of physics courses. The CLASS has been validated using interviews, reliability studies, and extensive statistical analyses of responses from over 5000 students. In addition, a new methodology for determining useful and statistically robust categories of student beliefs has been developed. This paper serves as the foundation for an extensive study of how student beliefs impact and are impacted by their educational experiences. For example, this survey measures: that most teaching practices cause substantial drops in student scores; that a student’s likelihood of becoming a physics major correlates with their ‘Personal Interest’ score; and that, for a majority of student populations, women’s scores in some categories, including ‘Personal Interest’ and ‘Real World Connections’, are significantly different than men’s scores. 01.40.Di, 01.40.Fk, 01.40.Gm
I. INTRODUCTION
Over the last decade, researchers in science education have identified a variety of student attitudes and beliefs that shape and are shaped by student classroom experience.1 2 3 4 Work by House and Sadler et al.5 6 7 indicate that students’ expectations are better predictors of college science performance than the amount of high school science or math they completed. House found that students’ achievement expectations and academic self-concept were more significant predictors of chemistry achievement than were students’ prior achievement and their prior instructional experience. Sadler and Tai found that professor gender matching student gender was second only to quality of high school physics course in
predicting students’ performance in college physics. A number of surveys have been created to measure various aspects of student’s beliefs and expectations. We have developed and validated an instrument, the Colorado Learning Attitudes about Science Survey (CLASS),8 9 10 11 12 which builds on work done by existing surveys. This survey probes students’ beliefs about physics and learning physics and distinguishes the beliefs of experts from those of novices. The CLASS was written to make the statements as clear and concise as possible and suitable for use in a wide variety of physics courses. Students are asked to respond on a Likert13 (5-point agree to disagree) scale to 42 statements such as:
• “I study physics to learn knowledge that will be useful in my life outside of school.”
• “After I study a topic in physics and feel that I understand it, I have difficulty solving problems on the same topic.”
• “If I get stuck on a physics problem my first try, I usually try to figure out a different way that works.”
The statements are scored overall and in eight categories. What we mean by the term “category” is fundamentally different from what is meant by that label as used in previous beliefs surveys in physics. Our categories are empirically determined groupings of statements based on student responses. This is in contrast to a priori groupings of statements by the survey creator based on their belief as to which statements characterize particular aspects of student thinking. Some researchers argue that not all of a student’s ideas about learning physics have become coherent and thus it does not matter whether or not their responses to statements within a category are correlated. Our empirically determined categories and interviews demonstrate that students do have many consistent ideas about learning physics and problem solving. Although, we have found certain ideas, such as the nature of science, where our interviews and survey results suggest that students do not have coherent ideas, at least none that we are able to measure. Our empirical approach to category creation identifies, through statistical analysis of student responses, those aspects of student thinking where there is some reasonable degree of coherence. The degree of coherence is itself an empirically determined quantity. The definition of what aspect of thinking such an empirically determined category describes is determined entirely by the statements that our analysis shows the students answer in a correlated fashion. Normally, one can see from looking at the groups of correlated statements that these represent certain identifiable aspects of thinking that the teacher can address.
Rennie and Parker14 provide a particularly powerful example, which supports the value of empirically determined categories. They present an attitude survey designed to focus on the single idea of interest in science. The instrument was given to 4 to 7 year olds and analyzed as a whole; they found no difference between boys and girls interest in science. The researchers believed, based on theory, that the questions could be broken into four types; learning about science, doing experiments, “work with…”, and “create or grow…”. When analyzed using this categorization scheme, very little difference was seen between boys and girls. Then, a factor analysis was performed on the data and two different categories emerged that showed very clear distinctions between boys and girls. Girls preferred items relating to plants, animals and shadows while boys were more interested in energy, wheels and earthworms. There were also several items that they were equally interested in such as
weather. This research demonstrates that student ideas may not be clearly understood a priori but can be identified through statistical analysis of responses.
In this paper we first describe the design principles used for the CLASS and how these principles and the instrument itself differ from previous surveys. We then discuss how it was validated, and how the eight general categories of student beliefs that it measures were determined. A number of subtleties involved in choosing and interpreting these categories are discussed. We also present results of studies conducted to confirm the survey’s reliability and outline the important factors that must be considered when interpreting results of this survey, e.g. student gender. Since the survey development and validation has gone through three iterations, these sections are necessarily rather interconnected. Finally, we present a few brief examples of the results we are finding from widespread use of this survey.
II. DESIGN Three well known surveys for probing student beliefs about the physical sciences are
the Maryland Physics Expectation survey (MPEX)15, the Views About Science Survey (VASS),16 and the Epistemological Beliefs Assessment about Physical Science (EBAPS).17 Each of the three has a particular focus, primarily aspects of epistemology or expectations. Some focus on breadth while others delve into a limited number of ideas in depth. There are also several other nature-of-science surveys, such as Views of Nature Of Science (VNOS).18
Several design principles shaped the CLASS and distinguish it from the previous surveys. 1) It was designed to address a wider variety of issues that educators consider important aspects of learning physics. 2) The wording of each statement was carefully constructed and tested to be clear and concise and subject to only a single interpretation by both a broad population of students and a range of experts. This makes the survey suitable for use in many different courses covering a range of levels, and also allows most of the statements to be readily adapted for use in other sciences such as chemistry. 3) The statements were written to be meaningful even to students who had never taken physics. For this reason we chose not to include statements which ask the student to reflect on the requirements of the course. 4) The “expert” and “novice” responses to each statement were unambiguous so scoring of the responses was simple and obvious. 5) The amount of time required to thoughtfully complete the survey was kept to 10 minutes or less by requiring clear and concise statements and using a simple response format. This also limits the survey to less than about fifty statements. We believe that a longer survey will encounter significant difficulties with widespread faculty and student acceptance. 6) The administration and scoring was designed to be easy, allowing for an online survey and for automated scoring. 7) The grouping of statements into categories of student beliefs was subject to rigorous statistical analysis and only statistically robust categories were accepted. The resulting categories characterize identifiable and useful aspects of student thinking.
Our initial starting point for the survey statements were MPEX and VASS statements. We modified many of these statements to make them consistent with the guidelines above, particularly after evaluating them in interviews with experts and students. We found that the most effective way to successfully modify and create statements was to listen to students and write down statements that we heard them say. These statements then represent student ideas about learning and are in a vocabulary students understand. Here we mention some of the issues that arose in these interviews. 1) Words such as “domain” or “concepts” are not
prevalent in a typical introductory student’s vocabulary, and so need to be avoided to make the survey suitable for a broad range of students. 2) Students (though perhaps not physicists) apply the word physics in at least three ways, referring to: their particular physics course, the scientific discipline, or the physics that describes nature. The survey is designed for use in the context of an academic environment; however, we believe it is important not to ask questions specifically about the course but rather about the physics that describes nature; noting this sense sometimes overlaps with physics as a discipline. If statements do refer to the course, students sometimes have varied responses such as referring to their high school course or their college course. We do not claim that this survey would not elicit different responses for some statements if it were given in a completely different context; it has been designed and validated for this particular context. 3) Statements that include two statements in one, as do a number of statements on the MPEX, are often interpreted inconsistently by students, although not by experts. A number of new statements were also created to address certain aspects of learning not covered by the earlier surveys such as personal interest, aspects of problem solving, and the coupled beliefs of sense-making and effort.
III. SCORING
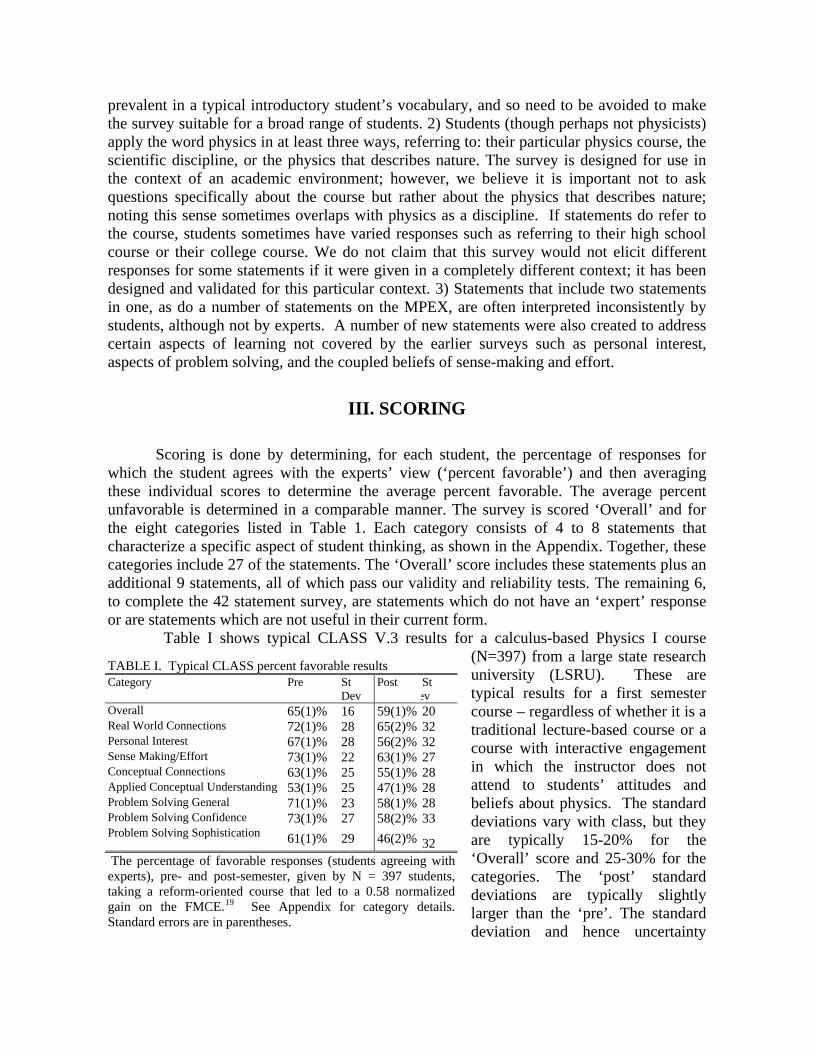
Scoring is done by determining, for each student, the percentage of responses for which the student agrees with the experts’ view (‘percent favorable’) and then averaging these individual scores to determine the average percent favorable. The average percent unfavorable is determined in a comparable manner. The survey is scored ‘Overall’ and for the eight categories listed in Table 1. Each category consists of 4 to 8 statements that characterize a specific aspect of student thinking, as shown in the Appendix. Together, these categories include 27 of the statements. The ‘Overall’ score includes these statements plus an additional 9 statements, all of which pass our validity and reliability tests. The remaining 6, to complete the 42 statement survey, are statements which do not have an ‘expert’ response or are statements which are not useful in their current form.
Table I shows typical CLASS V.3 results for a calculus-based Physics I course (N=397) from a large state research university (LSRU). These are typical results for a first semester course – regardless of whether it is a traditional lecture-based course or a course with interactive engagement in which the instructor does not attend to students’ attitudes and beliefs about physics. The standard deviations vary with class, but they are typically 15-20% for the ‘Overall’ score and 25-30% for the categories. The ‘post’ standard deviations are typically slightly larger than the ‘pre’. The standard deviation and hence uncertainty
TABLE I. Typical CLASS percent favorable results Category Pre St
Dev Post St
ev Overall 65(1)% 16 59(1)% 20 Real World Connections 72(1)% 28 65(2)% 32 Personal Interest 67(1)% 28 56(2)% 32 Sense Making/Effort 73(1)% 22 63(1)% 27 Conceptual Connections 63(1)% 25 55(1)% 28 Applied Conceptual Understanding 53(1)% 25 47(1)% 28 Problem Solving General 71(1)% 23 58(1)% 28 Problem Solving Confidence 73(1)% 27 58(2)% 33 Problem Solving Sophistication 61(1)% 29 46(2)% 32 The percentage of favorable responses (students agreeing with experts), pre- and post-semester, given by N = 397 students, taking a reform-oriented course that led to a 0.58 normalized gain on the FMCE.19 See Appendix for category details. Standard errors are in parentheses.
(standard error) is influenced in part by the number of statements included in the particular category being scored – with fewer statements, the minimum difference between the individual ‘percent favorable’ scores is larger which will result in a larger standard deviation.
There are two common methods for scoring Likert scales.20 21 22 One can assume that the characteristics under study can be either considered as an interval scale or an ordinal scale. When assuming an interval scale each possible response receives a value from 1 to 5 (1 for strongly agree and 5 for strong disagree) with the spacing between each of these values bearing equal weight. The responses for each item can then be summed. The second method, ordinal scale, assumes there is not equal difference between each possible response; therefore, scoring must be done as a presentation of percentage of agreement. In our interviews, students expressed a variety of reasons for choosing neutral, including: has no idea how to answer; has no opinion; has conflicting beliefs arising from different experiences in different physics courses; or is conflicted between answering according to what they think they should do versus what they actually do in practice. For these reasons, it is clear that it is preferable to score the CLASS survey responses on an ordinal scale. In scoring, neutrals are scored as neither agree nor disagree with the expert so that an individual student’s ‘% favorable’ score (and thus the average for the class) represents only the percentage of responses for which the student agreed with the expert and similarly for ‘% unfavorable’. The difference between 100% and the sum of ‘% favorable’ and ‘% unfavorable’ represents the percent of neutral responses.
The use of a 5-point Likert scale of strongly disagree to strongly agree is important for validity and scoring for two reasons. First, students’ interpretations of agree vs. strongly agree are not consistent; the same conviction of belief may not result in the same selection such that one student may respond with strongly agree while another responds with agree. Thus, in scoring the survey, we treat strongly agree and agree as the same answer (similarly for strongly disagree and disagree). This has previously been shown to be important when comparing different populations because their responses are affected by differences in how conservative the populations are.23 Collapsing the scale is also frequently done when scoring small samples.20 We find in interviews and based on the above results that by collapsing the scale when scoring, we may have lost some definition but have no reason to believe that we have distorted the results. Interviews also revealed that the use of a 5-point scale in the survey – as opposed to a 3-point scale – was important. Students expressed that agree vs. strongly agree (and disagree vs. strongly disagree) was an important distinction and that without the two levels of agree and disagree they would have chosen neutral more often.
When a student skips a statement, the survey is scored as if the statement did not exist for that student. A student must answer a minimum number of statements on the survey (32 out of 36 scored statements) to be included in the ‘Overall’ score and a minimum number of statements for each category to be included in the results for that category. In our experience, only a very small number of students skip more than two statements, but from a statistical analysis of the difference between dropping skipped statements or including them as a neutral response, we believe that effectively dropping them from the scoring gives the most accurate results if there is an anomalous population where a large number of students skip many statements.
IV. ADMINISTRATION Since Fall 2003, we have administered the CLASS survey before (pre) and after
(post) instruction to over 7,000 students in 60 physics courses. In addition, faculty members from at least 45 other universities are using the CLASS in their physics courses.
After some experimentation, we have settled on the following approach for maximizing the number of student responses from a given class. We 1) announce the survey both in class and by email, 2) give a short (3 to 7 day) window for taking the survey, 3) provide a follow-up email reminder to students who still need to take the survey, and 4) offer a small amount of course credit for submitting the survey, although the actual responses are not graded and a student receives full credit for submitting only name and ID. Some students will randomly choose answers. We have added statement #31 to identify the majority of these students – “We use this statement to discard the survey of people who are not reading the statements. Please select agree (not strongly agree) for this statement.” We find that 7-12% (inversely related to level of course) of the students fail to correctly answer this statement and all experts answered it correctly. In addition to statement #31, we have added a timer for surveys administered online. If students take less than three minutes to complete the survey, we discard their answers. We typically achieve 90% pre-course response rate and 85% post-course response rate. Of these responses, approximately 10-15% are dropped because the students did not answer statement 31 correctly, chose the same answer for essentially all the statements, or simply did not answer most of the statements. The remaining responses provide useful pre- and post- datasets. To determine the shifts in beliefs from pre-to-post, it is important to only include students who took both pre- and post- surveys. This ensures that any calculated change in beliefs measures shifts in students’ thinking rather than a difference in student population pre-to-post. Thus, an additional dataset restricted to students who took both pre- and post- is also created. This matched dataset typically includes about 65-70% of the students enrolled in the course.
V. VALIDITY AND RELIABILITY
We have performed a series of rigorous validation and reliability studies that involved several iterations to revise and refine the survey statements. The validation process included: face validity - interviews with and survey responses from physics faculty to establish the expert interpretation and response; interviews with students to confirm the clarity and meaning of statements; construct validity - administration of the survey to several thousand students followed by extensive statistical analysis of the responses including a detailed factor analysis to create and verify categories of statements; predictive validity – correlation with students incoming beliefs and course performance;1011 and concurrent validity – analysis of responses of the survey shows that it measures certain expected results such as physics majors are more expert-like in their beliefs than non-science majors. Revisions were made to the survey based on the results of the interviews and factor analysis and then the above validation studies were repeated with the new version of the survey.
A. Validation Interviews
Three experts underwent a series of interviews on the initial draft of CLASS V.1 (Version 1 – Fall 2003). Their comments were used to hone the statements and remove any that could be interpreted more than one way. When this process was complete, sixteen experts took the survey. Their answers confirmed the expert point of view used in scoring. These experts were physicists who have extensive experience with teaching introductory courses and worked with thousands of students. Some of these experts are involved with physics education research; others are simply practicing physicists interested in teaching. The above process was repeated for CLASS V.3 (Version 3 – Fall 2004, shown the Appendix). The experts provided consistent responses to all statements in V.3 except to four statements, none of which are included in the final eight categories. Two are “learning style” statements that we do not expect to have a correct “expert” answer, but are included to provide useful information about student thinking. These statements are: “It is useful for me to do lots and lots of problems when learning physics.” and “I find carefully analyzing only a few problems in detail is a good way for me to learn physics.” The other two statements (#7, #41) targeted beliefs about the nature of science, and are being revised. So far, we have been unable to find a set of statements that measure student thinking about the nature of science and meet our criteria for statistically valid categories.
Student interviews were carried out on V.1 by obtaining a total of 34 volunteers from six different physics courses at a mid-size multipurpose state university (MMSU) and a large state research university (LSRU). Eight additional students from three different physics courses at the LSRU were interviewed to analyze V.3 statements. Care was taken to interview a diverse group of students by selecting from introductory courses catering to the full range of majors, having equal numbers of men and women, and having twenty percent non-Caucasian students. Interviews consisted of first having the student take the survey with pencil and paper. Then, during the first ten minutes, students were asked about their major, course load, best/worst classes, study habits, class attendance and future aspirations, in order to characterize the student and his or her interests. After this, the interviewer read the statements to the students while the student looked at a written version. The students were asked to answer each statement using the 5-point scale and then talk about whatever thoughts each statement elicited. If the student did not say anything, he/she was prompted to explain his/her choice. After the first few statements, most students no longer required prompting. If the students asked questions of the interviewer, they were not answered until the very end of the interview.
Interview results showed students and experts had consistent interpretations of nearly all of the statements. A few statements on V.1 were unclear or misinterpreted by some of the students. Some of these were reworded or removed in the Spring on V.2 of the survey; the remainder were addressed in the Fall with V.3. In addition, the interviews exposed some unexpected student ideas about physics; some of these were incorporated into V.3. Student interviews on V.3 revealed problems with only three statements. Two of the three are being revised. The third – “It is important for the government to approve new scientific ideas before they can be widely accepted.” – is interpreted differently by experts and novices, but in this case, the interpretation itself is consistent and indicates an expert-novice distinction, making it a useful statement that will remain on the survey. Finally, these interviews provided some new insights into students’ thinking, such as the distinction between whether
students think that physics describes the real world and whether they actually care/think about the physics they experience in their everyday life. This important distinction was not recognized in previous surveys.24
B. Validating Categories
Statistical analyses were used to test the validity of the sub-groupings of statements into categories. In this regard, the CLASS is different than previous surveys. There is no published statistical analysis of the MPEX categories, but we had a substantial number of students take the MPEX survey and did a statistical analysis of their responses. We found some MPEX categories were made up of statements for which the student responses were very weakly correlated. We later found a brief discussion of this point in the thesis of Saul’s,25 which suggested that he had similar findings. We believe that this poor correlation between responses in a category indicates that such a category is not valid for characterizing a facet of student thinking. The VASS and EBAPS use essentially the same categories as the MPEX, and we have been unable to find any discussion of statistical tests of the validity of the categories for those surveys. It is likely that a statistical analysis would show similar results to those found for the MPEX. Because of this lack of statistical validity to the categories used in previous surveys, here we present a detailed discussion of the approach we developed to obtain categories that are both useful and statistically valid.
Categorization Philosophy
There are two different philosophies that can be followed in establishing a set of categories – we will label them as “raw statistical” and “predeterminism”. Raw statistical is where one puts in no prior constraints and allows the categories to emerge purely from the data via exploratory factor analysis. Exploratory factor analysis is a statistical data reduction technique that uses a large set of student responses to all survey statements and groups the statements according to the correlations between statement responses. This produces a set of factors that are independent, emergent categories. These provide an oblique basis set that best spans the space of student responses. This approach has been employed with many survey instruments and exams in the education community. For more detail on factor analysis see references [21], [22] and [26].
In predeterminism, a set of predetermined categories is chosen based on the expert physicists’/teachers’ perspective. The categories reflect the experts’ categorization and definition of useful beliefs for learning physics and their assessment of which statements will probe which of these beliefs. This approach is the one used to establish categories in the other beliefs surveys used in physics.
In practice, both of these philosophies have strengths and deficiencies, and so we find the optimum procedure is to use a combination. The strength of the exploratory factor analysis is that it guarantees that one has statistically valid categories, and it provides new insights into student thinking and how best to characterize that thinking. For example, it revealed to us that there is a high correlation between the responses to statements that involve sense-making and those that involve effort, thus revealing that in the student mind these were
inexorably linked. This suggests that many students see sense-making as an additional effort and whether or not they do it is based on their cost-benefit analysis of the effort required. This interpretation is supported by our interviews. Statements such as “There are times I solve a physics problem more than one way to help my understanding.” are quite often answered as disagree; however, students who disagree qualify their answers during interviews with comments such as “I like to do this when I can”, “I know it will help me but…” and “I try to go back and do this before the exam but usually don’t have time.” Factor analysis also showed that statements involving the connection of physics with reality separated into two distinguishable categories, supporting our findings from student interviews. The two categories distinguish between whether students think that physics describes the real world and whether they actually care/think about the physics they experience in their everyday life.
A drawback to the raw statistical categories obtained with exploratory factor analysis, however, is that many are not very useful. There is a hierarchy of categories according to level of correlation. Some of the categories that have relatively low correlations cannot be related to any clearly defined aspect of student thinking and so cannot be related to particular classroom practices or learning goals. Also, the mathematical constraint imposed by factor analysis – that all statements must be fit into independent categories – can cause an undesirable mismatch between the emergent categories and actual student thinking which does not follow such rigid mathematical constraints.
The strength of predeterminism is that the categories are by definition useful in that they are of interest to teachers. However, they also have some serious weaknesses. The first deficiency of predetermined categories is that some categories may not be valid when subjected to a statistical test. Predetermined categories are not statistically valid when there is little or no correlation between responses, reflecting the fact that student beliefs may be organized or connected quite differently than was assumed in creating the category. If statements do not correlate in the students’ minds and hence in their responses, we assert that it is unjustifiable to claim that there is some definable aspect of student thinking that can be labeled and measured by such a category. As Rennie and Parker demonstrated with their study of 4-7 year olds’ interest in science, gender differences were apparent only when appropriate groups of statements were determined by a factor analysis. The second deficiency is that using predetermined categories precludes learning anything new about how beliefs are organized and related in the students’ minds.
Pragmatic Design Approach
Our approach is an empirical approach, which embraces elements of both of the above philosophies to determine the optimum set of categories. We take advantage of the strengths of both approaches and avoid the weaknesses to obtain statistically robust categories that best characterize student thinking in the academic context in which this survey is intended to be used, and address facets of most use to teachers.
In the preliminary stage of this approach, we carried out both exploratory factor analysis and statistical tests of a number of predetermined categories (including those used in earlier surveys such as MPEX). Guided by those results, we then group the statements into new categories that we judge are likely to be useful and are evaluated to be statistically valid. These categories are not necessarily independent and not all statements must go into a category. This approach is justified because different aspects of student beliefs are not necessarily independent and because we are not trying to describe all of our data; rather, we are trying to identify which portions of our data are useful for describing particular general aspects of student thought.
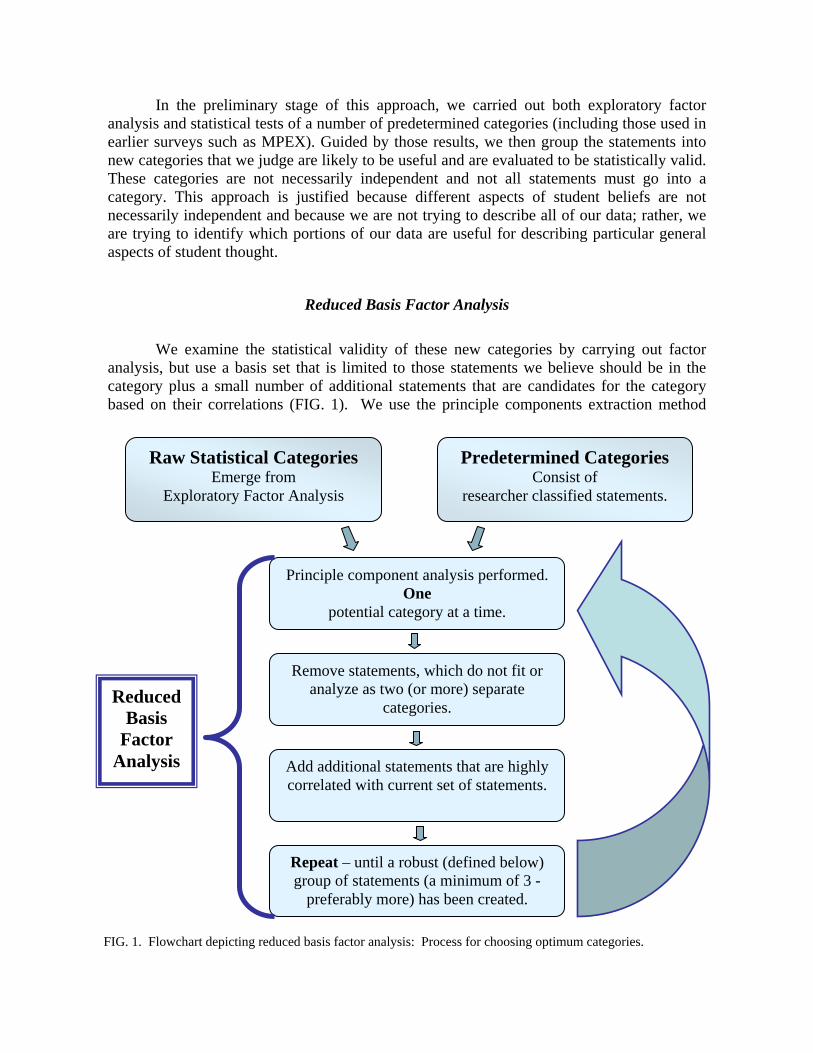
Reduced Basis Factor Analysis
We examine the statistical validity of these new categories by carrying out factor analysis, but use a basis set that is limited to those statements we believe should be in the category plus a small number of additional statements that are candidates for the category based on their correlations (FIG. 1). We use the principle components extraction method
Raw Statistical Categories Emerge from
Exploratory Factor Analysis
Predetermined Categories Consist of
researcher classified statements.
Principle component analysis performed. One
potential category at a time.
Remove statements, which do not fit or analyze as two (or more) separate
categories.
Add additional statements that are highly correlated with current set of statements.
Repeat – until a robust (defined below) group of statements (a minimum of 3 -
preferably more) has been created.
Reduced Basis
Factor Analysis
FIG. 1. Flowchart depicting reduced basis factor analysis: Process for choosing optimum categories.
along with a direct oblimin rotation27 when performing both the exploratory and reduced basis factor analysis. The analyses are performed on three sets of data (pre-test responses, post-test responses, and the shifts from pre-to-post) from three large first-term introductory courses (physics for non-science majors, algebra-based physics, and calculus-based physics). After carrying out a reduced basis factor analysis, we evaluate the scree plots, correlation coefficients, and factor loadings as discussed in the factor robustness section below. Multiple iterations of this analysis and adding/subtracting statements are used to optimize the categories. After determining robust categories in this fashion, we evaluate the statements not included in any category and search for new categories by looking specifically for correlations with those statements. Whenever there were correlation coefficients of 0.15 or greater, we searched for new categories that would include the correlated statements. TABLE II. Reduced Basis Factor Analysis of Categories - CLASS V.2 Predetermined Categories
FA Results
Optimum categories Emergent Categories
FA Results Optimum categories
Independence MF Conceptual Understanding Category 1 SS* Real World Conn. and
Personal Interest
Coherence PC Conceptual Understanding Category 2 SS* Real World Conn. and
Understanding Reality World View SS Real World Connection Category 4 WF Dropped
Reality Personal View SS Personal Interest Category 5 NS Dropped
Math SS Math Physics Connection Category 6 SS Sense Making/Effort Effort PC Sense Making/Effort Category 7 WF Dropped Skepticism PC Dropped SS = Strong Single Factor; BQ = Better w/ 1 or 2 different statements; WF = Weak Factor; NS = Statements didn’t make sense together; MF = Multiple factors; PC = Poorly Correlated * This category is a single factor; however, even stronger when split into two
This categorization process is illustrated in Table II, which lists the original predetermined categories based on the type of categorization used by other surveys and the emergent categories from the “raw statistical” analysis. The “FA results” columns indicate the results of the reduced basis factor analysis. The “optimum categories” columns list the fate of each predetermined and emergent category after completing the full process of choosing “optimum” categories on V.2 in Summer 2004. Based on interview and factor analysis results, a major revision of the CLASS was undertaken to create V.3. Table III shows the “optimum” categories for V.2 and the “optimum” categories found with another factor analysis done on V.3 with 800 student responses collected in Fall 2004. Following each category is a numerical rating of the category’s robustness, which is described in the Category Robustness section below. It is important to note that there is no such thing as a “perfect” set of categories; these are simply our choices as to the best combination of usefulness and statistical robustness.
A subtlety of the factor analysis is that the statistical tests of the categories give the clearest results if students with highly expert or highly novice views are excluded. If a student is fully expert-like, for example, their responses will be those of the expert and provide only one dimension – that of the expert. Typical students do not yet have fully
coherent ideas about learning physics but do have coherent ideas about specific aspects of learning. These specific aspects which are probed by smaller groups of statements, determine the CLASS categories. For this reason we chose to do the initial factor analysis work for V.3 on students who were not as expert like. We combined the responses from the algebra-based physics course and the physics for non-science majors course and then removed the 27 students who had ‘Overall’ scores of over 80% agreement with experts, leaving an N of 400. Only 1% of students were more than 80% novice-like, so we did not exclude students at that end of the distribution. TABLE III. CLASS V.2 and V.3 Category Robustness Ratings. V.2 Categories Robustness V.3 Categories Robustness Personal Interest 7.75 Personal Interest 8.20 Real World Connections 7.38 Real World Connections 7.32 Conceptual Understanding 6.11 Conceptual Connections 5.57 Sense Making / Effort 5.89 Sense Making / Effort 5.91 Math Physics Connection 6.51 Problem Solving Sophistication 8.25 Problem Solving Confidence 7.39 Problem Solving General 6.50 Applied Conceptual Understanding 5.71 These ratings were done on post data for calculus-based Physics I students at LSRU.
Once a set of optimum categories was established for this dataset, a reduced basis factor analysis was performed on the responses from the more expert-like calculus based Physics I students (N=400). This analysis confirmed that the categories were consistent between the different classes. The result is nine robust categories. One of the nine categories included all of the statements in the ‘Problem Solving General’ category plus four additional statements. Based on additional analysis, we concluded that this extended problem solving category provided no additional useful information beyond that provided by the ‘Problem Solving General’ category and so have not included it here. Thus, eight categories resulted from our analysis of V.3, as listed in Table III. The statements included in each category are shown in appendix A.
Category Names
Category names are chosen after ‘optimum’ categories have been determined. The name is simply a label, which attempts to summarize the statements within a category. The name does not define the beliefs contained within a category. One must read the statements to do this.
C. Category Robustness
Robustness of a category is determined by the reduced basis factor analysis on that group of statements. Various indicators of statistical validity are evaluated, including the correlation coefficients between statements, the percent of variance explained by the weighted combination of statements represented by the first factor, and the factor loadings for each statement in that first factor. (A factor analysis always produces as many factors as
TABLE IV: Category Robustness Ratings Good Category (Real World Connections): Poor Category (Nature of Science): Robustness = 9.29 Robustness = 4.07 Correlation Coefficients Correlation Coefficients Statements: S1 S2 S3 S4 Statements: S1 S2 S3 S4 S1 1.000 0.437 -0.391 0.335 S1 1.000 0.168 0.100 0.189 S2 0.437 1.000 -0.353 0.407 S2 0.168 1.000 0.078 0.435 S3 -0.391 -0.353 1.000 -0.328 S3 0.100 0.078 1.000 0.086 S4 0.335 0.407 -0.328 1.000 S4 0.189 0.435 0.086 1.000 Factor Loadings Factor Loadings S1 0.748 S1 0.526 S2 0.763 S2 0.773 S3 -0.703 S3 0.308 S4 0.702 S4 0.787 These data are from an analysis of a combined dataset of responses from students in algebra-based physics and students in physics for non-science majors.
statements in the basis.) An example of these indicators for a very robust factor can be seen in Table IV and Figure 2. Table IV shows the correlation coefficients between the statements and the factor loadings for a good and a poor category. The average absolute value of the correlation coefficients between statements for a category should not be too low. (For correlation coefficients and factor loadings we only look at absolute values because the sign merely indicates that for some statements 5 is the expert response while for others 1 is the expert response.) Our lowest average correlation coefficient for the final eight categories is 0.2. (If two statements have a correlation coefficient greater than 0.6, one of them is eliminated from the survey as being redundant.) The correlation coefficients need to also be consistent, which is reflected in the factor loadings. If all the statements do not equally correlate, the factor loadings will vary accordingly. The standard deviations of the factor loadings are calculated for the eight categories and range from 0.05 to 0.10. Figure 2 shows
Note that the signs are irrelevant to the statistical analysis, as explained in the text.
0
0.5
1
1.5
2
0 1 2 3 4
Component Number
Eige
nval
ue
a
FIG 2. Scree plots of a good category (a) and a poor category (b).
0
0.5
1
1.5
2
0 1 2 3 4
Component Number
Eige
nval
u
b
Eige
nval
ue
Eige
nval
ue
(a) (b)
0
0.5
1
1.5
2
0 1 2 3 4
Component Number
Eige
nval
ue
a
FIG 2. Scree plots of a good category (a) and a poor category (b).
0
0.5
1
1.5
2
0 1 2 3 4
Component Number
Eige
nval
u
b
Eige
nval
ue
Eige
nval
ue
(a) (b)
scree plots for the good and poor category examples displayed in Table IV. A scree plot graphs the eigenvalues versus the factors. Each factor (usually known as a component in a scree plot) is a weighted combination of the statements (the basis) in the trial category and can be thought of as an eigenvector of sorts. In our reduced basis factor analysis, if the particular set of statements form a good category then the first factor will describe a much larger fraction of the variance in the student responses to the statements than will the remaining factors. Thus, in a scree plot for a good category, the eigenvalues of the factors (which represent the fraction of variance explained by each factor) show a dramatic change between the eigenvalue of the first and second factors with little change between the eigenvalues of any subsequent factors (indicating that the majority of the total variance is explained by the first factor). The scree plot is characterized by EΔ , which we calculate as the eigenvalue change between the first and second factors less the average eigenvalue change between the remaining factors. This value is normalized by the number of components and ranges from -0.34 to -0.16 for the eight categories.
It is possible to arrive at a numerical rating that takes into account all the relevant statistical quantities, and thus represents the statistical robustness of a given category.
23*)/||52( RNEflccRobustness Δ++=
Where is the average absolute value of the correlation coefficients between statements, is the average absolute value of the factor loadings for the category,
ccfl EΔ represents the
shape of the scree plot, is the number of statements in the category, and N 2R is the Pearson product moment correlation which represents how close to a straight line the scree plot is for components greater than 1 and ranges in value between 1 for a perfect category to 0 for a bad one. The coefficients (2, 1, and 5) are chosen to give the three terms in the sum the relative weightings that we believe are most appropriate. The shape of the scree plot contributes approximately 45%, while the average correlation coefficients and factor loadings both contribute about 27.5%. The overall factor of 3 is so that the rating of the best category is nearly 10, for convenience. Table 3 indicates the robustness rating for each of our categories. Between V.2 and V.3 of the survey, we slightly revised the wording of many of the statements with the intention of making them clearer and improving their fit to the categories identified in V.2. It can be seen that this resulted in distinctly more robust categories. For comparison, our tenth best category in V.3 had a robustness value of 4.1.
D. Making Valid Interpretations To correctly interpret the results of the survey, it is important not to assume that all
changes in student beliefs are due purely to instruction. Here we present a list of other factors that our data have shown are significant. 1) Physics I vs. Physics II. There is a fairly consistent difference between responses in Physics I and Physics II courses that is largely independent of other factors. An example of this is shown in Table V, which compares Physics I and II courses taught at a Mid-size Multipurpose State University (MMSU). Physics I courses (with the notable exception of courses where beliefs are explicitly addressed) typically result in significant deterioration in all categories of beliefs as illustrated by the results in Table 1, while Physics II courses have variable results with the exception of
the ‘Sense-making/Effort’ category which shows a decrease in expert-like beliefs for all courses surveyed.
TABLE V. Physics I vs. Physics II Category Pre Post Std Err Fall (N=41) Overall 62% 53% 1% Real World Connection 76% 53% 5% Personal Interest 74% 69% 7% Sense-making/Effort 88% 68% 4% Conceptual Understanding 42% 45% 5% Math Physics Connection 71% 59% 5%
2) The (winter) break effect. Statistically significant shifts in some student beliefs were measured between the end of Physics I in Fall and the beginning of Physics II five weeks later. This finding indicates the importance when comparing different courses, to be sure that the survey was given at the same time relative to the beginning and end of the course for the results being compared.
Spring (N=41)
3) Student age. Statistically significant differences (5% or more) were measured on about a quarter of the statements when we comparing 18 and 19 year-old students with their 20-21 year-old classmates. Younger
students displayed more expert-like beliefs on statements #2, #3, #5, #15, #25, and #34 (14% difference!) while older students displayed more expert-like beliefs on statements #13, #27, #38 and 39. In particular, the younger students scored higher on all three problem solving categories. Not surprisingly, the 22-25 year-old students scored much higher in both ‘Real World Connections’ and ‘Personal Interest’ categories.
Overall 57% 59% 3% Real World Connection 63% 68% 5% Personal Interest 62% 68% 4% Sense-making/Effort 69% 63% 5% Conceptual Understanding 44% 43% 3% Math Physics Connection 62% 63% 5% 2003-2004 Calculus based course at MMSU with same instructor and students.Note: This results are using V.2 of the survey so the categories are slightly different than as seen with V.3 throughout the rest of this paper.
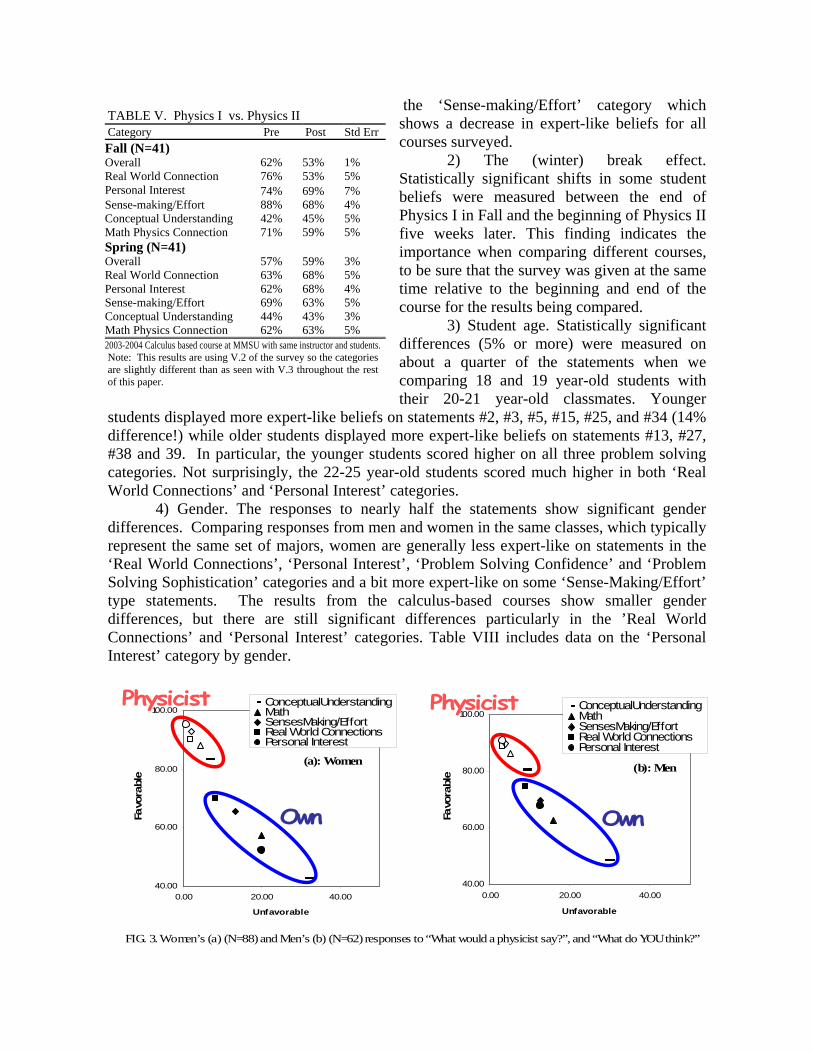
4) Gender. The responses to nearly half the statements show significant gender differences. Comparing responses from men and women in the same classes, which typically represent the same set of majors, women are generally less expert-like on statements in the ‘Real World Connections’, ‘Personal Interest’, ‘Problem Solving Confidence’ and ‘Problem Solving Sophistication’ categories and a bit more expert-like on some ‘Sense-Making/Effort’ type statements. The results from the calculus-based courses show smaller gender differences, but there are still significant differences particularly in the ’Real World Connections’ and ‘Personal Interest’ categories. Table VIII includes data on the ‘Personal Interest’ category by gender.
40.00
60.00
80.00
100.00
0.00 20.00 40.00
Unfavorable
ConceptualUnderstanding MathSensesMaking/EffortReal World ConnectionsPersonal Interest
40.00
60.00
80.00
100.00
0.00 20.00 40.00
Unfavorable
ConceptualUnderstanding MathSensesMaking/EffortReal World ConnectionsPersonal Interest
Physicist
Own Own
Physicist
(a): Women (b): Men
FIG. 3. Women’s (a) (N=88) and Men’s (b) (N=62) responses to “What would a physicist say?”, and “What do YOU think?”
Favo
rabl
e
Favo
rabl
e
Perhaps one of the biggest questions about the validity of this type of survey is whether the students are actually answering as they believe or what they think the instructor wants.28 Our student interviews indicated that when students take the survey, they sometimes consider both what they feel is the correct response and what they personally believe. We studied this issue by administering the survey in a slightly different format at the end of an algebra-based Physics I course. We asked the students to give two answers for each statement: 1) What would a physicist say?; and 2) What do YOU think?. These ‘comparative’ results are revealing. Figure 3 shows what students (broken out by gender) believe a physicist would say (hollow markers) and what students actually believe (solid markers). From this data it is clear that, by the end of the term, the students were good at identifying the expert response, but that their personal beliefs were much more novice. This difference is large for men and noticeably larger for women. The CLASS was administered the following semester to the same course, taught by the same instructor in the ‘traditional’ format (students were asked to respond to each statement only once, as they believe). Comparison of the ‘comparative’ results to data from the ‘traditional’ administration indicates that typical student responses to the CLASS align with their responses to “what do YOU think” rather than to “what would a physicist say”. We have also administered the survey at the beginning of the semester to a small algebra based course and data indicates that students largely know the experts response before instruction. Extensive studies on this topic are currently in progress and will be reported on shortly.
E. Reliability
Reliability studies were performed at the LSRU on Physics I courses for both calculus-based physics and algebra-based physics. These courses have enrollments over 500 and 400 students respectively. Student incoming survey responses were compared between Fall 2004 and Spring 2005. Since it is reasonable to assume there is little variation in these large student populations over a few semesters, this provides a good direct measure of the survey reliability. We have compared the average incoming beliefs from one semester to the next. This comparison was done with two different courses, both algebra-based physics I and calculus-based physics I. In both cases we see very consistent statement responses across semesters. The results of test-retest reliability for the calculus-based and algebra-based courses are shown in Table VI.29 Note that the correlations between neutral responses are not quite as high as those for the agree and disagree responses. As mentioned previously, students choose neutral for a variety of reasons making it a less reliable measure.
TABLE VI. Test-Retest Reliability – Fall ’04 to Spring ‘05
Agree Neutral Disagree
Algebra Based Phys I 0.98 0.88 0.98
Calculus Based Phys I 0.99 0.88 0.98
LSRU, CLASS V3
VI. APPLICATIONS
There are many useful ways to analyze and use CLASS data. One can look at the pre results and their correlation with student learning, course selection, retention, gender, age, major, etc.. One can also look at the shift in beliefs over a semester to determine correlations between various teaching practices and students’ beliefs. We have found high correlations between students’ shifts in beliefs over a semester for instructors with very similar ideas about teaching and quite low correlations between shifts for students who received reform vs. traditional instruction (see Table VII). These data provide an additional demonstration of concurrent validity. In Table VIII we show examples of how ‘Overall’ and ‘Personal Interest’ pre results vary for four courses covering a range of introductory physics. We see that students’ incoming scores increase with level of physics course. Thus, students who make larger commitments to studying physics tend to be those who identify physics as being more relevant to their own lives. Also women have lower ‘Personal Interest’ scores than men for all courses surveyed (Figure 4). We also have data showing that the two courses in which the instructors made modest efforts to explicitly address beliefs obtained substantially better results – that is, no observed decline in beliefs – than other courses. These various results are obviously relevant to the question of how to increase the number and diversity of students going into STEM (Science, Technology, Engineering and Mathematics) disciplines. In a companion paper that is in preparation, we will examine many of these issues in more detail and also examine correlations between students’ beliefs and their learning gains.
TABLE VII. Correlations between student shifts with different instructors. Favorable Unfavorable Algebra-based Physics I 0.47 0.60 Calculus-based Physics I 0.87 0.88 LSRU, CLASS V.3; Algebra-based instructors had quite different teaching philosophies while calculus-based instructors had very similar ideas about teaching.
TABLE VIII. Relationships between favorable ‘Personal Interest’, physics course selection and gender.
N Overall Pre
(Standard Error) Personal Interest Pre (Standard Error)
Course Type School Dominant student population Women Men Women Men Women Men
Physical Science MMSU Elementary Ed. (sophomores)
42 6 41% (3%) 39% (8%) 24% (4%) 43% (11%)
Principles of Scientific Inquiry
MMSU Elementary Ed. (seniors)
54 5 50% (3%) 63% (8%) 40% (4%) 74% (14%)
Physics I (Alg) LSRU Pre-meds 186 114 55% (1%) 63% (2%) 41% (2%) 62% (2%) Physics I (Calc) LSRU Engineers 104 293 63% (2%) 66% (1%) 59% (3%) 70% (2%) =1st semester, II=2nd semester; %favorable shown for ease of display
The CLASS has also been altered slightly to create appropriate versions for Chemistry, Biology, Astronomy and Math and administered to a number of courses in these disciplines. These versions were written in cooperation with experts in each respective field; however, validity and reliability studies have only been completed in Physics and are currently being done for Chemistry. Approximately 5000 students at the LSRU have taken these non-physics versions of the CLASS. Preliminary analysis of chemistry results indicate that shifts after instruction are similar to, if not worse than, physics in moving in the unfavorable direction. Validation studies and further analysis of these data are underway.
VII. CONCLUSIONS, CAVEATS AND FUTURE WORK
Personal Interest vs. Course Selection
0
10
20
30
40
50
60
70
80Ele
m. E
d(s
oph)
Ele
m. E
d(s
enio
rs)
Pre
-med
s
Eng
inee
rs
Course
Pers
onal
Inte
rest
%
WomenMen
FIG. 4. Personal Interest score for Men and Women in four different courses.
Personal Interest vs. Course Selection
0
10
20
30
40
50
60
70
80Ele
m. E
d(s
oph)
Ele
m. E
d(s
enio
rs)
Pre
-med
s
Eng
inee
rs
Course
Pers
onal
Inte
rest
%
WomenMen
FIG. 4. Personal Interest score for Men and Women in four different courses.
This paper describes the process by which we have developed a new instrument to survey student beliefs. The survey can be easily used in numerous different courses and has been subjected to rigorous validation testing. As part of this validation process, we have created the first method for selecting categories of beliefs that are both statistically valid and measure categories that are useful to teachers and education researchers. We have also established a quantitative measure of the statistical validity of belief categories that can be applied to any survey. When using the CLASS there are a number of influences on students’ beliefs that must be considered while using and interpreting survey results, such as gender, major, age, and time in college.
This paper serves as the foundation for the use of this survey instrument to study student beliefs about physics and how they are affected by teaching practices. Because this survey is highly suited for widespread use, it can serve as a valuable tool for research and to improve physics teaching. Our preliminary data already shows the importance of certain beliefs on success in physics courses and a students’ inclination to continue in or drop out of physics, and it shows that most teaching practices have a detrimental impact on all of these critical beliefs. It also shows that teaching practices aimed at explicitly addressing student beliefs about physics can have clearly measurable effects. The survey results also show that there are large gender differences in beliefs that are undoubtedly relevant to the discussion as to how to attract more women into physics. These preliminary results make it clear that the CLASS will allow detailed studies of student beliefs for a variety of different student populations and how these beliefs are related to their physics educational experience.
The work presented here has only been validated for characterizing student beliefs in the aggregate. Further work is needed to establish whether or not this survey can characterize an individual student in a useful way. We do have hints however that this may be possible. In addition to our interview results, for several notable students (both good and bad) we have retrospectively looked at their individual survey results, and these were quite consistent with the highly expert or highly novice behavior these students indicated in their work and discussions with faculty.
Copies of the CLASS V.3 online and PDF formats and the Excel scoring form are available at http://CLASS.colorado.edu.
We thank Andy Elby for his thorough and thoughtful comments; Steven Pollock and Courtney Willis for their many helpful discussions; Krista Beck for her assistance with the project; and the Physics Education Research Group at Colorado for their support. This work has been supported by the National Science Foundation DTS program and the University of Colorado.
APPENDIX: CLASS V.3 STATEMENTS AND CATEGORIES
Statement Rea
l Wor
ld C
onne
ctio
n
Pers
onal
Inte
rest
Sens
e M
akin
g/Ef
fort
Con
cept
ual C
onne
ctio
ns
App
lied
Con
cept
ual U
nder
stan
ding
Prob
lem
Sol
ving
Gen
eral
Prob
lem
Sol
ving
Con
fiden
ce
Prob
lem
Sol
ving
Sop
hist
icat
ion
Not
Sco
red
1. A significant problem in learning physics is being able to memorize all the information I need to know.
2. When I am solving a physics problem, I try to decide what would be a reasonable value for the answer.
3. I think about the physics I experience in everyday life.
4. It is useful for me to do lots and lots of problems when learning physics. 5. After I study a topic in physics and feel that I understand it, I have difficulty solving problems on the same topic.
6. Knowledge in physics consists of many disconnected topics.
*7. As physicists learn more, most physics ideas we use today are likely to be proven wrong.
8. When I solve a physics problem, I locate an equation that uses the variables given in the problem and plug in the values.
9. I find that reading the text in detail is a good way for me to learn physics. 10. There is usually only one correct approach to solving a physics problem. 11. I am not satisfied until I understand why something works the way it does. 12. I cannot learn physics if the teacher does not explain things well in class. 13. I do not expect physics equations to help my understanding of the ideas; they are just for doing calculations.
14. I study physics to learn knowledge that will be useful in my life outside of school.
15. If I get stuck on a physics problem on my first try, I usually try to figure out a different way that works.
16. Nearly everyone is capable of understanding physics if they work at it.
17. Understanding physics basically means being able to recall something you've read or been shown.
18. There could be two different correct values to a physics problem if I use two different approaches.
19. To understand physics I discuss it with friends and other students. 20. I do not spend more than five minutes stuck on a physics problem before giving up or seeking help from someone else.
21. If I don't remember a particular equation needed to solve a problem on an exam, there's nothing much I can do (legally!) to come up with it.
22. If I want to apply a method used for solving one physics problem to another problem, the problems must involve very similar situations.
23. In doing a physics problem, if my calculation gives a result very different from what I'd expect, I'd trust the calculation rather than going back through the problem.
24. In physics, it is important for me to make sense out of formulas before I can use them correctly.
25. I enjoy solving physics problems. 26. In physics, mathematical formulas express meaningful relationships among measurable quantities.
27. It is important for the government to approve new scientific ideas before they can be widely accepted.
28. Learning physics changes my ideas about how the world works. 29. To learn physics, I only need to memorize solutions to sample problems. 30. Reasoning skills used to understand physics can be helpful to me in my everyday life.
31. We use this question to discard the survey of people who are not reading the statements. Please select agree - option 4 (not strongly agree) to preserve your answers.
32. Spending a lot of time understanding where formulas come from is a waste of time.
33. I find carefully analyzing only a few problems in detail is a good way for me to learn physics.
34. I can usually figure out a way to solve physics problems. 35. The subject of physics has little relation to what I experience in the real world.
36. There are times I solve a physics problem more than one way to help my understanding.
37. To understand physics, I sometimes think about my personal experiences and relate them to the topic being analyzed.
38. It is possible to explain physics ideas without mathematical formulas. 39. When I solve a physics problem, I explicitly think about which physics ideas apply to the problem.
40. If I get stuck on a physics problem, there is no chance I'll figure it out on my own.
*41. It is possible for physicists to carefully perform the same experiment and get two very different results that are both correct.
42. When studying physics, I relate the important information to what I already know rather than just memorizing it the way it is presented.
*These statements are not useful in their current form and are not scored. We are working on improved versions.
1 J. D. Bransford, A. L. Brown, and R. R. Cocking, How People Learn (National Academy
Press, Washington D.C., 2002).
2 D. Hammer, Am. J. of Ph. 68, S52-S59 (2000).
3 E. F. Redish, Teaching Physics with Physics Suite (John Wiley & Sons, New York, 2003).
4 E. Seymour and N. Hewitt, Talking about Leaving (Westview Press, Boulder, Colorado,
1997).
5 J. D. House, Int. J. Inst. Med. 22, 157-168 (1995).
6 J. D. House, Int. J. Inst. Med. 21, 1-12 (1994).
7 P. M. Saddler and R. H. Tai, Sci. Ed. 85, 111-136 (2001).
8 A copy of the CLASS can be found at http://CLASS.colorado.edu
9 W. K. Adams, K. K. Perkins, M. Dubson, N. D. Finkelstein, and C. E. Wieman, 2004
Physics Education Research Conference, edited by J. Marx, P. Heron, and S. Franklin AIP
Conf. Proc. (to be published)
10 K. Perkins, W. Adams, N. Finkelstein, and C. Wieman, 2004 Physics Education Research
Conference, edited by J. Marx, P. Heron, and S. Franklin AIP Conf. Proc. (to be published)
11 S. Pollock, 2004 Physics Education Research Conference, edited by J. Marx, P. Heron,
and S. Franklin AIP Conf. Proc. (to be published)
12 K. K. Perkins, M. M. Gratny, W. K. Adams, N. D. Finkelstein and C. E. Wieman.
Submitted to Proceedings of the 2005 Physics Education Research Conference.
13 R. Likert, Archives of Psychology 140, 44-53 (1932).