A NEW MATHEMATICAL MODEL OF THE HEAT TRANSFER CHARACTERISTICS OF OIL SHALE PARTICLES DURING RETORTING
NI PAN, CHANGCHENG CHEN, YONGHUA YOU, FANGQIN DAI*
Key Laboratory for Ferrous Metallurgy and Resources Utilization of Ministry of Education, Wuhan University of Science and Technology, No. 947 Heping Avenue, Qingshan District, Wuhan 430081, PR China
Abstract. This paper presents a new mathematical model of the heat transfer characteristics for oil shale particles during the retorting. In this process, the heat transfer within oil shale particles affects shale oil yield and energy consumption. To explore the heat transfer characteristics of oil shale particles in more detail, experiments on its thermal conductivity were con-ducted to confirm that oil shale was an anisotropic material. The results showed that the thermal conductivity in the parallel direction was about 1.25 times higher than that in the perpendicular direction. The dimensions of crushed oil shale particles were measured, and the ratios of length to width, length to thickness and width to thickness showed that the oil shale particles had a clear platy structure. Based on the experimental results, a new mathematical model, which considered the pyrolytic heat as an internal heat sink, was developed. It was validated that the model could be used to predict the central temperature history and heating time of oil shale particles during the retorting. Furthermore, the central temperature history and heating time of oil shale particles with different sizes were predicted, assuming oil shale to be either an isotropic or anisotropic material. The results showed that when oil shale was regarded as an isotropic material, there was a relatively marked disagreement between experimental and actual results. In addition, the relationship between the heating time and oil shale particle equivalent diameter was established. Keywords: mathematical model, heat transfer, oil shale retorting, isotropic, anisotropic.
With the decrease of conventional energy resources in recent times, utiliza-tion of oil shale as an important substitute for oil has been paid more and more attention to [1–4]. There are several representative industrial oil shale retorting technologies in commercial operation [5–8] across the world. These techniques, however, cannot be applied to all oil shales, due to their different nature. So, numerous attempts have been made to understand the overall thermal behavior and kinetics of oil shale during the pyrolysis and com-bustion processes [9–14]. Braun and Rothman [15] analyzed the thermal decomposition data about the organic material of Colorado oil shale to find out the rate constants and activation energies. Granoff and Nuttall [16] developed a non-isothermal shrinking-core model to investigate the pyro-lysis kinetics of single cylindrical or spherical oil shale particles 12.7 mm in diameter, and validated the model by experiments. Shih and Sohn [17] developed a mathematical model of the pyrolysis kinetics of lump oil shale. The effect of the internal temperature gradient on pyrolysis kinetics was studied assuming that oil shale particles were spherical in shape. The com-parison made by the investigators [17] showed that their model described the retorting of oil shale more accurately than both the shrinking-core model and the uniform-temperature model. Pan et al. [18] investigated the applicability of the two-dimensional heat transfer model to predicting the mass loss and center temperatures of large oil shale particles during pyrolysis.
Most of the previously published works assumed that oil shale particles were of spherical or cylindrical shape. In fact, the crushed oil shale particles have an obvious platy structure especially in the equivalent diameter range of 4–25 mm [19]. The dimensions of oil shale particles in the parallel texture direction are almost 2–5 times as large as those in the vertical direction. It should be noted that due to the different geological structure of different oil shales, their thermal conductivities in the mutually perpendicular directions are different. However, this phenomenon has not been previously reported in the literature.
In the present study, the thermal conductivity of Chinese Jimsar oil shale in three mutually perpendicular directions was obtained by experiments, and its platy structure was quantitatively studied and illustrated. A mathematical model, which incorporated heat conduction and heat radiation and con-sidered the pyrolytic heat as an internal heat sink, was developed and validated based on the results obtained by Granoff and Nuttall [16]. The rectangular model developed in this work, which treated oil shale as an anisotropic material, was used to predict the central temperature history and heating time of oil shale particles during pyrolysis.
A New Mathematical Model of the Heat Transfer Characteristics of Oil Shale Particle during Retorting
169
2. Experiments on thermal conductivity
Oil shale is a kind of sedimentary rock [20], its thermal conductivity in different directions relative to the bedding plane is different. Earlier works treated oil shale as an isotropic material, but this is not consistent with its real nature observed in different directions. In this work, the experimental oil shale samples from Jimsar in XinJiang, China were machined to thin cylinders (φ 12.7 mm). To study the thermal conductivity of Jimsar oil shale in different directions, the experiments were conducted at different tem-peratures by using an FL4010 laser thermal conductivity meter. All the experiments were performed twice for reproducibility requirement. The results of proximate and elemental analyses of the samples have been reported by Pan et al. [10].
During the experiments, thermal diffusivity was tested in a temperature range of 30–350 °C in each direction. Thermal conductivity was calculated according to Equation (1):
( ) ( ) ,i i pT A T c (1)
where ( )i T is the thermal conductivity in i direction, W/(m·K); ( )iA T is the thermal diffusivity in i direction, m2/s; ρ is the density of the sample, kg/m3;
pc is the specific heat capacity, J/(kg·K). Figure 1 shows changes of thermal conductivity with temperature, the
values are the mean from two experiments. In the figure, “Stdpar” and “Stdper” stand for the standard error in the parallel and perpendicular direc-tions, respectively. The relationship between thermal conductivity and tem-perature can be expressed by different equations.
Fig. 1. Changes of thermal conductivity with temperature.
Ni Pan et al.
170
Equation (2) describes this relationship for the direction parallel to the bedding plane as follows:
8 3 5 21 5 10 3 10 0.0091 2.2281.T T T (2)
For the direction perpendicular to the bedding plane the thermal con-ductivity-temperature relationship can be written by Equation (3):
8 3 5 22 4 10 3 10 0.008 1.7956,T T T (3)
where is the thermal conductivity, 1 1W m K ; and T is the particle tem-perature, °C.
As shown in Figure 1, the thermal conductivity decreases with increasing temperature, being in the parallel direction about 1.25 times higher than that in the perpendicular direction. The reason for the difference is that the thermal conductivity of the solid skeleton is higher than that of gas and liquid according to the heat transfer theory. With the increase in temperature, volatiles will disperse and leave lots of pores in the oil shale particles. So, the thermal conductivity coefficient should decrease along with the direction perpendicular to the bedding plane.
3. Heat transfer model
3.1. Oil shale particles
Today, most of the world’s commercial oil shale technologies use the particles of the size of 8–75 mm [21]. The particles of this size range have a very obvious platy structure. In order to study the shape factor, the dimensions of oil shale particles were measured. Figure 2 shows the ratios between three different dimensions of crushed oil shale particles. The ratio
Fig. 2. Ratios of three dimensions for crushed Jimsar oil shale particles.
A New Mathematical Model of the Heat Transfer Characteristics of Oil Shale Particle during Retorting
171
of length to width is relatively constant, but those of length to thickness and width to thickness fluctuate obviously. It can be concluded that crushed oil shale particles have a clear platy structure. The geometric model developed in this work is shown in Figure 3. Based on the ratios shown in Figure 2, the origin of the coordinate coincides with the geometric center of the particle. The temperature of the particle is mutually symmetrical in three directions, so, the geometric model depicted in Figure 3 represents 1/8 of the particle. The directions of the z-axis and y-axis are perpendicular to the bedding plane, and the x-axis is parallel to the bedding plane. In this work, the dia-meter is defined as the volume equivalent diameter.
Fig. 3. Geometric model of 1/8 oil shale particle, a – length, b – width, c – thickness. 3.2. Assumptions about the mathematical model
In this chapter, a mathematical model developed to study the heat transfer characteristics within a single oil shale particle will be described. The method incorporates thermal conduction and pyrolytic heat and considers thermal radiation and convection as boundary conditions. The numerical values for the convective heat transfer coefficient and effective emissivity originate from [16]. As is known, during the process of oil shale pyrolysis, there occur various complex chemical and physical reactions, accompanied by simultaneous heat and mass transfer between gaseous products and solid parts in the pores within the oil shale particles [22–24]. To simplify the model, the following assumptions are made:
(1) Changes of the volume and shape of particles are ignored. (2) Only heat conduction inside the oil shale particle is considered,
while heat convection, radiation and mass transfer inside the pores are ignored [19, 25, 26].
(3) The pyrolytic heat incorporating the heat of chemical reactions, volatile evolution and mass changes is represented as an internal heat sink, which is a function of temperature [17].
3.3. Mathematical model
Based on the physical model shown in Figure 3, the heat transfer model of oil shale particle is established. The mathematical model, as developed here, consists of the dynamic distributed energy balance with convective and
Ni Pan et al.
172
radiant surface boundary conditions. The heat referring to chemical reactions, volatile evolution and mass changes is represented by the pyrolytic heat as an internal heat sink. The partial differential equation describing the dynamic temperature profile within a rectangle is:
1 2 2 ,pT T T T
c Qt x y z
(4)
where T is the particle temperature, K; t is the heating time, s; is the thermal conductivity, 1 1W m K ; is the solid density, kg·m–3 (2100 kg·m–3); cp is the heat capacity, J·kg–1K–1; Q is the internal heat sink, J·m–3.
According to [27], the specific heat of Jimsar oil shale might be expressed as a function of temperature. The internal heat sink is related to the density of oil shale, rate and heat of kerogen decomposition, initial density of oil shale, etc. [17].
The initial condition is:
t = 0, T = T0. (5)
The boundary conditions can be expressed as follows:
4 41
2
( ) ( ),a g aax
Th T T T T
x
(6)
4 42
2
( ) ( ),b g bb
y
Th T T T T
y
(7)
4 42
2
( ) ( ),c g ccz
Th T T T T
z
(8)
0
0,x
T
x
(9)
0
0,y
T
y
(10)
0
0,z
T
z
(11)
where T0 is the initial temperature, K; a is the length, m; b is the width, m; c is the thickness, m; h is the convective heat transfer coefficient [16],
2 1W m K ; Ta, Tb, Tc are particle surface temperatures, K; Tg is the gas temperature, K; is the Stefan-Boltzmann constant; is the effective emissivity, 0.9 (according to [16]); T is the ambient temperature [16], K.
A New Mathematical Model of the Heat Transfer Characteristics of Oil Shale Particle during Retorting
173
The model simulations are solved by Matlab software. For the space grid, the central difference scheme is adopted, and for the time term, the explicit scheme is adopted.
4. Results and discussion
4.1. Model validation and comparisons
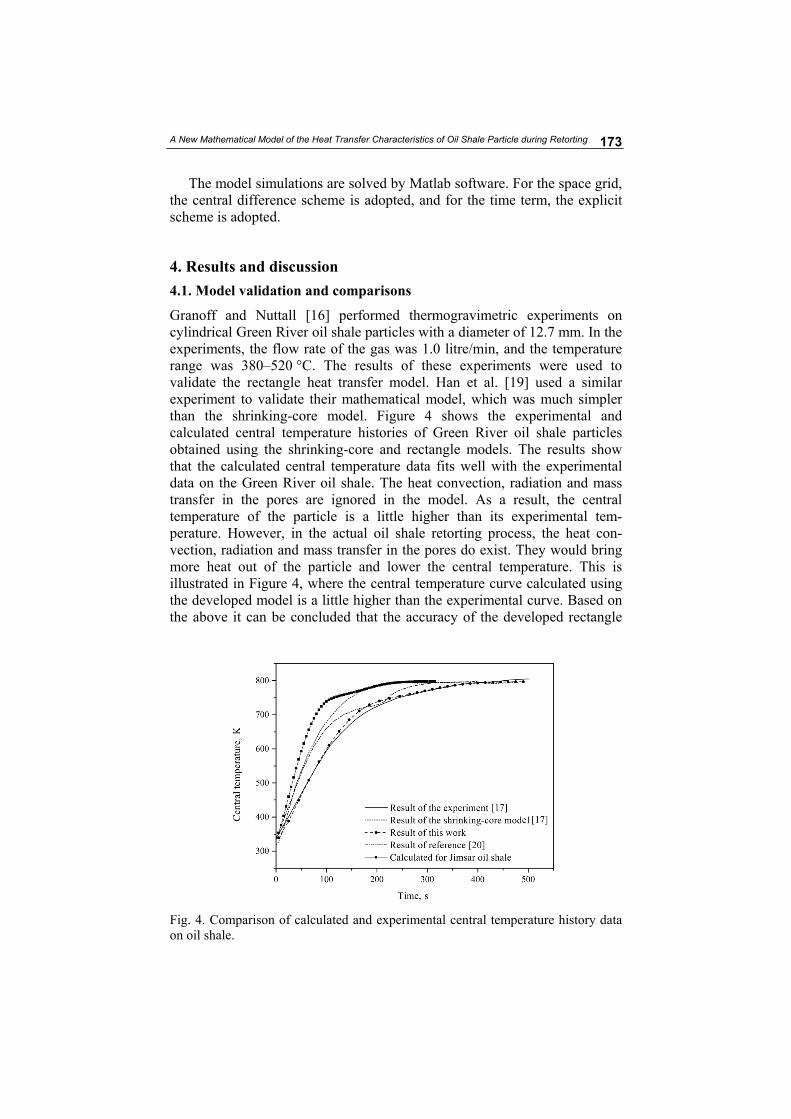
Granoff and Nuttall [16] performed thermogravimetric experiments on cylindrical Green River oil shale particles with a diameter of 12.7 mm. In the experiments, the flow rate of the gas was 1.0 litre/min, and the temperature range was 380–520 °C. The results of these experiments were used to validate the rectangle heat transfer model. Han et al. [19] used a similar experiment to validate their mathematical model, which was much simpler than the shrinking-core model. Figure 4 shows the experimental and calculated central temperature histories of Green River oil shale particles obtained using the shrinking-core and rectangle models. The results show that the calculated central temperature data fits well with the experimental data on the Green River oil shale. The heat convection, radiation and mass transfer in the pores are ignored in the model. As a result, the central temperature of the particle is a little higher than its experimental tem-perature. However, in the actual oil shale retorting process, the heat con-vection, radiation and mass transfer in the pores do exist. They would bring more heat out of the particle and lower the central temperature. This is illustrated in Figure 4, where the central temperature curve calculated using the developed model is a little higher than the experimental curve. Based on the above it can be concluded that the accuracy of the developed rectangle
Fig. 4. Comparison of calculated and experimental central temperature history data on oil shale.
Ni Pan et al.
174
model is higher than that of the shrinking-core model [16] or of the model described by Han et al. [19]. Therefore, the rectangular model was chosen to study the characteristics of Jimsar oil shale.
Figure 4 shows that the pyrolysis temperature rises slowly when the central temperature exceeds 700 K. This is because the temperature difference between the center and surface of the particle gets smaller, mak-ing less heat transmit by heat conduction. The center temperature of Jimsar oil shale increases faster than that of Green River oil shale. This may be attributed to that the specific heat capacity of Jimsar oil shale is smaller than that of Green River oil shale. So, during heating, Jimsar oil shale will consume less heat than Green River oil shale. However, the thermal con-ductivities of Jimsar and Green River oil shales are almost similar. Hence it can be concluded that the properties of oil shale will significantly affect the heating time during the retorting. Regarding assumption (2) of subchapter 3.2, the larger the particle size, the higher the amount of heat carried out of the particle, and the larger the temperature error of the mathematical model. The specific value of the error will be the subject of our further research work.
4.2. Effects of particle size on the heating process
At present, the particle size of oil shale used by most retorting technologies worldwide is in the range of 8–75 mm [21]. Considering that this range is quite wide, it is essential to study the influence of particle size on heating time and heat transfer within oil shale particles during the retorting. As follows from chapter 2, the thermal conductivity in the parallel direction is higher than that in the perpendicular direction (respectively directions y and z in Fig. 3). Hence, in this chapter, the influence of oil shale particle size on heating time and heat transfer is modeled using two calculation modes. One mode uses the average thermal conductivity values obtained in different directions, and the other adopts experimental thermal conductivity values. Figure 5 shows the heating times of Jimsar oil shale with the particle equi-valent diameter ranging from 4.43 to 59.35 mm. The heating times shown in Figure 5a were calculated using average thermal conductivity values. It means that the oil shale was regarded as an isotropic material. The heating times shown in Figure 5b were found using thermal conductivity values obtained when oil shale was regarded as an anisotropic material. From Figure 5 it can be seen that the heating time increases with increasing particle equivalent diameter. This increase is particularly noticeable when the equivalent diameter is larger than 26.21 mm.
Taking 800 K as the final temperature of heating, the central temperature of oil shale particle is higher with oil shale being regarded as an anisotropic material than in case it is considered isotropic. For each equivalent diameter, there exists a maximum value of the central temperature difference between anisotropic and isotropic oil shale particles. Figure 6 shows the change of the
A New Mathematical Model of the Heat Transfer Characteristics of Oil Shale Particle during Retorting
175
(a)
(b)
Fig. 5. Heating time of oil shale (a) with average thermal conductivity, (b) with different thermal conductivities. maximum value of central temperature difference with equivalent diameter. It can be seen that the temperature difference increases with the increase of equivalent diameter. The reason is that the kerogen of oil shale will decompose during the retorting, which is considered an internal heat source in this work. As stated above, the internal heat sink is related to the density of oil shale, rate and heat of kerogen decomposition, initial density of oil shale, etc. [17]. So, the physical parameters change with progressing retort-
Ni Pan et al.
176
ing and will cause the temperature difference between the center and surface of oil shale particle. As seen from Figure 6, the maximum temperature difference is almost 6 K. In consideration of the complexity of practical production, the maximum temperature difference may be greater, therefore, the equivalent diameter should be kept as constant during the industrial retorting as possible.
Fig. 6. Change of the maximum temperature difference between isotropic and aniso-tropic oil shale particles with equivalent diameter.
As the retorting advances, the temperature difference between the center
and surface of the particle will get smaller and smaller. Taking 800 K as the final temperature of the process, when the temperature difference between the center and surface of oil shale particle is smaller than 4 K, the tem-perature field is considered uniform, and this time is the final heating time. Figure 7 shows the change of the final heating time difference between iso-tropic and anisotropic oil shale particles with equivalent diameter. From Figure 7 it can be seen that the final heating time difference is almost similar when d is smaller than 30 mm. When d is larger than 30 mm, this difference becomes greater with increasing equivalent diameter. When the equivalent diameter is equal to 59.35 mm, the final heating time difference is almost 45 s. It means that the final heating time obtained from calculations con-sidering oil shale as isotropic is shorter than the one in actual conditions. Figure 8 shows the heating time-equivalent diameter relationship when oil shale is treated as an anisotropic material, which can be expressed by Equation (12):
3 20.001 0.078 17.62 29.7,t d d d (12)
A New Mathematical Model of the Heat Transfer Characteristics of Oil Shale Particle during Retorting
177
where t is the final heating time, s; and d is the particle equivalent diameter, mm.
By means of Equation (12) it will be easier to predict the heating time of Jimsar oil shale as well as of other oil shales, especially those which have similar thermal properties to Jimsar oil shale’s.
Fig. 7. Change of the final heating time difference between isotropic and anisotropic oil shale particles with equivalent diameter.
Fig. 8. Change of the final heating time of anisotropic oil shale with particle equivalent diameter.
Ni Pan et al.
178
5. Conclusions
In order to better understand the pyrolysis mechanism of oil shale, experi-ments on the thermal conductivity of Jimsar oil shale of China were con-ducted to confirm that the oil shale was an anisotropic material. Based on the results obtained, the relationships between thermal conductivity and oil shale particle temperature in the perpendicular and parallel directions were established. It was found that the thermal conductivity in the parallel direc-tion was about 1.25 times higher than that in the perpendicular direction. Based on these observations, a mathematical model of heat transfer was developed and validated to predict the central temperature history and heating time of oil shale particles during the retorting. This model takes the pyrolytic heat as an internal heat sink. In order to find out the difference between the calculated results on anisotropic and isotropic oil shale particles, the maximum temperature difference between the center and surface of oil shale particles during the retorting and the final heating times of particles with different equivalent diameters were compared. The results showed that the maximum temperature difference increased with increasing equivalent diameter, the maximum difference value being about 6 K. The final heating time was almost the same when d was smaller than 30 mm. When the equivalent diameter was above 30 mm, the final heating time difference became greater. It can be concluded that these differences were relatively significant when oil shale was regarded as an isotropic material. Based on the above, the relationship between the final heating time and equivalent diameter was described. In summary, the methods developed, especially those of calculating the heating time of different-size oil shale particles, can provide valuable information to reduce the energy loss and increase the oil yield during the oil shale retorting process.
Acknowledgements
This work was supported by the Key Laboratory for Ferrous Metallurgy and Resources Utilization of Ministry of Education of Wuhan Science and Technology, Wuhan, China (Grant No. FMRU201502). REFERENCES
1. Taciuk, W. Does oil shale have a significant future? Oil Shale, 2013, 30(1), 1–5.
2. Sun, Y. H., Bai, F. T., Liu, B. C., Liu, Y. M., Guo, M. G., Guo, W., Wang, Q. W., Lü, X. S., Yang, F., Yang, Y. Characterization of the oil shale products derived via topochemical reaction method. Fuel, 2014, 115, 338–346.
3. Akar, A., Ekinci, E. Production of chemicals from oil shales. Fuel, 1995, 74(8), 1113–1117.
A New Mathematical Model of the Heat Transfer Characteristics of Oil Shale Particle during Retorting
179
4. Altun, N. E., Hiçyilmaz, C., Hwang, J. Y., Suat Bağci, A., Kök, M. V. Oil shales in the world and Turkey; reserves, current situation and future prospects: a review. Oil Shale, 2006, 23(3), 211–227.
5. Liu, Z. J., Dong, Q. S., Ye, S. Q., Zhu, J. W., Guo, W., Li, D. C., Liu, R., Zhang, H. L., Du, J. F. The situation of oil shale resources in China. Journal of Jilin University (Earth Science Edition), 2006, 36(6), 869–876 (in Chinese, with English abstract).
6. Qian, J. L., Wang, J. Q., Li, S. Y. World’s oil shale available retorting techno-logies and the forecast of shale oil production. In: Proceedings of the Eighteenth International Offshore and Polar Engineering Conference (Chung, J. S., ed.). Vancouver, Canada, 2008, 19.
7. Kök, M. V., Guner, G., Bagci, S. Application of EOR techniques for oil shale fields (in-situ combustion approach). Oil Shale, 2008, 25(2), 217–225.
8. Kok, M. V., Bagci, S. An investigation of the applicability of the in-situ thermal recovery technique to the Beypazari oil shale. Energ. Source. Part A, 2010, 33(3), 183–193.
9. Kök, M. V., Guner, G., Bagci, S. Combustion kinetics of oil shales by reaction cell experiments. Oil Shale, 2008, 25(1), 5–16.
10. Pan, L. W., Dai, F. Q., Li, G. Q., Liu, S. A TGA/DTA-MS investigation to the influence of process conditions on the pyrolysis of Jimsar oil shale. Energy, 2015, 86, 749–757.
11. Khraisha, Y. H. Kinetics of isothermal pyrolysis of Jordan oil shales. Energ. Convers. Manage., 1998, 39(3–4), 157–165.
12. Bai, F. T., Sun, Y. H., Liu, Y. M., Li, Q., Guo, M. G. Thermal and kinetic characteristics of pyrolysis and combustion of three oil shales. Energ. Convers. Manage., 2015, 97, 374–381.
13. Zhang, J. K., Li, B. W., Hu, Z. M. Effects of optical parameters on fluid flow and heat transfer of participating magnetic fluid. Int. J. Heat Mass Tran., 2013, 59, 126–136.
14. Kök, M. V., Pamir, R. Pyrolysis kinetics of oil shales determined by DSC and TG/DTG. Oil Shale, 2003, 20(1), 57–68.
15. Braun, R. L., Rothman, A. J. Oil-shale pyrolysis: Kinetics and mechanism of oil production. Fuel, 1975, 54(2), 129–131.
16. Granoff, B., Nuttall Jr, H. E. Pyrolysis kinetics for oil-shale particles. Fuel, 1977, 56(3), 234–240.
17. Shih, S.-M., Sohn, H. Y. A mathematical model for the retorting of a large block of oil shale: effect of the internal temperature gradient. Fuel, 1978, 57(10), 622–630.
18. Pan, Z. L., Feng, H. Y., Smith, J. M. Rates of pyrolysis of Colorado oil shale. AIChE J., 1985, 31(5), 721–728.
19. Han, X. X., Liu, Q. Q., Jiang, X. M. Heat transfer characteristic of oil shale particle during the retorting. Int. J. Heat Mass Tran., 2015, 84, 578–583.
20. Wang, Q., Sun, B. Z., Wu, X. H., Bai, J. R., Sun, J. Analysis of combustion reaction activation of oil shale semi-coke. Chemical Engineering (China), 2006, 34(11), 16–19 (in Chinese, with English abstract).
21. Qian, J. L., Li, S. Y., Guo, S. H., Ding, F. C. Oil Shale Retorting Process. China Petrochemical Press, Beijing, 2014 (in Chinese).
22. Bai, F. T., Guo, W., Lü, X. S., Liu, Y. M., Guo, M. G., Li, Q., Sun, Y. H. Kinetic study on the pyrolysis behavior of Huadian oil shale via non-isothermal thermogravimetric data. Fuel, 2015, 146, 111–118.
Ni Pan et al.
180
23. Li, S. Y., Yue, C. T. Study of pyrolysis kinetics of oil shale. Fuel, 2003, 82(3), 337–342.
24. Wang, W., Li, S. Y., Li, L. Y., Ma, Y., Yue, C. T., He, J. L. Pyrolysis kinetics of North-Korean oil shale. Oil Shale, 2014, 31(3), 250–265.
25. Cheng, Y., Li, T. Y., Yan, B. H., Chen, Y. Particle-scale modeling of asphaltene pyrolysis in thermal plasma. Fuel, 2016, 175, 294–301.
26. Zhang, Y. Q., Zhu, J. L., Wang, X. H., Zhang, X. W., Zhou, S. X., Liang, P. Simulation of large coal particles pyrolysis by circulating ash heat carrier toward the axial dimension of the moving bed. Fuel Process. Technol., 2016, 154, 227–234.
27. Wang, T. F., Lu, S. X., Zhu, Y. J. Study on the properties of oil shale in China. Journal of Fuel Chemistry and Technology, 1987, 15(4), 311–316 (in Chinese, with English abstract).


![[IIC_assignment] Mathematical Modelling of Heat Exchanger](https://static.documents.pub/doc/80x56/577cd0261a28ab9e78918818/iicassignment-mathematical-modelling-of-heat-exchanger.jpg)


