Page 1
A NEW MEMS APPROACH FOR SPIROMETERS
A THESIS SUBMITTED TOTHE GRADUATE SCHOOL OF NATURAL AND APPLIED SCIENCES
OFMIDDLE EAST TECHNICAL UNIVERSITY
BY
SAHAR HABIBIABAD
IN PARTIAL FULFILLMENT OF THE REQUIREMENTSFOR
THE DEGREE OF MASTER OF SCIENCEIN
BIOMEDICAL ENGINEERING
FEBRUARY 2016
Page 3
Approval of the thesis:
A NEW MEMS APPROACH FOR SPIROMETERS
submitted by SAHAR HABIBIABAD in partial fulfillment of the requirements for thedegree of Master of Science in Biomedical Engineering Department, Middle EastTechnical University by,
Prof. Dr. Gülbin Dural ÜnverDean, Graduate School of Natural and Applied Sciences
Prof. Dr. Isik Hakan TarmanHead of Department, Biomedical Engineering
Assoc. Prof. Dr. Yesim SerinagaogluSupervisor, Dept. of Electrical and Electronics Eng., METU
Assist. Prof. Dr. Mustafa Ilker BeyazCo-supervisor, Dept. of Electrical and Electronics Eng., AIU
Examining Committee Members:
Prof. Dr. Haluk KulahDept. of Electrical and Electronics Eng., METU
Assoc. Prof. Dr. Yesim SerinagaogluDept. of Electrical and Electronics Eng., METU
Assist. Prof. Dr. Mustafa Ilker BeyazDept. of Electrical and Electronics Eng., AIU
Prof. Dr. Tolga CilogluDepartment of Electrical and Electronics Engineering, METU
Assist. Prof. Dr. Kivanc AzginDept. of Mechanical Engineering, METU
Date: 18 Feb 2016
Page 4
I hereby declare that all information in this document has been obtained andpresented in accordance with academic rules and ethical conduct. I also declarethat, as required by these rules and conduct, I have fully cited and referenced allmaterial and results that are not original to this work.
Name, Last Name: SAHAR HABIBIABAD
Signature :
iv
Page 5
ABSTRACT
A NEW MEMS APPROACH FOR SPIROMETERS
Habibiabad, SaharM.S., Department of Biomedical Engineering
Supervisor : Assoc. Prof. Dr. Yesim Serinagaoglu
Co-Supervisor : Assist. Prof. Dr. Mustafa Ilker Beyaz
February 2016, 102 pages
Measurement of breathing parameters is necessary for a variety of applications rang-ing from respiration monitoring to breathing-related diseases. In this respect, spirom-etry is one of the most common techniques used for Asthma and Chronic ObstructivePulmonary Disease (COPD) patients to detect the type and extent of the lung mal-functions by monitoring the exhaled or inhaled air. The efforts in this work have beenfocused on the miniaturization of turbine-based spirometers using MEMS (Micro-electromechanical Systems) technology for accurate spirometry analysis, improvedportability, integration with portable electronics, and lower device cost. Accord-ingly, this thesis presents the design, simulation, and fabrication of the first turbine-based MEMS spirometer. This work will also enable seamless integration of theMEMS spirometer with cell phones for patient self-monitoring, as opposed to previ-ous demonstrations of larger spirometer modules.
Keywords: Spirometer, MEMS
v
Page 6
ÖZ
SPIROMETRELERDE YENI BIR MEMS YAKLASIMI
Habibiabad, SaharYüksek Lisans, Biyomedikal Mühendisligi Bölümü
Tez Yöneticisi : Assoc. Prof. Yesim Serinagaoglu
Ortak Tez Yöneticisi : Yrd. Doç. Dr. Mustafa Ilker Beyaz
Subat 2016 , 102 sayfa
Solunum parametrelerinin ölçümü, solunum takibinden solunumla ilgili hastalıklarınteshisine kadar çok çesitli uygulamalarda gereklidir. Soluk alıp vermenin izlenmesive ilgili parametrelerin ölçülmesi olarak tanımlanabilen spirometri, astım ve Kro-nik Obstrüktif Akciger Hastalıgı (KOAH) olan hastalarda akciger sorunlarının türüve ilerlemesinin tanısında kullanılan en yaygın tekniklerden biridir. Bu arastırmada,Miktoelektromekanik Sistemler (MEMS) teknolojisi kullanılarak türbinli spirometre-lerin küçültmesi için çalısılmıstır. Çalısmada hedefler spirometrini analizlerinin dog-rulugunu artırmak, tasınabilirligini kolaylastırmak, mobil elektrikli cihazlara bagla-nabilirligini saglamak ve üretim maliyetini de azaltmaktır. Bu tezde ilk MEMS tür-binli spirometrenin tasarım, simülasyon ve yapımı için yeni bir yaklasım sunulmus-tur. MEMS spirometreler, büyük boyutlu spirometrelerden farklı olarak gelecekte ceptelefonlarına baglanıp uzaktan hasta takibi yapılabilmesini de saglayacaktır.
Anahtar Kelimeler: SPIROMETRE, MEMS
vi
Page 7
To my parents for their unconditional love
vii
Page 8
ACKNOWLEDGMENTS
Foremost, I would like to express my sincere gratitude to my co-supervisor Dr. MustafaIlker Beyaz, whose patience, inspiration, enthusiasm and understanding, added con-siderably to my graduate experience. He has supported me not only by providing aresearch assistantship, but also academically and emotionally through the rough roadto finish this thesis and reminding that research is fun and exciting in every singlemeeting we had. I have been amazingly fortunate to have an advisor who gave me thefreedom to explore on my own and at the same time the guidance to recover when mysteps faltered.
Similar profound gratitude goes to Dr. Yesim Serinagaoglu, without whose supportI would not have the opportunity to work on my interested topic. Throughout mythesis-writing period, she provided encouragement, sound advice and good company.
I am grateful to Dr. Tayfun Akin for his valuable lecture that helped me to improvemy knowledge in microfabrication.
I would like to acknowledge UNAM cleanroom staff, for trying to keep the fabricationfacilities operating. And special mention goes to Semih Yasar and Hakan Sürel forgoing far beyond the call of duty and their constant trust in my lab work. Appreciationalso goes out to Murat Serhatlıoglu, Talha Masood Khan, and Ersin Hüseyinoglu,who provided a friendly and cooperative atmosphere at work. I should also thank mycollege Utku Göreke for his encouragement and practical advices.
I would like to thank The Scientific and Technological Research Council of Turkey(TÜBITAK) for the scholarship and support for me.
Many friends have helped me stay sane through the difficult times. I greatly valuetheir friendship, comraderies, emotional supports, and for all the fun we have had dur-ing all these years. I wish to thank Greg Long, Atefeh Lafzi, and Fatemeh Soleimani,whose guidance helped me in all the time of writing this thesis. I am particularlyindebted to Majid Biazaran, without whom I would not be able to prepare my thesisbefore deadlines.
I would like to express my deepest thankfulness and gratitude to my wonderful par-ents, Nahid Ahmadi and Mahmoud Habibiabad, and my sister, Sepideh Habibiabad.So much of my success is possible because of their endless love, support, and encour-agement throughout my life, and for their faith in me. I owe so much to my parents forall of their sacrifice. Thanks to my sister who offered invaluable emotional support
viii
Page 9
and humor over the years. I could not ask for a better sister.
Last but not the least, I would like to thank my dearest, Reza Soleimani, for his con-tinuous love, faith, and support, who constantly reminded me of life’s most importantvalues: “happiness, health, home, and self-confidence”. His patience and supporthelped me overcome many crisis situations and finish this thesis.
ix
Page 10
TABLE OF CONTENTS
ABSTRACT . . . . . . . . . . . . . . . . . . . . . . . . . . . . . . . . . . . . v
ÖZ . . . . . . . . . . . . . . . . . . . . . . . . . . . . . . . . . . . . . . . . . vi
ACKNOWLEDGMENTS . . . . . . . . . . . . . . . . . . . . . . . . . . . . . viii
TABLE OF CONTENTS . . . . . . . . . . . . . . . . . . . . . . . . . . . . . x
LIST OF TABLES . . . . . . . . . . . . . . . . . . . . . . . . . . . . . . . . xv
LIST OF FIGURES . . . . . . . . . . . . . . . . . . . . . . . . . . . . . . . . xvi
CHAPTERS
1 INTRODUCTION . . . . . . . . . . . . . . . . . . . . . . . . . . . 1
2 LITERATURE REVIEW . . . . . . . . . . . . . . . . . . . . . . . . 5
2.1 Respiratory system . . . . . . . . . . . . . . . . . . . . . . . 5
2.1.1 Respiratory anatomy . . . . . . . . . . . . . . . . 5
2.1.2 Lung Volumes . . . . . . . . . . . . . . . . . . . . 7
2.1.3 COPD . . . . . . . . . . . . . . . . . . . . . . . . 8
2.1.4 Asthma . . . . . . . . . . . . . . . . . . . . . . . 10
2.1.5 Basic pulmonary function testing . . . . . . . . . . 11
2.2 Spirometric Measurements . . . . . . . . . . . . . . . . . . 11
x
Page 11
2.2.1 Forced Vital Capacity . . . . . . . . . . . . . . . . 12
2.2.1.1 The Flow-Volume Curve . . . . . . . 13
2.2.1.2 The Volume-Time Curve . . . . . . . 13
2.2.2 (Slow) Vital Capacity (SVC) . . . . . . . . . . . . 13
2.2.3 Maximum Voluntary Ventilation . . . . . . . . . . 14
2.3 Spirometer parameters . . . . . . . . . . . . . . . . . . . . . 14
2.3.1 Measuring range . . . . . . . . . . . . . . . . . . 14
2.3.2 Verification and Calibration . . . . . . . . . . . . 16
2.3.3 Hygiene . . . . . . . . . . . . . . . . . . . . . . . 17
2.4 Volume measure types spirometers . . . . . . . . . . . . . . 17
2.4.1 Water-sealed spirometer . . . . . . . . . . . . . . 17
2.4.2 Dry-seal spirometer . . . . . . . . . . . . . . . . . 18
2.4.3 Wedge Spirometer . . . . . . . . . . . . . . . . . 19
2.4.4 Volume displacement spirometers advantages anddisadvantages . . . . . . . . . . . . . . . . . . . . 20
2.5 Flow measuretypes spirometers . . . . . . . . . . . . . . . . 20
2.5.1 Electronic spirometer sensors . . . . . . . . . . . . 22
2.5.1.1 Thermal flowmeter . . . . . . . . . . 22
2.5.1.2 Differential pressure sensor . . . . . . 24
The Fleisch pneumotachometer . . . . 25
The Lilly pneumotachometer . . . . . 26
Diaphragm pneumotachometer . . . . 26
xi
Page 12
Venturi-type pneumotachometer . . . 26
2.5.1.3 Turbine flowmeter . . . . . . . . . . . 28
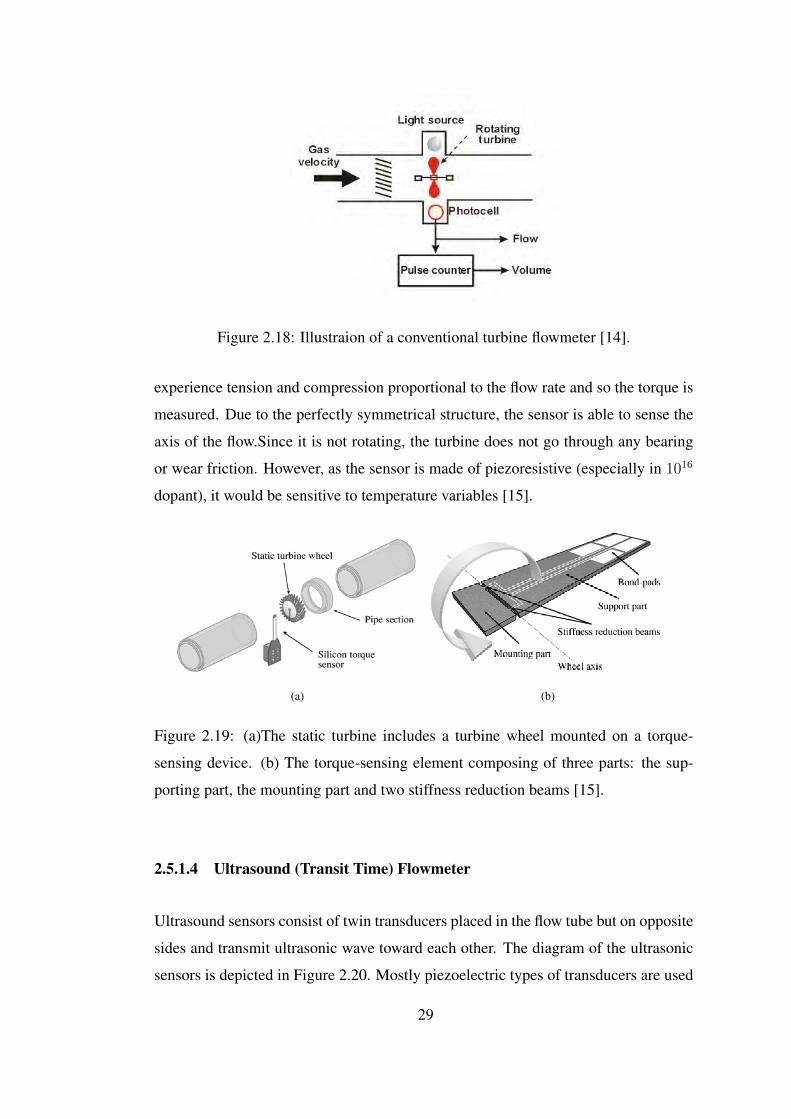
Conventional turbine flowmeters . . . 28
Static turbine . . . . . . . . . . . . . 28
2.5.1.4 Ultrasound (Transit Time) Flowmeter . 29
2.5.1.5 Vortex flowmeter . . . . . . . . . . . 32
2.5.1.6 Amorphous Ferromagnetic Materialsbased sensor . . . . . . . . . . . . . . 33
2.5.1.7 Cantilever based sensor . . . . . . . . 33
2.5.1.8 Gas Flow Sensor Based on Sound Gen-erated by Turbulence . . . . . . . . . 34
2.5.1.9 Lung Capacity Estimation through Acous-tic Signal of Breath . . . . . . . . . . 36
2.5.1.10 Self-power peak expiratory flowmeter 36
3 THEORY AND DESIGN . . . . . . . . . . . . . . . . . . . . . . . . 39
3.1 Principle of Operation . . . . . . . . . . . . . . . . . . . . . 39
3.2 Stator design . . . . . . . . . . . . . . . . . . . . . . . . . . 44
3.3 Coil design . . . . . . . . . . . . . . . . . . . . . . . . . . . 48
3.3.1 Coil resistance . . . . . . . . . . . . . . . . . . . 48
3.3.2 Coil inductance . . . . . . . . . . . . . . . . . . . 50
3.3.3 Coil capacitance . . . . . . . . . . . . . . . . . . 50
3.4 Magnets design . . . . . . . . . . . . . . . . . . . . . . . . 51
3.5 Turbine blades design . . . . . . . . . . . . . . . . . . . . . 54
xii
Page 13
3.6 Microballs design . . . . . . . . . . . . . . . . . . . . . . . 54
4 FABRICATION . . . . . . . . . . . . . . . . . . . . . . . . . . . . . 57
4.1 Introduction to the basic microfabrication . . . . . . . . . . . 57
4.2 Designed fabrication steps . . . . . . . . . . . . . . . . . . . 62
4.3 Stator masks design process . . . . . . . . . . . . . . . . . . 69
4.4 Alignment marks and stators’ outer frame patterning . . . . . 72
4.4.1 Challenges with lithography . . . . . . . . . . . . 73
4.4.2 Challenges with SiO2 wet etching . . . . . . . . . 74
4.4.3 Challenges with DRIE . . . . . . . . . . . . . . . 74
Coils deposition . . . . . . . . . . . . 75
Challenges with copper wet etching . . 75
4.4.4 Challenges with lift-off process . . . . . . . . . . 76
4.5 Insulator layer deposition . . . . . . . . . . . . . . . . . . . 78
4.6 Electrical pads connection . . . . . . . . . . . . . . . . . . . 78
4.7 Ball grooves etching . . . . . . . . . . . . . . . . . . . . . . 80
4.8 Summary and suggestions . . . . . . . . . . . . . . . . . . . 81
5 TEST AND RESULTS . . . . . . . . . . . . . . . . . . . . . . . . . 85
6 SUMMARY, CONCLUSIONS AND FUTURE WORKS . . . . . . . 89
6.1 Summary . . . . . . . . . . . . . . . . . . . . . . . . . . . . 89
6.2 Future work . . . . . . . . . . . . . . . . . . . . . . . . . . 90
REFERENCES . . . . . . . . . . . . . . . . . . . . . . . . . . . . . . . . 91
xiii
Page 14
APPENDICES
A DETAILED PROCESS TRAVELERS . . . . . . . . . . . . . . . . . 99
xiv
Page 15
LIST OF TABLES
TABLES
Table 2.1 Parameters of MTR for spirometers, standardized in 2005 [1]. . . . . 15
Table 2.2 Prospective MTR for spirometers [1]. . . . . . . . . . . . . . . . . . 16
Table 3.1 Parameters used in the simulations . . . . . . . . . . . . . . . . . . 52
Table 3.2 Simulation results for maximum Bavg and corresponding optimumnumber of P in range of Device geometry. . . . . . . . . . . . . . . . . . 54
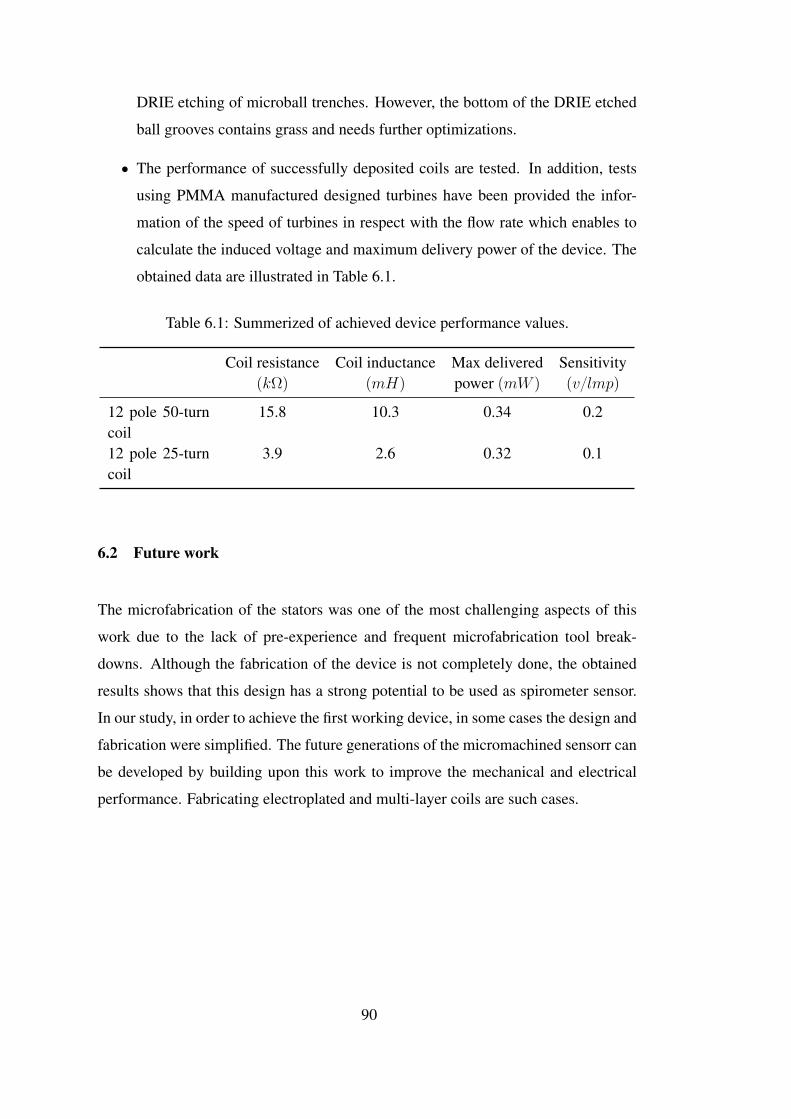
Table 6.1 Summerized of achieved device performance values. . . . . . . . . 90
xv
Page 16
LIST OF FIGURES
FIGURES
Figure 2.1 The respiratory tract [2]. . . . . . . . . . . . . . . . . . . . . . . . 6
Figure 2.2 A diagram showing respiratory excursions during normal breathingand during maximal inspiration and maximal expiration [3]. . . . . . . . . 7
Figure 2.3 The diagram shows how emphysema and chronic bronchitis affectthe lungs [4]. . . . . . . . . . . . . . . . . . . . . . . . . . . . . . . . . . 9
Figure 2.4 The changes to the airways that occur in asthma[5]. . . . . . . . . . 10
Figure 2.5 . . . . . . . . . . . . . . . . . . . . . . . . . . . . . . . . . . . . 11
Figure 2.6 (a) Forced spirogram, (b) flow-volume loop [6]. . . . . . . . . . . . 12
Figure 2.7 Basic water sealed spirometer [7]. . . . . . . . . . . . . . . . . . . 18
Figure 2.8 A rolling seal spirometer [8]. . . . . . . . . . . . . . . . . . . . . . 19
Figure 2.9 Wedge spirometer [7]. . . . . . . . . . . . . . . . . . . . . . . . . 20
Figure 2.10 . . . . . . . . . . . . . . . . . . . . . . . . . . . . . . . . . . . . 22
Figure 2.11 Diagram of a thermal flowmeter components and its simplified cir-cuit. [7]. . . . . . . . . . . . . . . . . . . . . . . . . . . . . . . . . . . . 23
Figure 2.12 A micromachined hot-wire sensor obtained by [9]. . . . . . . . . . 24
Figure 2.13 A micromachined hot film sensor obtained by [10]. . . . . . . . . . 24
Figure 2.14 The Fleischpneumotach consists of a set of narrow capillary tubesas the resistor [11]. . . . . . . . . . . . . . . . . . . . . . . . . . . . . . . 25
Figure 2.15 The Lilly pneumotachometer using mesh screens as resistor [11]. . 26
Figure 2.16 The diagram of a venturi type pneumotachometer [12]. . . . . . . . 27
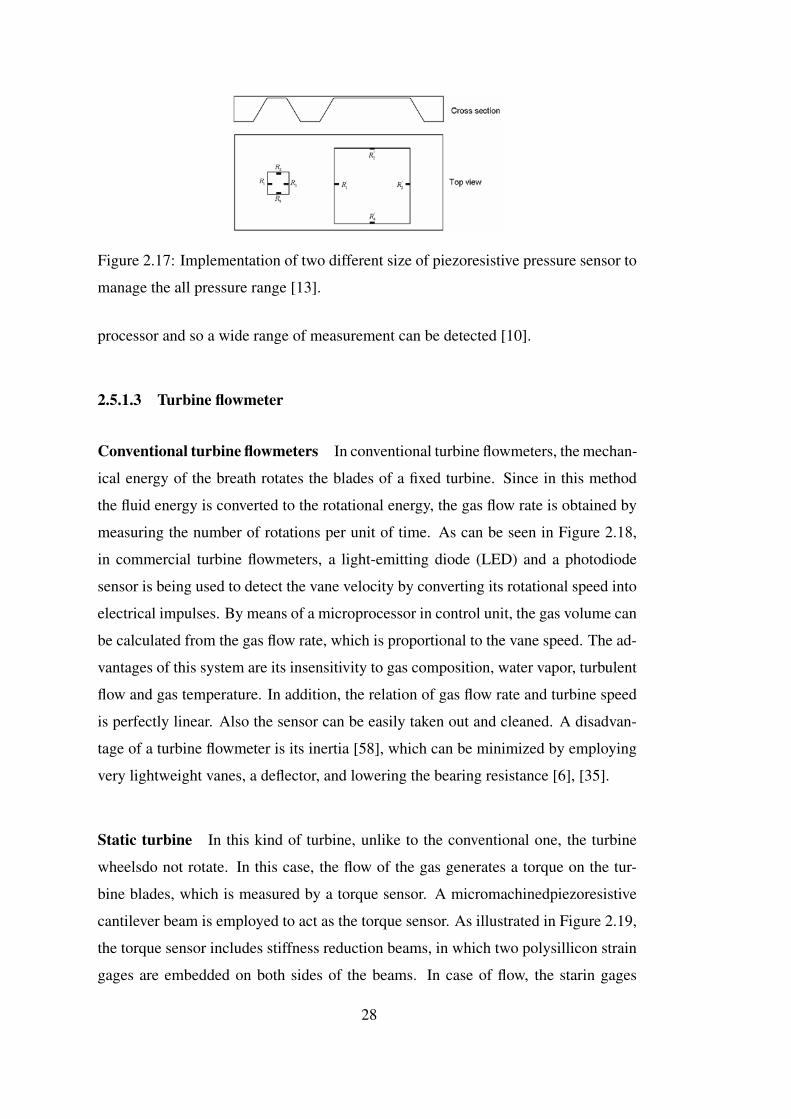
Figure 2.17 Implementation of two different size of piezoresistive pressure sen-sor to manage the all pressure range [13]. . . . . . . . . . . . . . . . . . . 28
xvi
Page 17
Figure 2.18 Illustraion of a conventional turbine flowmeter [14]. . . . . . . . . 29
Figure 2.19 (a)The static turbine includes a turbine wheel mounted on a torque-sensing device. (b) The torque-sensing element composing of three parts:the supporting part, the mounting part and two stiffness reduction beams[15]. . . . . . . . . . . . . . . . . . . . . . . . . . . . . . . . . . . . . . 29
Figure 2.20 The diagram of flow tube and the position of ultrasonic transducersused in transit-time based ultrasonic spirogram [7]. . . . . . . . . . . . . . 30
Figure 2.21 The Coaxial ultrasound pneumotachometer designed by [16]. . . . 31
Figure 2.22 The configuration of ultrasound pneumotachometer showing thecylindrical Shell transducer and the airway obtained by Plaut and Webster[17]. . . . . . . . . . . . . . . . . . . . . . . . . . . . . . . . . . . . . . 32
Figure 2.23 The diagram of a vortex flow meter [18]. . . . . . . . . . . . . . . 33
Figure 2.24 The Amorphous Ferromagnetic Materials based spirometer sensorobtained by [19]. . . . . . . . . . . . . . . . . . . . . . . . . . . . . . . . 34
Figure 2.25 (a) Physical structure of proposed sensor with exaggerated thick-ness and (b) Deformation of cantilever [20]. . . . . . . . . . . . . . . . . 35
Figure 2.26 Schematic diagram of the flow sensor based on sound [21]. . . . . . 35
Figure 2.27 (a) Recording a breathing signal for a subject and (b) Breath cyclesshowing different phases[63]. . . . . . . . . . . . . . . . . . . . . . . . . 36
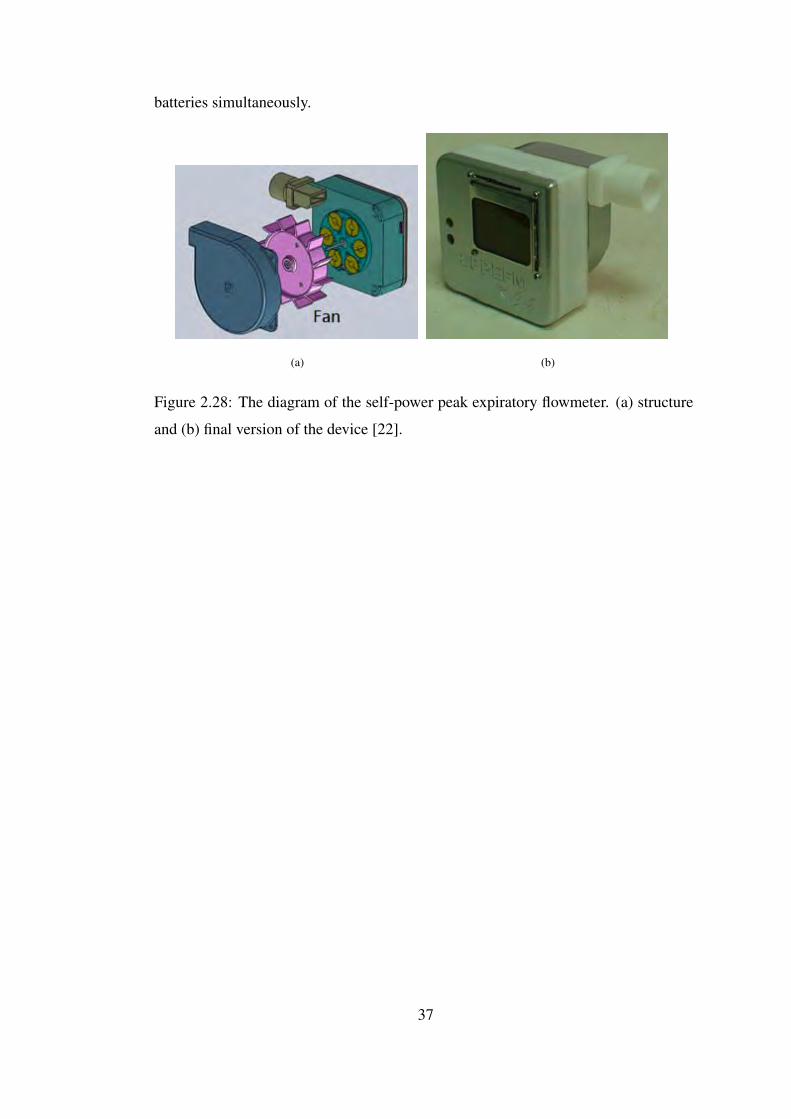
Figure 2.28 The diagram of the self-power peak expiratory flowmeter. (a) struc-ture and (b) final version of the device [22]. . . . . . . . . . . . . . . . . . 37
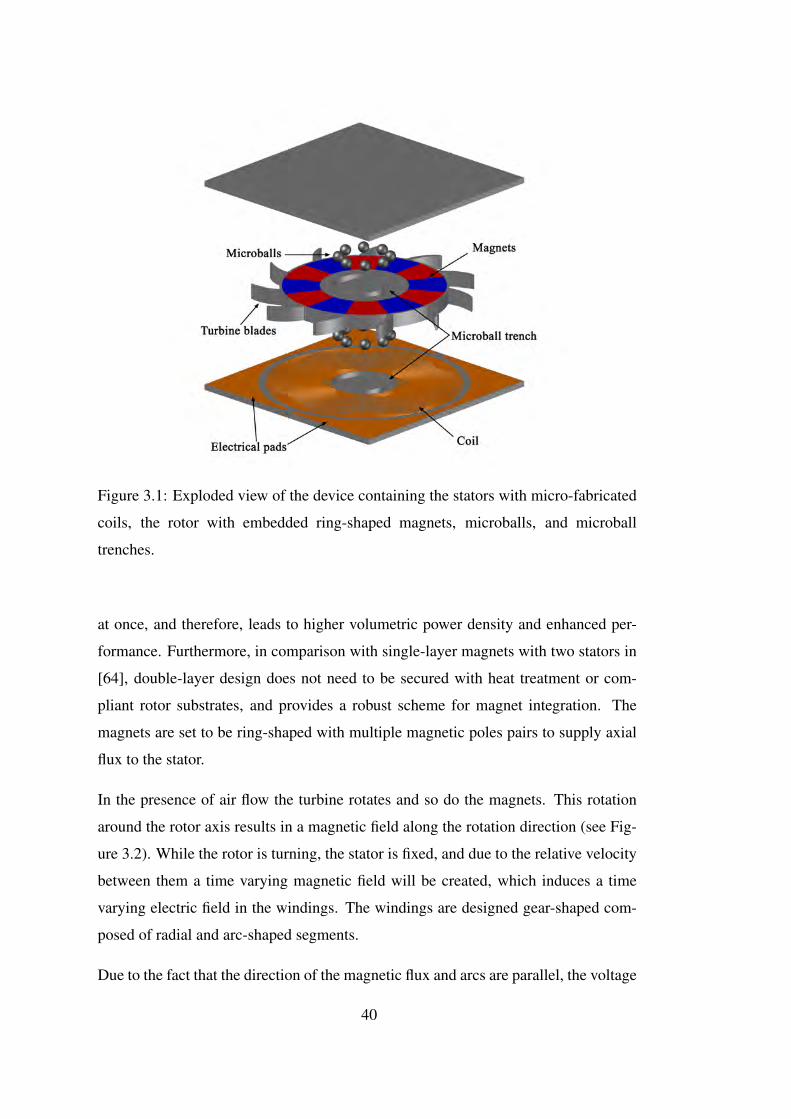
Figure 3.1 Exploded view of the device containing the stators with micro-fabricated coils, the rotor with embedded ring-shaped magnets, microballs,and microball trenches. . . . . . . . . . . . . . . . . . . . . . . . . . . . 40
Figure 3.2 The illustration of the two layer magnets n top of the stator coils.When the turbine rotates, a time varying magnetic field (B) along the ro-tation direction will be created. . . . . . . . . . . . . . . . . . . . . . . . 41
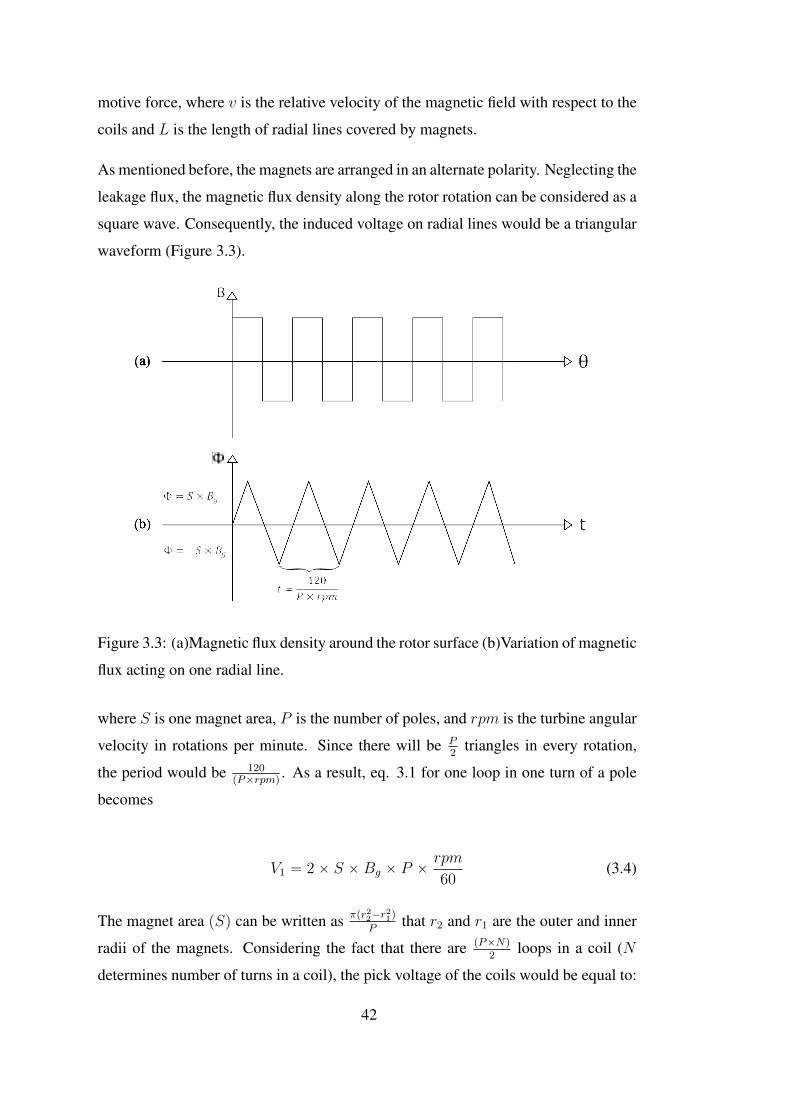
Figure 3.3 (a)Magnetic flux density around the rotor surface (b)Variation ofmagnetic flux acting on one radial line. . . . . . . . . . . . . . . . . . . . 42
Figure 3.4 Generated voltage waveform of an entire coil under the assumptionof perfect magnetization of magnets. . . . . . . . . . . . . . . . . . . . . 44
xvii
Page 18
Figure 3.5 Renderings of the three phase stator winding patterns for (a) 2-turn/pole, and (b) 4-turn/pole designs in [23]. . . . . . . . . . . . . . . . . 45
Figure 3.6 Schematic illustration of three kinds of conventional designed micro-coils [24]. . . . . . . . . . . . . . . . . . . . . . . . . . . . . . . . . . . 45
Figure 3.7 The diagram of 3-turn coil designs (a) gear-shaped (b) traditionaldesign [25]. . . . . . . . . . . . . . . . . . . . . . . . . . . . . . . . . . 46
Figure 3.8 Illustration of end turn patterns in gear-shaped coils (a) sectorshape (b) semicircular (c) triangular designs [25]. . . . . . . . . . . . . . 46
Figure 3.9 The three different segments of the schematic coil. . . . . . . . . . 47
Figure 3.10 (a) Simulation model for P “ 2, tm “ 500mm, rout “ 5mm,rin “ 2mm. (b) distribution of flux density above the stator surface. . . . . 53
Figure 3.11 Bavg versus P showing the ranges where flux leakages and largereluctance are dominant and the number of poles at which the Bavg ismaximum. . . . . . . . . . . . . . . . . . . . . . . . . . . . . . . . . . . 53
Figure 3.12 Turbine designs with (a) circular-type blades showing relevant di-mensions, and (b) involute-type blades with the same dimensions [26]. . . 55
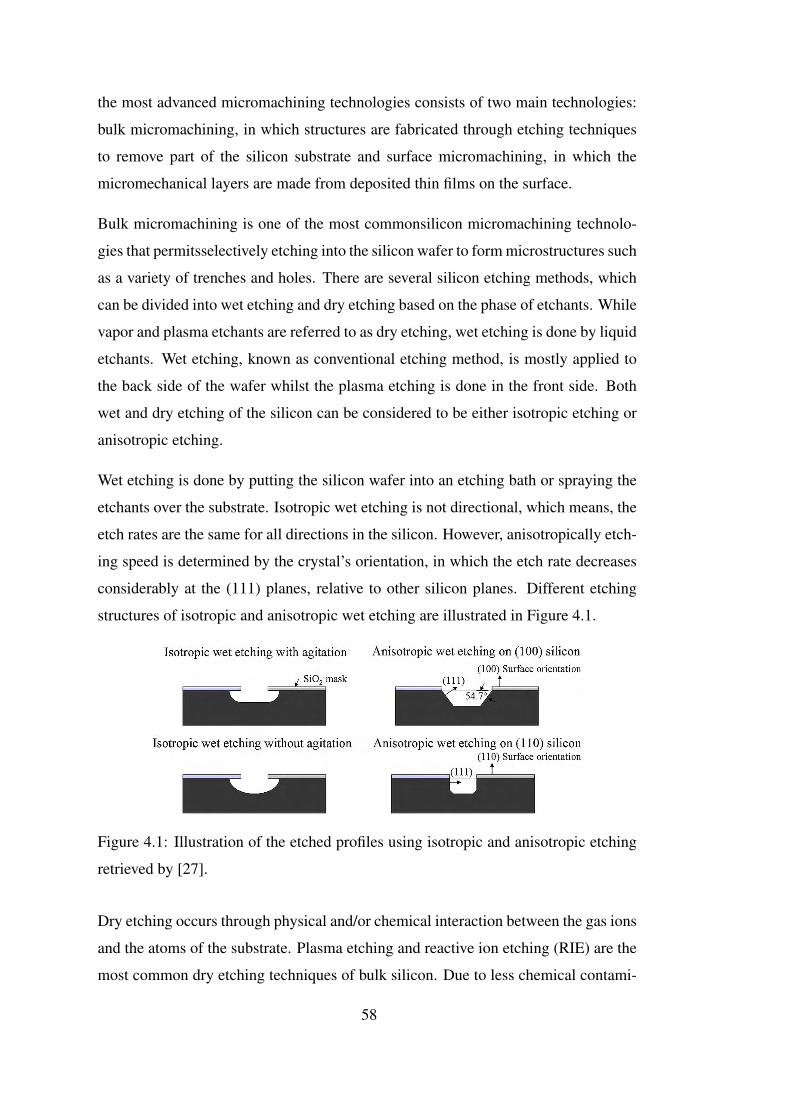
Figure 4.1 Illustration of the etched profiles using isotropic and anisotropicetching retrieved by [27]. . . . . . . . . . . . . . . . . . . . . . . . . . . 58
Figure 4.2 Illustration of how deep reactive ion etching works [28]. . . . . . . 59
Figure 4.3 Illustration of a surface micromachining process [29]. . . . . . . . 60
Figure 4.4 Step coverage of deposited films with (a) uniform coverage (b)nonconformal step coverage [30] . . . . . . . . . . . . . . . . . . . . . . 61
Figure 4.5 Schematic of a general electrochemical deposition cell [30] . . . . 61
Figure 4.6 A schematic outlining the stages of the lift off process with bothpositive and negative photoresists with exaggerated sidewall angles [27] . 62
Figure 4.7 An illustration of the stator contains in-plain coils, electrical pads,and the microballs trench. Also a close view of the connection of the padto one end of the coil is shown. . . . . . . . . . . . . . . . . . . . . . . . 62
Figure 4.8 Designed fabrication flow process. Continued . . . . . . . . . . . . 69
Figure 4.9 The layout of the 1st mask, which contains patterns of the stators’outer frame and alignment marks. Features are clear. . . . . . . . . . . . . 70
xviii
Page 19
Figure 4.10 The layout of the 2nd mask, which contains patterns of the coils.Features are clear. . . . . . . . . . . . . . . . . . . . . . . . . . . . . . . 70
Figure 4.11 The layout of the 3rd mask, which is pattern of the insulation layer.Features are dark. . . . . . . . . . . . . . . . . . . . . . . . . . . . . . . 71
Figure 4.12 The layout of the 4th mask, which contains the patterns of theelectrical pads and devices names. . . . . . . . . . . . . . . . . . . . . . . 71
Figure 4.13 The layout of the 5th mask, which contains the patterns of the ballgrooves and stators’ outer frames. . . . . . . . . . . . . . . . . . . . . . . 72
Figure 4.14 Bubble formation after UV exposure . . . . . . . . . . . . . . . . 73
Figure 4.15 Adhesion of the AZ4533 during wet etching a) without hard bakingb) The PR is hardbaked at 140˝C . . . . . . . . . . . . . . . . . . . . . . 74
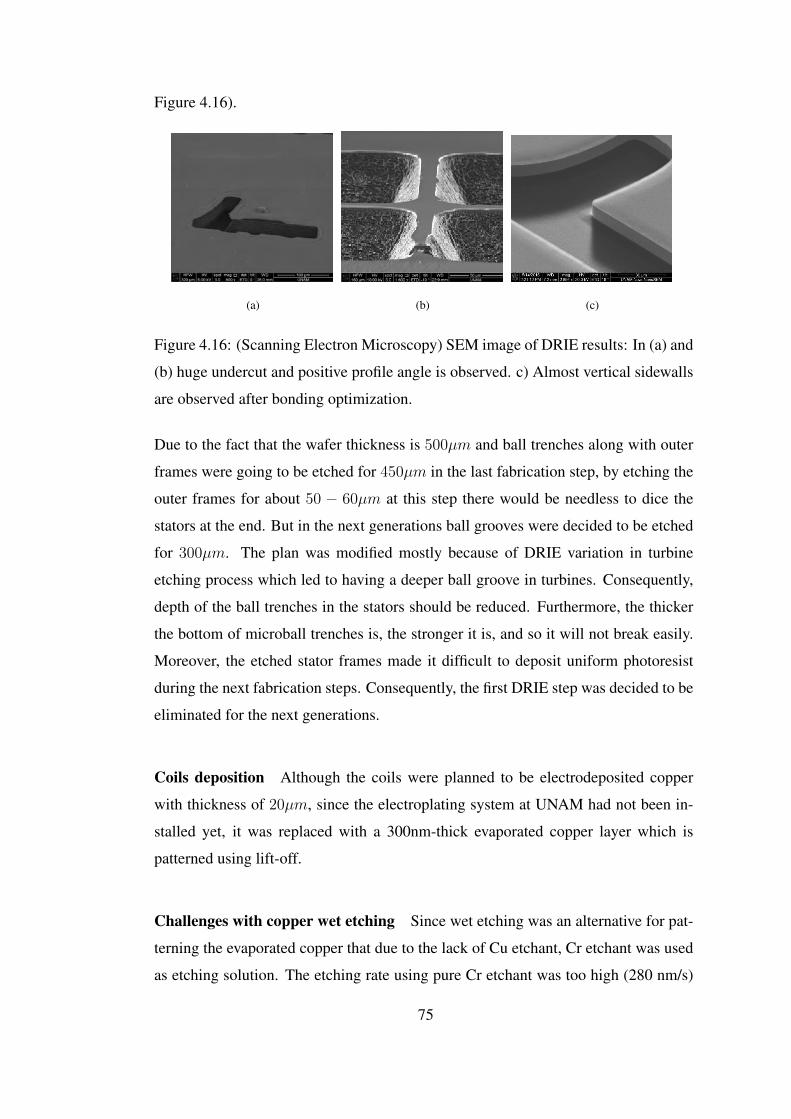
Figure 4.16 (Scanning Electron Microscopy) SEM image of DRIE results: In(a) and (b) huge undercut and positive profile angle is observed. c) Almostvertical sidewalls are observed after bonding optimization. . . . . . . . . . 75
Figure 4.17 Illustration of non-uniform etching of Cu using Cr etchant. . . . . . 76
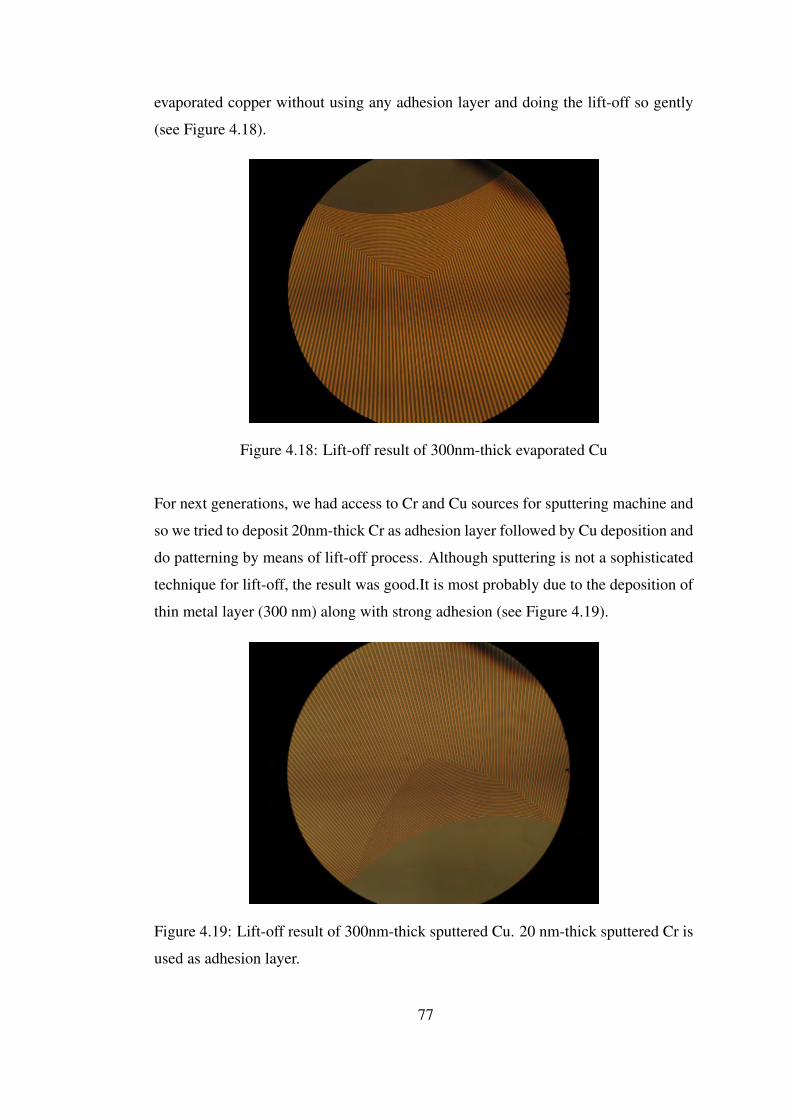
Figure 4.18 Lift-off result of 300nm-thick evaporated Cu . . . . . . . . . . . . 77
Figure 4.19 Lift-off result of 300nm-thick sputtered Cu. 20 nm-thick sputteredCr is used as adhesion layer. . . . . . . . . . . . . . . . . . . . . . . . . . 77
Figure 4.20 SU-8 lithography, which is covered everywhere on top of the coilsexcept two rectangles on two ends of the coil. . . . . . . . . . . . . . . . 78
Figure 4.21 The adhesion loss of 700nm-thick evaporated Cu on top of the SU-8 during wet etching in Cr echant. . . . . . . . . . . . . . . . . . . . . . . 79
Figure 4.22 Illustration of the non-uniform sputtered Cr and Cu wet etching. . . 80
Figure 4.23 Illustration of lifted-off sputtered Cu pads. . . . . . . . . . . . . . 80
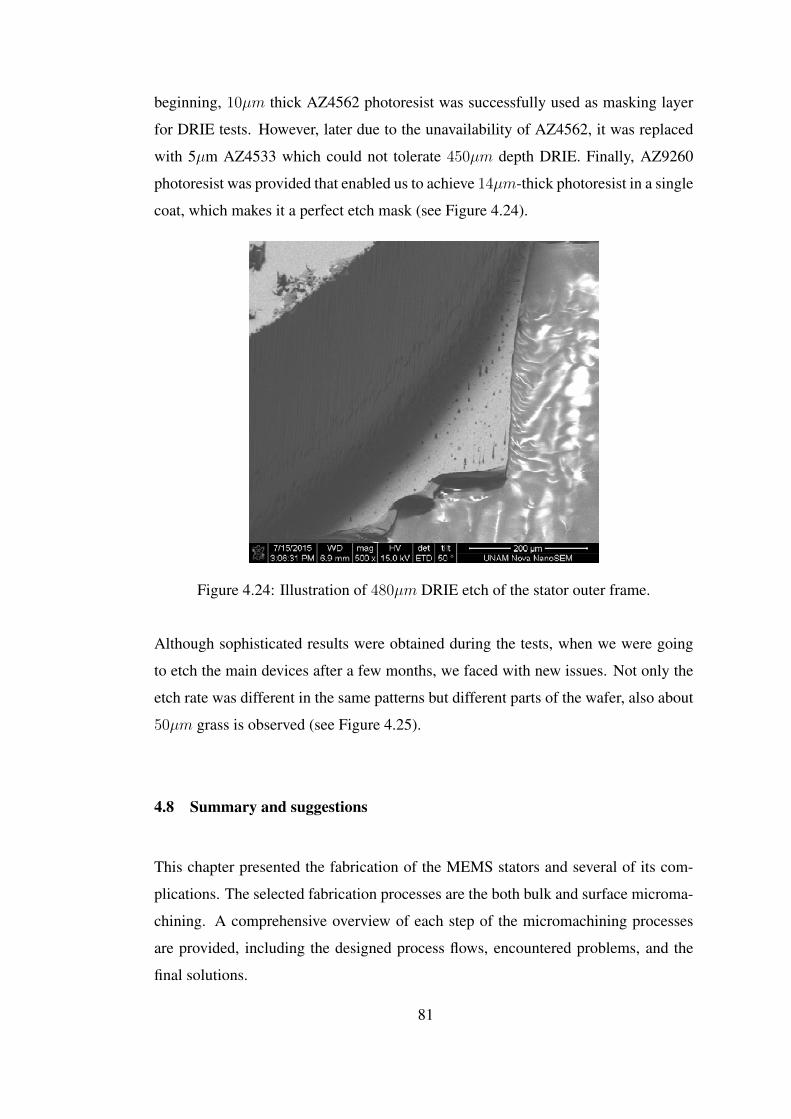
Figure 4.24 Illustration of 480µm DRIE etch of the stator outer frame. . . . . . 81
Figure 4.25 SEM image of the grassing at the bottom of the DRIE etched balltrench. . . . . . . . . . . . . . . . . . . . . . . . . . . . . . . . . . . . . 82
Figure 4.26 Fabrication flow of the stator. Continued . . . . . . . . . . . . . . 84
Figure 5.1 Equivalent circuit model for microcoil. . . . . . . . . . . . . . . . 86
Figure 5.2 Rotational speed vs flow rate for different turbine designs [26]. . . 87
xix
Page 20
Figure 5.3 induced voltage vs flow rate for different coil designs. . . . . . . . 87
xx
Page 21
CHAPTER 1
INTRODUCTION
Chronic Obstructive Pulmonary Disease (COPD) and Asthma are two of the most
common lung diseases worldwide. According to World Health Organization (WHO)
estimates, 65 million people have moderate to severe COPD and 235 million people
suffer from Asthma. Correspondingly, there is a growing demand for early diagnosis
as well as appropriate treatments targeted at these diseases. One of the most common
methods in diagnosing and following the progress of such lung diseases is spirometry,
which is the practice of measuring exhaled or inhaled air to assess the type and extent
of the lung malfunctions. There are variety types of commercial spirometers, which
differ in size, performance, and price. The advanced spirometers are more accurate
and capable of performing wide variety of tests. However, they are so expensive and
can be only found in established health care facilities. There are also simpler spirom-
eters with limited performance available in the market. These simple spirometers
are cheaper compared to the advanced ones that can be considered for personal use.
However, due to the fact that these diseases are prevalent mostly in highly-populated
and low-income countries, there is a high demand for accurate devices but in much
lower price. Furthermore, since remote monitoring can result in better medical ser-
vices along with much less cost for government and patients, even high developed
countries are in need of low-cost, reliable and portable spirometers.
The core component of a spirometer is the sensing unit that measures the spirometry
parameters, i.e. air velocity and total air volume. Four main types of sensors have
been used in spirometers so far, namely thermal sensors, differential pressure sensors,
ultrasound sensors, and turbine-type sensors. Thermal sensors, also called hot wire
1
Page 22
sensors, usually employ a hot metal or semiconductor piece that exchanges heat with
the flowing gas [31]. The resulting temperature drop on the piece is proportional to
the air velocity, allowing the measurement of multiple related parameters [32]. Al-
though sensor linearity and accuracy are important advantages in this type of sensors,
susceptibility to dust particles as well as ambient pressure severely limit their real-
life performance. In addition, their inability to measure bidirectional gas flow due to
their design nature prohibits the monitoring of inhalation and exhalation at the same
time. Differential pressure sensors, on the other hand, take advantage of Bernoulli’s
principle, and indirectly determine the spirometry parameters by measuring the pres-
sure difference along a tube with known fluidic resistance [13]. These sensors are
bidirectional in nature, and show accurate results especially in low flow rates [13].
However, they are sensitive to temperature variations, and are prone to blockage by
solid and liquid particles around the sensor vicinity [33],[34]. Ultrasound sensors are
used in pairs located on the opposite sides of a flow tube, transmitting and receiving
ultrasonic pulses [7]. The transit time of the acoustic waves is a function of the air
velocity. Turbine sensors, on the other hand, operate based on a direct interaction be-
tween a rotary turbine and the flowing gas [35]. The resulting turbine rotation speed
is a linear function of gas velocity and flow rate, from which the total air volume
can be straightforwardly determined. In addition, the turbine based design allows for
bidirectional operation while remaining insensitive to humidity, ambient temperature
and pressure. A major challenge in this type of spirometers is the turbine rotational
inertia problem.
We have adopted a new MEMS approach to turbine-based spirometers that is able
to directly measure the velocity air volume. The turbine angular velocity will be
detected magnetically by copper coils on the stators embedded on both sides of the
rotor. This device would include all the advantages of present turbine sensors. In
addition, using MEMS technology will help to decrease sensor cost and dimension.
The main idea is to produce a spirophone [36] by connecting this small sensor to the
phone that makes it much more portable, cheaper and highly accurate. Furthermore,
since it is able to convert the energy of respiration to electrical energy, self-powering is
another outstanding feature of this device. This feature enables to use the spirometer
whenever and anywhere without worry of recharge or change the batteries.
2
Page 23
In summary, scope of the thesis can be defined as:
‚ Designing the stator coils and magnets.
‚ Optimizing the pole number using COMSOL simulation file obtained from Dr.
Beyaz.
‚ Designing the turbine blades by Utku Goreke
‚ Designing the stator masks using AutoCAD
‚ Microfabrication of the stators
‚ Testing the electrical characterization of the coils
‚ Calculating the induced voltage and maximum power based on the test results
performed by Utku Goreke on PMMA turbines.
Based on statistics, there is a high demand for spirometers for COPD and asthma
patients. Among different types of spirometers, the turbine based sensors possess
all the advantages of insensitivity to ambient pressure, temperature, humidity, and
gas particles. In this study, we have demonstrated a new technique to approach the
first turbine based MEMS spirometer sensor, which owns all the advantages of the
conventional turbine based spirometers, in addition to having a lower price and being
more portable. Furthermore, this design is capable of converting the energy of the
human breath into electrical power. It also can be integrated easily with portable
electronic devices like cellphones in order to record and transmit the patient’s test
results to health care centers for analysis and comments.
This thesis is organized into five chapters as follows:
‚ Chapter 2 provides background about lung structures and the most common
lung diseases, COPD and Asthma. We review different types of spirometry tests
followed by discussing the standards that are defined for spirometers reliability.
This chapter also reviews two major types of spirometers: volume measure type
and flow measure type spirometers.
3
Page 24
‚ Chapter 3 focuses on the theory, design, and simulation of the turbine-based
MEMS spirometer sensor. In the theory part, we describe fundamental equa-
tions governing the device operation. Simulations on magnetic leakage and sat-
uration are provided for more accurate device performance estimations. Based
on this analysis and considering microfabrication limitations, two device de-
signs are presented.
‚ Chapter 4 describes the process of the masks design and microfabrication of the
stators of the device. Stator fabrication steps along with related issues are thor-
oughly discussed in this chapter. At the end a brief summary and suggestions
for future improvements are given.
‚ Chapter 5 presents the testing procedure of the fabricated stators. The resistiv-
ity and inductance of the coils are measured and compared to the theoretical
analysis. The induced voltage and maximum delivery power of the sensor are
calculated based on practical results.
‚ Chapter 6 concludes this thesis with a summary of main achievements. Future
work for potential improvements on device performance are discussed.
4
Page 25
CHAPTER 2
LITERATURE REVIEW
Chronic Obstructive Pulmonary Disease (COPD) and Asthma are two of the most
common lung diseases worldwide.Correspondingly, there is a growing demand for
early diagnosis as well as appropriate treatments targeted at these diseases. One of
the most common practices in diagnosing and following the progress of such lung
diseases is spirometry test, which is able to detect the type and extent of the lung
malfunctions by measuring the exhaled or inhaled air.
In this chapter (Section 2.1), we will first discuss the lung structure and the most com-
mon lung diseases, COPD and Asthma. Sections 2.2 and 2.3 describe the spirometry
test and the spirometer parameters, respectively. Sections 2.4 and 2.5 present the
basic and modern kinds of spirometers.
2.1 Respiratory system
The biological system responsible for processing respiration by the use of specific
organs and structures is known as the respiratory system. This process is done by
supplying the body with oxygen via breathing in (known as inhalation) and then ex-
pelling out carbon dioxide by breathing out (known as exhalation).
2.1.1 Respiratory anatomy
The respiratory tract is composed of the alveoli, which are where cellular respiration
occurs and the trachea is an airway that divides into tree-like branches that are both
5
Page 26
symmetrical and asymmetrical. Each branch of the airway along the trachea becomes
smaller, however the total area of the airways increases which allows the airflow
resistance to decrease as the air moves into the bronchioles. Inhalation, also known
as inspiration, makes use of the muscles in the chest, such as the diaphragm, to pull
air in. Meanwhile exhalation, also known as expiration, passively expels air from the
lungs. The alveoli, of which there are 300 million, have the combined surface area of
a tennis court and this is where the oxygen and carbon dioxide exchange occurs (see
Figure 2.1).
There are two kinds of arteries moving from the heart to the lungs called the pul-
monary and bronchial. The pulmonary artery transports deoxygenated blood from
the heart to the lungs. After passing through the lungs the blood becomes oxygenated
and is pumped through the pulmonary veins into the heart, which then pumps it to the
other organs in the body. Oxygenated blood is also circulated through lung tissue via
bronchial circulation. The lungs also serve other functions such as protection against
infectious agents and pollutants, metabolism and detoxification of substances, and
synthesizing important compounds that help with inflammatory reactions [3].
Figure 2.1: The respiratory tract [2].
The spirometry test does not directly quantify the oxygen transferring rate inside the
lungs, but instead it measures the major factors influencing the oxygen transfer pro-
cess which are the air flow rate and volume of air during exhalation and inhalation.
6
Page 27
This test is mostly used for COPD and asthma patients. Asthma and COPD are two
types of chronic lung inflammation, however, these two diseases are not the same
across individuals and as such will affect different people in different ways. This
requires a broad range of treatments in order to account for the differences found
between individuals.
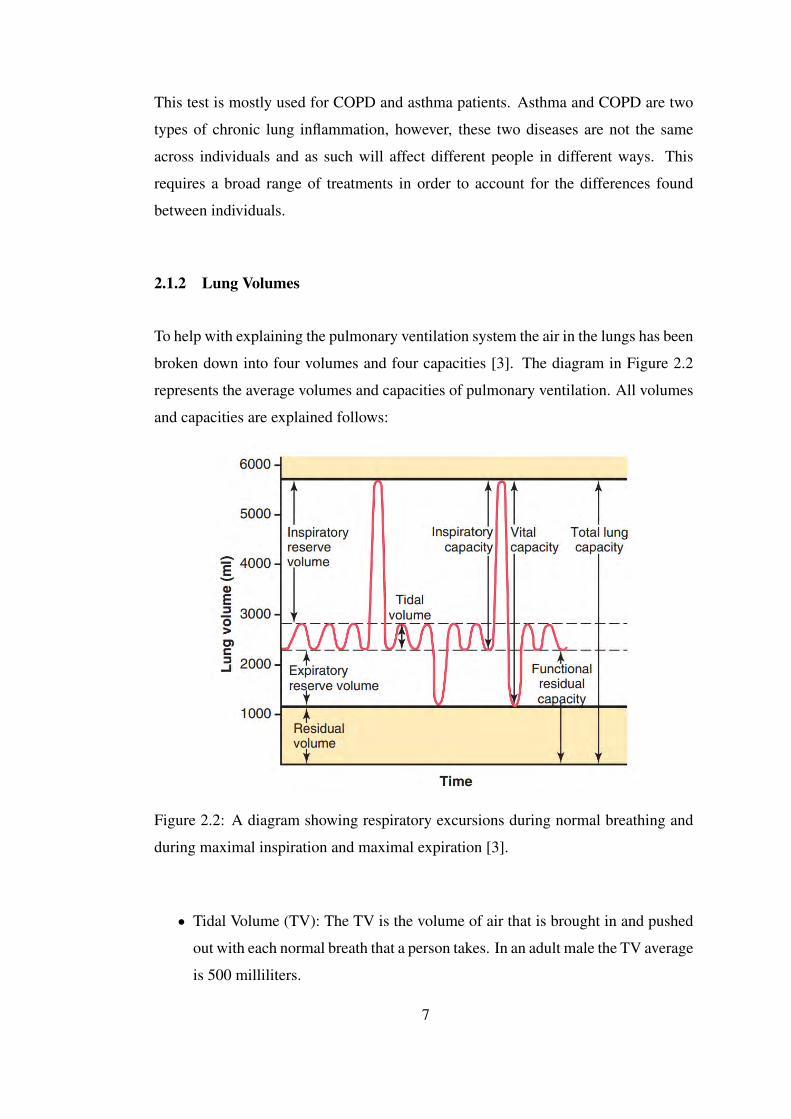
2.1.2 Lung Volumes
To help with explaining the pulmonary ventilation system the air in the lungs has been
broken down into four volumes and four capacities [3]. The diagram in Figure 2.2
represents the average volumes and capacities of pulmonary ventilation. All volumes
and capacities are explained follows:
Figure 2.2: A diagram showing respiratory excursions during normal breathing and
during maximal inspiration and maximal expiration [3].
‚ Tidal Volume (TV): The TV is the volume of air that is brought in and pushed
out with each normal breath that a person takes. In an adult male the TV average
is 500 milliliters.
7
Page 28
‚ Inspiratory Reserve Volume (IRV): The IRV is the extra amount of air that goes
above the normal TV when a person breaths in with full force. In an adult male
the IRV averagee is 3000 milliliters.
‚ Expiratory Reserve Volume (ERV): The ERV is the extra amount of air that
goes above the normal TV when a person breaths out with full force. In an
adult male the ERV averagee is 1100 milliliters
‚ The Residual Volume (RV): The RV is the amount of air that remains in the
lungs after it is forcefully expelled from the lungs. . In an adult male the RV
averagee is 1200 milliliters.
‚ The Inspiratory Capacity (IC): The IC is equal to the TV plus the IRV, thus
it is the amount of air that a person can breathe in (the IRV) and then distend
the lungs to its maximum amount (TV). In an adult male the average is 3500
milliliters.
‚ The Functional Residual Capacity (FRC): The FRC is equal to the ERV plus the
RV, thus it is the amount of air that remains in the lungs after a normal breath.
In an adult male the average is 2300 milliliters.
‚ The Total Lung Capacity (TLC): The TLC is the maximum volume that the
lungs can be expanded to with the greatest amount of effort. The TLC is equal
to the VC plus the RV. This amount increases when the lungs lose their elastic-
ity, such as with COPD and emphysema. In an adult male the average is 5800
milliliters.
‚ The Vital Capacity (VC): The VC is equal to the IRV plus the TV plus the ERV.
This is the maximum amount of air that a person can push out of their lungs
after filling their lungs to its maximum. In an adult male the average is 4600
milliliters.
2.1.3 COPD
COPD stands for chronic obstructive pulmonary disease and according to the Center
for Disease, Control and Prevention more than 15 million Americans are diagnosed
8
Page 29
with COPD, making it the third leading cause of death in the United States [4]. Two
common conditions related to COPD are chronic bronchitis and emphysema which
may happen either together or individually. Both of these conditions obstruct the air-
ways irreversibly, but their pathological mechanisms are different [4]. Chronic bron-
chitis is caused when there is an airflow restriction in the bronchi due to excessive
mucus and inflammation. Meanwhile emphysema is caused when there is destruc-
tion of the elastic tissue in the respiratory part of the lungs, typically in the alveoli
as depicted in Figure 2.3. This results in difficulty in breathing due to smaller and
narrower airways. While genetics does play a factor in COPD, most cases develop
from environmental factors or cigarette smoking. Therefore COPD is preventable [2].
Figure 2.3: The diagram shows how emphysema and chronic bronchitis affect the
lungs [4].
9
Page 30
2.1.4 Asthma
Asthma is a fairly common long-term pulmonary disease, affecting more than 235
million people in the in the world [37]. Asthma is a chronic and long term condition
in which a person’s airways become narrow and inflamed with the end result being
difficulties in breathing (see Figure 2.4). While it can manifest in different ways it
tends to appear as an obstruction of the airways, bronchial hyper-responsiveness, and
inflammation of the airways. Asthma resembles COPD in that it can be caused by
genetic and environmental factors. It differs from COPD in that the inflammation
caused in asthma may also be due to an allergic reaction, the resultant asthma attack
having been caused by breathing in an allergen [2].
Figure 2.4: The changes to the airways that occur in asthma[5].
Asthma can be treated by the use of B2-adrenergic inhalants (bronchodilators) which
work to open constricted airways swiftly. However, B2-adrenergic inhalants are not
as effective when used on patients with COPD. This makes it possible to test if a
patient has COPD or asthma by observing whether they respond to the B2-adrenergic
inhalant or not. By using testing devices it is possible not only to diagnose if a patient
10
Page 31
suffers from COPD or asthma but also to chart how far it has developed as well as
charting any patterns in patient’s symptoms [2].
2.1.5 Basic pulmonary function testing
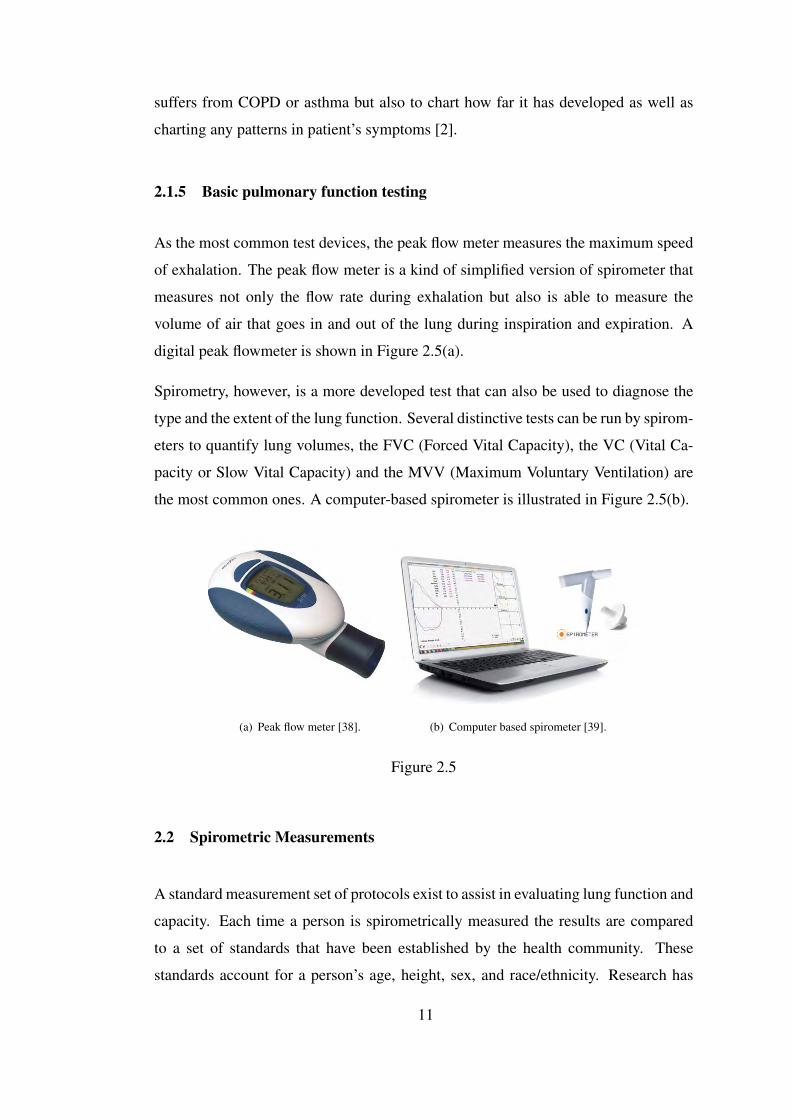
As the most common test devices, the peak flow meter measures the maximum speed
of exhalation. The peak flow meter is a kind of simplified version of spirometer that
measures not only the flow rate during exhalation but also is able to measure the
volume of air that goes in and out of the lung during inspiration and expiration. A
digital peak flowmeter is shown in Figure 2.5(a).
Spirometry, however, is a more developed test that can also be used to diagnose the
type and the extent of the lung function. Several distinctive tests can be run by spirom-
eters to quantify lung volumes, the FVC (Forced Vital Capacity), the VC (Vital Ca-
pacity or Slow Vital Capacity) and the MVV (Maximum Voluntary Ventilation) are
the most common ones. A computer-based spirometer is illustrated in Figure 2.5(b).
(a) Peak flow meter [38]. (b) Computer based spirometer [39].
Figure 2.5
2.2 Spirometric Measurements
A standard measurement set of protocols exist to assist in evaluating lung function and
capacity. Each time a person is spirometrically measured the results are compared
to a set of standards that have been established by the health community. These
standards account for a person’s age, height, sex, and race/ethnicity. Research has
11
Page 32
shown that factors such as body size and demographic groups can have an effect on
the diagnostic thresholds for such obstructive lung diseases. The following are the
standard measurements used by the spirometry test.
2.2.1 Forced Vital Capacity
This test is conducted by having the patient breath in fully and then pushing all the
air out of their lungs as fast as they can. The results are then shown on a graph and
are compared to a predetermined set of values based on the general measurements
composed by the health community. These measures, as stated above, take into ac-
count factors such as height, sex, and age. For instance, a healthy adult can typically
push all the air out of their lungs in about 6 seconds. Taking significantly longer may
indicate the presence of COPD [2].
The graphs used for displaying spiromteric results are called the spirograms. Spirograms
display volume in liters, time in seconds, and airflow rates in liters per second. There
are two types of spirograms, the Volume-Time and the Flow-Volume Curve. The
curves and spirometric parameters are illustrated in Figure 2.6.
Figure 2.6: (a) Forced spirogram, (b) flow-volume loop [6].
12
Page 33
2.2.1.1 The Flow-Volume Curve
The VTC, which can be seen in Figure 2.6(b), is composed of the expiratory flow vs
the volume curve and displays the airflow rates in relation to the amount of air that
are being pushed out of the lungs. The curve created also has points that contain the
PEF and the FVC.
The Flow Volume starts on the X-axis; this is known as the volume axis. When the
test starts the flow and volume are at zero. After the test starts the point of the cover
begins to rise and peak, this is known as the Peak Expiratory Flow (PEF). The PEF
will fall as air is pushed out of the lungs. For a healthy set of lungs the FV will
descend in a straight or convex line, going from the top (PEF) to the bottom (FVC).
The Forced Vital Capacity (FVC) is the maximum volume of air forcefully pushed
from the lungs at the height of breathing it in. The forced inspiration that follows
the forced expiration has roughly the same morphology, but the PIF (Peak Inspiratory
Flow) is not as distinct as PEF.
2.2.1.2 The Volume-Time Curve
The VT is the volume of air vs the time curve and it corresponds to the FEV1 and
FVC. The amount of air pushed out of the lungs during the first seconds of the FVC
is called the FEV1. The curve is shown in 2.6(b). Time and flow start at the (0,0)
on the graph. Since most of the air is pushed out of the lungs at the start of the test
when the large airways of the lungs are emptied the graph will swiftly rise. 80% of
the total volume of air in the lungs is pushed out within the first second of the test.
As air empties from the lungs the expired volume that was rising will level off into a
horizontal line.
2.2.2 (Slow) Vital Capacity (SVC)
This test is conducted by having the patient breathe in fully and then pushing all the
air out of the lungs slowly or by having the patient push all the air out of their lungs
fully and then breathing in slowly until their lungs are full. This test can be used
13
Page 34
to measure the TV, IRV, ERV, and IC. The SVC is closely related to the FVC and
differences between the two can suggest a possible collapse in small airways. This
has been attributed to COPD and is believed to be due to a loss of elasticity in the
lungs.
2.2.3 Maximum Voluntary Ventilation
This test is done by having the patient breath in and out as rapidly and hard as possible
into the spirometer for 12 seconds. The total volume of the gas moved by the lungs
is recorded. The value is multiplied by 4 to produce the maximum volume that the
patient breathed per minute by voluntary effort. This test can be dangerous for some
patients, thus it is no longer commonly given.
2.3 Spirometer parameters
In order to obtain reliable measurements through spirometry tests, some standards are
defined for spirometers. Moreover, other parameters such as spirometer calibration
and hygienics are important factors that should be considered as well.
2.3.1 Measuring range
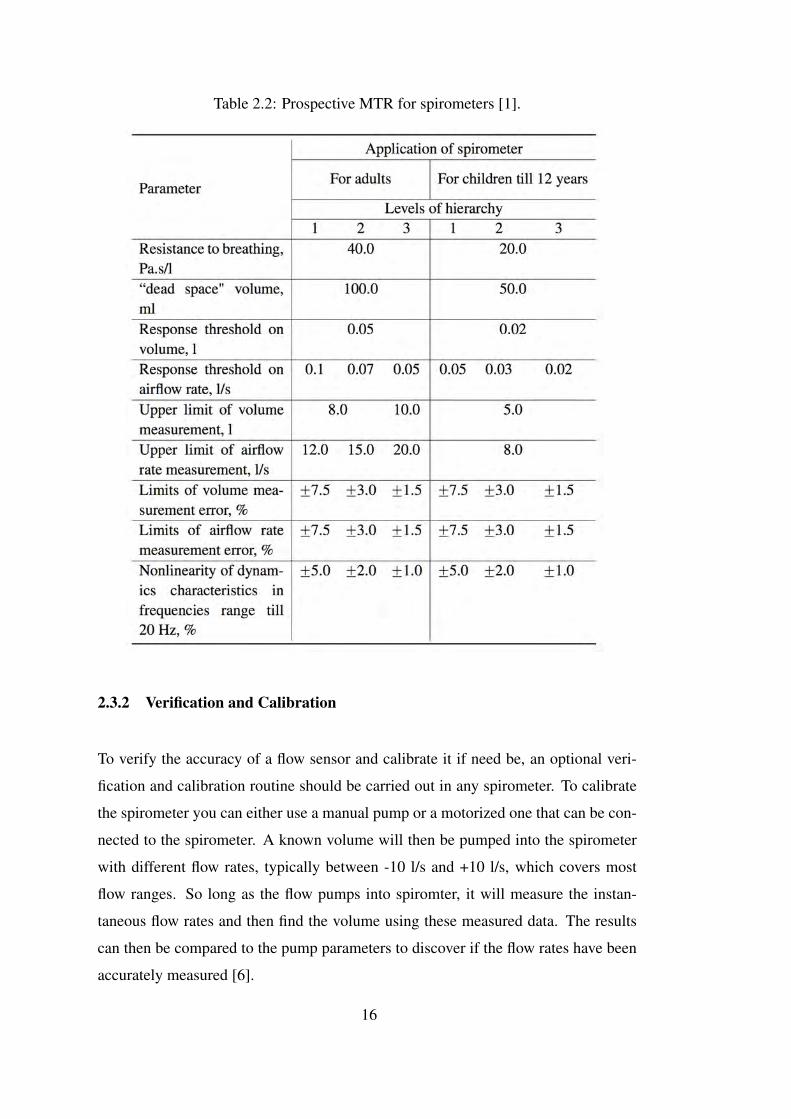
There are several conditions that have been defined over the years as standards to
guarantee the spirometer results. These are called the medical, technical requirements
or the MTR. The MTR typically includes:
1. Resistance of spirometer to breathing
2. Volume of airflow sensor (known as dead space)
3. Response threshold of airflow rate
4. Measure of the range of airflow rate
5. Limits of Measurements error
14
Page 35
6. Non-linearity of the frequency response in the range of relevant frequencies
Starting in 2005 the American Toracic Society (ATS) and the European Respiratory
Society (ERS) introduce a mutual standard form as the MTR [40] (see Table 2.1).
Table 2.1: Parameters of MTR for spirometers, standardized in 2005 [1].
Furthermore, [1] published a paper that includes more standards of the MTR [1].
These standards were based on analyzed requirements for spirometers across different
deviances and are hierarchy ranked. See Table 2.2 for more details.
Table 2.2 has been divided into two subgroups, one for adults and one for children.
Each subgroup has different requirements. The three levels also have more details as
follows:
1. 1st level is for simple devices measuring 1-3 forced breaths for the PEF, FVC,
and FEV1. Spirometers of this level have simple design and operation along
with minimum weight and size requirements, known as “home medicine" de-
vices.
2. 2nd level is used for clinical testing and the screening of large populations.
3. 3rd level devices can achieve maximum level of accuracy and sensitivity to
measure parameters of spontaneous breathing patterns, the vital capacity struc-
ture and maximal voluntary ventilation.
15
Page 36
Table 2.2: Prospective MTR for spirometers [1].
2.3.2 Verification and Calibration
To verify the accuracy of a flow sensor and calibrate it if need be, an optional veri-
fication and calibration routine should be carried out in any spirometer. To calibrate
the spirometer you can either use a manual pump or a motorized one that can be con-
nected to the spirometer. A known volume will then be pumped into the spirometer
with different flow rates, typically between -10 l/s and +10 l/s, which covers most
flow ranges. So long as the flow pumps into spiromter, it will measure the instan-
taneous flow rates and then find the volume using these measured data. The results
can then be compared to the pump parameters to discover if the flow rates have been
accurately measured [6].
16
Page 37
2.3.3 Hygiene
Use of the spirometer can be a source of cross infection. To reduce the risk of infec-
tion the spirometer comes with in-line filters and replaceable sensors. The filters are
a good way to prevent bacterial infection so long as the sensors are fixed; however,
their resistance should be negligible to have no effect on the measurements. The fil-
ters should be replaced after each use. One can also use interchangeable flow sensors
that should be changed after each patient uses the spirometer. The sensors can also be
sterilized for use in future tests or disposable sensors can be used. It should be noted
that low cost sensors can lower the accuracy of the spirometer.
2.4 Volume measure types spirometers
Before evolution and widespread use of electronic devices very basic types of spirom-
eters were being used, in which the volume of lungs were measured directly. Nev-
ertheless,in recent years the sensor paradigm has shifted towards the flow measure
types. The three different types of basic spirometers are discussed in the following
sections.
2.4.1 Water-sealed spirometer
Gas volume can be directly measured by several volume displacement spirometers.
The water-sealed spirometer is the simplest and oldest design made of an inverted
counter weighted bell, cylindrical water reservoir and an upright. As it can be seen
in Figure 2.7, the bell is placed on top of a known volume of gas, which is trapped
inside the chamber.
Inspiring or expiring into the tube results in gas volume changing, and so the bell
moves vertically up or down. A pen is connected to the bell which writes on a rotat-
ing drum called Kymograph. As a result of such movements, a graph is printed on the
paper that covers the Kymograph which can depict the tidal volume. Unfortunately
this device can only work properly if the respiration is performed slowly. Conse-
quently, it would not be able to measure forced expiratory volume. Plus it would
17
Page 38
Figure 2.7: Basic water sealed spirometer [7].
be difficult to design the device to be able to reach the exact same gas volume af-
ter each filing or sinking during the breathing. In addition, expiratory volume may
be overestimated due to the inertia and the bell oscillation, which are other common
problems of the instrument. To lessen these problems a large and light bell is being
used and the bell covers a smaller area of water than that of the water tank [7]. The
air flow enters the spirometer and the result emerges as volume displacement same as
a mechanical integrator. By connecting a linear potentiometer to the pulley part, the
volume changes can be converted to an electrical signal.
2.4.2 Dry-seal spirometer
In the dry-seal spirometer, a thin layer of latex (or other flexible material) is used
to seal the bell to its base. When gas enters the bell, like the water-sealed spirome-
ter, the latex keep the gas and forces the bell to move. The dry-seal spirometers can
be mounted vertically, and instead of a moving bell, a moving piston may be em-
ployed. As with the water-sealed spirometer both electrical and manual recording are
achieved. Also in rolling seal spirometers, which is shown in Figure 2.8, a plastic or
rubber bellows is utilized which contracts and expands as the patient breathes. Water-
18
Page 39
seal displacement spirometers tend to be somewhat more accurate than those that
are dry-sealed that is because of the inherent resistance in the bellows. The dry-seal
spirometers, however, need less maintenance since they do not contain water [41].
Figure 2.8: A rolling seal spirometer [8].
The tests run by water and dry seal spirometers depend a lot on patient cooperation
and technician performance. Moreover, the graphical results need to be calculated
manually which consumes a lot of time.
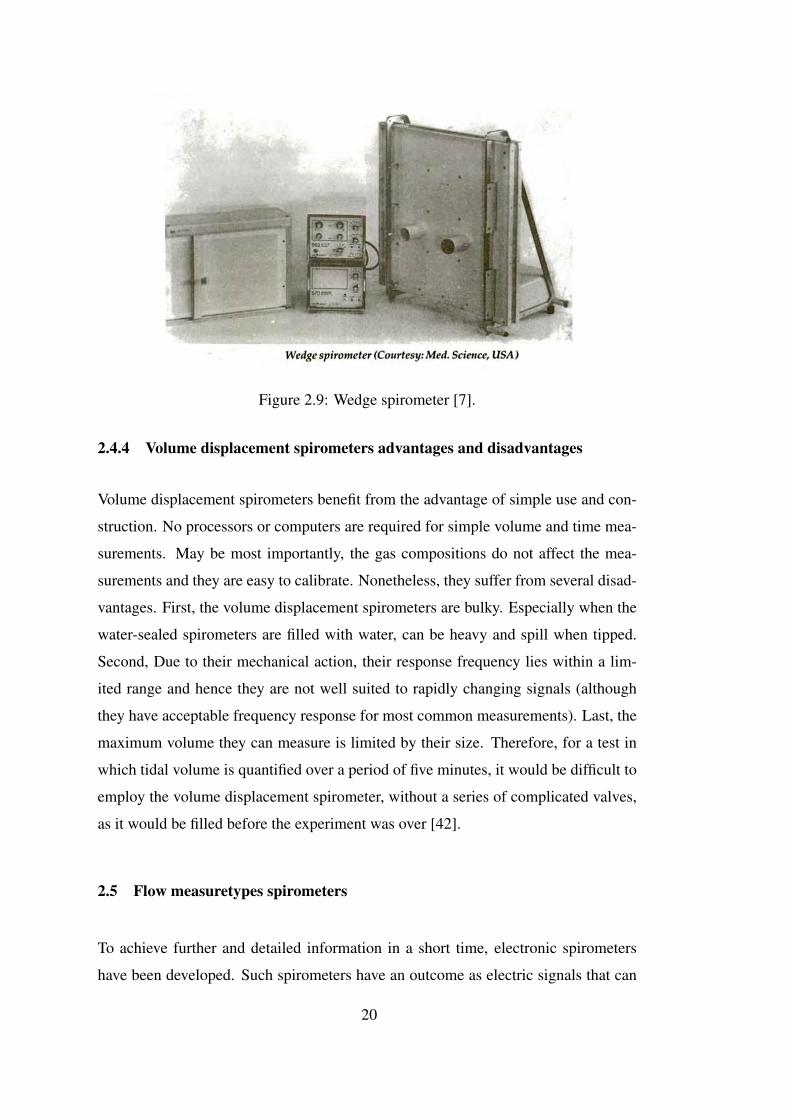
2.4.3 Wedge Spirometer
This is a waterless spirometer built of two parallel large square plates hinged at one
edge, as whown in Figure 2.9. While one of the plates is fixed to the stand, the other
plate can swing along the hinge freely. A vinyl bellows is used to seal airtight the
space between two plates. The bellows is designed to not expand inward or out-
ward while having high flexibility in the plate motion direction. This prevents any
distortion due to pressure difference between the interior and exterior of the wedge.
Breathing into the spirometer changes the volume inside the spirometer which results
in the free pan displacement. Attaching two linear transducers to the plates’ edges
enables converting the displacement into the electric signal. One of transducers’ sig-
nal output is proportional to the volume and flow rate is calculated from output of the
other one. The outputs are sent to an electronic unit including amplifier, power supply
and inbuilt calibration system.
19
Page 40
Figure 2.9: Wedge spirometer [7].
2.4.4 Volume displacement spirometers advantages and disadvantages
Volume displacement spirometers benefit from the advantage of simple use and con-
struction. No processors or computers are required for simple volume and time mea-
surements. May be most importantly, the gas compositions do not affect the mea-
surements and they are easy to calibrate. Nonetheless, they suffer from several disad-
vantages. First, the volume displacement spirometers are bulky. Especially when the
water-sealed spirometers are filled with water, can be heavy and spill when tipped.
Second, Due to their mechanical action, their response frequency lies within a lim-
ited range and hence they are not well suited to rapidly changing signals (although
they have acceptable frequency response for most common measurements). Last, the
maximum volume they can measure is limited by their size. Therefore, for a test in
which tidal volume is quantified over a period of five minutes, it would be difficult to
employ the volume displacement spirometer, without a series of complicated valves,
as it would be filled before the experiment was over [42].
2.5 Flow measuretypes spirometers
To achieve further and detailed information in a short time, electronic spirometers
have been developed. Such spirometers have an outcome as electric signals that can
20
Page 41
compute the numerical results electronically. Consequently, more precise data in
a less period of time would be achieved. An increase in accessibility to low cost
personal computers allows amateurs to get accurate results using a well-designed
software program.
There are various types of spirometers in the market that vary in size and performance.
Their prices range from about $175, which are very simple and measure only some
limited parameters, to $3,500 for the more complicated ones. Advanced spirometers
usually contain a very good monitor or even printers and can perform all spirometry
tests with high accuracy. In the following two spirometers are from different compa-
nies and can be taken as examples of the types available.
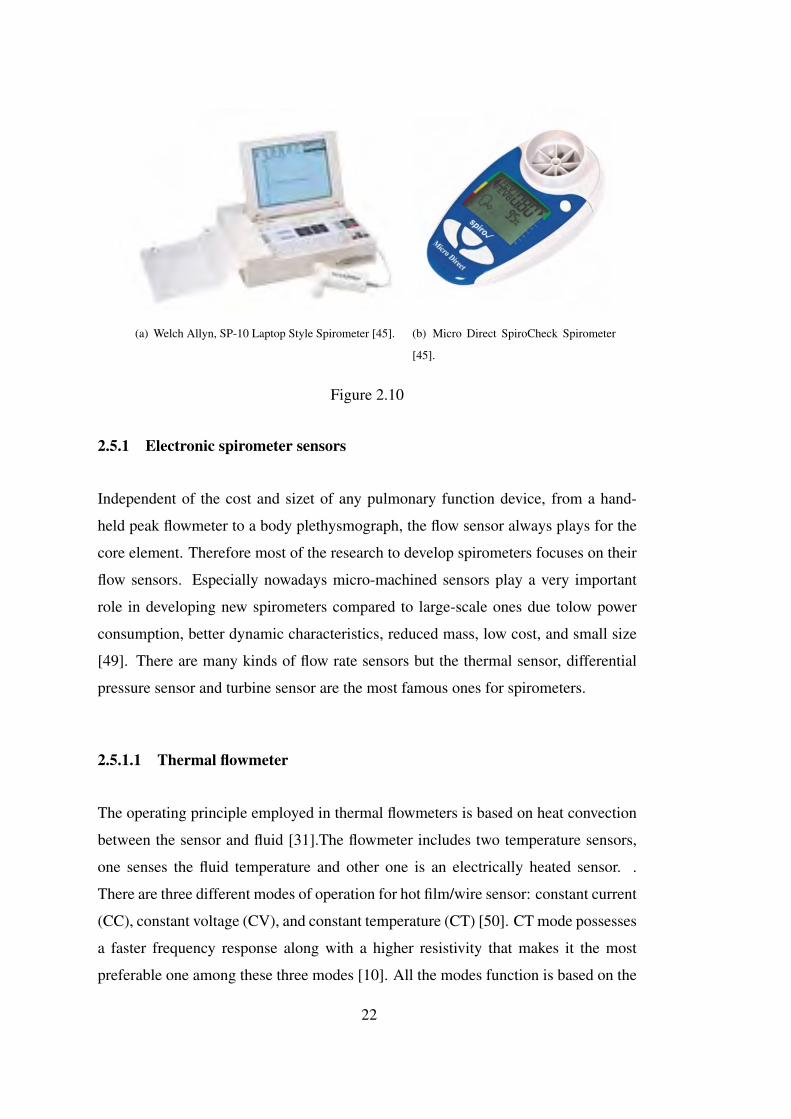
SP-10 laptop style spirometer by the Welch Allyn company is one of the most ex-
pensive spirometers, which has a large screen and printer and can perform using both
disposable and reusable differential pressure sensors (Figure 2.10.a). It possesses a
lightweight and well-packed design but it has been designed for the clinical use in the
office and so it is not portable. It can perform all FVC, SVC, MVV and MV tests and
meets all industry standards [43].
An example f a cheap spirometers, is the Spirocheck spirometer from Micro Direct
Company shown in Figure 2.10.b. This device is very simple, light and compact but
it only measures the FEV1 and FEV1%. This spirometer uses stator/rotor sensor that
needs to be cleaned after each test [44].
In spite of the availibility of spirometers in markets, very few devices have been pur-
chased demonstrated for personal use. Due to the fact that asthma and COPD are
becoming more prevalent mostly in highly-populated developing countries, remote
monitoring can result in better medical services along with much less cost for govern-
ments and patients. Accordingly, significant efforts have been dedicated to develop
low-cost, reliable and portable spirometers [46] insensitive to temperature, humidity
and ambient pressure [47], [48].
21
Page 42
(a) Welch Allyn, SP-10 Laptop Style Spirometer [45]. (b) Micro Direct SpiroCheck Spirometer
[45].
Figure 2.10
2.5.1 Electronic spirometer sensors
Independent of the cost and sizet of any pulmonary function device, from a hand-
held peak flowmeter to a body plethysmograph, the flow sensor always plays for the
core element. Therefore most of the research to develop spirometers focuses on their
flow sensors. Especially nowadays micro-machined sensors play a very important
role in developing new spirometers compared to large-scale ones due tolow power
consumption, better dynamic characteristics, reduced mass, low cost, and small size
[49]. There are many kinds of flow rate sensors but the thermal sensor, differential
pressure sensor and turbine sensor are the most famous ones for spirometers.
2.5.1.1 Thermal flowmeter
The operating principle employed in thermal flowmeters is based on heat convection
between the sensor and fluid [31].The flowmeter includes two temperature sensors,
one senses the fluid temperature and other one is an electrically heated sensor. .
There are three different modes of operation for hot film/wire sensor: constant current
(CC), constant voltage (CV), and constant temperature (CT) [50]. CT mode possesses
a faster frequency response along with a higher resistivity that makes it the most
preferable one among these three modes [10]. All the modes function is based on the
22
Page 43
cooling effect of the flow stream on heated hot film sensor.The faster gas flows, the
more strike between the sensor and gas molecules occur, and so the higher energy
transfers from hot wire sensor to the fluid.Consequently, we can easily measure the
flow rate by measuring the amount of voltage that is used to heat up the hot film [32].
However, it should be considered that not only the flow rate but also the gas density
can affect the result as well. In the circuit, anemometer is implemented in one arm of
the Wheatstone bridge with a negative feedback as shown in Figure 2.11 [32].
Figure 2.11: Diagram of a thermal flowmeter components and its simplified circuit.
[7].
Although hot film and hot wire sensors work similarly, each has its own merits and
flaws. On the one hand, a hot film sensor, with a larger surface area, results in more
strike of gas molecules with the film that enables an easier heat transfer, and hence
results in a higher output voltage. In addition, hot film provides better stability and
less sensitivity to the micro particles effect on its calibration curve. On the other hand,
hot film sensor responses in lower frequency and need more energy supply. On the
overall, the hot film advantages overcome its cost in case of spirometers and that is
why hot film anemometers are recommended as spirometer sensors [51].
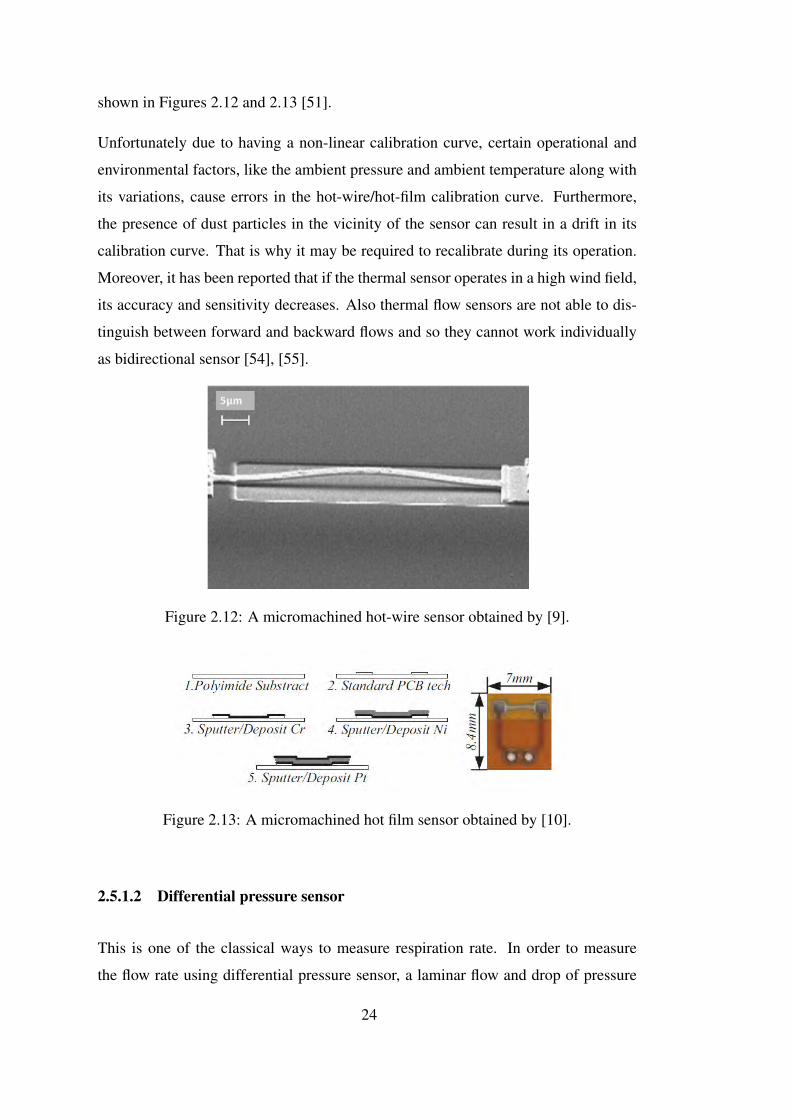
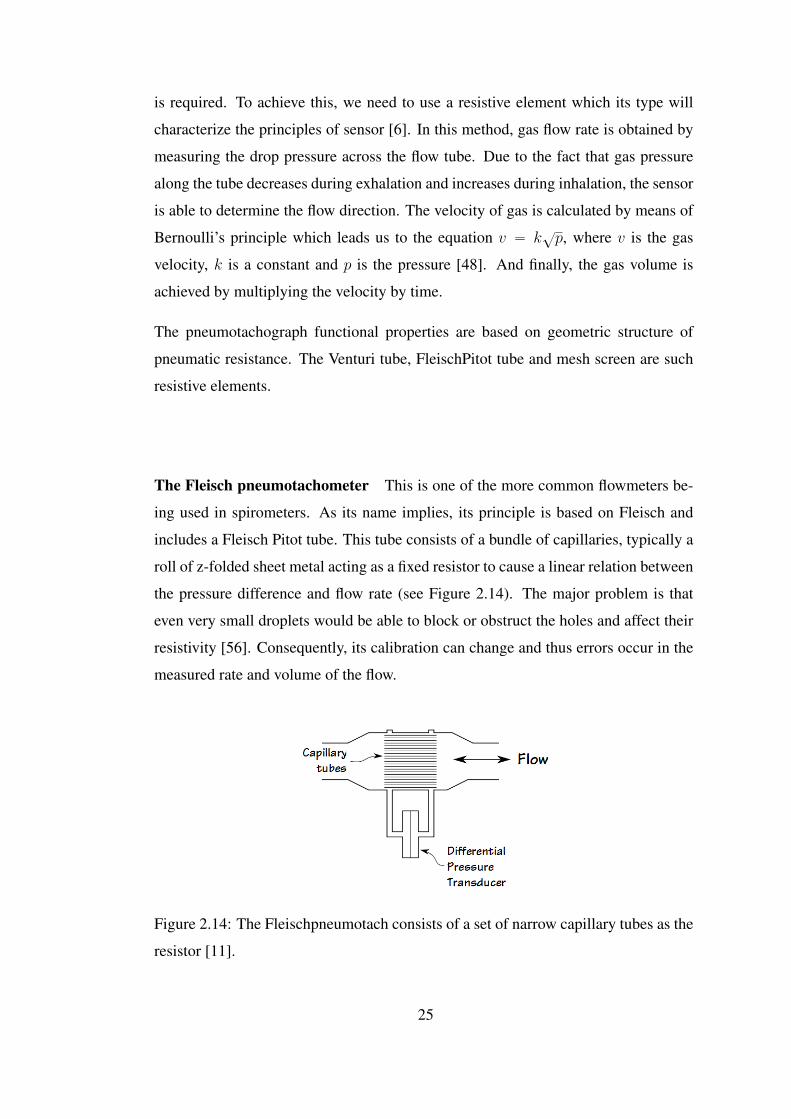
The micromachined hot-wire and hot film sensors have a wide range of use in spirom-
eters, which is due to possessing high accuracy in low flow rates, broad measurement
range, fast frequency response, good mechanical properties, low pressure drop and
small probe size [52], [53]. Both micromachined hot-wire and hot film sensors are
23
Page 44
shown in Figures 2.12 and 2.13 [51].
Unfortunately due to having a non-linear calibration curve, certain operational and
environmental factors, like the ambient pressure and ambient temperature along with
its variations, cause errors in the hot-wire/hot-film calibration curve. Furthermore,
the presence of dust particles in the vicinity of the sensor can result in a drift in its
calibration curve. That is why it may be required to recalibrate during its operation.
Moreover, it has been reported that if the thermal sensor operates in a high wind field,
its accuracy and sensitivity decreases. Also thermal flow sensors are not able to dis-
tinguish between forward and backward flows and so they cannot work individually
as bidirectional sensor [54], [55].
Figure 2.12: A micromachined hot-wire sensor obtained by [9].
Figure 2.13: A micromachined hot film sensor obtained by [10].
2.5.1.2 Differential pressure sensor
This is one of the classical ways to measure respiration rate. In order to measure
the flow rate using differential pressure sensor, a laminar flow and drop of pressure
24
Page 45
is required. To achieve this, we need to use a resistive element which its type will
characterize the principles of sensor [6]. In this method, gas flow rate is obtained by
measuring the drop pressure across the flow tube. Due to the fact that gas pressure
along the tube decreases during exhalation and increases during inhalation, the sensor
is able to determine the flow direction. The velocity of gas is calculated by means of
Bernoulli’s principle which leads us to the equation v “ k?p, where v is the gas
velocity, k is a constant and p is the pressure [48]. And finally, the gas volume is
achieved by multiplying the velocity by time.
The pneumotachograph functional properties are based on geometric structure of
pneumatic resistance. The Venturi tube, FleischPitot tube and mesh screen are such
resistive elements.
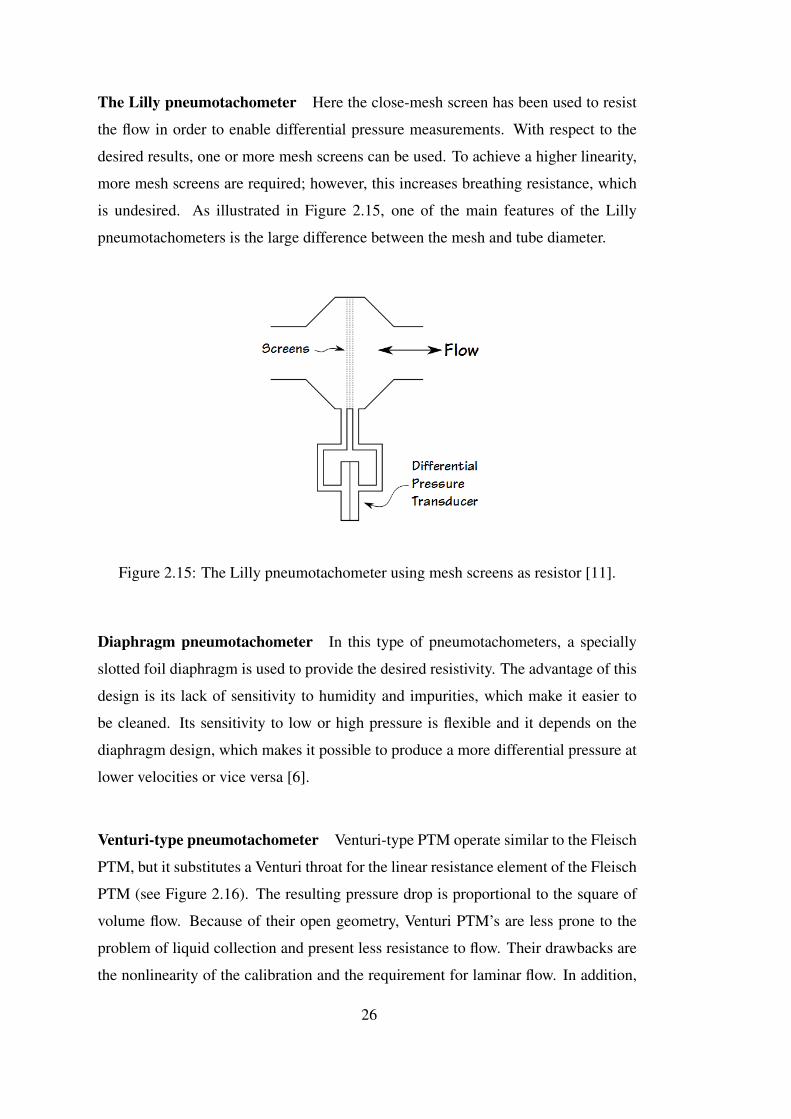
The Fleisch pneumotachometer This is one of the more common flowmeters be-
ing used in spirometers. As its name implies, its principle is based on Fleisch and
includes a Fleisch Pitot tube. This tube consists of a bundle of capillaries, typically a
roll of z-folded sheet metal acting as a fixed resistor to cause a linear relation between
the pressure difference and flow rate (see Figure 2.14). The major problem is that
even very small droplets would be able to block or obstruct the holes and affect their
resistivity [56]. Consequently, its calibration can change and thus errors occur in the
measured rate and volume of the flow.
Figure 2.14: The Fleischpneumotach consists of a set of narrow capillary tubes as the
resistor [11].
25
Page 46
The Lilly pneumotachometer Here the close-mesh screen has been used to resist
the flow in order to enable differential pressure measurements. With respect to the
desired results, one or more mesh screens can be used. To achieve a higher linearity,
more mesh screens are required; however, this increases breathing resistance, which
is undesired. As illustrated in Figure 2.15, one of the main features of the Lilly
pneumotachometers is the large difference between the mesh and tube diameter.
Figure 2.15: The Lilly pneumotachometer using mesh screens as resistor [11].
Diaphragm pneumotachometer In this type of pneumotachometers, a specially
slotted foil diaphragm is used to provide the desired resistivity. The advantage of this
design is its lack of sensitivity to humidity and impurities, which make it easier to
be cleaned. Its sensitivity to low or high pressure is flexible and it depends on the
diaphragm design, which makes it possible to produce a more differential pressure at
lower velocities or vice versa [6].
Venturi-type pneumotachometer Venturi-type PTM operate similar to the Fleisch
PTM, but it substitutes a Venturi throat for the linear resistance element of the Fleisch
PTM (see Figure 2.16). The resulting pressure drop is proportional to the square of
volume flow. Because of their open geometry, Venturi PTM’s are less prone to the
problem of liquid collection and present less resistance to flow. Their drawbacks are
the nonlinearity of the calibration and the requirement for laminar flow. In addition,
26
Page 47
the flow head is asymmetric so we cannot measure bidirectional flow [17].
Figure 2.16: The diagram of a venturi type pneumotachometer [12].
As general disadvantages of differential manometers, we can refer to their sensitivity
to humidity, temperature and atmospheric pressure which may result in a frequent
need of recalibration [57]. To boost its reliability, in the most commercial pneumota-
chographs, a thermostat is used to minimize the humidity and maintain the sensor in
a constant temperature [7]. Furthermore, qualification tests, reliability and operating
characteristics of the pressure sensors are mostly based on the use of dry air as the
pressure media [10]. As mentioned before, the screens pores and capillary tubes that
are used in this kind of spirometers can easily be blocked by solid or liquid particles
in the patient’s breath. Consequently, the effective cross-sectional area of the flow
element is reduced and the mechanical resistance of the device changes. To mitigate
these effects, some tube designs own a bend between mouth and the sensor to retain
the sputum droplets.
To overcome problems of accuracy in high and low pressure, which prevents the
flowmeter from being sensitive in all the required ranges, some researchers have em-
ployed several sensors in one device. The following examples are such combinations.
[13] have coupled two differential pressure sensors into the same device, as illustrated
in Figure 2.17. In their research they take different size diaphragms, made from
piezoresistive pressure sensor, are implanted. The larger one will allow sensitivity to
low pressure gas flow while the smaller one would have a better sensitivity in high
pressure flow [13].
Additional research is performed by Que et al. which is a combination of a micro
hot film sensor and a micro differential pressure sensor to capture the low and high
airspeed respectively. Both sensors transfer their signals in digital form to a micro-
27
Page 48
Figure 2.17: Implementation of two different size of piezoresistive pressure sensor to
manage the all pressure range [13].
processor and so a wide range of measurement can be detected [10].
2.5.1.3 Turbine flowmeter
Conventional turbine flowmeters In conventional turbine flowmeters, the mechan-
ical energy of the breath rotates the blades of a fixed turbine. Since in this method
the fluid energy is converted to the rotational energy, the gas flow rate is obtained by
measuring the number of rotations per unit of time. As can be seen in Figure 2.18,
in commercial turbine flowmeters, a light-emitting diode (LED) and a photodiode
sensor is being used to detect the vane velocity by converting its rotational speed into
electrical impulses. By means of a microprocessor in control unit, the gas volume can
be calculated from the gas flow rate, which is proportional to the vane speed. The ad-
vantages of this system are its insensitivity to gas composition, water vapor, turbulent
flow and gas temperature. In addition, the relation of gas flow rate and turbine speed
is perfectly linear. Also the sensor can be easily taken out and cleaned. A disadvan-
tage of a turbine flowmeter is its inertia [58], which can be minimized by employing
very lightweight vanes, a deflector, and lowering the bearing resistance [6], [35].
Static turbine In this kind of turbine, unlike to the conventional one, the turbine
wheelsdo not rotate. In this case, the flow of the gas generates a torque on the tur-
bine blades, which is measured by a torque sensor. A micromachinedpiezoresistive
cantilever beam is employed to act as the torque sensor. As illustrated in Figure 2.19,
the torque sensor includes stiffness reduction beams, in which two polysillicon strain
gages are embedded on both sides of the beams. In case of flow, the starin gages
28
Page 49
Figure 2.18: Illustraion of a conventional turbine flowmeter [14].
experience tension and compression proportional to the flow rate and so the torque is
measured. Due to the perfectly symmetrical structure, the sensor is able to sense the
axis of the flow.Since it is not rotating, the turbine does not go through any bearing
or wear friction. However, as the sensor is made of piezoresistive (especially in 1016
dopant), it would be sensitive to temperature variables [15].
(a) (b)
Figure 2.19: (a)The static turbine includes a turbine wheel mounted on a torque-
sensing device. (b) The torque-sensing element composing of three parts: the sup-
porting part, the mounting part and two stiffness reduction beams [15].
2.5.1.4 Ultrasound (Transit Time) Flowmeter
Ultrasound sensors consist of twin transducers placed in the flow tube but on opposite
sides and transmit ultrasonic wave toward each other. The diagram of the ultrasonic
sensors is depicted in Figure 2.20. Mostly piezoelectric types of transducers are used
29
Page 50
and they possess the capability of both sending and receiving the ultrasound signals.
The pulse transit time between transducers are measured. In the case that fluid passes
through the sensor, transit time of the pulse in the direction of the gas flow decreases
while the pulse transit time in the opposite direction increases. Since the transfer time
variations are proportional to the fluid velocity, by some calculations the flow rate can
be obtained [59].
To reach a better efficiency, the mounted piezoelectric transducers are operated at
their resonant frequency. 40 to 200 kHz range of frequency is known the best for gas
flowmeters since using higher frequencies leads to the higher absorption losses in gas
whilst the frequencies less than 40 kHz are audible and so annoying [7].
Figure 2.20: The diagram of flow tube and the position of ultrasonic transducers used
in transit-time based ultrasonic spirogram [7].
The gas density, viscosity, and temperature do not affect the results in ultrasonic
spirometers. To use the ultrasound sensors as spirometer sensors, the tube size must
be at least 15 mm in radius. Hence, the total transfer delays are mostly measured
in microseconds and so the accuracy of a directly single delay measurement must be
in nanoseconds. Such small time differences make the measurements difficult using
ultrasonic technique [7].
The transducers used in such flowmeters are disc-shaped flat ones that are placed at
an angle on both sides of the tube walls inside the recesses. This arrangement not
only protects the transducers from fluid contaminations but also avoids flow disrup-
tion. Although for liquid fluids some transparent windows are being used to enhance
impedance matching to the media and protect the transducers, to obtain good acous-
30
Page 51
tic transmission in respiratory gas flows the medium must be in close contact with
the transducer. That is why for spirometer use the recess is kept open and hence
undesirable turbulence and moisture collection can occur.
The geometry of open tubular wells can lead to fluid accumulation, which interferes
with or obliterates coherent ultrasonic transmission. In addition to the unwanted dead
space and condensation issue, the zero flow base line signals demonstrates drift and
is discovered to show oscillations with temperature variations. The situation deteri-
orates when the transducers are applied to patients on a ventilator because of fluid
accumulation which can cause highly inaccurate signals. In 1975 some modifications
to the ultrasonic pneumotachometer construction were made by Blumenfeld et al that
led to the design of coaxial version shown in Figure 2.21 [16]. In their design, the
crystals are mounted midstream in the line of flow, with their transmission axis on
the center line of the tubular housing. The principle of measurement of flow is that
of measuring transit times, which is a function of the linear gas velocity and hence of
flow.
Figure 2.21: The Coaxial ultrasound pneumotachometer designed by [16].
Unfortunately this design is reported to have several problems as well. For instance,
large amount of artefacts can be created in case of the combination of the reflected and
primary ultrasonic transmission. Similarly, there could be alterations in the effective
joint path length of flow and ultrasound transmission as a function of gas velocity
and composition.Moreover, the temperature, humidity and composition of the gas
can also affect the ultrasound velocity, which results in variation of estimation of flow
velocity.
Plaut and Webster designed an ultrasonic pneumotachometer in 1980, shown in Fig-
ure 2.22, that unlike coaxial transducer and cross-the-stream configurations, not only
the flow disruption, reduced sensitivity, fluid collection and dead space issues are
31
Page 52
solved but also the favorable features of open tube geometry are preserved. [17]. They
used cylindrical shell transducers with their inner surfaces flushed with the walls of
the flow tube to prevent flow disruption and fluid accumulation. The ultrasound trans-
mission axis is parallel to that of flow causing a boost in device sensitivity.
Figure 2.22: The configuration of ultrasound pneumotachometer showing the cylin-
drical Shell transducer and the airway obtained by Plaut and Webster [17].
It is claimed that even in the presence of little obstruction to breathing, qualitative pa-
rameters associated with respiration can be measured (It can also measure qualitative
parameters associated with respiration while presenting little obstruction to breath-
ing). However, they have also reported that highly accurate data would be achieved
if the temperature and composition of the gas are varying within a narrow range.
They caution that a poor understanding of the nature of the ultrasonic field and how
it interacts with moving gas remains the most troublesome problem for the success-
ful development of ultrasonic pneumotachometers. The other problems are the poor
acoustic efficiency of ultrasonic transmission through gases, the wide variation in
gas composition, temperature and humidity and the need for high accuracy and wide
dynamic range.
2.5.1.5 Vortex flowmeter
In this kind of flowmeters, a resistance, which is called bluff body, is placed in the
middle of the path of the flow to create vortices.One type of bluff body and resulted
vortices can be seen in Figure 2.23. The vortices happen at a defined frequency that
is proportional to the velocity of the fluid. By measuring the number of vortices via
piezoelectric elements, optodes or thermistors, we would be able to calculate the flow
rate. However, it is not able to sense the direction of the gas and so is a unidirectional
sensor [6].
32
Page 53
Figure 2.23: The diagram of a vortex flow meter [18].
Owing to the drawbacks of current spirometers, further research is focused on im-
proving spirometer sensors that some of these sensors are discussed in the following
sections.
2.5.1.6 Amorphous Ferromagnetic Materials based sensor
This sensor is introduced by Nakesch et al. and contains two amorphous FeNi-based
ribbon glued to a plastic film that works based on magnetostriction principle. The
sensor components are illustrated in Figure 2.24. The airflow makes a compression
or tension in FeNi ribbon proportional to the flow velocity and finally results in output
voltage variation on the coils. This is due to changes in amount of permeability (µ)
and coupling factor (k). For its disadvantages we can refer to too complex nonlinear
relation between the flow rate and the output voltage in addition to suffering from
problematic mechanical adjustment. The sensor is so simple and affordable and can
be changed easily while they need to be calibrated after they are changed. Moreover,
good solidity and hygienic properties have been reported for these spirometer sensors
[19].
2.5.1.7 Cantilever based sensor
In 2010, Wei et al introduced a new spirometer sensor. As it can be clearly under-
stood from its name, it is made from a number of cantilever beams, shown in Figure
2.25.a, which are deformed under pressure of the gas flow (see Figure 2.25.b). The
deformation results in variation in the sensor resistance and hence the gas velocity
can be detected. The sensor is unidirectional and the relation between the flow rate
33
Page 54
Figure 2.24: The Amorphous Ferromagnetic Materials based spirometer sensor ob-
tained by [19].
and the output voltage is linear. However, the effects of temperature, humidity and
density of flow are not discussed in this paper [20].
2.5.1.8 Gas Flow Sensor Based on Sound Generated by Turbulence
This sensor was designed using the principle that locating a tiny obstacle in the flow
direction makes turbulence [21]. The turbulences results in pressure variations con-
taining a wide range of frequency components. Since the ultrasonic and audio fre-
quencies are included as well, the idea of detecting the pressure variation using a
microphone or an ultrasound transducer emerged. As can be seen in Figure 2.26, a T-
shaped tube is used for this sensor and the capacitor type microphone- setting besides
the obstacle- receives the audio frequencies which are made by obstacle turbulence.
The output of the microphone, AC signal, is amplified and passed through a narrow-
band filter. After the signal has passed through a full-wave rectifier and buffer, the
average voltage is read by an integrator. Gas flow rate value can be derived from the
average voltage after doing linearization and further analysis by means of a computer
or microprocessor.
The advantages of this sensor are lack of moving parts, possibility of blocking by ex-
isting water drops existing in the expiratory flow, and temperature independency. This
sensor, nevertheless, is unidirectional with difficult mathematical modeling. Many
parameters, such as tube diameter, size of the obstacle, smoothness of the surface
around the microphone, and quality of the microphone affect the turbulence should
be considered carefully for calibration. In addition, although the sensor is covered
34
Page 55
(a)
(b)
Figure 2.25: (a) Physical structure of proposed sensor with exaggerated thickness and
(b) Deformation of cantilever [20].
by foam to decrease ambient sounds and vibration effects, other noises can result in
error and so the test should be performed in a quiet place.
Figure 2.26: Schematic diagram of the flow sensor based on sound [21].
35
Page 56
2.5.1.9 Lung Capacity Estimation through Acoustic Signal of Breath
Further research is done to find the lung capacity by means of microphone and breath-
ing sound [60], [61], [62]. In these studies the acoustic signal of respiration is
recorded by a microphone. The inspiration and expiration are differentiated through
silence detection and so the length of each segment can be measured. The energy
of the signal, on the other hand, is being used to detect the flow rate inasmuch as
it is a consequence of power and depth of the breath [63]. Figure 2.27 depicts the
procedure.
(a) (b)
Figure 2.27: (a) Recording a breathing signal for a subject and (b) Breath cycles
showing different phases[63].
The difficulties of this method are its heavy reliance on the voice activity detection
algorithm, type/sensitivity of the microphone, and distance from the microphone.
2.5.1.10 Self-power peak expiratory flowmeter
In 2013, Wang et al introduced a peak flow meter based on electromagnetic induction
which is shown in Figure 2.28 [22]. The device is made of a small turbo generator
through which the air flows and a small amount of electric power is generated. The
signal frequency is proportional to the turbine speed. And the speed of turbine is
directly related to the air velocity. So using an AVR microcontroller which detects
the generator frequency enables measuring the flow rate. The significant feature of
the device is that the produced electrical signal can be used to repower the device
36
Page 57
batteries simultaneously.
(a) (b)
Figure 2.28: The diagram of the self-power peak expiratory flowmeter. (a) structure
and (b) final version of the device [22].
37
Page 59
CHAPTER 3
THEORY AND DESIGN
This chapter begins with basic design parameters of the first turbine-based MEMS
spirometer sensor. In Section 3.1, a general description of theory of operation and
governing physics is provided. These concepts are applied to a MEMS frame to de-
sign the general device structure. The details of the design of the stator, magnets,
turbine blades, and microballs are described in sections 3.2, 3.3, 3.4, and 3.5, respec-
tively.
3.1 Principle of Operation
The spirometer sensor described in this thesis is a turbine based MEMS sensor com-
posed of three main components: (i) a turbine with integrated permanent magnets, (ii)
two stators with micro-fabricated planar coils for converting turbine rotation into in-
duced voltage through electromagnetic induction, and (iii) ball bearings (Figure 3.1).
This would be the first turbine based MEMS spirometer sensor acting as a MEMS-
generator simultaneously.
The turbine is designed as tangential, which means that the blades sit on the sides.
This design makes the optimum use of the gas momentum since the flow hits only
the turbine blades and so enables the rotation in low flow rates. Besides, it permits
employing double-layer permanent magnets which are placed inside the trenches on
the bottom and top faces of the rotor. Such design enables electro-magnetic trans-
duction using two stators placed below and over the rotor, facing the two permanent
magnets layers. This permits exploitation of magnetic flux lines on both rotor sides
39
Page 60
Figure 3.1: Exploded view of the device containing the stators with micro-fabricated
coils, the rotor with embedded ring-shaped magnets, microballs, and microball
trenches.
at once, and therefore, leads to higher volumetric power density and enhanced per-
formance. Furthermore, in comparison with single-layer magnets with two stators in
[64], double-layer design does not need to be secured with heat treatment or com-
pliant rotor substrates, and provides a robust scheme for magnet integration. The
magnets are set to be ring-shaped with multiple magnetic poles pairs to supply axial
flux to the stator.
In the presence of air flow the turbine rotates and so do the magnets. This rotation
around the rotor axis results in a magnetic field along the rotation direction (see Fig-
ure 3.2). While the rotor is turning, the stator is fixed, and due to the relative velocity
between them a time varying magnetic field will be created, which induces a time
varying electric field in the windings. The windings are designed gear-shaped com-
posed of radial and arc-shaped segments.
Due to the fact that the direction of the magnetic flux and arcs are parallel, the voltage
40
Page 61
Figure 3.2: The illustration of the two layer magnets n top of the stator coils. When
the turbine rotates, a time varying magnetic field (B) along the rotation direction will
be created.
is only induced on radial parts. Regarding Faraday’s law the generated voltage is
calculated by means of the given equation:
V “ ´dφ
dt(3.1)
where φ is the total magnetic flux crossing the coil and can be obtained as follows:
φ “
ż
B.ds (3.2)
where B is the effective magnetic flux density on the coils. Furthermore, since induc-
tion is due to the moving magnetic field, it can be written as:
V “
ż
pv ˆBq.dl (3.3)
This equation is referred to as motional electromotive force or flux cutting electro-
41
Page 62
motive force, where v is the relative velocity of the magnetic field with respect to the
coils and L is the length of radial lines covered by magnets.
As mentioned before, the magnets are arranged in an alternate polarity. Neglecting the
leakage flux, the magnetic flux density along the rotor rotation can be considered as a
square wave. Consequently, the induced voltage on radial lines would be a triangular
waveform (Figure 3.3).
Figure 3.3: (a)Magnetic flux density around the rotor surface (b)Variation of magnetic
flux acting on one radial line.
where S is one magnet area, P is the number of poles, and rpm is the turbine angular
velocity in rotations per minute. Since there will be P2
triangles in every rotation,
the period would be 120pPˆrpmq
. As a result, eq. 3.1 for one loop in one turn of a pole
becomes
V1 “ 2ˆ S ˆBg ˆ P ˆrpm
60(3.4)
The magnet area pSq can be written as πpr22´r21q
Pthat r2 and r1 are the outer and inner
radii of the magnets. Considering the fact that there are pPˆNq2
loops in a coil (N
determines number of turns in a coil), the pick voltage of the coils would be equal to:
42
Page 63
V “PNBπpr22 ´ r
21q ˆ rpm
60(3.5)
The same formula can be derived from eq. 3.3. Assuming the turbine rotates with ωr
angular velocity, the generated voltage on any radial conductor under one pole would
be
V1 “
ż
pv ˆBq.dl “
ż r2
r1
pωrr ˆBq.dr “1
2Bωrpr
22 ´ r
21q (3.6)
Replacing the angular velocity with revolution per minute p rads“ 60
2πrpmq, 3.6 be-
comes:
V1 “Bπpr22 ´ r
21q ˆ rpm
60(3.7)
All these radii are connected to each other in series and as a result, the total voltage
of the coil with N turns and P poles will be obtained as eq. 3.4.
The radial lines are designed as the radii of a circle and therefore are arranged phys-
ically in different angles. This angular difference results in phase difference of gen-
erated voltages on radial parts which lead to the voltage with a gradually increasing
profile rather than a square wave, as shown in Figure 3.4, the total voltage will be
appeared as a sine wave. The peak voltage of the sine wave will be as given in eq.
3.5.
Both the amplitude and frequency are directly related to the velocity of the blades;
nonetheless, it is more common to find the flow rate using signal frequency using:
f “ KQ (3.8)
where f , Q and k are output frequency, volumetric flow rate, and K factor of the tur-
bine element, respectively. Finally, the total volume is calculated as the time-integral
of volumetric flow rate over a period of time from t “ 0 to t “ T :
V “
ż T
0
Qdt (3.9)
43
Page 64
Figure 3.4: Generated voltage waveform of an entire coil under the assumption of
perfect magnetization of magnets.
As sensor would be able to convert the mechanical energy into electrical energy, and
the delivered power can be calculated as:
S “V 2rms
ZL ` Zcoilˆ ZL (3.10)
where ZL is the electrical load connected to the coils with Zcoil impedance and rms
value of induced voltage Vrms. Due to the Thevenin’s power transfer theory, at ZL “
Zcoil the maximum power transfer on the load occurs which equals to |V |2
8Rcoil.
3.2 Stator design
The stators are made of a silicon substrate with copper micro coils on the top. And in
middle of the coils a circular trench is etched to contain the microballs. Silicon is cho-
sen as the substrate since many surface and bulk silicon micromachining techniques
are developed. In addition, Silicon possesses appropriate material properties such as
good stability. The micro coils are made of copper which is one of the most common
metals being used in MEMS. Furthermore, copper has a low electrical resistivity and
hence higher power and voltage can be obtained.
A variety of microcoil shapes have been already developed for in-plain micro-generators.
Simple fabrication is one of the most important factors that has been considered in our
design and that is why the three phase copper coil pattern [23], [65], [66], as shown
44
Page 65
in Figure 3.5, is not chosen for our device.
Figure 3.5: Renderings of the three phase stator winding patterns for (a) 2-turn/pole,
and (b) 4-turn/pole designs in [23].
The conventional coil patterns have a more simple design that have been used in
previous work [67]. Three different shapes of conventional designs (circle-shaped,
square-shaped, and sector-shaped) is studied by [24] and the sector-shaped coil is
reported as the most efficient one (Figure 3.6).
Figure 3.6: Schematic illustration of three kinds of conventional designed micro-coils
[24].
The gear-shaped designs are the next generation of microcoils, which are very similar
45
Page 66
to the conventional ones. However, due to having less electrical connections the gear-
shaped designs benefits from simpler design and easier fabrication [25] (see Figure
3.7).
Figure 3.7: The diagram of 3-turn coil designs (a) gear-shaped (b) traditional design
[25].
R. Cordero et al have also introduced three different end-turn geometries for gear-
shaped coils: sector-shapes, semicircular, and triangular end turns. Patterns of these
coils are illustrated in Figure 3.8.
Figure 3.8: Illustration of end turn patterns in gear-shaped coils (a) sector shape (b)
semicircular (c) triangular designs [25].
In our study, among the three different end-turn geometries shown in Figure 3.8,
sector-shaped is selected due to possessing a more well set structure. Consequently,
the coils are designed as gear-sector-shaped, which is one of the standard coil designs
in MEMS and has the advantage of precisely controlled geometry. Due to its planar
structure, which is adjustable with MEMS principles, it would have an easier fabrica-
tion especially in case of electroplating. As seen in Figure 3.7 two electrical pads are
46
Page 67
connected to the two ends of the coil to extract the electrical signals.
Figure 3.9: The three different segments of the schematic coil.
As shown schematically in Figure 3.9, the microcoils contain radial and arc-shaped
parts. When the rotor is rotating, the induced magnetic flux crossing the radial seg-
ments will induce electromotive force (EMF) voltages. However, the directions of the
arc-shaped segments are parallel to the flux, which will not produce any voltage. The
radii are connected to each other by means of arcs and hence the induced voltages are
all connected in series that leads to a greater total voltage.
As stated in the eq. 3.5, the induced voltage is proportional to the number of pole-
pairs (p), wire turns (N ), turbine velocity, the remanent magnetization (βz), and radial
lines longitude.
Increasing the number of P and N results in higher voltage amplitude. Nonetheless,
incrementing the number of poles also leads to magnetic leakage growth and so de-
cline in the magnetic flux density. Hence, an optimum amount should be found which
will be discussed in magnets section.
Moreover, to achieve higher number of turns in coils, the longer and narrower wires
should be used which consequently increases the electric resistivity in coils. Due
to the electric power formula (3.10), by increasing the number of turns in a limited
space, the coil impedance goes up as well. Therefor the greater N would have no
47
Page 68
effect on the output power. However, it is best to maximize this product within the
fabrication limitations in order to generate power at high voltage and a low current.
This will result in less power loss (due to diode voltage drops and I2R) in power
conversion and/or extraction electronics.
On the other hand, fabrication limits do not permit to design too narrow wires. Con-
sidering the limits, the narrowest part and the smallest gap between the wires are both
designed to be 10µm which belongs to the inner connections. The outer connec-
tions are designed as 15µm-thick wires. These considerations lead to have 50-turn
coil. Nevertheless, 25-turn coils are also designed with twice wire width to lessen the
fabrication risks.
Regarding eq. 3.5, longer radial lines pr22 ´ r21q, the yield greater voltage; nonethe-
less, fabrication limits would not allow us to increase the radii longitude a lot. Plus,
lengthening the radii would raise the coil resistivity but in the lower proportion than
that of the voltage. At large, concerning the portability of the device, r2 is limited
due to the device size while r1 is limited mostly because of microballs’ trench radius.
Thus, r1 and r2 are the range of 2.95-3.95 mm and 7.3-8.8 mm, respectively.
3.3 Coil design
To model the coil circuit and calculate the generated voltage on the stator coils, the
corresponding coil resistance and inductance should be taken into account.
3.3.1 Coil resistance
As seen in the Figure 3.9, there are three different segments that should be considered
separately when it comes to resistivity calculations. Not only the resistance of radial
parts and inner and outer connections need to be calculated separately but also their
lengths vary in each turn. Consequently, the resistance of each section should be
calculated for each turn distinctively.
Whileşr2r1
ρdr
2πtr θ360
is used to find the resistance of the radial parts of the coil, the resis-
48
Page 69
tance of the inner and outer connections can be found by the formula 2πρr θ360
tpr2´r1qwhere
ρ, θ, t, l, r1, r2 are the resistivity, conductor angle, thickness, length, inner and outer
radii respectively. Therefore the resistance of one loop will be:
Rloop “p
2ˆ
´
p2ˆRradialq `Rinnerarc `Routerarc
¯
(3.11)
That is equal to,
Rloop “p
2ˆ
´
p2ˆ
ż r2
r1
ρdr
2πtr θ360
q `2πrρ θ
360
tprin2 ´ rin1q`
2πrρ θ360
tprout2 ´ rout1q
¯
(3.12)
Adding all loops resistivites will be resulted in the total resistance of the coil. How-
ever, to simplify the calculations while having a good estimation of the coils resistiv-
ity, we can obtain the mean length of each segment to avoid repeating the calculations
for each turn.
While precise calculation is very time-consuming, using mean length for arcs and
radii would lead to an accurate enough estimation of coil resistances. As mentioned,
the inner and outer connection radii vary from 2.95 to 3.95 and 7.3 to 8.8 mm re-
spectively. Therefore, we can consider 3.45 and 8.05 mm as mean for inner and outer
radii. The copper wire thickness is designed to be 20µm. Consequently, each segment
resistivity would be:
Rinnerarc “2π ˆ 3.45ˆ 10´3 ˆ 1.68ˆ 10´8 ˆ 30
360
20ˆ 10´6 ˆ 20ˆ 10´6“ 45.5Ω (3.13)
Routerarc “2π ˆ 8.05ˆ 10´3 ˆ 1.68ˆ 10´8 ˆ 30
360
20ˆ 10´6 ˆ 20ˆ 10´6“ 53.1Ω (3.14)
Rradial “1.68ˆ 10´8
2π ˆ 20ˆ 10´6 ˆ 13360
ˆ pln 8.05´ ln 3.45q “ 73.4Ω (3.15)
Due to the fact that the 50-turn coil contains 600 radial segments and 300 inner and
outer connection segments, the total coil resistivity will be 45.5Ω` 53.1Ω` 73.4Ω “
172Ω. And the 25-turn coils resistance will be 43Ω.
49
Page 70
3.3.2 Coil inductance
The inductance of the coils can be found by calculating the inductance of each loop
of the coil and multiplying it by total number of loops using following equation:
Lloop “φ
I
where φ is amount of the flux passing through the loop generated by the coil current.
However, due to complex geometry of the loops, which have different size in each turn
of the coil, it is difficult to calculate the coils inductance. In addition, to the inductance
of each loop, there are mutual inductances between different loops. Therefore, since
both the calculation and the simulation of this effect is computationally complex, the
total inductance will be determined experimentally.
3.3.3 Coil capacitance
In order to calculate the highest possible capacitance of the coil, here we have as-
sumed that all coil lines are in parallel, which yields;
C “NεA
d« 2.5fF
where N “ 50, A “ 20ˆ 10´6ˆ 300ˆ 10´9, and d “ 30µm. Considering 10kHz as
the maximum frequency will be obtained with the device, the corresponding parallel
impedance will be;
Z “1
2πfC« 6.4ˆ 109
,
As can be seen this is ten orders of magnitude higher than that of calculated impedance,
and hence negligible.
50
Page 71
3.4 Magnets design
The permanent magnets are chosen to be off-the-shelf NdFeB components which can
supply 1.4T magnetic flux density. The pole pairs are embedded inside the ring-
shaped trenches on both sides of the turbine. Number of magnetic poles is a crucial
factor for an efficient transduction and hence obtaining the maximum flux density in
a given device geometry. High pole numbers increase the total leakage flux between
adjacent poles that do not penetrate through the stator, while low numbers of poles
result in a long azimuthal flux path, and consequently a significant magnetic reluc-
tance (see Figure 3.10). Therefore, using lower or higher than an optimal number
of poles would cause a decrease in the average flux density acting on the stator sur-
face. Because of the nonlinearity of the problem and its three dimensional geometry,
Bavg maximization and pole numbers optimization by means of analytical solution
for magnetic flux density is difficult. That is why in order to reveal the magnetic
flux density distribution within the device, numerical analysis has been conducted in
AC/DC module of the COMSOL finite element simulation software.
Specifically, magnetic fields —no currents interface was used, which solves the gen-
eral equation:
5.pµ0 5 Vm ´ µ0M0q “ 0 (3.16)
where µ0 and Vm are permeability of free space and scalar magnetic potential re-
spectively. And M0 is the magnetization vector within the corresponding material
domains. Subsequently, the average flux density on the stator surface that is provided
by one magnet pole was then obtained by
Bavg “1
A
ż
Bz ˆ dA (3.17)
where Bz is the axial magnetic flux density obtained by simulations and A is the
projection of one magnet area on the stator surface. Due to the fact that the prob-
lem possesses azimuthal symmetry, all other magnets provide the same Bavg with
alternating polarity under their corresponding A.
51
Page 72
The simulations have been performed to find the optimum p in range of the design
geometry, where the varying parameters include the thickness and inner and outer
radii of the ring-shaped magnets. Based on a recent work by [36], for a given magnet
area the thinner the magnets are, the higher number of poles are desirable. That is
why the thickness of magnets is chosen to be 500µm. Consequently, the best p has
been revealed for different combinations of rout and rin. The parameter values used
in the simulations are listed in Table 3.1.
To boost Bavg, the air gap between the magnets and coils on the stator is desired
to be as small as possible. That is why concerning the manufacturing and testing
constraints, it is set to be 50µm.
Table 3.1: Parameters used in the simulations
Parameter Value
Magnet thickness, tm 500µm
Outer radius, rout 7.25-7.5-7.75 mmInner radius, rin 3.25-3.5-3.75-4 mm
Air gap 50µm
The simulation first is done on the most basic model with two poles (rout=7 mm, rin=3
mm). It shows that the highest flux density is equal to 0.409 T whilst the average flux
density decreases to 0.137 T (see Fig. 3.10). This difference is mostly due to the large
reluctance which has the maximum value in central part of the magnets. Figure 3.11
depicts the diminishing effects of leakage fluxes and large reluctance on average flux
density, and shows that the resulting optimum pole numbers for the same geometry is
34.
The same simulations were performed for all the parameters listed in Table 3.1, and
the resulting optimum pole numbers with their corresponding Bavg are listed in Table
3.2.
Regarding the simulation results maximum Bavg is obtained as 0.452T . In addition
at optimality, rin “ 4mm and rout “ 7.25, in which the maximum Bavg is drived by
the least number of P .
However, the company were not able to provide the required number of magnet poles.
52
Page 73
Figure 3.10: (a) Simulation model for P “ 2, tm “ 500mm, rout “ 5mm, rin “
2mm. (b) distribution of flux density above the stator surface.
Figure 3.11: Bavg versus P showing the ranges where flux leakages and large reluc-
tance are dominant and the number of poles at which the Bavg is maximum.
Therefore, the highest number of poles that could be acquired and fit into our design,
considering its size and geometry, is 12. Moreover, magnets with smaller inner radius
would cover longer radial lines that would result in a higher induced voltage in coil.
However, due to the fact that narrow boundary wall between the ball grooves and
magnet trenches on the rotor can complicate the rotor fabrication process, the magnet
inner radius is chosen to be 4mm. The magnet outer radius, on the other hand, are
53
Page 74
Table 3.2: Simulation results for maximumBavg and corresponding optimum numberof P in range of Device geometry.
rin rout Optimum P ´Bavg
3.25 mm7.25 mm 34 - 0.451T7.5 mm 36 - 0.451T
7.75 mm 36 - 0.451T
3.5 mm7.25 mm 38 - 0.451T7.5 mm 38 - 0.452T
7.75 mm 36 - 0.451T
3.75 mm7.25 mm 38 - 0.452T7.5 mm 40 - 0.451T
7.75 mm 36 - 0.451T
4 mm7.25 mm 34 - 0.452T7.5 mm 40 - 0.451T
7.75 mm 38 - 0.452T
chosen to be 7.25mm to have a longer turbine radial blades, which inhances the fluidic
performance of the device.
3.5 Turbine blades design
The shape, length, and number of turbine blades have been optimized to maximize
the induced moment and rotational speed at normal breathing flow rates and hence
improving the voltage induction and sensor resolution. Based on the stator and mag-
nets design reported in previous sections, the turbine blades are located between
rin “ 7.5mm and rout “ 10mm, leading to a radial blade length of rl “ 2.5mm,
which is shown in Figure 3.12. The turbine blades parameters have been optimized
using COMSOL finite element analysis and have been determined to be circular,
straight and involute-type with 12, 8, and 11 blades respectively.
3.6 Microballs design
Microballs are one of the different types of bearings in MEMS which possess a low
wear and friction (less than 10´4 µNm/rpm, coefficient of friction torque) compared
54
Page 75
Figure 3.12: Turbine designs with (a) circular-type blades showing relevant dimen-
sions, and (b) involute-type blades with the same dimensions [26].
to contact and liquid film bearings. In addition, since microballs contact directly with
both the stator and rotor, they provide a strong support and a better stability than gas
lubricated bearings or magnetic/electrostatic levitations. These factors are all crucial
for the performance and lifetime of dynamic MEMS devices.
To minimize the wear problem, the microballs should have a close Young’s modulus
to that of the silicon. While steel is a very good choice regarding the Young’s modu-
lus, the microballs are selected to be made of SiN due to its magnetic property. In our
study off-the-shelf SiN microballs with a diameter of 1mm are being used.
55
Page 77
CHAPTER 4
FABRICATION
This chapter illustrates the microfabrication details of the sensor and related issues.
Fabrication has been one of the most challenging aspects of this work due to the lack
of pre-experiences and frequent microfabrication tool breakdowns. The MEMS sen-
sor shown in Figure 3.1 is fabricated from two stators and a rotor in the middle along
with microball bearings, which are sandwiched between the rotor and stators. The
process flow of the sensor used a total of 7 masks. The stator and rotor part are sep-
arately fabricated through 5-mask and 2-mask micromachining process respectively.
In this project I have worked on the stator part of the sensor which its fabrication
benefits from both bulk and surface micromachining.
Section 4.1 introduces thebasic microfabrication processes. Sections 4.2 and 4.3 de-
scribe the designed fabrication steps of the stators and design process of the stator
masks respectively. Sections 4.4, 4.5, 4.6, 4.7, and 4.8 present the details of the each
step of the fabrication process which are patterning the alignment marks and stators’
outer frame, deposition of the coils, deposition of the insulation layer, deposition of
the electrical pads, and balls groove etching respectively. Finally a brief summary
and suggestions for future improvements are given in Section 4.9. Detailed process
travelers are listed in Appendix.
4.1 Introduction to the basic microfabrication
The term micromachining refers to the fabrication of microelectromechanical devices
and, in particular, miniaturized sensors and actuators. And silicon micromachining as
57
Page 78
the most advanced micromachining technologies consists of two main technologies:
bulk micromachining, in which structures are fabricated through etching techniques
to remove part of the silicon substrate and surface micromachining, in which the
micromechanical layers are made from deposited thin films on the surface.
Bulk micromachining is one of the most commonsilicon micromachining technolo-
gies that permitsselectively etching into the silicon wafer to form microstructures such
as a variety of trenches and holes. There are several silicon etching methods, which
can be divided into wet etching and dry etching based on the phase of etchants. While
vapor and plasma etchants are referred to as dry etching, wet etching is done by liquid
etchants. Wet etching, known as conventional etching method, is mostly applied to
the back side of the wafer whilst the plasma etching is done in the front side. Both
wet and dry etching of the silicon can be considered to be either isotropic etching or
anisotropic etching.
Wet etching is done by putting the silicon wafer into an etching bath or spraying the
etchants over the substrate. Isotropic wet etching is not directional, which means, the
etch rates are the same for all directions in the silicon. However, anisotropically etch-
ing speed is determined by the crystal’s orientation, in which the etch rate decreases
considerably at the (111) planes, relative to other silicon planes. Different etching
structures of isotropic and anisotropic wet etching are illustrated in Figure 4.1.
Figure 4.1: Illustration of the etched profiles using isotropic and anisotropic etching
retrieved by [27].
Dry etching occurs through physical and/or chemical interaction between the gas ions
and the atoms of the substrate. Plasma etching and reactive ion etching (RIE) are the
most common dry etching techniques of bulk silicon. Due to less chemical contami-
58
Page 79
nation and geometry flexibility anisotropic dry etching technique is broadly employed
in MEMS. DRIE process is cyclic, consisting of a brief etch step followed by side-
wall passivation which enables high aspect ratio deep silicon microstructures. DRIE
employ the same basic RIE technology, but also uses special gas chemistry to form a
thin layer of polymer on the sidewalls to prevent lateral etching. Figure 4.2 depicts
anisotropic DRIE process.
Figure 4.2: Illustration of how deep reactive ion etching works [28].
Unlike the bulk micromachining, which fashion the bulk silicon, in surface microma-
chining the microstructures are built on the surface of the substrate. The process is
done by depositing and patterning thin film of “structural layers" on top of “sacrificial
layers". The sacrificial layers are eventually removed to release the structures. Figure
4.3 briefly describes the basics of surface micromachining.
Metals are one the most versatile classes of materials that are used in various MEMS
devices. Thin metallic films can be deposited via many different techniques. We can
categorize the metal deposition techniques into chemical vapor deposition (CVD),
physical vapor deposition (PVD), and electrochemical deposition (ECD). However,
since PVD is being performed in lower process temperature compare to PVD and a
wide range of materials can be deposited via PVD technique, the CVD method is not
discussed.
PVD methods are based on the physical transference of metal atoms from a metal
source to the wafer substrate. Thermal evaporation, e-beam evaporation, and sputter-
59
Page 80
Figure 4.3: Illustration of a surface micromachining process [29].
ing are known as the common metal deposition methods in MEMS fabrication where
deposition is done physically. While in thermal evaporation the metal evaporation is
done through heating the metal source up, in e-beam evaporation this is done through
bombarding the metal source by means of electron beams. In sputtering, however,
target is bombarded by accelerated ions; usually Ar+ that are ionized via applying
bias voltage between the cathode and the anode. As a result, momentum exchange
occurs between the atoms of the target surface and the ions and so the metal atoms are
evaporated. All these processes are mostly performed inside a vacuumed chamber. In
contrast to the evaporation method, sputtering can provide good step-coverage which
means the wafer surface along with sidewalls can be covered more uniformly. Nev-
ertheless, evaporation causes higher film purity than that of sputtering. The uniform
and non-uniform coverage are shown in Figure 4.4.
Unlike PVD techniques, ECD methods, which invlove electroless plating and electro-
plating, are based on chemically growing the metals that allows selective deposition.
While electroless plating and evaporation are more preferable methods for thinner
films deposition, sputtering and electroplating are better suited for thicker films. In
electrochemical deposition an electric current is applied to two electrodes placed in-
side an electrolyte. Consequently, reduction occurs at the cathode, and oxidation
takes place at the anode. In electroplating the wafer substrate plays as the cathode,
60
Page 81
Figure 4.4: Step coverage of deposited films with (a) uniform coverage (b) noncon-
formal step coverage [30]
and metal ions are reduced to make a solid lattice. A simple diagram of electroplating
process is shown in Figure 4.5.
Figure 4.5: Schematic of a general electrochemical deposition cell [30]
In addition to the etching process for metal layers, lift-off process is also employed
for patterning the deposited films. During this process, metal is deposited on top
of a patterned sacrificial layer. The sacrificial layer is then dissolved in a solvent and
hence parts of the deposited layer on top of the sacrificial layer will float away as well.
Therefore the film is patterned without any etching process. To achieve a proper lift
off, the deposited layer need to be discontinuous at the edges of the opening in the
patterned photoresist.Hence the sidewall profile of the photoresist should be undercut.
That is why, positive photoresists with image reversal or negative photoresists, which
inherently have undercut profiles, work best for liftoff applications. This is illustrated
61
Page 82
in Figure 4.6.
Figure 4.6: A schematic outlining the stages of the lift off process with both positive
and negative photoresists with exaggerated sidewall angles [27]
4.2 Designed fabrication steps
The aim of the fabrication is to achieve two stators that contain copper coils,electrical
pad connections on top of an isolation layer connected to the two ends of the coil, and
the microballs groove at the center (Figure 4.7).
Figure 4.7: An illustration of the stator contains in-plain coils, electrical pads, and the
microballs trench. Also a close view of the connection of the pad to one end of the
coil is shown.
The stator fabrication was designed to be carries out through 5 main processes: Etch-
ing the alignment marks and stators’ outer frame, electroplating the copper coils,
62
Page 83
Lithography the isolation layer, depositing the copper pads, and DRIE etching the
microballs’ groove. The fabrication steps are shown in Figure 4.8. The designed
process flow is described in details in following.
The starting substrate is a 500µm-thick single-side polished silicon wafer with 2µm
SiO2 on its both sides (see Figure 4.8(a)). The first mask pattern contains the align-
ment marks and stators’ frame. The first step is etching and patterning the SiO2
layer and front side of the Si wafer. To achieve this, the wafer is first coated with a
photosensitive material (photoresist) as the sacrificial layer (see Figure 4.8(b)). The
photoresist is then exposed through the mask to UV light and developed in developer
solution (see Figure 4.8(c)). Afterwards, the SiO2 layer is etched through an isotropic
wet etching, in which the patterned photoresist acts as a mask during the process (see
Figure 4.8(d)). To etch the Silicon, DRIE method is used to provide anisotropic ver-
tical etching (see Figure 4.8(e)). Finally, the sacrificial layer (photoresist) is removed
in Acetone (see Figure 4.8(f)).
The next step includes coils deposition. This step begins with deposition of a thin
layer of chromium and copper as seed layer (see Figure 4.8(g)). The chromium is
deposited under copper to boost the copper adhesion to the wafer’s surface. Since
sputtering provides a better uniformity, it is preferable to employ sputtering for metal
deposition. A thick layer of photoresist is then deposited and patterned by exposing
through the second mask (see Figure 4.8(h)). Next copper coils are electroplated (see
Figure 4.8(i)). This step finishes with removing the sacrificial layers by stripping the
photoresist in Acetone and wet etching a thin layer of copper to remove seed layer
(see Figure 4.8(j)).
Third step is deposition of an insulation layer. A thick layer of SU-8, which is a pho-
tosensitive material, is deposited via spin coating and patterned in developer solution
after UV exposure through the third mask (see Figure 4.8(k)).
During the next step, first of all a thin layer of copper is coated via sputtering (see
Figure 4.8(l)). This layer is shaped via wet etching, in which a photoresist layer is
used as the mask during etching process (see Figure 4.8(m)). The electrical pads mask
is employed to pattern the photoresist at this step. The mask layer is removed at the
end. Finally, ball grooves and outer frames are etched deeply into the silicon. Since
63
Page 84
anisotropic etching is required, DRIE method is utilized to achieve vertical trenches.
A very thick layer of photoresist acts as the mask for DRIE process. These steps can
be seen in Figures 4.8(n), 4.8(p) and 4.8(q).
(a) The Si wafer with 2µm SiO2 layer
(b) The positive PR is spin coated on top of the wafer.
(c) The PR is pattern by UV exposure through 1st mask.
Figure 4.8: Designed fabrication flow process
64
Page 85
(d) The SiO2 is patterned using wet etching.
(e) The Si is etched using DRIE method
(f) The PR is removed in acetone.
(g) A thin layer of Cr and Cu is deposited as seed layer.
Figure 4.8: Continued
65
Page 86
(h) A thick layer of positive PR is patterned through 2nd mask on top of the seed layer.
(i) The Cu is deposited through electroplating.
(j) The PR is removed in acetone and a thin layer of Cu is etched by wet etching.
Figure 4.8: Continued
66
Page 87
(k) The SU-8 is deposited and patterned as insulation layer using 3rd mask.
(l) A layer of Cu is deposited on the wafer as the electrical pad layer.
(m) The deposited positive PR as sacrificial layer is patterned through 4th mask.
Figure 4.8: Continued
67
Page 88
(n) The top Cu layer is patterned by wet etching and the PR is removed in acetone.
(o) A thick layer of positive PR is deposited and patterned as the mask for DRIE.
(p) The Si is etched by means of DRIE.
Figure 4.8: Continued
68
Page 89
(q) The PR mask is removed in acetone
Figure 4.8: Designed fabrication flow process. Continued
4.3 Stator masks design process
Five masks were designed for these processes initially; however, one of them re-
designed laterin middle of the fabrication to simplify the device structure at the ex-
pense of performance in order to demonstrate the first working device.The masks are
designed in AutoCAD due to the complex pattern of the coils. Each mask is drawn in
a separate layer in AutoCAD.
The first masks contain the outer frames and aligning marks. The alignment marks,
which are used to align different mask patterns on the wafer during fabrication pro-
cess, are designed to provide at least 5µm accuracy. The patterns are all made of
drawing different polyline squares and rectangles.
The coils mask is the most complicated one. To obtain the coils pattern, first the
smallest inner circle, which is tangential to the smallest inner arc, has been drawn and
then using Offset command other inner circles are drawn. The same process is done
for outer circles, which are tangential to outer arcs, as well. To draw the radial parts,
one of the radii of largest circle is drawn and by employing the ‘Array’ command
1200 radii are drawn in 360˝. Afterwards, by means of the ‘Trim’ command the radii
are cut in which the first radius starts from the smallest inner circle to the smallest
outer circle and the last radius on one pole of stator coils begins from the largest
inner circle to the largest outer circle. By means of the ‘Mirror’ command the radii of
69
Page 90
neighbor pole can be drawn. Next, the inner and outer connections along with radial
lines are drawn as the ‘Polylines’ for a pair of poles. Finally, the drawn Polylines are
being arrayed in 360˝.
The other masks have much more simple patterns than the coils mask. In all other
masks, first the patterns are drawn and finally different regions are being converted to
polylines. It is important to ensure high accurate and error-free drawings are provided.
All five masks are depicted through Figures 4.9 to 4.13.
Figure 4.9: The layout of the 1st mask, which contains patterns of the stators’ outer
frame and alignment marks. Features are clear.
Figure 4.10: The layout of the 2nd mask, which contains patterns of the coils. Fea-
tures are clear.
70
Page 91
Figure 4.11: The layout of the 3rd mask, which is pattern of the insulation layer.
Features are dark.
Figure 4.12: The layout of the 4th mask, which contains the patterns of the electrical
pads and devices names.
71
Page 92
Figure 4.13: The layout of the 5th mask, which contains the patterns of the ball
grooves and stators’ outer frames.
4.4 Alignment marks and stators’ outer frame patterning
The process starts with patterning a positive photoresist layer on top of the SiO2 using
the 1st mask. The patterned photoresist would act as a mask for wet etching of the
SiO2 layer which will be then etched in a 7:1 volumetric mixture of hydrofluoric
acid (HF) and ammonium fluoride (NH4F). The silicon substrate is then dry-etched
to a depth of 50µm using DRIE.The patterned SiO2 layer and photoresistare used as
the etch-mask during DRIE.Whilst using DRIE at this step was planned to eliminate
dicing the stators at the end, this step later modified as discussed towards the end of
this section.
Although the process seems to be very straightforward, many problems occurred dur-
ing each step that we dealt with. First of all AZ5214, the most common photoresist in
72
Page 93
the lab, was used as the etch mask; however, its stability inside the buffered HF was
insufficient and large scale resist peeling was observed after 15 min etching.
4.4.1 Challenges with lithography
In order to etch 2µm SiO2 the wafer needs to remain in BOE for about 35 to 40
minutes, therefore a thicker photoresist had to be used. Since at the beginning the
only available thick photoresist was AZ4562, it was chosen as the masking layer for
wet etching. Although it had a very good adhesion during etching process, the prob-
lem with this photoresist was bubbles formation after exposure. By decreasing the
exposure dose, using sloped softbaking method, and much longer softbaking period,
bubble formation was minimized (see Figure 4.14).
(a) (b)
Figure 4.14: Bubble formation after UV exposure
The AZ4562 was later replaced by AZ4533 photoresist. We again faced with a few
bubbles formation, which was completely tolerated after lowering the exposure dose
and extending the softbaking time. In addition, although at the beginning it was not
adhesive enough during wet etching, a hardbake at 140˝C improved resist adhesion
by further formation of chemical bonds between the resist and substrate (see Figure
4.15).
73
Page 94
(a) (b)
Figure 4.15: Adhesion of the AZ4533 during wet etching a) without hard baking b)
The PR is hardbaked at 140˝C
4.4.2 Challenges with SiO2 wet etching
It was also observed that to optimize the Buffered Oxide etching process, the BHF
should be used between 22 to about 60 hours after preparation. In addition, to obtain
a uniform etching the wafer should remain in the solution uninterruptedly until a
complete etching.
4.4.3 Challenges with DRIE
Since DRIE at this step is being used only to easily separate the stators from the
wafer, many DRIE etching features such as aspect ratio dependent etch (ARDE) rate,
loading effect, and scalloping are not important. Nonetheless, as alignment marks
are being etched in this step as well, minimum undercut was an issue which we dealt
with it. The optimization process on chip scale showed that the observed undercut
was due to imperfect bonding of chips to the carrier wafer. The imperfect bonding
leads to weak cooling and since the passivation deposition rate is directly related to the
wafer temperature, the sidewall passivation decreases and hence undercut increases.
Consequently using no carrier wafer or perfect bonding overcame the problem (see
74
Page 95
Figure 4.16).
(a) (b) (c)
Figure 4.16: (Scanning Electron Microscopy) SEM image of DRIE results: In (a) and
(b) huge undercut and positive profile angle is observed. c) Almost vertical sidewalls
are observed after bonding optimization.
Due to the fact that the wafer thickness is 500µm and ball trenches along with outer
frames were going to be etched for 450µm in the last fabrication step, by etching the
outer frames for about 50 ´ 60µm at this step there would be needless to dice the
stators at the end. But in the next generations ball grooves were decided to be etched
for 300µm. The plan was modified mostly because of DRIE variation in turbine
etching process which led to having a deeper ball groove in turbines. Consequently,
depth of the ball trenches in the stators should be reduced. Furthermore, the thicker
the bottom of microball trenches is, the stronger it is, and so it will not break easily.
Moreover, the etched stator frames made it difficult to deposit uniform photoresist
during the next fabrication steps. Consequently, the first DRIE step was decided to be
eliminated for the next generations.
Coils deposition Although the coils were planned to be electrodeposited copper
with thickness of 20µm, since the electroplating system at UNAM had not been in-
stalled yet, it was replaced with a 300nm-thick evaporated copper layer which is
patterned using lift-off.
Challenges with copper wet etching Since wet etching was an alternative for pat-
terning the evaporated copper that due to the lack of Cu etchant, Cr etchant was used
as etching solution. The etching rate using pure Cr etchant was too high (280 nm/s)
75
Page 96
along with non-uniform etching profile. Hence, to have a better control over etching
process a diluted Cr etchant was used. Using 1:10 dilution of Cr etchant resulted in
a slower and more uniform etching. However, non-uniformity problem was not per-
fectly solved and while some parts were not etched well, some copperwires got too
narrow due to the huge undercut (see Figure 4.17).
Figure 4.17: Illustration of non-uniform etching of Cu using Cr etchant.
4.4.4 Challenges with lift-off process
Due to the fact that the mask was designed for electroplating process, at first there
was no choice but using positive photoresist (AZ4533) for lift-off process. In spite
of depositing a very thin layer of Cu (150nm), because of using positive photoresist
the lift-off was unsuccessful. Meanwhile, some lift-off trials using image reversal
AZ5214 showed much better results. Therefore, we decided to write a new coils
mask whose features would be compatible with negative photoresists. Although the
written mask in UNAM had some issues due to the mask writer machine errors, until
receiving the perfect written mask from US some more lift-off trials were done using
the temporary mask. We observed that thermally evaporated copper does not possess
good adhesion, whilst utilizing Cr and Ti as adhesion layer caused a worse result
during the lift-off. This can be due to the high melting point of such metals that
makes the resist profile start rounding and hence allow the metals to cover the resist
profile side-walls as well. Consequently, the best lift-off result achieved by thermally
76
Page 97
evaporated copper without using any adhesion layer and doing the lift-off so gently
(see Figure 4.18).
Figure 4.18: Lift-off result of 300nm-thick evaporated Cu
For next generations, we had access to Cr and Cu sources for sputtering machine and
so we tried to deposit 20nm-thick Cr as adhesion layer followed by Cu deposition and
do patterning by means of lift-off process. Although sputtering is not a sophisticated
technique for lift-off, the result was good.It is most probably due to the deposition of
thin metal layer (300 nm) along with strong adhesion (see Figure 4.19).
Figure 4.19: Lift-off result of 300nm-thick sputtered Cu. 20 nm-thick sputtered Cr is
used as adhesion layer.
77
Page 98
4.5 Insulator layer deposition
5µm SU-8 3005 is used to provide the electrical isolation between the coils and elec-
trical pads. What matters at this step is consideration of residue layer that could result
in disconnection of electrical pads from coil ends. As a result, short O2 plasma fol-
lowing with a very thin Cu etching is used. The O2 plasma removes any possible
SU-8 residue and wet etching etches a few nm of Cu to assure no copper oxide exist
due to the O2 plasma (see Figure 4.20).
Figure 4.20: SU-8 lithography, which is covered everywhere on top of the coils except
two rectangles on two ends of the coil.
4.6 Electrical pads connection
This step includes deposition of pad-layer metals following with patterning the pad
structure. The copper pads at first were deposited using thermal evaporator and pat-
terned through wet etching. Although we had not observed any problem during chip
scale trials, in wafer scale experiments we faced with loose connection issue between
the pads and coils ends. Optimization of SU-8 lithography to obtain vertical sidewalls,
thinning the SU-8, and deposition of a thicker copper were considered to address the
problem. To achieve vertical sidewalls using a long pass filter is highly recommended
to eliminate UV radiation below 350 nm.However, since no filter was available in the
78
Page 99
lab, exposure dose was almost the only effective parameter we could change. In ad-
dition, deposition of copper with thickness of more than 600nm resulted in adhesion
problem on top of the SU-8 due to the occurrence of higher stress in deposited film
(see Figure 4.21).
Figure 4.21: The adhesion loss of 700nm-thick evaporated Cu on top of the SU-8
during wet etching in Cr echant.
Accessing to the Cr and Cu sources for sputter machine resolved the loos connection
issue; however, then we had to tackle with the patterning step. In spite of the fact
that patterning the thermally evaporated copper pads could be easily done using Cr
etchant, wet etching process of 500nm-thick sputter-coated layer of Cr and Cu became
much slower along with appearance of huge non-uniform etching (see Figure 4.22).
We later found that this happens in case of existence of chromium as adhesion layer.
As an alternative we could use Al etchant to etch the copper following with Cr etchant
to etch the chromium layer. Nonetheless, to prevent any unexpected issues, lift-off
technique was tried for patterning the deposited metals which led to a perfect pattern-
ing (see Figure 4.23).
79
Page 100
Figure 4.22: Illustration of the non-uniform sputtered Cr and Cu wet etching.
Figure 4.23: Illustration of lifted-off sputtered Cu pads.
4.7 Ball grooves etching
Finally, the last step is patterning the ball trenches. As mentioned before, first the ball
grooves were decided to be etched for 450µm and then modified to 300µm. Through-
etching of the silicon substrate is performed by DRIE. Since a good DRIE recipe
had been found during 1st fabrication step, for 450µm etching we mostly focused
on masking layer. A thick photoresist layer is being used as the etch mask. At the
80
Page 101
beginning, 10µm thick AZ4562 photoresist was successfully used as masking layer
for DRIE tests. However, later due to the unavailability of AZ4562, it was replaced
with 5µm AZ4533 which could not tolerate 450µm depth DRIE. Finally, AZ9260
photoresist was provided that enabled us to achieve 14µm-thick photoresist in a single
coat, which makes it a perfect etch mask (see Figure 4.24).
Figure 4.24: Illustration of 480µm DRIE etch of the stator outer frame.
Although sophisticated results were obtained during the tests, when we were going
to etch the main devices after a few months, we faced with new issues. Not only the
etch rate was different in the same patterns but different parts of the wafer, also about
50µm grass is observed (see Figure 4.25).
4.8 Summary and suggestions
This chapter presented the fabrication of the MEMS stators and several of its com-
plications. The selected fabrication processes are the both bulk and surface microma-
chining. A comprehensive overview of each step of the micromachining processes
are provided, including the designed process flows, encountered problems, and the
final solutions.
81
Page 102
Figure 4.25: SEM image of the grassing at the bottom of the DRIE etched ball trench.
The fabricated stators have a 300nm-thick copper coils, which are covered with a
5µm-thick SU-8 as the insulation layer. The insulation layer includes two rectangular
openings on the two end of the coils, where the 500nm-thick electrical pad layers are
connected to the coils. A 300nm-depth circular shape trench is etched through the
stators to contain the microballs. The summary of the performed fabrication is illus-
trated in Figure 4.26.
(a) The PR is patterned by through 1st mask.
(b) The SiO2 is patterned using wet etching.
Figure 4.26: Fabrication flow of the stator.
82
Page 103
(c) The alignment marks and stator’s outer frames are etched using DRIE.
(d) A layer of PR is patterned through coils mask.
(e) Thin layer of Cr and Cu are deposited on top.
(f) The metal layers are patterned through lift-off.
(g) SU-8 lithography is performed through the 3rd mask.
(h) PR layer is patterned through electrical pads mask.
(i) Cr and Cu are deposited on top.
Figure 4.26: Continued
83
Page 104
(j) the metal layers are patterned via lift-off.
(k) Thick layer of PR is deposited and patterned through 5th mask.
(l) Ball grooves and stators outer frame are etched using DRIE.
Figure 4.26: Fabrication flow of the stator. Continued
To address the grassing issue of the etched trenches at the last step, The DRIE pro-
cess parameters need to be optimized. Considering previously studies, the grassing
formation mostly occurs in large trenches and several parameters such as micromask-
ing, passivation rate, platen power, SF6 flow rate and etching cycle time. However,
since in our study pre-cleaning was done during SiO2 wet etching, micromasking can-
not be the issue of grassing formation [68]. Due to the fact that insufficient etching
radicals in etch step and too much passivation deposition can lead to the formation
of grass at the bottom of etching, increasing the platen power along with decreasing
the passivation component by lowering the polymer flow, can minimize the grassing
problem [69]. In addition, regarding the research conducted by [70], if the etch cycle
time is less or more than an optimum amount, The grasses will be appeared at the
bottom of the trench. That is why etch cycle time parameters are crucial for getting
satisfactory DRIE results. Furthermore, they have obtained that amount of bottom
silicon grass increases when the SF6 flow rate is gradually increased.
84
Page 105
CHAPTER 5
TEST AND RESULTS
This chapter presents the electrical characterization of the successfully fabricated mi-
crocoils. Furthermore, the sensitivity of the induced voltage with respect to the gas
velocity is calculated.
As mentioned in the previous chapters, two design of micro coils are fabricated, which
are 12 poles 50 turns per pole and 12 poles 25 turns per pole. The resistance and
inductance of the coils have been tested for electrical power delivery. Experimental
results are compared with the theoretical analysis and are discussed at the end of this
chapter.
The resistances of both 25-turn and 50-turn microcoils were measured with a simple
multimeter. Although there were some variations across the wafer, the coils resis-
tances obtained as 3.9kΩ for 25-turn coils and 15.8kΩ for 50-turn coils. Based on
theoretical calculations for 300nm-thick copper coils, the resistances of 25-turn and
50-turn coils were expected to be 2.9kΩ and 11.5kΩ respectively, which are lower
than the measured values. One reason is the non-uniform metal deposition, which
also resulted in resistance variations between the similar designed coils on the same
wafer. Furthermore, the connections between the electrical pads and two ends of the
coil, which expected to be very thin, are not included in calculations. In addition,
copper oxidation and narrower copper coils caused by imperfect lithography can be
considered as further reasons.
The inductance of the coils have been also measured using Probe Station. For 25-turn
and 50-turn coils, the inductance of the coils are measured as 2.6mH and 10.3mH
85
Page 106
respectively. Considering the maximum frequency of 1kHz, the maximum inductive
reactance of the 25-turn and 50-turn coils pXL “ 2πfLq will be 16.33Ω and 64.71Ω,
which are negligible compared to the coil resistances. Therefore the coil equivalent
circuit resulting from this analysis can be simplified, which is given in Figure 5.1.
Figure 5.1: Equivalent circuit model for microcoil.
As discussed in Chapter 3, the maximum power generation will be obtained when
ZL “ Z˚coil. Considering the practical values, at ZL “ Rcoil and speed of 10krpm
during normal breathing, the maximum output power will be 0.32mW and 0.34mW
in 50-turn and 25-turn coil devices respectively. However, fabricating the coils using
electroplating would lead to a much less coil resistance and so boost the output power
to 30mW.
Goreke et al manufactured the plastic version of the turbines using CNC machine and
speed performance of the different turbine designs with respect to the input flow rate
were tested [26]. The rotational speed of the designed turbines versus volumetric flow
rate was plotted in Figure 5.2.
Afterwards, using eq. 3.5 the induced voltage amplitude with respect to the input gas
velocity is calculated and obtained graph is shown in Figure 5.3.
As can be seen in Figure 5.3, there is a linear relation the flow rate and induced voltage
that results in sensor linearity. Moreover, the sensitivity of device, which is the ratio
of output voltage for a unit flow rate, is obtained as 0.2 V/L/min in 50-turn coil and
0.1 V/L/min in 25-turn coil.
86
Page 107
Figure 5.2: Rotational speed vs flow rate for different turbine designs [26].
Figure 5.3: induced voltage vs flow rate for different coil designs.
In order to find the spirometric curves, the volumetric flow can be easily obtained by
multiplying the flow rate by tube cross sectional area. Consequently, the volume-time
and flow-volume curves can be achieved.
Although the calculated values are based on the test results of the plastic turbine, we
expected to archive enhanced performance using microfabricated turbines. This is
due to the fact that the turbines were manufactured using CNC milling on PMMA
with `50µm precision. Since the CNC was not able to perform backside alignment,
the microballs trench has been only etched on one side of the turbine. Consequently,
the gap between the inner package surface and one side of the turbine is higher than
87
Page 108
that of the other sides. This reduces the efficient flow of the fluid inside the pack-
age that results in less efficient collision between the fluid and turbine blades. Fur-
thermore, using MEMS technology would boost the manufacturing precision from
`50µm to less than `5µm. Besides micromachined turbines will have a smoother
surface, which results in a lower friction. On the other hand, magnets were not em-
bedded in the PMMA turbines so that the tests were carried out using lighter turbines;
however, the mentioned advantages of microfabricated turbines are believed to over-
come this issue and show a better performance.
88
Page 109
CHAPTER 6
SUMMARY, CONCLUSIONS AND FUTURE WORKS
6.1 Summary
Based on WHO estimates, there is a significant number of patients suffering from
asthma and COPD worldwide. These statistics demonstrate a high demand for fa-
cilities to help remote monitoring of patients in a more efficient way. Spirometers,
are known as the most popular tools in diagnosing and following the progress of the
lung diseases. Various types of spirometeres are available in the market, in which
the turbine based spirometer sensors benefits from all the advantages of insensitiv-
ity to ambient pressure, temperature, humidity, and gas particles. This study aims to
achieve the first turbine based MEMS spirometer sensor with the capability of utiliz-
ing human breath to repower itself.
The research done during this study can be summarized as:
‚ Several designs of plannar microcoils are investigated and gear-shaped design
is selected as the coils pattern. Two different coils are designed, which are 12
poles 25 turns per pole and 12 poles 50 turns per pole microcoils.
‚ The poles number and magnets dimentions are optimized for the geometry of
our device. The magnets are designed as ring shaped with 4mm and 7.25mm
inner and outer radius respectively. Also number of poles is set to be 12.
‚ The microfabrication of the stators was performed during the 5-mask microma-
chining process, which includes DRIE etch of alignment marks, deposition of
copper microcoils, insulation layer deposition, electrical pads deposition, and
89
Page 110
DRIE etching of microball trenches. However, the bottom of the DRIE etched
ball grooves contains grass and needs further optimizations.
‚ The performance of successfully deposited coils are tested. In addition, tests
using PMMA manufactured designed turbines have been provided the infor-
mation of the speed of turbines in respect with the flow rate which enables to
calculate the induced voltage and maximum delivery power of the device. The
obtained data are illustrated in Table 6.1.
Table 6.1: Summerized of achieved device performance values.
Coil resistance Coil inductance Max delivered SensitivitypkΩq pmHq power pmW q pvlmpq
12 pole 50-turncoil
15.8 10.3 0.34 0.2
12 pole 25-turncoil
3.9 2.6 0.32 0.1
6.2 Future work
The microfabrication of the stators was one of the most challenging aspects of this
work due to the lack of pre-experience and frequent microfabrication tool break-
downs. Although the fabrication of the device is not completely done, the obtained
results shows that this design has a strong potential to be used as spirometer sensor.
In our study, in order to achieve the first working device, in some cases the design and
fabrication were simplified. The future generations of the micromachined sensorr can
be developed by building upon this work to improve the mechanical and electrical
performance. Fabricating electroplated and multi-layer coils are such cases.
90
Page 111
REFERENCES
[1] V Lopata, Son-Cheol Yu, M ElShabbah, and I Myasnyi. On the spirometry and
spirometers standardization. In Electronics and Nanotechnology (ELNANO),
2013 IEEE XXXIII International Scientific Conference, pages 316–318. IEEE,
2013.
[2] CDC. Respiratory health spirometry procedures manual, 2008. URL
http://www.cdc.gov/nchs/data/nhanes/nhanes_07_08/
spirometry.pdf. [Last accessed on 2016-02-10].
[3] John E Hall. Guyton and Hall textbook of medical physiology. Elsevier Health
Sciences, 2010.
[4] CDC. Chronic obstructive pulmonary disease, 2015. URL http://www.
cdc.gov/copd/index.html. [Last accessed on 2016-02-10].
[5] British lung foundation. Causes of asthma, 2008. URL https://www.blf.
org.uk/support-for-you/asthma/causes. [Last accessed on 2014-
03-10].
[6] Rolf M Schlegelmilch and Rüdiger Kramme. Pulmonary function testing. In
Springer Handbook of Medical Technology, pages 95–117. Springer, 2011.
[7] Raghbir Singh Khandpur. Handbook of biomedical instrumentation. Tata
McGraw-Hill Education, 1992.
[8] Interactive Learning Toolkit. Instrumentation for mechanics of breathing, 2013.
URL https://galileo.seas.harvard.edu/images/material/
3794/1321/InstrumentationforMechanicsofbreathing.
pdf. [Last accessed on 2016-02-10].
[9] M Laghrouche, L Montes, J Boussey, and S Ameur. Low-cost embedded
91
Page 112
spirometer based on micro machined polycrystalline thin film. Flow Measure-
ment and Instrumentation, 22(2):126–130, 2011.
[10] QZ Wei, R Zhu, RY Que, and Z Cao. Hybrid system for airspeed measure-
ment using dual mems sensors. In Nano/Micro Engineered and Molecular
Systems (NEMS), 2011 IEEE International Conference on, pages 1224–1228.
IEEE, 2011.
[11] PFTBlog. Pneumotach accuracy, 2014. URL http://www.pftforum.
com/blog/pneumotach-accuracy/. [Last accessed on 2016-02-10].
[12] engineeringtoolbox. Types of fluid flow meters, 2010. URL http://www.
engineeringtoolbox.com/flow-meters-d_493.html. [Last ac-
cessed on 2016-02-10].
[13] Riccardo Carta, David Turgis, Bart Hermans, Philippe Jourand, R Onclin, and
Robert Puers. A differential pressure approach to spirometry. In Biomedical
Circuits and Systems Conference, 2007. BIOCAS 2007. IEEE, pages 5–8. IEEE,
2007.
[14] NG Mandal. Respirometers including spirometer, pneumotachograph and peak
flow meter. Anaesthesia & intensive care medicine, 7(1):1–5, 2006.
[15] Niklas Svedin, Erik Stemme, and Göran Stemme. A static turbine flow meter
with a micromachined silicon torque sensor. Microelectromechanical Systems,
Journal of, 12(6):937–946, 2003.
[16] W Blumenfeld, SZ Turney, and RJ Denman. A coaxial ultrasonic pneumota-
chometer. Medical and biological engineering, 13(6):855–860, 1975.
[17] David I. Plaut and J.G. Webster. Ultrasonic measurement of respiratory flow.
Biomedical Engineering, IEEE Transactions on, BME-27(10):549–558, Oct
1980. ISSN 0018-9294. doi: 10.1109/TBME.1980.326576.
[18] Pawel Jalocha. Vortex flow meters, 2015. URL https://indico.cern.
ch/event/287285/contribution/1/attachments/534381/
736801/PawelJalocha_Hamburg_30jun2014.pdf. [Last accessed
on 2015-03-4].
92
Page 113
[19] H Nakesch et al. Alternative sensor principles for the detection of human res-
piration using amorphous ferromagnetic materials. In Engineering in Medicine
and Biology Society, 1995 and 14th Conference of the Biomedical Engineering
Society of India. An International Meeting, Proceedings of the First Regional
Conference., IEEE, pages 1–17. IEEE, 1995.
[20] Chia-Ling Wei, Chien-Fu Lin, and I-Ta Tseng. A novel mems respiratory flow
sensor. Sensors Journal, IEEE, 10(1):16–18, 2010.
[21] KS Rabbani, Suravi Islam, and Shumon Alam. A novel gas flow sensor based
on sound generated by turbulence [and spirometry application]. In Instrumen-
tation and Measurement Technology Conference, 1997. IMTC/97. Proceedings.
Sensing, Processing, Networking., IEEE, volume 2, pages 1386–1388. IEEE,
1997.
[22] Shuhui Wang, Zwe-Lee Gaing, Raul Garcia, Peter Chang, and Ci Chen. A
self-power peak expiratory flow meter. In Orange Technologies (ICOT), 2013
International Conference on, pages 172–176. IEEE, 2013.
[23] David P Arnold, Sauparna Das, Jin-Woo Park, Iulica Zana, Jeffrey H Lang,
and Mark G Allen. Microfabricated high-speed axial-flux multiwatt permanent-
magnet generators&# 8212; part ii: Design, fabrication, and testing. Microelec-
tromechanical Systems, Journal of, 15(5):1351–1363, 2006.
[24] CT Pan and YJ Chen. Application of low temperature co-fire ceramics on in-
plane micro-generator. Sensors and Actuators A: Physical, 144(1):144–153,
2008.
[25] R Cordero, A Rivera, M Neuman, R Warrington, and E Romero. Micro-
rotational electromagnetic generator for high speed applications. In Micro Elec-
tro Mechanical Systems (MEMS), 2012 IEEE 25th International Conference on,
pages 1257–1260. IEEE, 2012.
[26] U. Goreke, S. Habibiabad, K. Azgin, Y.S. Dogrusoz, and M.I. Beyaz. The de-
velopment and performance characterization of turbine prototypes for a mems
spirometer. Sensors Journal, IEEE, 16(3):628–633, Feb 2016. ISSN 1530-
437X. doi: 10.1109/JSEN.2015.2488104.
93
Page 114
[27] Jonathan Lueke, Ahmed Badr, Edmond Lou, and Walied A Moussa. Microfab-
rication and integration of a sol-gel pzt folded spring energy harvester. Sensors,
15(6):12218–12241, 2015.
[28] Partnering with Australasia. Evaporative co2 cooling in silicon micro-
channels for the lhcb velo, 2015. URL http://www.pwagroup.com.au/
equipment/mass-flow-meters/vortex. [Last accessed on 2015-03-
4].
[29] The trembling uterus.
[30] Reza Ghodssi and Pinyen Lin. MEMS materials and processes handbook, vol-
ume 1. Springer Science & Business Media, 2011.
[31] M Ashauer, H Glosch, F Hedrich, N Hey, H Sandmaier, and W Lang. Ther-
mal flow sensor for liquids and gases based on combinations of two principles.
Sensors and Actuators A: Physical, 73(1):7–13, 1999.
[32] Guilherme AL Araujo, Raimundo Freire, José F Silva, Amauri Oliveira, and
Emerson F Jaguaribe. Breathing flow measurement with constant temperature
hot-wire anemometer for forced oscillations technique. In Instrumentation and
Measurement Technology Conference, 2004. IMTC 04. Proceedings of the 21st
IEEE, volume 1, pages 730–733. IEEE, 2004.
[33] John G Webster. Medical instrumentation-application and design. Journal of
Clinical Engineering, 3(3):306, 1978.
[34] Alick Hobbes. A comparison of methods of calibrating the pneumotachograph.
British Journal of Anaesthesia, 37(12):987–987, 1965.
[35] PJ Chowienczyk and CP Lawson. Pocket-sized device for measuring forced
expiratory volume in one second and forced vital capacity. BMJ, 285(6334):
15–17, 1982.
[36] KamilYunus Özkaya and Mustafa Ilker Beyaz. An investigation on the electro-
magnetic design optimization of rotary micromachines with double-layer per-
manent magnets. Sensors and Actuators A: Physical, 222:335–340, 2015.
94
Page 115
[37] WHO. Chronic respiratory diseases, asthma, 2013. URL http://www.who.
int/mediacentre/factsheets/fs307/en/. [Last accessed on 2016-
02-10].
[38] Cope with asthma. What is a peak flow meter, 2010. URL http://www.
copewithasthma.com/what-is-a-peak-flow-meter/. [Last ac-
cessed on 2016-03-4].
[39] Zuzana Šnajberková. Physiotherapy for bronchial asthma,
2014. URL https://www.google.com.tr/url?
sa=i&rct=j&q=&esrc=s&source=images&cd=&ved=
0ahUKEwi-zqCR8rLLAhVqAZoKHcMiDikQ5TUICQ&url=https%
3A%2F%2Fis.cuni.cz%2Fwebapps%2Fzzp%2Fdownload%
2F130127740&psig=AFQjCNHhaWDcJN6oVxzZmUm1utbnZJRHxg&
ust=1457535044986202. [Last accessed on 2015-03-4].
[40] Martin R Miller, JATS Hankinson, V Brusasco, F Burgos, R Casaburi, A Coates,
R Crapo, P Enright, CP Van der Grinten, P Gustafsson, et al. Standardisation of
spirometry. Eurrespir J, 26(2):319–38, 2005.
[41] Peter Breen. Stand-alone circle circuit with co2 absorption and sensitive spirom-
etry for measurement of pulmonary uptake, October 14 2003. US Patent App.
10/530,603.
[42] David M Shade. Design of respiratory devices in biomedical engineers’ hand-
book. McGraw-Hill, 2003.
[43] welchallyn. Wa/schiller spirometry sales sheet, 2009. URL http://goo.
gl/G2s50c. [Last accessed on 2016-02-10].
[44] MDSpiro. Simple screening spirometer, 2016. URL https://mdspiro.
com/spirocheck-spirometer?search=SpiroCheck. [Last ac-
cessed on 2016-02-10].
[45] cardiacdirect.
[46] R Alejos-Palomares, J Manuel Ramirez Cortes, and N Domínguez-Martinez.
Digital spirometer with labview interface. In Electronics, Communications and
95
Page 116
Computers, 2008. CONIELECOMP 2008, 18th International Conference on,
pages 105–110. IEEE, 2008.
[47] Vivek Agarwal and NCS Ramachandran. Design and development of a low-cost
spirometer with an embedded web server. International journal of biomedical
engineering and technology, 1(4):439–452, 2008.
[48] Jeremy Glynn, Jeremy Schaefer, Andrew Bremer, Andrew Dias, David
Van Sickle, and Mitchell Tyler. Low-cost spirometer, 2009.
[49] Sergio Silvestri and Emiliano Schena. Micromachined flow sensors in biomed-
ical applications. Micromachines, 3(2):225–243, 2012.
[50] Hans H Bruun. Hot-wire anemometry: principles and signal analysis. Measure-
ment Science and Technology, 7(10):null, 1996.
[51] MA Ardekani and M Masoudi Motlagh. Ordinary hot-wire/hot-film method for
spirography application. Measurement, 43(1):31–38, 2010.
[52] Adam Huang, James Lew, Yong Xu, Yu-Chong Tai, and Chih-Ming Ho. Mi-
crosensors and actuators for macrofluidic control. Sensors Journal, IEEE, 4(4):
494–502, 2004.
[53] Peng Liu, Rong Zhu, and Ruiyi Que. A flexible flow sensor system and its
characteristics for fluid mechanics measurements. Sensors, 9(12):9533–9543,
2009.
[54] JJ Van Baar, RJ Wiegerink, TSJ Lammerink, GJM Krijnen, and M Elwenspoek.
Micromachined structures for thermal measurements of fluid and flow parame-
ters. Journal of micromechanics and microengineering, 11(4):311, 2001.
[55] Lidai Wang, Shenshu Xiong, and Zhaoying Zhou. Miniature airspeed meter
based on mems pressure sensor. QinghuaDaxueXuebao/Journal of Tsinghua
University(China), 45(8):1066–1068, 2005.
[56] John Webster. Medical instrumentation: application and design. John Wiley &
Sons, 2009.
[57] AFT Hobbes. A comparison of methods of calibrating the pneumotachograph.
British journal of anaesthesia, 39(11):899–907, 1967.
96
Page 117
[58] Luis Carretié, Jaime Iglesias, and Pedro Aguilar. Photoelectric-helicoidal
spirometer. Behavior Research Methods, Instruments, & Computers, 29(4):
582–585, 1997.
[59] JL McShane. Ultrasonic flowmeters. In Flow: Its measurement and control in
science and industry, volume 1, pages 897–915, 1974.
[60] Haya Hasan, Basel Safieh, Fadi Aloul, and Assim Sagahyroon. Diagnosing copd
using mobile phones. 2015.
[61] Omar Yahya and Miad Faezipour. Automatic detection and classification of
acoustic breathing cycles. In American Society for Engineering Education
(ASEE Zone 1), 2014 Zone 1 Conference of the, pages 1–5. IEEE, 2014.
[62] Ahmad Abushakra and Miad Faezipour. Augmenting breath regulation using a
mobile driven virtual reality therapy framework. Biomedical and Health Infor-
matics, IEEE Journal of, 18(3):746–752, 2014.
[63] Ahmad Abushakra and Miad Faezipour. Lung capacity estimation through
acoustic signal of breath. In Bioinformatics & Bioengineering (BIBE), 2012
IEEE 12th International Conference on, pages 386–391. IEEE, 2012.
[64] Andrew S Holmes, Guodong Hong, and Keith R Pullen. Axial-flux permanent
magnet machines for micropower generation. Microelectromechanical Systems,
Journal of, 14(1):54–62, 2005.
[65] S Das, DP Arnold, I Zana, JW Park, JH Lang, and MG Allen. Multi-watt electric
power from a microfabricated permanent-magnet generator. In Micro Electro
Mechanical Systems, 2005. MEMS 2005. 18th IEEE International Conference
on, pages 287–290. IEEE, 2005.
[66] Mustafa Ilker Beyaz, B Hanrahan, J Feldman, and R Ghodssi. An inte-
grated electromagnetic micro-turbo-generator supported on encapsulated mi-
croball bearings. In Micro Electro Mechanical Systems (MEMS), 2012 IEEE
25th International Conference on, pages 1209–1212. IEEE, 2012.
[67] Paul C-P Chao, CI Shao, CX Lu, and CK Sung. A new energy harvest system
with a hula-hoop transformer, micro-generator and interface energy-harvesting
circuit. Microsystem technologies, 17(5-7):1025–1036, 2011.
97
Page 118
[68] P. Verdonck, M. Van Cauwenberghe, A. Phommahaxay, R.C. Teixeira, and
N. Tutunjyan. Method for etching 3d structures in a semiconductor substrate,
including surface preparation, 2010. URL https://www.google.com/
patents/US20100216308. US Patent App. 12/711,544.
[69] Akın Aydemir. Deep-trench RIE Optimization for High Performance MEMS
Microsensors. PhD thesis, Citeseer, 2007.
[70] Pradeep Dixit and Jianmin Miao. Effect of sf6 flow rate on the etched surface
profile and bottom grass formation in deep reactive ion etching process. In
Journal of Physics: Conference Series, volume 34, page 577. IOP Publishing,
2006.
98
Page 119
APPENDIX A
DETAILED PROCESS TRAVELERS
‚ Photolithography with AZ4533 (4µm)
– Cleaning:
˚ Acetone 10 min
˚ Isopropanol 5 min
– Spin coating:
˚ HMDS: 40 sec 4000 rpm 2000 rpm/sec
˚ AZ4533: 30 sec 2000 rpm 1000 rpm/sec
– Soft bake: 100˝c 13 min
– UV exposure: 110 mJ/cm2
– Developer: AZ400K:Deionized water 1:4, 7 min
– Hard bake: 140˝c 5 min
‚ Photolithography with AZ5214 (1.4µm)
– Cleaning:
˚ Acetone 10 min
˚ Isopropanol 5 min
– Spin coating:
˚ HMDS: 40 sec 4000 rpm 2000 rpm/sec
˚ AZ5214: 40 sec 4000 rpm 2000 rpm/sec
– Soft bake: 110˝c 75 sec
– UV exposure: 40 mJ/cm2
99
Page 120
– Developer: AZ400K:Deionized water 1:4, 40 se
‚ Photolithography with IR5214 (1.4µm)
– Cleaning:
˚ Acetone 10 min
˚ Isopropanol 5 min
– Spin coating: AZ5214: 40 sec 4000 rpm 2000 rpm/sec
– Soft bake: 110˝c 75 sec
– UV exposure: 30 mJ/cm2
– Reversal bake: 120˝c 75 sec
– Flood exposure: 250 mJ/cm2
– Developer: AZ726 MIF 40 sec
‚ Photolithography with AZ9260 (15µm)
– Cleaning:
˚ Acetone 10 min
˚ Isopropanol 5 min
– Spin coating:
˚ HMDS: 40 sec 4000 rpm 2000 rpm/sec
˚ AZ9260:
¨ 1st: 3 sec 300 rpm 1000 rpm/sec
¨ 2nd: 80 sec 900 rpm 1500 rpm/sec
– Soft bake: 110˝c 8 min
– UV exposure: 1500 mJ/cm2
– Developer: AZ400K:Deionized water 1:4 8 min
‚ Photolithography with SU-8 3005 (5µm)
– Cleaning:
˚ Acetone 10 min
˚ Isopropanol 5 min
100
Page 121
– Spin coating:
˚ SU8:
¨ 1st: 10 sec 500 rpm 100 rpm/sec
¨ 2nd: 30 sec 4000 rpm 300 rpm/sec
– Soft bake: 95˝c 4 min
– UV exposure: 150 mJ/cm2
– Post exposure bake (PEB): 95˝c 2 min
– Developer: SU-8 developer 4 min
‚ Thermal Deposition of Cu
– Pressure: 5µTorr
– Tooling factor: 85
– Deposition rate: 0.8 A˝/sec
‚ Oxygen plasma:
– O2 flow rate: 30 sccm
– N2 flow rate: 5 sccm
– power: 450 W
– Duration: 15 min
– chamber temperature: 30˝c
– substrate temperature: 30˝c
‚ Deep Reactive Ion Etching
– Etch cycle:
˚ Gases: SF6: 125sccm, O2: 13sccm
˚ Power: Coil: 600W, Platen: 20W
˚ Cycle time: 10 seconds
– Passivation cycle:
˚ Gases: C4F8: 80 sccm
˚ Power: Coil: 600W, Platen: 0W
101
Page 122
˚ Cycle time: 7 seconds
‚ Metal Sputtering (Cr and Cu):
– Cr Deposition:
˚ AC Power: 150W, Time: 20 min, Ar flow rate: 70 sccm, Pressure:
20mTorr
– Cu Deposition:
˚ DC Power: 150W, Time: 17 min, Ar flow rate: 50 sccm, Pressure:
20mTorr
102