A new method to determine the mixing state of light absorbingcarbonaceous using the measured aerosol optical properties andnumber size distributions
N. Ma1, C. S. Zhao1, T. Muller2, Y. F. Cheng3, P. F. Liu1, Z. Z. Deng4, W. Y. Xu1, L. Ran1, B. Nekat2,D. van Pinxteren2, T. Gnauk2, K. M uller2, H. Herrmann2, P. Yan5, X. J. Zhou1,5, and A. Wiedensohler2
1Department of Atmospheric and Oceanic Sciences, School of Physics, Peking University, Beijing, China2Leibniz Institute for Tropospheric research, Leipzig, Germany3College of Environmental Sciences and Engineering, Peking University, Beijing, China4Key Laboratory of Middle Atmosphere and Global Environment Observation, Institute of Atmospheric Physics, ChineseAcademy of Sciences, Beijing, China5Chinese Academy of Meteorological Sciences of CMA, Beijing, China
Received: 13 July 2011 – Published in Atmos. Chem. Phys. Discuss.: 7 October 2011Revised: 12 January 2012 – Accepted: 22 January 2012 – Published: 2 March 2012
Abstract. In this paper, the mixing state of light absorbingcarbonaceous (LAC) was investigated with a two-parameteraerosol optical model and in situ aerosol measurements at aregional site in the North China Plain (NCP). A closure studybetween the hemispheric backscattering fraction (HBF) mea-sured by an integrating nephelometer and that calculated witha modified Mie model was conducted. A new method wasproposed to retrieve the ratio of the externally mixed LACmass to the total mass of LAC (rext-LAC) based on the as-sumption that the ambient aerosol particles were externallymixed and consisted of a pure LAC material and a core-shellmorphology in which the core is LAC and the shell is a lessabsorbing material. A Monte Carlo simulation was appliedto estimate the overall influences of input parameters of thealgorithm to the retrievedrext-LAC . The diurnal variation ofrext-LAC was analyzed and the PartMC-MOSAIC model wasused to simulate the variation of the aerosol mixing state. Re-sults show that, for internally mixed particles, the assump-tion of core-shell mixture is more appropriate than that ofhomogenous mixture which has been widely used in aerosoloptical calculations. A significant diurnal pattern of the re-trievedrext-LAC was found, with high values during the day-time and low values at night. The consistency between theretrievedrext-LAC and the model results indicates that the di-urnal variation of LAC mixing state is mainly caused by thediurnal evolution of the mixing layer.
1 Introduction
Atmospheric aerosols influence the Earth’s radiative balancedirectly by scattering and absorbing solar radiation, and in-directly by changing the albedo, cloud amount, lifetime ofclouds, and precipitations (Twomey, 1974; Albrecht, 1989;Charlson et al, 1992; Rosenfeld, 1999, 2000; Zhao et al.,2006). The largest uncertainty in estimating the radiativeforcing results from aerosols (IPCC, 2007). Light absorbingcarbonaceous (LAC), as one of the most important compo-nents of aerosols, is considered as the dominant absorber ofvisible solar radiation in the atmosphere (Ramanathan andCarmichael, 2008), and hence has a positive radiative forc-ing on the climate system (Jacobson, 2001). Due to the lackof horizontal and vertical distributions of LAC, insufficientemission inventory and the rather limited knowledge on themixing state of LAC, the quantity of positive radiative forc-ing caused by LAC is yet uncertain.
The LAC has been assigned various names in the lit-erature, such as “black carbon (BC)”, “elemental carbon(EC)”, and “soot”. “BC” is mostly used to emphasize itslight-absorbing property. However, following Bond andBergstrom (2006), “LAC” is used in the current study.
LAC is emitted into the ambient atmosphere by fossil fuel(diesel and coal) combustion, open biomass burning (as-sociated with deforestation and crop residue burning), and
Published by Copernicus Publications on behalf of the European Geosciences Union.
2382 N. Ma et al.: A new method to determine the mixing state of light
cooking with biofuels (Ramanathan and Carmichael, 2008).The freshly emitted LAC often stays unmixed, while thereare many processes that cause LAC to mix with other chem-ical components, such as coagulation with other particles,condensation of vapors onto the surface forming a coatinglayer, reactions with gases, and cloud processes. The mix-ing state of LAC is quite complicated and the optical proper-ties of LAC are very sensitive to the mixing state (Khalizovet al., 2009). It is suggested that different mixing states ofLAC affect its global direct radiative forcing by a factor of2.9 (+0.27 Wm−2 for an external mixture, +0.54 Wm−2 for acore-shell mixture with LAC core, and +0.78 Wm−2 for ho-mogeneously internal mixture) (Jacobson, 2000, 2001).
Winkler (1973) suggested a definition of external and in-ternal mixture of aerosols. For an external mixture, differ-ent compounds are separated as different particles, while inan internal mixture, all particles consist of the same mix-ture of compounds. The external and internal mixtures aretwo limiting cases with all intermediate states between themto be possible. Three conceptual models are usually usedto describe the mixing state of LAC and other aerosol com-ponents: external mixture, homogeneously internal mixture,and core-shell internal mixture (a LAC core surrounded by awell-mixed less absorbing shell) (Seinfeld and Pandis, 1998;Jacobson, 2001). Most of the models for estimating the di-rect aerosol radiative forcing, as well as aerosol optical clo-sure studies (Wex et al., 2002b; Mallet et al., 2004; Chenget al., 2006; Ma et al., 2011) are based on the assump-tion of external mixture or homogeneously internal mixturefor LAC and less absorbing components. However, manystudies have suggested that internally mixed LAC is usuallycoated with a shell of less absorbing component to form acore-shell structure rather than “well mixed”. Images ob-tained from TEM supported that LAC particles could becomecoated once emitted (Katrinak et al., 1992, 1993; Martins etal., 1998). Volatility tandem DMA (differential mobility an-alyzer) measurements showed that the majority of particlesare comprised of a non-volatile core and a volatile outer layerduring heavily polluted days (Wehner et al., 2009). Manystudies also suggested that the use of a single particle opticalmodel assuming an absorbing spherical core surrounded bya mantle of non-absorbing material is appropriate in the es-timation of the aerosol direct radiative forcing (Jacobson etal., 2000, 2001; Chandra et al., 2004; Bond and Sun, 2005).
Many efforts have been undertaken to investigate howLAC is mixed with other aerosol components. In general,the mixing state of LAC can be obtained through two kindsof methods: direct measurements and inferences via opticalclosure studies.
A transmission electron microscopy (TEM) can be usedfor single particle analysis. The mixing state of soot particleswas observed by Katrinak et al. (1992, 1993) and Clarke etal. (2004) with the TEM. A Single-particle soot photometercan be used to distinguish the coated soot particles (Schwarzet al., 2008) by measuring the incandescence and scatter-
ing at infrared wavelengths of single particles. Moffet etal. (2008, 2009) used an aerosol time-of-flight mass spec-trometer to yield the mixing state of soot in real-time, and adiurnal variation was found. In recent years, Tandem DMA-based techniques were widely applied in aerosol measure-ments. A high humidity tandem DMA (Hennig et al., 2005)can provide size-resolved fractions of externally mixed hy-drophobic particles (Liu et al., 2011), while a volatility tan-dem DMA can be used to yield size-resolved fractions ofparticles with different volatility that usually indicate differ-ent mixing states of LAC (Wehner et al., 2009; Cheng et al.,2009).
Besides the direct measurements, some studies inferredthe LAC mixing state via optical closure studies. Most ofthem were based on the Mie model and the dependence ofmass absorption efficiency of LAC on its mixing state. Mal-let et al. (2004) calculated the single scattering albedo (ω)
from in situ aerosol data with the assumption of external andhomogeneously internal mixture for LAC and other compo-nents, and compared the two calculatedω with the valuesof Aerosol Robotic Network (AERONET) sun-photometermeasurements. They found that LAC was externally mixedin the urban area. Dey et al. (2008) did a similar optical clo-sure study in India to infer the mixing states and made an im-provement by assuming six cases of aerosol mixing state inthe calculation. They found that the probable aerosol mixingstate had seasonal variations. Based on in situ aerosol micro-physical and chemical measurements and a two-parameteraerosol optical model, Cheng et al. (2006) developed an in-ternally consistent algorithm to yield the ratio of externallymixed LAC to the total mass of LAC. The aerosol absorp-tion coefficients were calculated using aerosol particle num-ber size distributions (PNSDs) and size-resolved chemicalinformation with a variable mass ratio of externally mixedLAC. The best estimation of the mass ratios was derived fromminimizing the difference between the calculated absorptioncoefficients and the values measured by MAAP (multi-angleabsorption photometer, Petzold et al., 2002). However, dueto the low temporal resolution of the aerosol chemical com-position data, only two ratio values could be retrieved foreach day.
With the rapid growth of population and economy inChina, emissions of anthropogenic pollutants have increaseddramatically in the past several decades. The widespreadconsumption of coal and biomass fuels makes China a signif-icant source region of LAC. It has been reported that the LACamount emitted in China make up about one fourth of glob-ally emitted anthropogenic LAC (Cooke et al., 1999; Streetet al., 2001; Bond et al., 2004). Megacities in China suffersevere air pollution (Ran et al., 2009; Liu et al., 2009), mean-while influencing the neighboring regions. One of the mostpolluted areas in the world is the North China Plain (NCP)region (van Donkelaar et al., 2010), where two of the mostdensely populated megacities in China, Beijing and Tianjin,are located (Xu et al., 2011). In such highly polluted areas
N. Ma et al.: A new method to determine the mixing state of light 2383
with high aerosol loading and concentrations of gases pol-lutants, aerosol aging processes may be quite different fromwhat has been previously recognized, thus the mixing stateof LAC might be much more complicated. However, studiesaddressing the mixing state of LAC in this region are cur-rently very limited (Cheng et al, 2006; Wehner et al., 2009).
In this paper, an optical closure study was performed us-ing in situ aerosol data measured at a regional site in the NCP.The hemispheric backscattering fractions (HBFs) calculatedwith three assumed LAC mixing states were compared withthe measured values. A new algorithm was applied to inferthe mass ratio of externally mixed LAC to the total mass ofLAC (rext-LAC), assuming the mixing state of LAC as par-tially externally mixed and partially core-shell mixed.
In Sect. 2, the site and instruments of the campaign areintroduced. The new method for inferring therext-LAC is de-scribed in Sect. 3. Sect. 4 presents the retrievedrext-LAC , athree-day case study, as well as the uncertainty study. Thesummary and conclusions are presented in Sect. 5.
2 Measurements
2.1 The field site
The HaChi (Haze in China) campaign took place in sum-mer 2009 (12 July to 14 August, 193–226 DOY) in Wuqing,a suburban site in the Northern NCP and well representa-tive of regional anthropogenic aerosols. The Wuqing townis situated between two megacities: Beijing (16 million in-habitants, 80 km away in the NW of Wuqing) and Tianjin(10 million inhabitants, 30 km away in the SSW of Wuqing)with about 0.8 million inhabitants. The map of the site andthe area around can be found in Xu et al. (2011). During thecampaign, particle number size distributions, aerosol lightscattering coefficients, as well as LAC mass concentrationswere continuously measured.
The measurements were conducted in a container, inwhich the temperature was maintained at 22◦C. Air sampleswere collected with a PM10 inlet (16.67 l min−1) installed onthe top of a stainless steel tube with a diameter of 3/4 inch(19 mm) and 7 m a.g.l. The samples were split into severalflows inside the container, passing through stainless steel tub-ing, to different instruments. The residence time for samplesin the inlet system was about 5 s. An automatic aerosol dif-fusion dryer (Tuch et al., 2009) was installed upstream allof the instruments to keep the relative humidity (RH) of themeasured sample below 30 %.
2.2 Instrumentation
A Twin Differential Mobility Particle Sizer (TDMPS, IfT,Leipzig, Germany) (Birmili et al., 1999) and an Aerody-namic Particle Sizer (APS Model 3320, TSI, Inc., Shore-view, MN USA) were employed to measure PNSDs. Bothwere operated at RH< 30 %. The raw TDMPS and APS datawere inverted and merged to yield the PNSDs with the rangeof equivalent diameter from 3 nm to 10 µm. Details can befound in Ma et al. (2011). The temporal resolution of thePNSD data was 10 min.
The scattering coefficients (σsp) and hemisphericbackscattering coefficients (σbsp) for dry aerosols weremeasured by a total scatter/back scatter, integrating neph-elometer at the wavelengths of 450, 550 and 700 nm (TSI,Inc., Shoreview, MN USA, Model 3563) (Anderson et al.,1996, 1998), with a temporal resolution of 1 min. The neph-elometer was calibrated beforehand using CO2 (Anderson etal., 1996). Particle free air checks were performed once aday.
A multi-angle absorption photometer (MAAP Model5012, Thermo, Inc., Waltham, MA USA) was employed tomeasure the absorption coefficients (σap) for dry particleswith a sampling frequency of 1 min. The instrument deter-minesσap via simultaneous measurements of light (637 nm)passing through its filter and scattered back from particlesaccumulated on its surface. It operates at two detection an-gles to resolve the influence of light-scattering aerosol com-ponents on the angular distribution of the back-scattered ra-diation (Petzold and Schonlinner, 2004). The MAAP deter-mines absorption coefficients directly and converts them toLAC mass concentrations with an assumed mass absorptionefficiency (MAE) of 6.6 m2g−1. This constant has been val-idated by the comparison between the impactor-derived el-emental carbon mass and the MAAP measurements, whichwill be discussed in Sect. 4.4.2.
3 Methodology
3.1 Two-parameter aerosol model
A simplified aerosol model (Wex et al., 2002b; Cheng etal., 2006) was applied to aerosol optical calculations in thiswork. In the model, aerosol components are divided intotwo classes in terms of their optical properties: the light-absorbing component (i.e. LAC) and less absorbing compo-nents (comprising inorganic salts and acids such as sulfates,nitrates, ammoniums, as well as most of the organic com-pounds). Although the chemical properties of numerous lessabsorbing compounds might be different, their refractive in-dices are basically the same, implying that the aerosol op-tical properties are not sensitive to their ratios. Therefore,the aerosol optical properties can be well represented withthe two-parameter assumption in the Mie calculation (Wex,
2384 N. Ma et al.: A new method to determine the mixing state of light
2002a). This aerosol model is also widely used in aerosol di-rect radiative forcing estimations (Myhre et al., 1998; Krist-jansson, 2002), but usually only LAC and sulfates were in-cluded.
The refractive indices of LAC and less absorbing compo-nents in the aerosol model were selected from related litera-tures (Ouimette and Flagan, 1982; Hasan and Dzubay, 1983;Sloane, 1984; Seinfeld and Pandis, 1998; Covert et al., 1990;Tang and Munkelwitz, 1994). The real part of the refrac-tive index for LAC was chosen to be 1.80, and the imaginarypart was set to be 0.54i, which was the average value forthe wavelengths of 450, 550 and 700 nm (d’ Almeida et al.,1991). The refractive index of the less absorbing componentswas set to be 1.55–1e–7i.
For the mixing state of LAC, new evidences support-ing the core-shell structure of LAC aerosols have beenfound in the simulation of nephelometer measurements. Thenephelometer-measured HBF was simulated based on threeassumed mixing states of LAC: external mixture, homoge-neously internal mixture, and core-shell mixture. The HBFcalculated with the assumption of core-shell mixture givesthe highest results, which are about 30 % higher than thosecalculated with the assumption of external mixture. Whilethe HBF calculated with the assumption of homogeneouslyinternal mixture are the lowest, about 10 % lower than thosecalculated with the assumption of external mixture. The HBFgiven by nephelometer are always between the values cal-culated with the assumptions of external mixture and core-shell mixture. It definitely suggests that the sampled aerosolsmight be partially externally mixed and partially core-shellmixed rather than externally mixed and homogeneously in-ternally mixed. More details will be discussed in Sect. 4.1.
Consequently, aerosols are divided into two kinds in thisstudy: the completely externally mixed LAC and a LAC coresurrounded by a less absorbing component shell. To quan-tify the mixing state of LAC,rext-LAC is defined as the massfraction of externally mixed LAC (Mext-LAC) in total LAC(MLAC):
rext-LAC =Mext-LAC
MLAC(1)
If all LAC is externally mixed and there is no core insidethe less absorbing component,rext-LAC is 1; while rext-LACis 0 if all LAC is covered by less absorbing component. Foratmospheric aerosols,rext-LAC varies between 0 and 1.
3.2 Mie code
To simulate the measurements of TSI 3563 nephelometer,a modified BHMIE code and a modified BHCOAT code(Bohren and Huffman, 1983; Cheng et al., 2009) are utilizedfor homogeneous spherical particles and core-shell mixedspherical particles, respectively.
In the Mie theory (Mie, 1908), the scattering efficiency(Qsp) and the hemispheric back scattering efficiency (Qbsp)
can be calculated by integrating the intensity function|S(θ,x,m)| from 0◦ to 180◦ and from 90◦ to 180◦, respec-tively:
Qsp,bsp=1
x2
∫θ
|S(θ,x,m)|2sin θdθ (2)
where,x=πDp/λ. Dp is the volume equivalent diameter ofparticles. λ is the wavelength of radiation.θ is the scat-tering angle. However, the integrating angle of TSI 3563nephelometer is from 7◦ to 170◦ for scattering and from 90◦
to 170◦ for hemispheric backscattering, respectively. Andthe light source of the nephelometer is not strictly Lamber-tian and shows a non-ideal angular response (Anderson et al.,1996). These two effects are considered in the modified BH-MIE code and BHCOAT code. The sinθ term in Eq. (2) isreplaced by angular sensitivity curvesf(θ)sp andf(θ)bsp, de-rived from a characterization study of TSI 3563 nephelome-ter (Anderson et al., 1996). Then theσ sp andσ bsp could becalculated following:
σsp, bsp=
∫Dp
1
x2
∫θ
|S(θ,x,m)|2f (θ)sp, bspdθ
·
(π
4D2
p
)·N
(logDp
)·d logDp (3)
whereN(logDp) is the PNSD.
3.3 Retrieval algorithm
As shown in Sect. 4.1, the HBF measured by the nephelome-ter is always between the values calculated with assumptionsof external mixture and core-shell mixture of LAC. The cal-culated HBF is found to be sensitive torext-LAC . Therefore,based on the aerosol model described in Sect. 3.1, it is pos-sible to retrieverext-LAC by matching the measured HBF andthe HBF calculated from measured PNSD and LAC massconcentration with the modified Mie model.
The PNSD of externally mixed LAC particles and core-shell mixed particles, as well as the radii of the LAC core ofcore-shell mixed particles, are need to calculate the HBF. Fora givenrext-LAC , the PNSD of externally mixed LAC parti-cles can be calculated by
N(logDp
)ext-LAC = N
(logDp
)measure·fLAC ·rext-LAC (4)
where,N(logDp
)measureis the PNSD measured by TDMPS
and APS.fLAC is the volume fraction of LAC, which can becalculated by
N. Ma et al.: A new method to determine the mixing state of light 2385
where,MLAC, measureis the LAC mass concentration mea-sured by MAAP.ρLAC is the density of LAC, which isreported in literature with a range from 1.00 g cm−3 to2.00 g cm−3 (Sloane et al., 1983, 1984, 1991; Sloane andWolff, 1985; Ouimette and Flagan, 1982; Seinfeld and Pan-dis, 1998). A median value of 1.5 g cm−3 is used in thisstudy.
Accordingly, the PNSD of core-shell mixed particles canbe calculated as:
N(logDp
)core-shell= N
(logDp
)measure·(1−fLAC ·rext-LAC)(6)
Another critical parameter for calculating the optical proper-ties of core-shell mixed particles is the size of the LAC core.Core-shell mixed particles with the same diameter might dif-fer in the size of their cores. As a simplified optical aerosolmodel, the core-shell mixed particles with the same diame-ter are assumed to be the same in the size of the LAC core,which can be calculated as:
Dcore= Dp ·
(fLAC −fLAC ·rext-LAC
1−fLAC ·rext-LAC
) 13
(7)
As shown in Eqs. (4), (6) and (7), the input parameters of theMie model are the functions ofrext-LAC . Therefore, the HBFcalculated with the Mie model is a function ofrext-LAC . Thebest estimation ofrext-LAC is the one which minimizes thedifferences between the calculated HBF and the correspond-ing measured value. The deviationχ2 is quantified by linearleast squares in the form of:
χ2=
3∑i=1
(HBFcalc,i −HBFmeasure,i
HBFmeasure,i
)2
(8)
wherei denotes the three operation wavelengths of the TSI3563 nephelometer. HBFcalc,i is the HBF calculated withMie model, while HBFmeausre,i is the HBF measured bynephelometer. The relationship between measured and cal-culated HBF at 700 nm is quite different from that at 450 and550 nm. The measured HBF at 700 nm is too high, so mostof them are around the calculated values of core-shell mix-ture. Heintzenberg et al. (2006) performed a laboratory com-parison study for 12 commercial nephelometers. Comparedto calculated values, a systematic deviation of about –20 %was found forσ sp,700 nm of TSI 3563 nephelometer. Suchlarge underestimation ofσ sp,700 nm would lead to a signifi-cant overestimation of HBF at 700 nm. Thus, only the HBFat 450 and 550 nm are used here to retrieve therext-LAC .
During the entire period of the HaChi summer campaign,1-min-resolution data measured by nephelometer and MAAPwere averaged to match the time of the 10-min-resolutionPNSD records. Therext-LAC was subsequently retrieved byminimizing theχ2 defined in Eq. (8).
It should be noted that therext-LAC defined in Sect. 3.1 is aparameter in a simplified aerosol optical model and wouldonly be valid under some assumptions mentioned before.
The actual mixing state of aerosols in the atmosphere is farmore complicated beyond the model capabilities. Thus, theretrievedrext-LAC is an “effective parameter” and should notbe used for quantitative analysis for the mixing state of LAC.However, the retrievedrext-LAC can be considered as an in-dicator for the variation of LAC mixing state and used inaerosol optical calculations, which is of great value in the re-search of aerosol and the estimation of the direct radiativeforcing.
3.4 PartMC-MOSAIC model
The PartMC-MOSAIC model (Riemer et al., 2009) was ap-plied to simulate the diurnal variation of the mixing state ofLAC. The PartMC-MOSAIC is a stochastic particle-resolvedaerosol box model, capable of resolving the composition ofan individual particle. A Monte Carlo approach is used in thePartMC model to simulate the coagulation process stochas-tically. Emissions and dilutions within the lower free tro-pospheric above the nocturnal boundary layer on a regionalscale are also modeled in a stochastic manner. And a newaerosol chemistry model MOSAIC (Model for SimulatingAerosol interactions and Chemistry, Zaveri et al., 2008) iscoupled in the PartMC to simulate the gas- and particle-phase chemistry, particle phase thermodynamics, and dy-namic gas-particle mass-transfer in a deterministic manner.The PartMC-MOSAIC model can predict number, mass andcomposition distributions of the aerosol population.
4 Results and discussion
4.1 Calculated HBF based on the limiting mixing statesof LAC: a closure study
During the HaChi summer campaign, the PNSDs, LACmass concentrations, scattering and hemispheric backscatter-ing coefficients for dried aerosols were continuously mea-sured on-line. An optical closure study on aerosol scatter-ing and absorption coefficients has been conducted by Ma etal. (2011), which showed that the data are of high quality.The time series of aerosol volume concentrations, effectiveradii, LAC mass concentrations, as well as the LAC volumefractions for the whole period of the campaign are shown inFig. 1a and b. It can be seen that all of these parameters varygreatly with time, mainly in response to synoptic weathersystems. Diurnal cycles are also present during some peri-ods. The average aerosol volume concentration for the di-ameter range from 3 nm to 10 µm is 59.74 µm3cm−3, with a5th percentage value of 15.92 µm3cm−3and a 95th percent-age value of 137.49 µm3cm−3. The average aerosol effective
radius, defined asreff =∫ rmaxrmin
n(r)r3dr/∫ rmax
rminn(r)r2dr, is
185.15 nm, with a 5th percentage value of 151.14 nm and a95th percentage value of 229.07 nm. The average LAC massconcentration is 6.65 µg m−3, with a 5th percentage value of
2386 N. Ma et al.: A new method to determine the mixing state of light
0
50
100
150
200
Vol
ume
conc
. (µm
3 cm−
3 )
100
150
200
250
300
r eff (
nm)
0
10
20
30
LAC
mas
s co
nc. (
µgm
−3 )
0
0.05
0.1
0.15
0.2
0.25
LAC
vol
ume
frac
tion
200 205 210 215 220 2250.08
0.1
0.12
0.14
0.16
0.18
Day of year
HB
F @
550n
m
internalexternalcore−shellmeasured
Frequence
A
B
C D
Fig. 1. Time series of selected parameters during the HaChi summer campaign:(A) aerosol volume concentration, effective radius,(B) LACmass concentration, LAC volume fraction,(C) HBF measured by nephelometer and HBF calculated with three limiting mixing states of LACat the wavelength of 550 nm.(D) frequency distributions of measured and calculated HBF. All the data have been averaged correspondingto the time of TDMPS measurement with time resolution of 10 min.
1.59 µg m−3 and a 95th percentage value of 15.87 µg m−3.Futher details on aerosol optical properties for the HaChisummer campaign can be found in Ma et al. (2011).
To simulate the measurements of nephelometer, the HBFwas calculated with the Mie model and the aerosol model in-troduced in Sect. 3 based on the measured PNSDs and LACmass concentrations. The mixing state of LAC and less ab-sorbing component was also needed in the simulation. Sincethere was no information on the mixing state of ambientaerosols available, the HBF was calculated for three limit-ing mixing states of LAC: external mixture, homogeneouslyinternal mixture and core-shell mixture. Figure 1c shows thecalculation results at the wavelength of 550 nm, as well as theHBFs yielded from nephelometer measurements. Figure 1dpresents the frequency of each time series of HBFs in Fig. 1c.
It can be seen that the three calculated HBFs vary withtime, which is caused by the variations of PNSDs and LACmass concentrations. The relative standard deviations of cal-culated HBFs at 550 nm are respectively 5.2 %, 6.3 % and5.1 % for the three assumptions of LAC mixing state men-tioned above. However, it should be noted that the differ-ences between the three time series of calculated HBF aremore significant than the variations of each time series. Themean values of the three calculated HBF are shown in Ta-
ble 1. For 550 nm, the calculated HBF under the externalmixture assumption (HBFcalc,external) is 11.4 % higher thanthat under the homogeneously internal mixture assumption(HBFcalc, internal). The calculated HBF under the core-shellmixture assumption (HBFcalc,core-shell) is even 41.0 % higherthan that under the homogeneously internal mixture assump-tion. These differences are much higher than the variations ofeach time series caused by the variations of PNSDs and LACmass concentrations. Therefore, the calculated HBF is moresensitive to the mixing state of LAC rather than the variationsof PNSDs and LAC mass concentrations. This sensitivityof HBF provides an approach to retrieve the mixing state ofLAC, as described in Sect. 3.
In Fig. 1c, the purple dots denote the HBF yieldedfrom the nephelometer measurements (HBFneph), i.e. theratio of measured hemispheric backscattering coefficientsto measured scattering coefficients. If the widely-usedassumption that the atmospheric aerosol is a partial mixtureof externally mixed and homogeneously internally mixedparticles is appropriate, the HBFneph values should fallbetween the HBFcalc,external and the HBFcalc, internal. How-ever, for 550 nm, almost all of the HBFneph are higher thanthe HBFcalc,external and HBFcalc, internal, and distributed be-tween the HBFcalc,external and the HBFcalc,core-shell. Table 1
N. Ma et al.: A new method to determine the mixing state of light 2387
shows the averages of HBFcalc,external, HBFcalc, internal,HBFcalc,core-shell and HBFneph at the three operation wave-lengths of the TSI 3563 nephelometer. It can be seenthat the relationship of the calculated and measured HBF isHBFcalc,core-shell>HBFneph>HBFcalc,external>HBFcalc,internal.The HBFneph at 700 nm is higher than all of the calculatedones. This might be caused by the underestimation ofthe TSI 3563 nephelometer onσsp,700 nm, as mentioned inSect. 3.3.
The mixing state of atmospheric aerosols is considered asan intermediate state between external and internal (Winkler,1973). The internal mixture are usually treated as a homoge-neously internal mixture in aerosol optical calculations (Wexet al., 2002b; Mallet et al., 2004; Cheng et al., 2006). Inthat case, external mixture and homogeneously internal mix-ture are two limiting cases of mixing state. The aerosol op-tical properties calculated with the assumptions of externalmixture and homogeneously internal mixture should be theboundaries of the measured values. However, as presentedin this study, the HBFneph is significantly higher than boththe HBFcalc,external and HBFcalc, internal, and is close to theHBFcalc,core-shell. This means that the former assumptions ofLAC mixing state, which have been widely used in aerosoloptical calculations, are generally not appropriate. In theNCP, the ambient aerosols seem to be more similar to core-shell mixtures, rather than to homogeneously internal mix-tures. The aerosols can be considered as a partial mixture ofexternally and core-shell mixed particles.
4.2 Retrieved mixing state of LAC
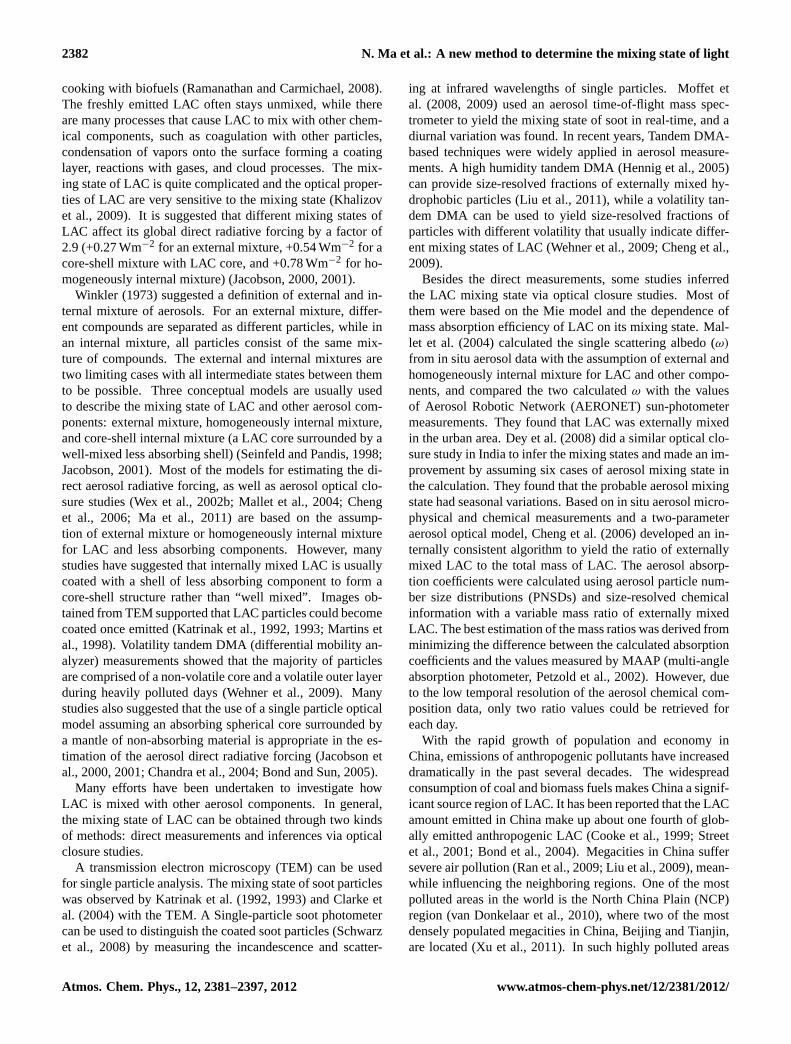
The rext-LAC was retrieved with the new method introducedin Sect. 3 for the whole period of the HaChi summer cam-paign. The time series ofrext-LAC is presented in Fig. 2b.The corresponding wind direction and wind speed measuredby an automatic weather station are illustrated in Fig. 2a.
For the whole period,rext-LAC varied between 0 and 1,with an average of 0.51± 0.21, indicating that the mixingstate of LAC is a combination of external and core-shell mix-ture. Pronounced variation can be found in the time series ofrext-LAC , reflecting the large variation of LAC mixing statewith time. Moreover, significant diurnal cycles ofrext-LACcan be discerned during some periods. The time-scale of themeasured variability can be also revealed by autocorrelationanalysis (Cheng et al., 2008). Figure 2d depicts the resultof the autocorrelation analysis for the entire time series ofrext-LAC . When1t = 24 h, The autocorrelation coefficient ofrext-LAC shows a peak with a value of about 0.3, indicatingthe existence of pronounced diurnal cycles in the variation ofrext-LAC .
The average diurnal variation ofrext-LAC is illustrated inFig. 2c, with error bar of one standard deviation. Consistentwith the result of the autocorrelation analysis, a pronounceddiurnal pattern can be found. Around midnight, the aver-agerext-LAC is around 0.58 and increases from 04:00 LT. A
Table 1. The average of calculated HBF under the assumptionsof externally, homogeneously internally and core-shell mixture, aswell as the averaged HBF measured by nephelometer.
maximum is reached at about 06:00 LT. And thenrext-LACdecreases rapidly after 08:00 LT with the minimum appear-ing in the afternoon. During the night, the averagerext-LACincreases again. This distinct diurnal pattern of averagerext-LAC reflects the diurnal variation of the mixing state ofLAC and less absorbing component. During the night, thehigh level ofrext-LAC indicates that the freshly emitted LAC,which is considered to be externally mixed with aged parti-cles, accumulates in the nocturnal boundary layer. The lowvalue of rext-LAC during daytime reflects the dominance ofcore-shell mixed particles in the boundary layer. Similar di-urnal pattern of aerosol mixing state was reported by Moffetand Prather (2009) and Liu et al. (2011).
4.3 Diurnal variation of LAC mixing state: a case study
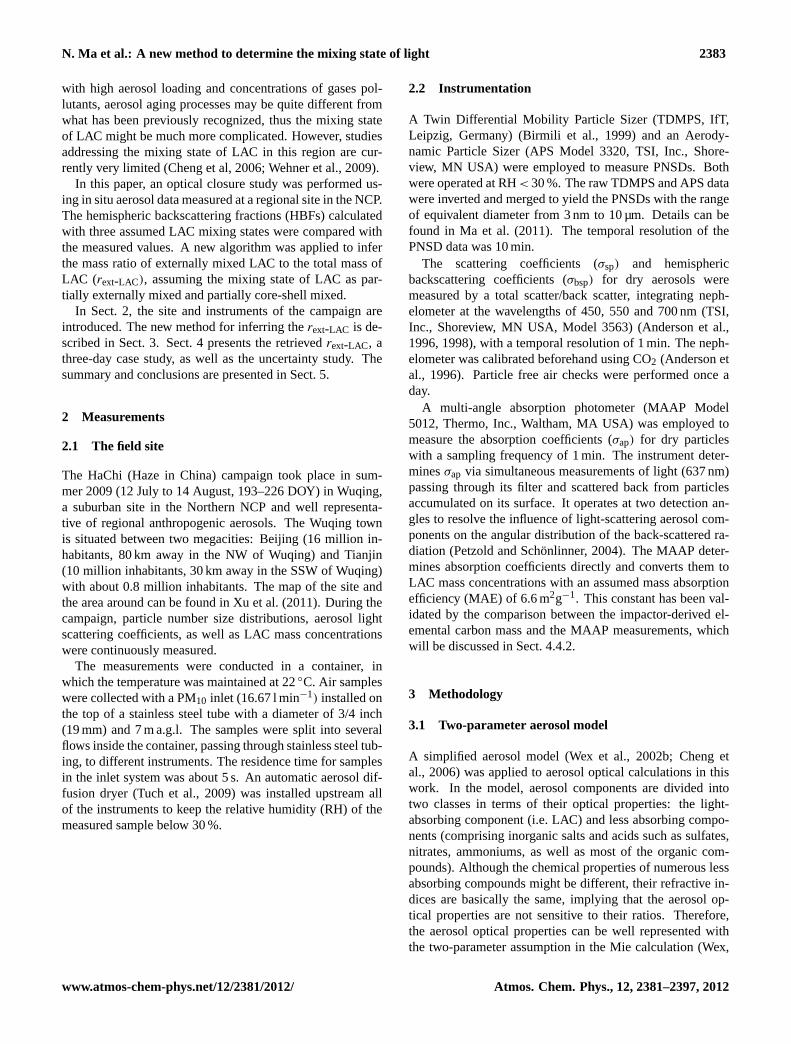
To better understand the diurnal pattern of therext-LAC re-trieved with this method, a period of 3 days (219-221 DOY)was selected for a case study. During this period, the syn-optic conditions were relatively stable, dominated by east-erly winds with speeds lower than 3 ms−1. The weather wascloud-free with no precipitation event occurred. Therefore,the aerosols in the boundary layer were mostly from localand regional emissions sources. With no obvious pollutanttransport under this meteorological situation, this period wasappropriate for investigating the diurnal variation of LACmixing state caused by the evolution of boundary layer, emis-sions and corresponding chemical processes.
The time series of retrievedrext-LAC during this period ispresented in Fig. 3b. A similar diurnal pattern, with highrext-LAC during night and lowrext-LAC during daytime, canbe found in all of the three days.
During the whole period of the campaign, a high humiditytandem differential mobility analyser (HHTDMA, Hennig etal., 2005) was used to measure the hygroscopic growth fac-tor (GF) at relative humidities of 90 %, 95 % and 98.5 % forparticles with dry diameters of 50 nm, 100 nm, 200 nm and250 nm, respectively. More details on the HHTDMA mea-surement can be found in Liu et al. (2011). The probabilitydistributions of GF usually showed a distinct bimodal pat-tern, consisting of a dominant more-hygroscopic (MH) modeand a smaller nearly-hydrophobic (NH) mode. During thewhole period, a strong diurnal pattern of the number fractionof these two modes was found, indicating the diurnal varia-tion of the aerosol mixing state. For all of the four measured
2388 N. Ma et al.: A new method to determine the mixing state of light
sizes, the number fraction of NH particles remains at a highlevel during the night and begins to decrease at 06:00 LT.During the daytime, the number fraction of NH stays at lowlevel. And a rapid rise occurs around 18:00 LT. The highnumber fraction of NH particles during the night indicatesthat the freshly emitted hydrophobic particles have accumu-lated in the surface layer, apparently externally mixed withthe hygroscopic particles. During the daytime, the low frac-tion of NH mode indicates that aged aerosol was dominantin the atmosphere near the surface (Liu et al., 2011). Thisresult yielded from HHTDMA is well consistent with the di-urnal variation of retrievedrext-LAC .
In Liu’s (2011) work, a stochastic, particle-resolvedaerosol model PartMC-MOSAIC was applied to simulate theaerosol hygroscopicity for the same period as in this study. Agood agreement between the model results and the measure-ments indicates that the model can be well representative ofthe hygroscopicity of ambient aerosols. To investigate howthe chemical and meteorological processes affect the diurnalvariation of the mixing state of LAC, the same model was ap-plied in this study. The simulated scenario represented a La-grangian air parcel over a large megacity region. The modelwas initialized 12 h before the simulation period for modeladjustment. The mixing layer height was set according tothe boundary layer height simulated by the Weather Researchand Forecasting (WRF) model. The temperature and wa-ter vapour mixing ratio were set based on the measurement.The initial gas phase concentrations and emission rates wereset according to Riemer et al. (2009). Based on the PNSDsmeasured by TDMPS and APS, a tri-modal distribution wasused as the initial PNSD. The initial aerosols were assumedto consist of (NH4)2SO4, primary organic aerosol and LAC,with mass fractions of 60 %, 35 % and 5 %, respectively. Theaerosol emission pattern and chemical composition was setaccording to Riemer et al. (2009), while some modificationwas made to better represent the pollution in the North ChinaPlain. More details about the parameter settings of the modelcan be found in Liu et al. (2011).
The model results are shown in Fig. 3c. The mass ofthe modelled externally mixed LAC is compared to the to-tal mass of the modelled LAC to yield therext-LAC,model. Itcan be seen that the simulatedrext-LAC,model for all the sizeranges match well with the retrievedrext-LAC , indicating thatthe variation of the modelled result is well consistent withthat of retrievedrext-LAC . This means the diurnal pattern ofretrievedrext-LAC can be explained by the mechanisms in-cluded in the model, such as emissions, aging processes andthe entrainment by the increase of the mixing layer height.During the night, the freshly emitted LAC aerosols accumu-late in the shallow nocturnal boundary layer and the agingprocesses are relatively weak. Under such a condition, thefraction of the externally mixed LAC to the total LAC massis relatively high. As illustrated in Fig. 3c, more than 80 %of LAC mass is externally mixed for the particles smallerthan 125 nm. In the morning during 07:00 LT to 12:00 LT,
the development of the mixing layer causes a downward en-trainment of aged aerosol from aloft, resulting in a decreaseof the fraction of externally mixed LAC. The aging processesmay also make contributions. Only less than 40 % of LAC isexternally mixed at noon. The fraction of externally mixedLAC remains low until the evening. The collapse of the mix-ing layer and the high emission rate due to rush hours causea rapid increase in the fraction of externally mixed LAC,and the fraction remains high in the stable shallow nocturnalboundary layer. A sensitivity study of the modelled aerosolmixing state to the chemical and meteorological processeswas performed by Liu et al. (2011). The results suggestedthat the diurnal evolution of the mixing layer was decisive inexplaining the diurnal cycle of aerosol mixing state. Otherprocesses such as condensation, photochemical aging andcoagulation processes also made contributions but were notas effective as the evolution of the mixing layer. A similarboundary layer mechanism was also suggested by Rissler etal. (2006).
In Fig. 3c, therext-LAC,model for large particles are muchlower than that for small ones. In the model, the initialaerosol for all size range is assumed to consist of LAC as 5 %in mass, and the freshly emitted LAC particles are assumedto be distributed as a log-normal distribution with geometricaverage diameter of 50 nm. Therefore, during the daytime aswell as during the nighttime, the fraction of externally mixedLAC decreases with increasing particle size.
4.4 Sensitivity study
The input parameters of the new method include in situ mea-sured data (PNSDs, LAC mass concentrations, aerosol scat-tering and hemispheric backscattering coefficients) and someconstants assumed beforehand (the refractive indices of LACand less absorbing component, the density of LAC and themass absorption efficiency (MAE)). The retrievedrext-LACwould no doubt be influenced by the uncertainties of thesevariables. Also, some assumptions included in the model,such as spherical particles and constant fraction of LAC massfor all size, would introduce uncertainties to the retrievedrext-LAC . In order to quantify the influences of the uncer-tainties of these input parameters and assumptions on theretrievedrext-LAC , a sensitivity study was performed. Thepotential uncertainties introduced by the assumptions in themodel are discussed first. The sensitivity of therext-LACto the input parameters was determined by varying themindividually and evaluating the changing of the retrievedrext-LAC . The overall uncertainty of the retrievedrext-LAC wasestimated by a Monte Carlo approach.
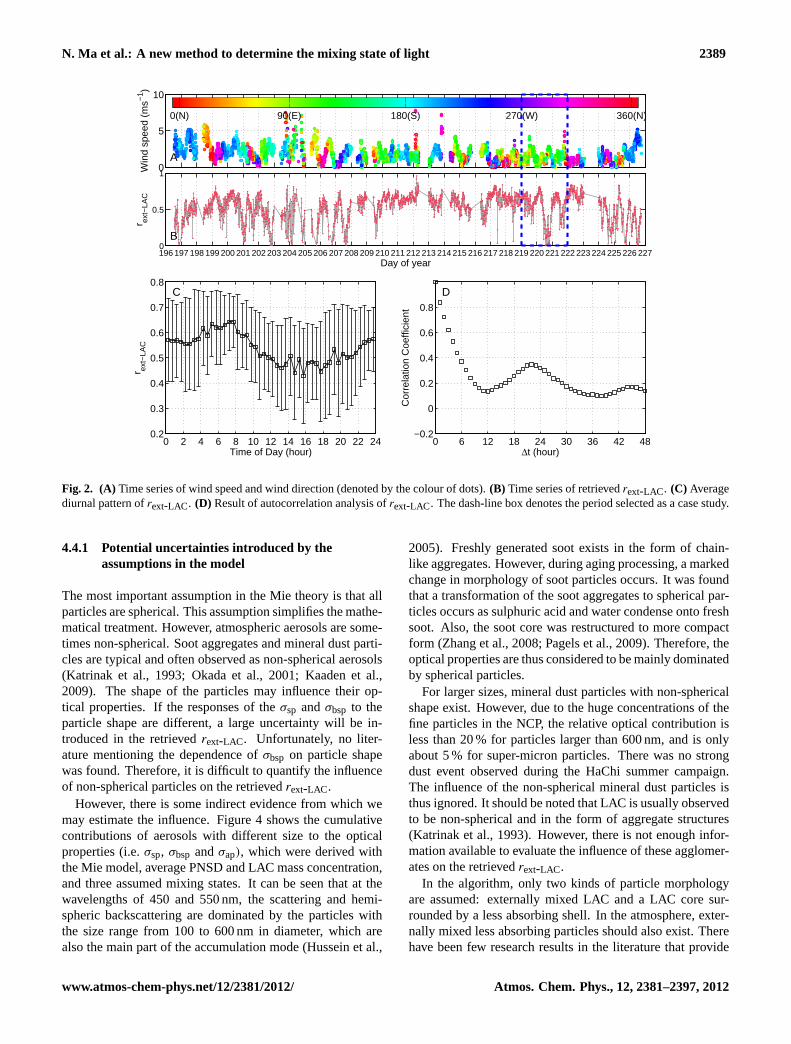
Fig. 2. (A) Time series of wind speed and wind direction (denoted by the colour of dots).(B) Time series of retrievedrext-LAC . (C) Averagediurnal pattern ofrext-LAC . (D) Result of autocorrelation analysis ofrext-LAC . The dash-line box denotes the period selected as a case study.
4.4.1 Potential uncertainties introduced by theassumptions in the model
The most important assumption in the Mie theory is that allparticles are spherical. This assumption simplifies the mathe-matical treatment. However, atmospheric aerosols are some-times non-spherical. Soot aggregates and mineral dust parti-cles are typical and often observed as non-spherical aerosols(Katrinak et al., 1993; Okada et al., 2001; Kaaden et al.,2009). The shape of the particles may influence their op-tical properties. If the responses of theσsp andσbsp to theparticle shape are different, a large uncertainty will be in-troduced in the retrievedrext-LAC . Unfortunately, no liter-ature mentioning the dependence ofσbsp on particle shapewas found. Therefore, it is difficult to quantify the influenceof non-spherical particles on the retrievedrext-LAC .
However, there is some indirect evidence from which wemay estimate the influence. Figure 4 shows the cumulativecontributions of aerosols with different size to the opticalproperties (i.e.σsp, σbsp andσap), which were derived withthe Mie model, average PNSD and LAC mass concentration,and three assumed mixing states. It can be seen that at thewavelengths of 450 and 550 nm, the scattering and hemi-spheric backscattering are dominated by the particles withthe size range from 100 to 600 nm in diameter, which arealso the main part of the accumulation mode (Hussein et al.,
2005). Freshly generated soot exists in the form of chain-like aggregates. However, during aging processing, a markedchange in morphology of soot particles occurs. It was foundthat a transformation of the soot aggregates to spherical par-ticles occurs as sulphuric acid and water condense onto freshsoot. Also, the soot core was restructured to more compactform (Zhang et al., 2008; Pagels et al., 2009). Therefore, theoptical properties are thus considered to be mainly dominatedby spherical particles.
For larger sizes, mineral dust particles with non-sphericalshape exist. However, due to the huge concentrations of thefine particles in the NCP, the relative optical contribution isless than 20 % for particles larger than 600 nm, and is onlyabout 5 % for super-micron particles. There was no strongdust event observed during the HaChi summer campaign.The influence of the non-spherical mineral dust particles isthus ignored. It should be noted that LAC is usually observedto be non-spherical and in the form of aggregate structures(Katrinak et al., 1993). However, there is not enough infor-mation available to evaluate the influence of these agglomer-ates on the retrievedrext-LAC .
In the algorithm, only two kinds of particle morphologyare assumed: externally mixed LAC and a LAC core sur-rounded by a less absorbing shell. In the atmosphere, exter-nally mixed less absorbing particles should also exist. Therehave been few research results in the literature that provide
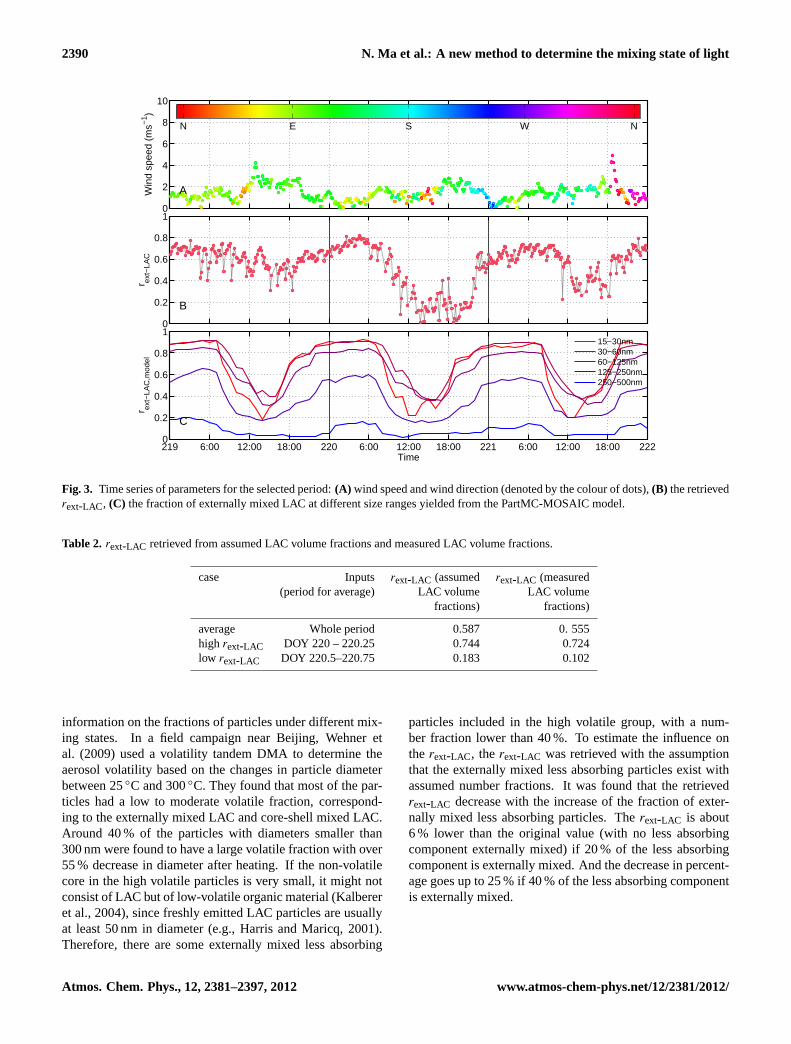
Fig. 3. Time series of parameters for the selected period:(A) wind speed and wind direction (denoted by the colour of dots),(B) the retrievedrext-LAC , (C) the fraction of externally mixed LAC at different size ranges yielded from the PartMC-MOSAIC model.
Table 2. rext-LAC retrieved from assumed LAC volume fractions and measured LAC volume fractions.
case Inputs rext-LAC (assumed rext-LAC (measured(period for average) LAC volume LAC volume
fractions) fractions)
average Whole period 0.587 0. 555high rext-LAC DOY 220 – 220.25 0.744 0.724low rext-LAC DOY 220.5–220.75 0.183 0.102
information on the fractions of particles under different mix-ing states. In a field campaign near Beijing, Wehner etal. (2009) used a volatility tandem DMA to determine theaerosol volatility based on the changes in particle diameterbetween 25◦C and 300◦C. They found that most of the par-ticles had a low to moderate volatile fraction, correspond-ing to the externally mixed LAC and core-shell mixed LAC.Around 40 % of the particles with diameters smaller than300 nm were found to have a large volatile fraction with over55 % decrease in diameter after heating. If the non-volatilecore in the high volatile particles is very small, it might notconsist of LAC but of low-volatile organic material (Kalbereret al., 2004), since freshly emitted LAC particles are usuallyat least 50 nm in diameter (e.g., Harris and Maricq, 2001).Therefore, there are some externally mixed less absorbing
particles included in the high volatile group, with a num-ber fraction lower than 40 %. To estimate the influence onthe rext-LAC , the rext-LAC was retrieved with the assumptionthat the externally mixed less absorbing particles exist withassumed number fractions. It was found that the retrievedrext-LAC decrease with the increase of the fraction of exter-nally mixed less absorbing particles. Therext-LAC is about6 % lower than the original value (with no less absorbingcomponent externally mixed) if 20 % of the less absorbingcomponent is externally mixed. And the decrease in percent-age goes up to 25 % if 40 % of the less absorbing componentis externally mixed.
N. Ma et al.: A new method to determine the mixing state of light 2391
0
0.2
0.4
0.6
0.8
1
Acc
umul
atio
n co
ntrib
utio
n
Internal
σsp,450nm
σsp,550nm
σsp,700nm
σbsp,450nm
σbsp,550nm
σbsp,700nm
σap,450nm
σap,550nm
σap,700nm
0
0.2
0.4
0.6
0.8
1
Acc
umul
atio
n co
ntrib
utio
n
External
102
103
0
0.2
0.4
0.6
0.8
1
Dp (nm)
Acc
umul
atio
n co
ntrib
utio
n
Core−shell
Fig. 4. The cumulative contributions of aerosols with different sizeto the optical properties:σsp, σbsp andσap. The results is based onthe Mie model, average PNSD and LAC mass concentration, andthree assumed mixing states.
Another assumption included in the retrieving model isthat the volume fraction of LAC is independent of particlesize. This is no doubt the simplest description for LAC vol-ume size distribution. The real situation in the atmosphere ismuch more complicated. Freshly emitted LAC particles areusually concentrated at around 100 nm in diameter (Moffetand Prather, 2009). During coagulations and condensationprocesses, the LAC mass will be transferred to larger parti-cles. In order to evaluate the influence of this assumption onthe retrievedrext-LAC , the average EC volume fractions ob-tained from the Berner impactor measurements were used,which are shown in Fig. 5. The size-dependent volume frac-tions of LAC were assumed to be the same as that of EC. Therext-LAC was retrieved from the size-independent LAC vol-ume fractions and the average measured size-dependent LACvolume fractions, respectively. The calculations were carriedout for three cases: average condition (using the average val-ues for the whole period as the inputs of the model), highrext-LAC case (using the average values for the period fromDOY 220 to DOY 220.25 as the inputs), and lowrext-LACcase (using the average values for the period from DOY
Table 3. Uncertainties of the input parameters for the retrievingalgorithm, giving in terms of one standard deviation.
220.5 to DOY 220.75 as the inputs). The results are pre-sented in Table 2.
The values retrieved with the measured size-dependentfractions are always higher than those retrieved with the size-independent fractions. The sensitivity of retrievedrext-LAC tothe assumption of LAC volume fraction distribution is alsofound to be insignificant. For the average case, the differ-ence between the two retrievedrext-LAC is 0.032. The dif-ference for the highrext-LAC case is only 0.02. But for thelow rext-LAC case, the difference reaches up to 0.081, whichis relatively high. It seems that the lower therext-LAC is, themore sensitive it becomes.
The assumption of the size-independent LAC volume frac-tion distribution used in the model does cause an overestima-tion in the retrievedrext-LAC , but the influence is relativelysmall. The reason for choosing a size-independent LAC vol-ume fraction is to make the method be able to provide infor-mation on the LAC mixing state solely from aerosol physi-cal properties. Mobility size spectrometers have been widelyused for measuring the PNSD. Nephelometers and MAAPsare also commonly used to provide aerosol optical proper-ties. All of these instruments can measure the aerosol prop-erties online with high time resolutions. However, the vol-ume fraction distribution of LAC is usually obtained fromaerosol chemical composition measurements, which is nor-mally based on impactor sampling and offline analyzing.This kind of measurement is usually with low time resolutionand not as common as the measurements of aerosol physicalproperties. Therefore, a method based on the aerosol physi-cal property measurements is more valuable than that basedon aerosol chemical data.
2392 N. Ma et al.: A new method to determine the mixing state of light
101
102
103
104
0
0.05
0.1
0.15
0.2
0.25
0.3
0.35
Dp (nm)
EC
vol
ume
frac
tion
101
102
103
1040
0.2
0.4
0.6
0.8
1
1.2
1.4
Dp (nm)
EC
mas
s co
ncen
trat
ion
(μgm
−3 )
Fig. 5. The average distribution of EC mass concentration and ECvolume fraction yielded from Berner impactor measurements.
4.4.2 Uncertainties of input parameters
All of the input parameters for the retrieving algorithm arelisted in Table 3. The possible values of each parameter areassumed to be normally distributed with standard deviationspresented in Table 3.
The uncertainty of the measured PNSD originates from theuncertainties of the TDMPS and APS measurements. Froma comparison test reported by Wiedensohler et al. (2011), themaximum uncertainty of the particle size measured by mo-bility size spectrometers reaches 3.5 %, and the maximumuncertainty of the number concentration is 30 %, 10 % and25 % for the size range of 3–20 nm, 20–200 nm and 200–700 nm, respectively. These values are used as the uncer-tainties of the TDMPS measurement. For the size and num-ber concentration measured by APS, the uncertainty is re-spectively estimated as 9 % and 10 % (Wex et al., 2002b).The uncertainty ofσap measured by MAAP is reported asabout 12 % (Petzold et al., 2004). To convertσap to LACmass concentration, a MAE of 6.6 m2g−1 is used in theMAAP. In order to estimate the uncertainty of this value, theBerner impactor-derived EC mass concentrations were com-pared with the MAAP-measuredσap, as shown in Fig. 6. Itshould be noted that LAC and EC are two different defini-tions and have slightly different thermal, optical and chem-ical behaviour. However, they share a similar fraction ofthe carbonaceous aerosol and are supposed to be comparable(Lavanchy et al., 1999). Thus, the LAC mass concentrationis assumed to be the same as the Berner impactor-derivedEC mass concentration. It can be seen that all data pointslocate around the line of MAE = 6.6 m2 g−1, with determina-tion coefficientR2 of 0.837. The coefficient of linear regres-sion is 7.20 m2 g−1, which is close to the MAE value usedin MAAP. Since there is no direct way to evaluate the un-certainty of MAE, the difference between the recommendedvalue and the value yielded from the regression is taken asone standard deviation of the MAE, which is 9.1 %. This
Table 4. rext-LAC retrieved with each input parameter varying fromits original value to the original value plusσ , as well as the differ-ences (1) between each newrext-LAC and original value.
value is an empirical estimation and only valid in this study.The corresponding uncertainty of the MAE (3σ) is also il-lustrated in Fig. 6 as dash lines. In literature (Sloane et al.,1983, 1984, 1991; Sloane and Wolff, 1985; Ouimette andFlagan, 1982; Seinfeld and Pandis, 1998),ρEC is reportedas a range from 1.00 g cm−3 to 2.00 g cm−3. Accordingly,the uncertainty ofρEC is set to be 33 % to cover the abovementioned range. The uncertainties for the refractive indicesof LAC and less absorbing component are chosen accordingto Cheng et al. (2006). Their estimated uncertainties for thereal part of refractive index of the less absorbing component,the real part and imaginary part of refractive index of LACare 1.5 %, 12 % and 20 %, respectively. The uncertainty ofthe HBF derived from the nephelometer measurements is es-timated as 20 % (Anderson et al., 1996).
4.4.3 Sensitivities of retrievedrext-LAC to theuncertainties of input parameters
The sensitivities of the retrievedrext-LAC to the uncertainty ofeach input parameter were investigated for three cases: aver-age condition (using the average values for the whole periodas the inputs of the model), highrext-LAC case (using the av-erage values for the period from DOY 220 to DOY 220.25 asthe inputs), and lowrext-LAC case (using the average valuesfor the period from DOY 220.5 to DOY 220.75 as the in-puts). Therext-LAC was retrieved with one parameter varyingfrom its original value to the original plus oneσ , while keep-ing other parameters fixed. The difference between the newrext-LAC and the original value, defined as1=rext-LAC, new–rext-LAC,original, represents the influence of the uncertainty ofthe varying input parameter onrext-LAC . In other words, theinfluences of the uncertainties of input parameters on theretrievedrext-LAC were determined independently. Table 4presents therext-LAC retrieved with the varying of each pa-rameter, as well as the difference (1). It can be noted from
N. Ma et al.: A new method to determine the mixing state of light 2393
0 2 4 6 8 100
20
40
60
80
100
Berner EC mass concentration (μgm−3)
MA
AP
σap
(M
m−
1 )
Fig. 6. Comparison of theσap measured by MAAP and the Bernerimpactor-derived EC mass concentrations. The result of linear re-gression is shown as red line (b = 7.20 m2 g−1, R2
= 0.837). Theblack line corresponds with MAE = 6.6 m2 g−1. The error bar ofeach data point denotes the standard deviation of theσap averagedto yield the data, since the time resolution ofσap is much higherthan that of the impactor-derived EC mass concentrations.
Table 3 that, among all of the input parameters, the largestinfluence on retrievedrext-LAC stems from the uncertainty ofHBF. A shift of 6.6 % in HBF leads to a shift of more than 0.1in rext-LAC for the average case. However, it should be notedthat there is no reference in the literature to the uncertain-ties ofσbspor HBF measured by the TSI 3563 nephelometer.Only one reference (Anderson et al., 1996) mentioned thatthe uncertainty of HBF derived by the TSI 3563 nephelome-ter is within 20 %. Therefore, the influence of the uncertaintyof measured HBF should be reconsidered after getting a bet-ter estimation of the uncertainty of the measurement.
The second largest influence on retrievedrext-LAC comesfrom the uncertainty of LAC density. Due to the large rangeof LAC density reported in the literature, the standard devia-tion of LAC density is estimated as 11 %, which is the highestamong all of the input parameters. This high standard devi-ation of LAC density induces a shift of 0.047 inrext-LAC forthe average case.
Following the LAC density, the uncertainty of measuredLAC mass concentration also makes a great contribution.The uncertainty of LAC mass concentration is separated intotwo parts, the uncertainty of the measuredσap and the uncer-tainty of the MAE, and treated separately. For the averagecase, a shift of 4 % in measuredσap leads to a shift of 0.017in rext-LAC , while a shift of 9.1 % in MAE leads to a shift of0.039 inrext-LAC for the average case.
The influences of the uncertainties in the refractive indiceson rext-LAC are of the same magnitude. A shift of oneσ
in each of the three assumed refractive indices respectivelycauses a shift of around 0.024 inrext-LAC for the average case.
For the PNSD, a shift of oneσ in the size and number con-centration of TDMPS measurement leads to a shift of 0.021and 0.042 inrext-LAC for the average case, respectively. How-ever, it can be seen that the influence of the uncertainties inthe APS data onrext-LAC is weak. Since an averaged PNSDwas used in this sensitivity study, the contribution of parti-cles in the size range of the APS measurements to the overallaerosol optical properties is relatively small. During certainheavy pollution periods, the contribution of coarse particlesto the overall aerosol optical properties might be significant.In those cases, the influence of the uncertainties in the APSmeasurement torext-LAC might become higher.
It should be noted that the influences of the uncertain-ties of model inputs onrext-LAC also depend on the levels ofrext-LAC . The lower therext-LAC is, the more significant theinfluence would be. It means that therext-LAC with low val-ues have more uncertainty than those with high values. Thisalso can be seen in Fig. 3b,rext-LAC with lower values showmuch larger variability than those with higher values.
Overall, the retrievedrext-LAC shows the highest sensitiv-ity to the HBF yielded from the nephelometer measurements,followed by the assumed LAC density. The uncertainty in theLAC mass concentration also makes great contribution. Theuncertainties in the refractive indices of less absorbing com-ponent and LAC cause similar responses inrext-LAC . And theinfluence of the uncertainties in measured PNSD onrext-LACis relatively low among the input parameters. Therefore, un-der current method, an accurate measurement ofσsp andσbspis most important to retrieverext-LAC . A better estimation ofthe uncertainties in measuredσbspor HBF is urgently needed.Furthermore, more accurate estimations of the LAC densityand the refractive indices are required to reduce the uncer-tainty of retrievedrext-LAC .
4.4.4 Monte Carlo variations
A Monte Carlo simulation was applied to investigate theoverall influence of input parameters on the retrievedrext-LACfor the three cases mentioned in Sect. 4.4.3. The retrievingalgorithm was repeated using a randomly varying set of in-put parameters. The random values of the input parameterswere generated independently. The values of each input pa-rameter were normally distributed, with the original valueused in Sect. 4.4.3 as the mean value, and the standard devi-ation listed in Table 3. 2000 runs were carried out to yielda stable distribution of the retrievedrext-LAC . The retrievedrext-LAC shows a quasi-lognormal distribution with standarddeviations of 0.202, 0.130 and 0.241 for the average case,high rext-LAC case, and lowrext-LAC case, respectively. Suchlarge uncertainty in the retrievedrext-LAC is induced by allinput parameters. However, all the uncertainties of input pa-rameters discussed in Sect. 4.4.2 are the worst case estima-tions, thus the standard deviation ofrext-LAC might be lower.
2394 N. Ma et al.: A new method to determine the mixing state of light
5 Summary and conclusions
In this paper, a new method was proposed to retrieve infor-mation on the mixing state of LAC from measured PNSDs,LAC mass concentrations and HBFs.
Based on a two-parameter optical aerosol model, anaerosol optical closure was conducted using independentin situ measured data. The HBFs yielded from the neph-elometer were compared with the values calculated from thePNSDs and LAC mass concentrations with a modified Miemodel. Three limiting mixing states of LAC were assumedin the calculation: external mixture, homogeneously internalmixture and core-shell mixture. It was found that the HBF ismore sensitive to the assumption of LAC mixing state, ratherthan to the variations of the PNSDs or the LAC mass con-centrations. The HBFs calculated based on core-shell mix-ture are much higher than those based on external mixtureor homogeneously internal mixture. Moreover, almost all ofthe HBFs yielded from the nephelometer locate between thevalues calculated based on core-shell mixture and externalmixture, but are much higher than the values calculated un-der the homogeneously internal mixture assumption. Thisfinding indicates that the assumption of LAC mixing statewhich has been widely applied in aerosol optical calcula-tions cannot be used properly in the NCP. In this area, theinternally mixed aerosols are rather core-shell mixed than ho-mogeneously mixed. Thus, an assumption of a system con-sisting of externally mixed LAC and core-shell mixed LACand less absorbing component is more appropriate in aerosoloptical calculations.
With the new method, a high-resolution time series of themass fraction of the externally mixed LAC was retrievedfrom in situ measurements of PNSDs and LAC mass con-centrations. A pronounced diurnal cycle was found. Duringthe night, the averagerext-LAC is around 0.58, and reachesits maximum around 06:00 LT, indicating the accumulationof the freshly emitted LAC in the nocturnal boundary layer.During the daytime,rext-LAC remains at a relatively low level,reflecting the dominance of aged aerosol in the boundarylayer. This diurnal variation ofrext-LAC is mainly caused bythe diurnal evolution of the mixing layer. Other processes,such as condensation, coagulation and photochemical aging,also make contributions. As a case study, a three-day periodwith constant synoptic situation was selected. A stochastic,particle-resolved aerosol model PartMC-MOSAIC was ap-plied to yield the information of LAC mixing state during thisperiod. The retrievedrext-LAC and the model results showeda very similar variation patterns. This good agreement fur-ther proves our explanations for the diurnal pattern of theretrievedrext-LAC .
A sensitivity study was carried out to investigate the sen-sitivities of the retrievedrext-LAC to the input parameters ofthe algorithm. The retrievedrext-LAC shows the highest sen-sitivity to the HBF yielded from the nephelometer measure-ments, followed by the assumption of the LAC density. The
uncertainties in the LAC mass concentrations and the refrac-tive indices also cause great influences onrext-LAC . It wasfound thatrext-LAC with low values have more uncertaintythan those with high values. The overall uncertainty of theretrievedrext-LAC was derived via the Monte Carlo approach.Considering the uncertainties of all input parameters of thealgorithm, the standard deviation of the retrievedrext-LACwas found to be 0.20 for average case.
Acknowledgements.This work is supported by the NationalNatural Science Foundation of China (NSFC) under GrantNo. 40875001 and by the German Science Foundation under grantDFG WI 1449/14-1. Funds for this experiment were also providedby: China 973 project 2011CB403402, NSFC project 40975083and Basic Research Fund of China Academy of MeteorologicalSciences 2008Z011.
Edited by: D. Covert
References
Anderson, T. L. and Ogren, J. A.: Determining aerosol radiativeproperties using the TSI 3563 Integrating Nephelometer, AerosolSci. Technol., 29, 57–69, 1998.
Anderson, T. L., Covert, D. S., Marshall, S. F., Laucks, M. L.,Charlson, R. J., Waggoner, A. P., Ogren, J. A., Caldow, R., Holm,R. L., Quant, G., Sem, J., Wiedensohler, A., Ahlquist, N. A., andBates, T. S.: Performance characteristics of a High-sensitivity,three-wavelength total scatter/backscatter nephelometer, J. At-mos. Ocean. Tech., 13, 967–986, 1996.
Albrecht, B. A.: Aerosols, cloud microphysics, and fractionalcloudiness, Science, 245, 1227–1230, 1989.
Bohren, C. F. and Huffman, D. R.: Absorption and Scattering ofLight by Small Particles, John Wiley, Wiley, New York, USA,1983.
Bond, T. C. and Bergstrom, R. W.: Light absorbing by carbona-ceous particles: An investigative review, Aerosol Sci. Tech., 40,27–67, 2006.
Bond, T. C. and Sun, H. L.: Can reducing black carbon emissioncounteract global warming?, Environ. Sci. Technol., 39, 5921–5926, 2005.
Bond, T. C., Streets, D. G., Yarber, K. F., Nelson, S. M., Woo, J.-H., and Klimont, Z.: A technology-based global inventory ofblack and organic carbon emissions from combustion, J. Geo-phys. Res., 109, D14203,doi:10.1029/2003jd003697, 2004.
Chandra, S., Satheesh, S. K., and Srinivasan, J.: Can the state ofmixing of black carbon aerosols explain the mystery of “ex-cess” atmospheric absorption?, Geophys. Res. Lett., 31, L19109,doi:10.1029/2004GL020662, 2004.
Charlson, R. J., Schwartz, S. E., Hales, J. M., Cess, R. D.,Coakley Jr., J. A., Hansen, J. E., and Hofmann, D. J.: Cli-mate forcing by anthropogenic aerosols, Science, 255, 423–430,doi:10.1126/science.255.5043.423, 1992.
Cheng, Y. F., Eichler, H., Wiedensohler, A., Heintzenberg, J.,Zhang, Y. H., Hu, M., Herrmann, H., Zeng, L. M., Liu, S.,Gnauk, T., Bruggemann, E., and He, L. Y.: Mixing stateof elemental carbon and less absorbing aerosol components
N. Ma et al.: A new method to determine the mixing state of light 2395
derived from in situ particle optical properties at Xinken inPearl River Delta of China, J. Geophys. Res., 111, D20204,doi:10.1029/2005JD006929, 2006.
Cheng, Y. F., Wiedensohler, A., Eichler, H., Su, H., Gnauk, T.,Bruggemann, E., Herrmann, H., Heintzenberg, J., Slanina, J.,Tuch, T., Hu, M., and Zhang, Y. H.: Aerosol optical proper-ties and related chemical apportionment at Xinken in Pearl RiverDelta of China, Atmos. Environ., 42, 6351–6372, 2008.
Cheng, Y. F., Berghof, M., Garland, R. M., Wiedensohler, A.,Wehner, B., Muller, T., Su, H., Zhang, Y. H., Achtert, P., Nowak,A., Poschl, U., Zhu, T., Hu, M., and Zeng, L. M.: Influ-ence of soot mixing state on aerosol light absorption and sin-gle scattering albedo during air mass aging at a polluted regionalsite in northeastern China, J. Geophys. Res., 114, D00G10,doi:10.1029/2008JD010883, 2009.
Clarke, A. D., Shinozuka, Y., Kapustin, V. N., Howell, S., Huebert,B., Doherty, S., Anderson, T., Covert, D., Anderson, J., Hua,X., Moore II, K. G., McNaughton, C., Carmichael, G., and We-ber, R.: Size distributions and mixtures of dust and black carbonaerosol in Asian outflow: Physiochemistry and optical proper-ties, J. Geophys. Res, 109, D15S09,doi:10.1029/2003JD004378,2004.
Cooke, W. F., Liousse, C., Cachier, H., and Feichter, J.: Con-struction of a 1× 1 fossil fuel emission data set for carbona-ceous aerosol and implementation and radiative impact in theECHAM4 model, J. Geophys. Res., 104, 22137–22162, 1999.
Covert, D. S., Heintzenberg, J., and Hansson, H. C.: Electro-opticaldetection of external mixtures in aerosols, Aerosol Sci. Technol.,12, 446–456, 1990.
d’Almeida, G. A., Koepke, P., and Shettle, E. P.: AtmosphericAerosols–Global Climatology and Radiative Characteristics, A.Deepak, Hampton, Va, 1991.
Dey, S., Tripathi, S. N., and Mishra, S. K.: Probable mixing stateof aerosols in the Indo-Gangetic Basin, northern India, Geophys.Res. Lett., 35, L03808,doi:10.1029/2007GL032622, 2008.
Harris, J. S. and Maricq, M. M.: Signature size distributions fordiesel and gasoline engine exhaust particulate matter, J. AerosolSci., 32, 749–764, 2001.
Hasan, H. and Dzubay, T. G.: Apportioning light extinction coeffi-cients to chemical species in atmospheric aerosol, Atmos. Envi-ron., 17, 1573–1581, 1983.
Heintzenberg, J., Wiedensohler, A., Tuch, T. M., Covert, D. S.,Sheridan, P., Ogren, J. A., Gras, J., Nessler, R., Kleefeld, C.,Kalivitis, N., Aaltonen, V., Wilhelm, R. T., and Havlicek, M.:Intercomparsions and aerosol calibrations of 12 commercial in-tegrating nephelometer of 15 three manufacturers, J. Atmos.Ocean. Tech., 23, 902–914, 2006.
Hennig, T., Massling, A., Brechtel, F. J., and Wiedensohler,A.: A tandem DMA for highly temperature-stabilized hy-groscopic particle growth measurements between 90 % and98 % relative humidity, J. Aerosol Sci., 36, 1210–1223,doi:10.1016/j.jaerosci.2005.01.005, 2005.
Hussein, T., Dal Maso, M., Petaja, T., Koponen, I. K., Paatero, P.,Aalto, P. P., Hameri, K., and Kulmala, M.: Evaluation of an auto-matic algorithm for fitting the particle number size distributions,Boreal Environ. Res., 10, 337–355, 2005.
IPCC: Climate Change 2007 – The Physical Science Basis, editedby: Solomon, S., Cambridge University Press, New York, USA,2007.
Jacobson, M. Z.: A physically-based treatment of elemental car-bon optics: Implications of 25 global direct forcing of aerosols,Geophys. Res. Lett., 27, 217–220, 2000.
Jacobson, M. Z.: Strong radiative heating due to the mixing stateof black carbon in atmospheric aerosols, Nature, 409, 695–697,2001.
Kaaden, N., Massling, A., Schladitz, A., Muller, T., Kandler, K.,Schutz, L., Weinzierl, B., Petzold, A., Tesche, M., Leinert, S.,Deutscher, C., Ebert, M., Weinbruch, S., Wiedensohler, A.: Stateof mixing, shape factor, number size distribution, and hygro-scopic growth of the Saharan anthropogenic and mineral dustaerosol at Tinfou, Morocco, Tellus, 61B, 51–63, 2009.
Kalberer, M., Paulsen, D., Sax, M., Steinbacher, M., Dommen, J.,Prevot, A. S. H., Fisseha, R., Weingartner, E., Frankevich, V.,Zenobi, R., Baltensperger, U.: Identification of polymers as ma-jor components of atmospheric organic aerosols, Science, 303,1659–1662, 2004.
Katrinak, K. A., Rez, P., and Buseck, P. R.: Structural variations inindividual carbonaceous particles from an urban aerosol, Envi-ron. Sci. Technol., 26, 1967–1976, 1992.
Katrinak, K. A., Rez, P., Perkes, P. R., and Buseck, P. R.: Frac-tal geometry of carbonaceous aggregates from an urban aerosol,Environ. Sci. Technol, 27, 539–547, 1993.
Khalizov, A. F., Xue, H., Wang, L., Zheng, J., and Zhang, R.: En-hanced light absorption and scattering by carbon soot aerosol in-ternally mixed with sulfuric acid, J. Phys. Chem. A, 113, 1066–1074,doi:10.1021/jp807531n, 2009.
Kristjansson, J. E.: Studies of the aerosol indirect effect from sul-fate and black carbon aerosols, J. Geophys. Res., 107, 4246,doi:10.1029/2001JD000887, 2002.
Lavanchy, V. M. H., Gaggeler, H. W., Nyeki, S., and Baltensperger,U.: Elemental carbon (EC) and black carbon (BC) measurementswith a thermal method and an aethalometer at the high-alpineresearch station Jungfraujoch, Atmos. Environ., 33, 2759–2769,1999.
Liu, P., Zhao, C., Zhang, Q., Deng, Z., Huang, M., Ma, X., and Tie,X.: Aircraft study of aerosol vertical distributions over Beijingand their optical properties, Tellus B, 61, 756–767, 2009.
Liu, P. F., Zhao, C. S., Gobel, T., Hallbauer, E., Nowak, A., Ran,L., Xu, W. Y., Deng, Z. Z., Ma, N., Mildenberger, K., Henning,S., Stratmann, F., and Wiedensohler, A.: Hygroscopic propertiesof aerosol particles at high relative humidity and their diurnalvariations in the North China Plain, Atmos. Chem. Phys., 11,3479–3494, doi:10.5194/acp-11-3479-2011 2011.
Ma, N., Zhao, C. S., Nowak, A., Muller, T., Pfeifer, S., Cheng, Y.F., Deng, Z. Z., Liu, P. F., Xu, W. Y., Ran, L., Yan, P., Gobel, T.,Hallbauer, E., Mildenberger, K., Henning, S., Yu, J., Cheng, L.L., Zhou, X. J., Stratmann, F., and Wiedensohler, A.: Aerosol op-tical properties in the North China Plain during HaChi campaign:an in-situ optical closure study, Atmos. Chem. Phys. Discuss.,11, 9567–9605,doi:10.5194/acpd-11-9567-2011, 2011.
Mallet, M., Roger, J. C., Despiau, S., Putaud, J. P., and Dubovik.O.: A study of the mixing state of black carbon in urban zone, J.Geophys. Res., 109, D04202,doi:10.1029/2003JD003940, 2004.
Mie, G.: Beitrage zur optic truber Medien speziell kolloidaler Met-allosungen, Ann. Phys., 25, 377–445, 1908.
Moffet, R. C. and Prather, K. A.: In-situ measurements of the mix-ing state and optical properties of soot with implications for ra-diative forcing estimates, Proc. Natl. Acad. Sci., 106, 11872–
2396 N. Ma et al.: A new method to determine the mixing state of light
11877,doi:10.1073/pnas.0900040106, 2009.Moffet, R. C., Qin, X. Y., Rebotier, T., Furutani, H., and
Prather, K. A.: Chemically segregated optical and micro-physical properties of ambient aerosols measured in a single-particle mass spectrometer, J. Geophys. Res., 113, D12213,doi:10.1029/2007JD009393, 2008.
Myhre, G., Stordal, F., Restad, K., and Isaksen, I.: Estimates of thedirect radiative forcing due to sulphate and soot aerosols, Tellus,Ser. B, 50, 463–477, 1998.
Okada, K., Heintzenberg, J., Kai, K., and Qin, Y.: Shape of atmo-spheric mineral particles collected in three Chinese arid-regions,J. Geophys. Res., 28, 3123–3126, 2001.
Ouimette, J. R. and Flagan, R. C.: The extinction coefficient of mul-ticomponent aerosols, Atmos. Environ., 16, 2405–2419, 1982.
Pagels, J., Khalizov, A. F., McMurry, P. H., and Zhang, R.: Process-ing of soot by controlled sulphuric acid and water condensation-mass and mobility relationship, Aerosol Sci. Technol., 43, 629–640, 2009.
Petzold, A. and Schonlinner, M.: Multi-angle absorption photome-try – a new method for the measurement of aerosol light absorp-tion and atmospheric black carbon, J. Aerosol Sci., 35, 421–441,2004.
Petzold, A., Kramer, H., and Schonlinner, M.: Continuous Mea-surement of Atmospheric Black Carbon Using a Multi-AngleAbsorption Photometer, Environ. Sci. Poll. Res., 4, 78–82, 2002.
Ramanathan, V. and Carmichael, G.: Global and regional cli-mate changes due to black carbon, Nature Geosci., 1, 221–227,doi:10.1038/ngeo156, 2008.
Ran, L., Zhao, C., Geng, F., Tie, X., Tang, X., Peng, L., Zhou,G., Yu, Q., Xu, J., and Guenther, A.: Ozone photochemi-cal production in urban Shanghai, China: Analysis based onground level observations, J. Geophys. Res., 114, D15301,doi:10.1029/2008JD010752, 2009.
Riemer, N., West, M., Zaveri, R. A., and Easter, R. C.: Sim-ulating the evolution of soot mixing state with a particle-resolved aerosol model, J. Geophys. Res., 114, D09202,doi:10.1029/2008jd011073, 2009.
Rissler, J., Vestin, A., Swietlicki, E., Fisch, G., Zhou, J., Artaxo,P., and Andreae, M. O.: Size distribution and hygroscopic prop-erties of aerosol particles from dry-season biomass burning inAmazonia, Atmos. Chem. Phys., 6, 471–491,doi:10.5194/acp-6-471-2006, 2006.
Rosenfeld, D.: TRMM observed first direct evidence of smoke fromforest fires inhibiting rainfall, Geophys. Res. Lett., 26, 3105–3180, 1999.
Rosenfeld, D.: Suppression of rain and snow by urban and industrialair pollution, Science, 287, 1793–1796, 2000.
Schwarz, J. P., Spackman, J. R., Fahey, D. W., Gao, R. S., Lohmann,U., Stier, P., Watts, L. A., Thomson, D. S., Lack, D. A., Pfis-ter, L., Mahoney, M. J., Baumgardner, D., Wilson, J. C., andReeves, J. M.: Coatings and their enhancement of black car-bon light absorption in the tropical atmosphere, J. Geophys. Res.,113, D03203,doi:10.1029/2007JD009042, 2008.
Seinfeld, J. and Pandis, S.: Atmospheric chemistry and physics:from air pollution to climate change, Wiley, Inc., New York,USA, 1998.
Sloane, C. S.: Optical properties of aerosols – Comparison of mea-surements with model calculations, Atmos. Environ., 17, 409–416, 1983.
Sloane, C. S.: Optical properties of aerosols of mixed composition,Atmos. Environ., 18, 871–878, 1984.
Sloane, C. S. and Wolff, G. T.: Prediction of ambient light scatteringusing a physical model responsive to relative humidity: Valida-tion with measurements from Detroit, Atmos. Environ., 30 19,669–680, 1985.
Sloane, C. S., Watson, J., Chow, J., Pritchett, L., and Richards,L.W.: Size-segregated fine particle measurements by chemicalspecies and their impact on visibility impairment in Denver, At-mos. Environ., Part A, 25, 1013–1024, 1991.
Street, D. G., Gupta, S., Waldhoff, S. T., Wang, M. Q., Bond, T. C.,and Bo, Y.: Black carbon emission in China, Atmos. Environ.,35, 4281–4296, 2001.
Tang, I. N. and Munkelwitz, H. R.: Water activities, densities andrefractive indices of aqueous sulfates and sodium nitrate dropletsof atmospheric importance, J. Geophys. Res., 99, 18801–18808,1994.
Tuch, T. M., Haudek, A., Muller, T., Nowak, A., Wex, H.,and Wiedensohler, A.: Design and performance of an auto-matic regenerating adsorption aerosol dryer for continuous op-eration at monitoring sites, Atmos. Meas. Tech., 2, 417–422,doi:10.5194/amt-2-417-2009, 2009.
Twomey, S.: Pollution and the planetary albedo, Atmos. Environ.,8, 1251–1256, 1974.
van Donkelaar, A., Martin, R. V., Brauer, M., Kahn, R., Levy, R.,Verduzco, C., and Villeneuve, P. J.: Global estimates of am-bient fine particulate matter concentrations from satellite-basedaerosol optical depth: Development and application, Environ.Health Persp., 118, 847–855, 2010.
Wehner, B., Berghof, M., Cheng, Y. F., Achtert, P., Birmili, W.,Nowak, A., Wiedensohler, A., Garland, R. M., Poschl, U.,Hu, M., and Zhu, T.: Mixing state of non-volatile aerosolparticle fractions and comparison with light absorption inthe polluted Beijing region, J. Geophys. Res., 114, D00G17,doi:10.1029/2008JD010923, 2009.
Wex, H.: Closure and sensitivity studies on physical parametersof rural continental aerosols, Ph.D. Thesis, Leipzig University,2002a.
Wex, H., Neusuß, C., Wendisch, M., Stratmann, F., Koziar, C.,Keil, A., Wiedensohler, A., and Ebert, M.: Particle scatter-ing, backscattering, and absorption coefficients: An in situclosure and sensitivity study, J. Geophys. Res., 107, 8122,doi:10.1029/2000JD000234, 2002b.
Wiedensohler, A., Birmili, W., Nowak, A., Sonntag, A., Weinhold,K., Merkel, M., Wehner, B., Tuch, T., Pfeifer, S., Fiebig, M.,Fjaraa, A. M., Asmi, E., Sellegri, K., Depuy, R., Venzac, H., Vil-lani, P., Laj, P., Aalto, P., Ogren, J. A., Swietlicki, E., Roldin,P., Williams, P., Quincey, P., Hglin, C., Fierz-Schmidhauser, R.,Gysel, M., Weingartner, E., Riccobono, F., Santos, S., Grning,C., Faloon, K., Beddows, D., Harrison, R. M., Monahan, C., Jen-nings, S. G., O’Dowd, C. D., Marinoni, A., Horn, H.-G., Keck,L., Jiang, J., Scheckman, J., McMurry, P. H., Deng, Z., Zhao, C.S., Moerman, M., Henzing, B., and de Leeuw, G.: Particle mo-bility size spectrometers: harmonization of technical standardsand data structure to facilitate high quality long-term observa-tions of atmospheric particle number size distributions, Atmos.Meas. Tech. Discuss., 3, 5521–5587,doi:10.5194/amtd-3-5521-2010, 2010.
Winkler, P.: The growth of atmospheric aerosol particles as a
N. Ma et al.: A new method to determine the mixing state of light 2397
function of the relative humidity – II An improved concept ofmixed nuclei, J. Aerosol Sci., 4, 373–387, 1973.
Xu, W. Y., Zhao, C. S., Ran, L., Deng, Z. Z., Liu, P. F., Ma, N.,Lin, W. L., Xu, X. B., Yan, P., He, X., Yu, J., Liang, W. D., andChen, L. L.: Characteristics of pollutants and their correlation tometeorological conditions at a suburban site in the North ChinaPlain, Atmos. Chem. Phys., 11, 4353–4369,doi:10.5194/acp-11-4353-2011, 2011.
Zaveri, R. A., Easter, R. C., Fast, J. D., and Peters, L. K.: Modelfor simulating aerosol interactions and chemistry (MOSAIC), J.Geophys. Res., 113, D13204,doi:10.1029/2007jd008782, 2008.
Zhang, R., Khalizov, A. F., Pagels, J., Zhang, D., Xue, H., Mc-Murry, P. H.: Variability in morphology, hygroscopicity, and op-tical properties of soot aerosols during atmospheric processing,P. Natl. Acad. Sci. USA, 105, 10291–10296, 2008.
Zhao, C. S., Tie, X. X., and Lin, Y. P.: A possible positivefeedback of reduction of precipitation and increase in aerosolsover eastern central China, Geophys. Res. Lett., 33, L11814,doi:10.1029/2006GL025959, 2006.