October 2004 Houston Geological Society Bulletin 35 A model and data visualization framework for clastic rock properties, Clastics Graphic Synthesis Model (CGSM), was developed to cost-effectively identify fractured/fracturable, unconventional targets previously missed within active and inactive wellbores, fields and plays. CGSM provides the framework to empirically interpret under-utilized, relatively inexpensive X-ray diffraction data (matrix and cements) from well cuttings, sidewall cores and cores. Porosity data, thin section information (point count) and geochemical data (total organic carbon) are also integrated into the CGSM model. The lack of full utilization of X-ray data for petroleum exploration and develop- ment has been due in part to the absence of a proper visualization frame- work that integrates interrelated rock properties data. CGSM is the initial step of a process to define fractured, tight sand and shale producibility models for individual wells, fields and plays. A New Method to Help Identify Unconventional Targets for Exploration and Development Through Integrative Analysis of Clastic Rock Property Fields by Frank Walles P.G. #1980 Advanced Interpretation Consultant Cuttings are often available and now, through the application of the Clastics Graphics Synthesis Model, can be readily used to help identify potential fractured completion zones. A New Method continued on page 36 Figure 1.
Transcript
October 2004 Houston Geological Society Bulletin 35
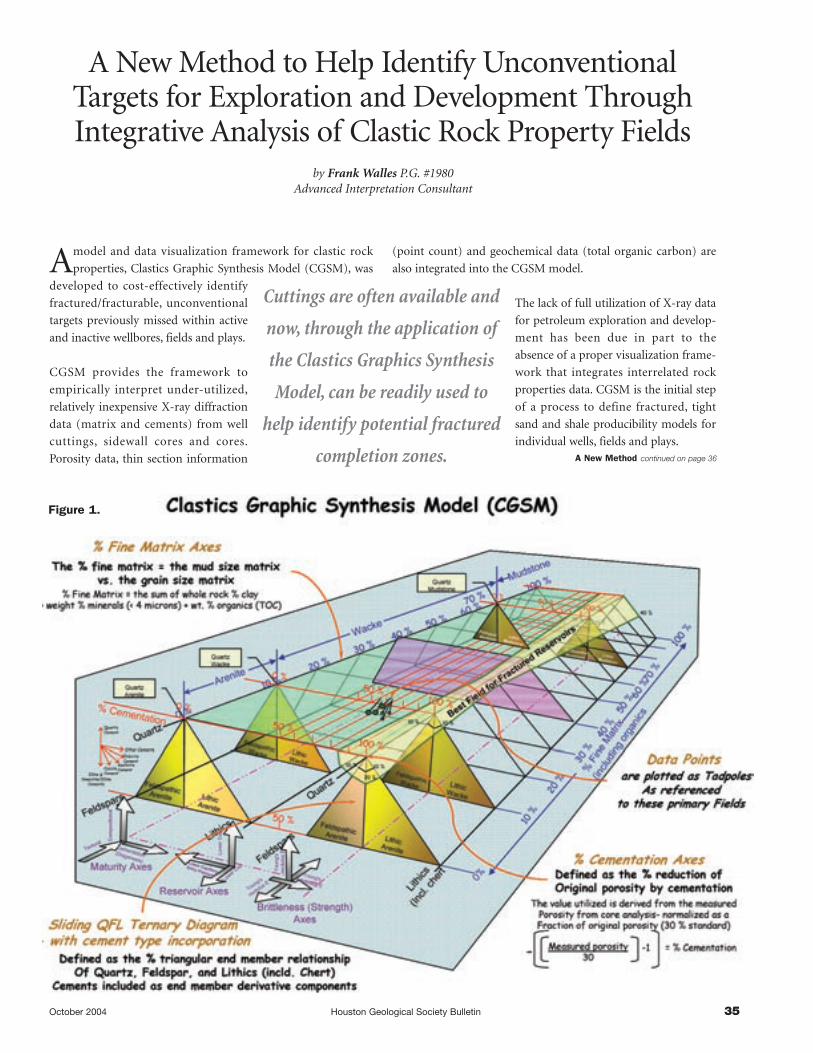
Amodel and data visualization framework for clastic rock
properties, Clastics Graphic Synthesis Model (CGSM), was
developed to cost-effectively identify
fractured/fracturable, unconventional
targets previously missed within active
and inactive wellbores, fields and plays.
CGSM provides the framework to
empirically interpret under-utilized,
relatively inexpensive X-ray diffraction
data (matrix and cements) from well
cuttings, sidewall cores and cores.
Porosity data, thin section information
(point count) and geochemical data (total organic carbon) are
also integrated into the CGSM model.
The lack of full utilization of X-ray data
for petroleum exploration and develop-
ment has been due in part to the
absence of a proper visualization frame-
work that integrates interrelated rock
properties data. CGSM is the initial step
of a process to define fractured, tight
sand and shale producibility models for
individual wells, fields and plays.
A New Method to Help Identify UnconventionalTargets for Exploration and Development ThroughIntegrative Analysis of Clastic Rock Property Fields
by Frank Walles P.G. #1980Advanced Interpretation Consultant
Cuttings are often available and
now, through the application of
the Clastics Graphics Synthesis
Model, can be readily used to
help identify potential fractured
completion zones. A New Method continued on page 36
Figure 1.
36 Houston Geological Society Bulletin October 2004
A New Method to Help Identify Unconventional Targets continued from page 35 ___________________________
Petroleum geoscientists are increasingly faced with identifying
unconventional/overlooked targets within active and inactive
fields and plays, sometimes with complex data sets, or with
limited data sets. These targets are often fractured carbonates,
fracturable, tight sands, and fractured shales.
Identifying open fracture systems or fracturable zones within
reservoirs can be difficult and expensive, and many new tech-
nologies ranging from borehole imaging to 4-D seismic are now
utilized.
The conventional approach for direct/indirect detection of fractures
utilizes wellbore wireline tools including video, image logs (FMI,
FMS), whole cores, sidewall cores, full wave sonic and tempera-
ture logs. Each of these tools has limitations.
X-ray diffraction (XRD) data from well cuttings, sidewall cores and
cores is an often overlooked and under-utilized for several reasons.
A primary factor is the lack of a rock properties field framework
to synthesize and analyze this detailed data set. This article will
provide this framework. Another factor is that the project geosci-
entist often overlooks XRD data because it is often requested by
another project team member, such as the reservoir engineer,
petrophysicist or petrographer, for observational determinations—
such as reservoir fluid compatibility or capillary entry pressure
inferences.
The CGSM approachThe CGSM provides a technique to assist in the identification of
brittle zones occurring within the reservoir. The purpose of this
rock properties model is to help identify zones with the highest
potential for fractured reservoir development. The focus is on
physical rock properties and their susceptibility to brittle rock
deformation.
The CGSM (Figure 1) graphically illustrates the multi-dimen-
sional fields for fractured reservoir potential through the rock
property inter-relationships with derived axes of percent and
type of cementation, rock composition (through ternary-based
QFL diagrams), and by percent
A N
ew M
etho
d to
Hel
p Id
entif
y U
ncon
vent
iona
l Tar
gets
A New Method continued on page 41
Figure 2.
October 2004 Houston Geological Society Bulletin 41
fine matrix material. Capillary entry pressure and rock mechani-
cal data are also directly inferred from this model.
The advantage of the CGSM is integration of XRD data (actual
physical rock properties) with porosity and permeability (P&P)
data and thin section point count data. XRD data and thin-
section point count data can be readily obtained from cuttings,
cores or sidewall cores. Because well cuttings are often available,
the derived data can be readily used to help identify potential
completion zones.
Most unconventional, fractured plays are not simple petroleum
systems. In these types of plays, industry often implements pilot
programs that are utilized to gather data as well as to experiment
with the most effective completion programs.
A N
ew M
etho
d to
Hel
p Id
entif
y U
ncon
vent
iona
l Tar
gets
A New Method continued on page 43
A New Method to Help Identify Unconventional Targets continued from page 36 ___________________________
Figure 3a.
Figure 3b.
October 2004 Houston Geological Society Bulletin 43
A New Method to Help Identify Unconventional Targets continued from page 41 ___________________________
A number of controlling factors (ellipses of focus) make a well,
field or play economically viable. This approach will build upon
the initial focus of this article—the investigation of the inferred
rock properties fields that can be derived from the traditional
cost- effective data sets such as thin sections, XRD (matrix and
cement), porosity and basic geochemical data.
The Producibility Model PerspectiveAs a first-order understanding for the basis and origin of
unconventional targets, the field and play data sets need to be
integrated and synthesized to determine the primary driving
factors that define a field or play’s hydrocarbon producibility.
A useful approach involves the building of producibility mod-
els for shale gas and tight gas sands. A producibility model
defines the ellipses of critical drivers within a well, field or
hydrocarbon play.
An illustrated producibility model (Figure 2) can be useful
because primary drivers are visually highlighted and therefore
prioritized within the petroleum systems analysis. Developing a
competitive edge within a field or play requires recognition of the
underlying driver and therefore requires an increased effort to
prioritize the understanding of those drivers or combination of
drivers. Understanding the rock property heterogeneity and how
it is controlled is also an element of the producibilty model.
Within combination fractured shale gas and fractured/
fracturable tight sand systems the identification of brittle zones
as well as non-brittle zones is important. Non-brittle zones often
form the seals that retain the economically recoverable gas satu-
rations occurring in the brittle zones. Seal zones are also critical
for managing the fracture stimulation programs whereby vertical
fracture growth is inhibited and horizontal fracture growth is
developed within the more brittle reservoirs.
Seal zones (typically more ductile shales) within shale and tight
sand targets may have a simple key XRD derived factor such as
calcite percent being greater than 5%. Reviewing the XRD data
carefully and calibrating to log information is an important part
of understanding particular drivers in wells, fields and play
trends. The CGSM is designed to visually bring out these compo-
sitional variations from the XRD data with inferences to
potential seal or reservoir rock.
A N
ew M
etho
d to
Hel
p Id
entif
y U
ncon
vent
iona
l Tar
gets
A New Method continued on page 45
Figure 4.
October 2004 Houston Geological Society Bulletin 45
Another critical factor within shale gas systems is the variability
of adsorbed gas. Adsorbed—or bound gas (vs. free gas)—is often
a function of total organic carbon within the shales. The
methane or longer chain hydrocarbons preferentially adsorb
(through weak Van der Waal forces) to the surfaces of available
carbon atoms within the system. Adsorbed gas content within
shales often varies from 10 to 100 standard cubic feet/ton
(scf/ton) depending upon percent TOC.
Increased percent TOC typically influences the brittleness of the
shale section inversely. Therefore within the producibilty model
it is located on the opposite side of the ellipse associated with
brittleness. The percent TOC is included in the CGSM as part of
the percent fine matrix axes.
Building the CGSMThe initial data focus for building the framework of the CGSM
includes developing knowledge of where a particular sample fits
within the standard quartz, feldspar. lithics or labiles (QFL)
ternary diagram. The QFL ternary diagram and rock classifica-
tion framework were initially developed by Dott (1964) and
further refined by Raymond (1995) and others. The basic Dott
framework for sedimentary rocks is still valid and serves as a
long-lived, basic siliciclastic classification system. To the QFL
ternary diagram Dott added a percent fine matrix axis. The
CGSM builds upon this original classification by adding another
axis: the cementation axis
Many sandstone classification systems have since been proposed (50
since 1955). However, the Dott/Raymond series appears to be the
most basic and compelling for siliciclastic sediments. Lindsey (1999)
published an evaluation of many such classifications and included
an analysis utilizing variation scattergrams for classifications.
Another reason the QFL ternary diagram has been utilized by
geoscientists is that it can be used to interpret provenance of the
subsurface diagenesis and maturity level of the clastic sedimentary
rock sample. The ternary diagrams (Figures 3a and 3b) illustrate
two concepts—the first, the provenance inferences, and the
second, the subsurface diagenesis models illustrating the effects
associated with subsurface diagenetic fluids (carboxylic- and
carbonic acid enriched fluids).
The position of the data within the CGSM is referenced within
the ternary diagram with respect A New Method continued on page 46
A N
ew M
etho
d to
Hel
p Id
entif
y U
ncon
vent
iona
l Tar
getsA New Method to Help Identify Unconventional Targets continued from page 43 ___________________________
Figure 5.
46 Houston Geological Society Bulletin October 2004
A New Method to Help Identify Unconventional Targets continued from page 45 ___________________________
to the total percent of the rock sample of each of the QFL com-
ponents. The data utilized should be consistently used between
wells or field areas. A good approach is to utilize thin-section
point count data if possible. If that is not available, the XRD data
can be utilized to determine related cement volume among QFL
percentages. For quartz, silica cement would be added. For
feldspar, feldspar-related cements (i.e. illite and smectite, kaolin-
ite) would be included. Most other cements (i.e. pyrite, calcite,
dolomite, ankerite, and siderite) would be included within the
lithics proportion.
Silica cement is most susceptible to brittle failure without rapid
re-precipitation and re-cementation. Enrichment in primary and
secondary quartz or silica cement is often associated with the
optimized fractured shales and tight sandstones reservoirs.
In the subsurface, multiple processes can affect the precipitation
of secondary quartz cement. Styolite surfaces are often good indi-
cators of significant alteration and re-precipitation of these
quartz cement fabrics within normal-pressured environments.
Within hydrocarbon-generated geopressured environments the
inhibition of significant grain-to-grain contact and resulting lack
of dissolution often reduce the volume of silica cementation.
This will be reflected within the CGSM and will indicate a posi-
tion within a less ideal brittleness field.
Figure 3b illustrates the most common diagenetic pathways for
specific fields of rock suites with subsurface diagenesis. The
prevailing mechanism for this alteration is the introduction of
acids, both direct and indirect, from kerogen catagenesis and
metagenesis.
The acidic character of subsurface diagenetic fluids are most
often influenced by inorganic and organic acids created from
kerogen maturation (Surdam et al., 1984). Each kerogen type
produces a specific suite of carboxylic and carbonic acids for
each maturation level. Each of these acids degrades specific rock
components. (Surdam. et al., 1993). Therefore, timing of occur-
rence of these acids within the subsurface system affects the
timing of rock brittleness characteristics. The full producibility
model should take into account these critical timing elements
Degree of cementation within a clastic rock is a critical compo-
nent of the rock properties associated with its strength. The
CGSM utilizes this cementation component as a separate axis.
The cementation axis is defined by the percent reduction of the
original pore fabric by cements. Figure 4 illustrates this axis and
the empirical formula utilized.
Thin-section analysis can also provide information about cemen-
tation history and sequence timing for the development of
brittleness rock property characteristics. Cementation history
A N
ew M
etho
d to
Hel
p Id
entif
y U
ncon
vent
iona
l Tar
gets
Figure 6.
October 2004 Houston Geological Society Bulletin 47
within fracture zones is especially useful. Fluid inclusion analyses,
as well as isotope evaluations, are additional data sets that can be
incorporated into the producibility model.
The percent fine matrix axis of the CGSM (Figure 5) is utilized to
differentiate the mud matrix (percent fines) and the grain size
matrix. When a clastic sedimentary rock varies from a pure grain
(0% fine matrix) composition to a mixed composition (varied
percent fine matrix) to a pure fine matrix rock (pure shale –
100% fines), the rock changes from an isotropic material (by
grains) to an anisotropic material (mixed grains) and then to an
isotropic material (all fine grains), respectively. This does affect
the strength of the material. The apparent change in rock
strength is characterized by varying values of Young’s modulus E.
The need to characterize changes in rock strength as a function
of anistropy is the basis for the importance of percent fine matrix
axis of the CGSM.
When the three basic elements of the CGSM are integrated (the
ternary QFL diagram, the cementation axis and the percent fine
maxtrix axis), the expected brittleness field can plotted with
respect to each of these axes. The “Best Properties Field for
Fractured Reservoirs” defines the rock property suite that has the
greatest inferred rock strength and resulting potential for main-
taining brittle behavior in the subsurface. Figure 6 illustrates this
field and the combination of axes, creating the framework of the
CGSM.
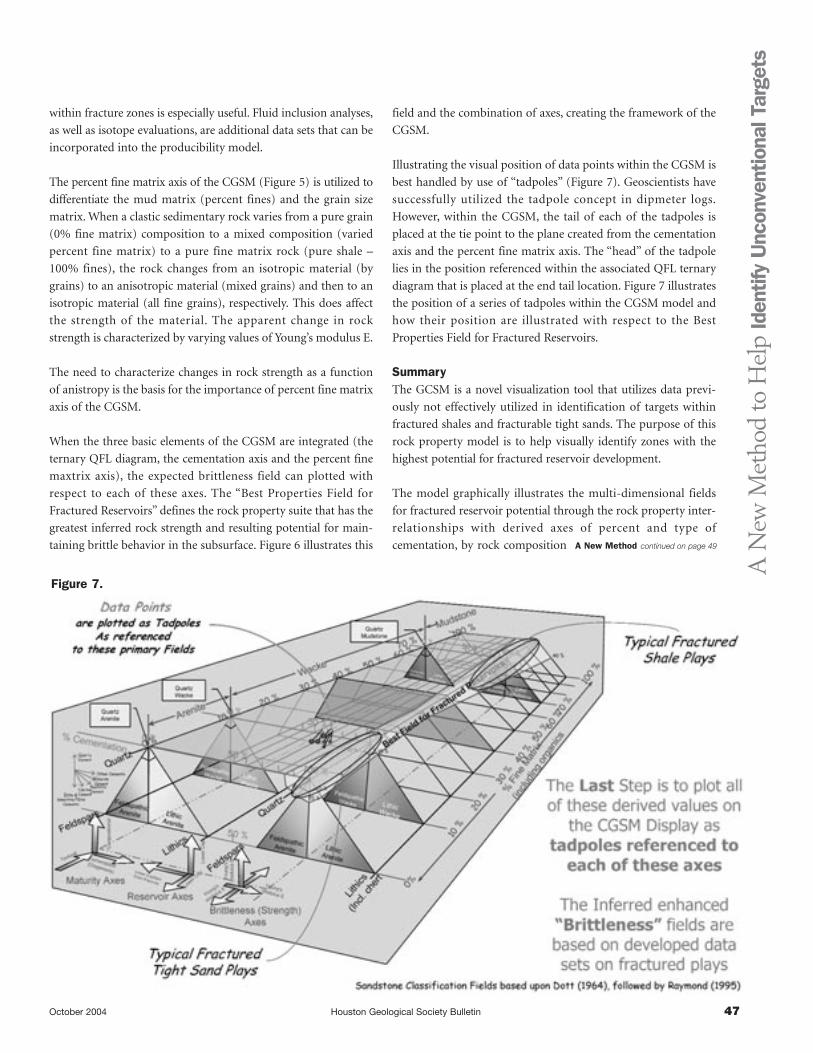
Illustrating the visual position of data points within the CGSM is
best handled by use of “tadpoles” (Figure 7). Geoscientists have
successfully utilized the tadpole concept in dipmeter logs.
However, within the CGSM, the tail of each of the tadpoles is
placed at the tie point to the plane created from the cementation
axis and the percent fine matrix axis. The “head” of the tadpole
lies in the position referenced within the associated QFL ternary
diagram that is placed at the end tail location. Figure 7 illustrates
the position of a series of tadpoles within the CGSM model and
how their position are illustrated with respect to the Best
Properties Field for Fractured Reservoirs.
SummaryThe GCSM is a novel visualization tool that utilizes data previ-
ously not effectively utilized in identification of targets within
fractured shales and fracturable tight sands. The purpose of this
rock property model is to help visually identify zones with the
highest potential for fractured reservoir development.
The model graphically illustrates the multi-dimensional fields
for fractured reservoir potential through the rock property inter-
relationships with derived axes of percent and type of
cementation, by rock composition
A N
ew M
etho
d to
Hel
p Id
entif
y U
ncon
vent
iona
l Tar
gets
A New Method continued on page 49
Figure 7.
October 2004 Houston Geological Society Bulletin 49
A N
ew M
etho
d to
Hel
p Id
entif
y U
ncon
vent
iona
l Tar
getsA New Method to Help Identify Unconventional Targets continued from page 47 ___________________________
INTERNATIONAL GEOSCIENCE CONFERENCE
Regent Hotel, Jakarta
December 7-8, 2004
Deepwater and Frontier Exploration in Asia & Australasia
Technical Presentations: Focus on geosciences with approx. 50 technical papers to be presented (oral and poster) and published in a Proceedings Volume (hard copy and CD-ROM)➣ nine technical sessions on Tues-Wed, 7th-8th Dec., comprising up to twenty-seven oral papers ➣ special informal evening session on Tues, 7th Dec., for a highlighted area or topic➣ exhibition for up to 25 poster presentations
Registration: US$ 350 for IPA & AAPG Members / US$ 400 for Non-Members Includes luncheon for 2 days, seminar, and evening session on Tues, 7th Dec.
Field Trips: 1. Miocene Mt. Messenger deepwater depositional system on the North Island of New Zealand, November 20th-24th
2. Cross Borneo: Comparison of Sedimentation, Stratigraphy and Structure in Kutei Basin,East Kalimantan and Northwest Borneo, November 28th-December 5th
Short Courses: 1. Deepwater Depositional Systems, December 6th, 20042. Deepwater Pore Pressures and Fracture Gradients, December 6th, 2004
Accommodation: The Regent Jakarta; room rate/night for Deluxe Room is US$ 127 net.
For details please contact the IPA secretariat,phones: (62-21) 572-4284, 572-4285, 572-4286, 0811-938776 or fax (62-21) 572-4259,