1 Campus Los Jeronimos, Polytechnic School, Catholic University of Murcia, E-30107 Murcia, Spain;[email protected]
2 Department of Mechanical Engineering, Catholic University of Ávila, Calle Canteros, E-05005 Ávila, Spain;[email protected]
3 Department of Computer Science and Artificial Intelligence, Campus de San Vicente, University of Alicante,Ap. Correos 99, E-03080 Alicante, Spain; [email protected] (L.T.); [email protected] (J.F.V.)
Abstract: Taking into account that accessibility is one of the most strategic and determining factorsin economic models and that accessibility and tourism affect each other, we can say that the studyand improvement of one of them involved the development of the other. Using network analysis,this study presents an algorithm for labeling the difficulty of the streets of a city using differentaccessibility parameters. We combine network structure and accessibility factors to explore theassociation between innovative behavior within the street network, and the relationships with thecommercial activity in a city. Finally, we present a case study of the city of Avila, locating themost inaccessible areas of the city using centrality measures and analyzing the effects, in terms ofaccessibility, on the commerce and services of the city.
Urban tourism has been expanding globally over the last few decades [1]. The currentmobility [2] and the world tourism dynamics are in constant change and, at the same time,they are heavily structuring the trajectories of cities [3]. In this context, governments haverelied on strategic planning to shape cities to be more touristic. However, these changesusually focus on a healthy tourist without mobility problems.
Accessibility and tourism affect each other, and therefore the study and improvementof one of them involves the development of the other [4]. The concept of urban accessibilitycan be understood as the possibility that a person with any ability can reach and use places,as well as carry out activities of interest without barriers [5] and it is one of the moststrategic factors in economic models. Some of research has managed to build accessibilityindexes that can generally capture transport access to an area [6], understanding thataccessibility is driven by good infrastructure [7]. As already mentioned, accessibilityhas great impact on a key economic driving sector such as tourism [8]. Many scientificstudies focus on tourist trends, proposing theories about their behavior to predict eventheir seasonality [9,10]. Within the different typologies of tourism, the following researchrefers to cultural tourism, studying behavior through images of geolocation techniques toeven propose tourist routes within the different cities [11].
Extrapolation of the concept of network and its application for the understandingof urban networks is widely accepted and occupies a prominent place. Thus, there areexamples about the study of networks in the categorization of the structures of the city [12]and analysis of connectivity in cities [13,14] among others.
The study of complex network theory continues to be a challenge in research given alarge number of applications in many fields, such as economics, biology, communication,
ISPRS Int. J. Geo-Inf. 2021, 10, 491. https://doi.org/10.3390/ijgi10070491 https://www.mdpi.com/journal/ijgi
transportation. An increasing amount of research supports the implementation of thistheory, reaffirming the great importance that nodes within a network can have and thesignificance of the possible paths that prevail in it [15–17]. Complex network theorycontinues to be developed with the concepts, algorithms, methods, and models proposedin real network analyses [18,19].
For the analysis of the relevance of the role of nodes within the network in networktheory, the most commonly used tools have been the centrality measures [20,21]. Thereexist many investigations on the concept of centrality however, the presence of data in thestudy of centrality in networks is relatively recent [22–24]. In [22], the authors defined anovel centrality measure, called the Adapted PageRank Algorithm (APA) that establishes anode classification that takes into account the topology and data associated with the nodes.
Studies concerning the impact of accessibility on the organization of the pedestriannetwork, the location and distribution of activities, as well as urban services, focusing on theelderly [25,26] should be noted. Currently, studies of this relationship are generally dividedinto two aspects. The first one is based on concepts of gravitation/spatial interaction [27]and the other, on its usefulness for consumption [28–30]. With some of these studies,networks have been carried out that are capable of modeling and predicting tourist activityto analyze deficiencies and propose improvements in it [31].
Moreover, the result of having a World Heritage status has boosted tourism in manycities around the world. A large number of tourists and the side effects, such as theovercrowding of the main spaces in the city, are resulting in the need to develop newstrategies to protect heritage assets. One of these cities is Avila (Spain). This city wonthe first-ever European award for disabled-friendly cities (Access City Award in 2011)with different policies to improve the city through accessible resources [32] or transportcards [33].
In [34], the author analyzes the accessibility of the city attending all special conditionsof disabled people to improve access to hotels, restaurants, monuments, etc. However, it isinteresting to complement this work with the accessibility of the streets of the city, becausethere is a lack of strategies about this topic, and is personalized to all people with mobilityrestrictions. Moreover, these strategies have to incorporate solutions to some problemssuch as over-tourism, conflicts between residential and tourist uses, and mobility problems.In this paper we propose a novel algorithm for labeling the difficulty of the streets of acity using accessibility parameters such as the slope of a street, the existence of railings,sidewalks, or stairs, etc. In addition, we show a numerical example of the city of Avila,locating the most inaccessible areas of the city using centrality measures and analyzing theeffects in terms of accessibility to the commerce and services of the city. Finally, we showhow the restoration of some of the city streets could affect the accessibility and commercialimpact.
2. Materials2.1. Data Acquisition
Data was obtained using OpenStretMap (OSM) [35] and Overpass-turbo [36]. Theextracted data, such as roads, secondary roads, etc., are tied to the highway tag. From OSM,we extract information about the city as the location of stairs, commercial business, lengthof all streets, type of pavement, and other useful information. All this data is reviewed withmanual labeling from fieldwork activities. With Microsoft’s Bing Maps [37] service, theheights of a location given by its coordinates have been extracted. With this information,the slope of the streets in all its sections has been self-calculated. In addiction, the ShuttleRadar Topography Mission (SRTM) data was used to obtain the height of a point in the city,and the efficiency was compared using information obtained with data extracted from athird source, Strava, a popular website used to track users activity via GPS-enabled devices.The result is similar and we decided to use Bing Maps data.
ISPRS Int. J. Geo-Inf. 2021, 10, 491 3 of 15
2.2. Accessibility: Parameters
Allowing all people to move around the city (e.g., walking or on wheelchairs), whichreduces the use of cars and promotes public transport, are policies that can improve life ina city. In regards to tourism, making the city more accessible could positively affect theeconomy so as to help all people arrive at a business easily.
However, there are some obstacles or situations that entail mobility problems indifferent streets. For example, irregular pavement or an excessive slope are architecturalbarriers to access the different areas in a city. In this paper, we attend to the followingproblems: (i) Stairs, which pose a terminal obstacle for people with several mobilityproblems, (ii) slopes or ramps, that do not exceed 1:20, even preferably less, (iii) railings,whose existence will make a slope or a set of stairs more accessible, (iv) sidewalk, whosewidth should be at least 2.6 m plus wheelchair dimensions, and (v) ground or pavement,where bad conditions, or an irregular state could affect people with mobility problems.
2.3. Commercial and Tourism: Parameters
The data collected for the realization of this study belong to the number and geolo-cation of shops, hostels, hotels, bars, and businesses related to the tourism sector. Thedatabase has been carried out in detail for each of the streets belonging to the historicalpart of the city center. The accessibility measures for the different streets analyzed havealso been integrated into the database. As previously described, the objective is to findthe implication of the accessibility of different streets for a city’s economic and touristdevelopment.
3. Methods and Procedure
In this section, we explain the proposed algorithm for labeling the difficulty of a city’sstreets using accessibility parameters such as the slope of a street, the existence of railings,sidewalks, or stairs, etc. First, we show the APA Centrality measure to classify the streetsof a city. Then, we explain the labeling of the difficulty estimation value of each street.
3.1. Centrality Measure
In this subsection, we briefly describe the measure of centrality used to classify thestreets of the city.
The Adapted PageRank Algorithm (APA [22]) was proposed in 2012. This algorithmis an adaptation of the PageRank model for spatial networks with data, and it was initiallythought of for urban street networks. The APA model is based on the construction of amatrix MAPA that has two terms, one related to the topology of the graph and the secondone related to the information of the network:
MAPA = (1 − α)P − αV.
The eigenvector ~x of the matrix MAPA provides a classification of the network nodesaccording to the connectivity and presence of data.
3.2. Accessibility Limits
A city has different problems attending to accessibility limits, such as big slopes, stairs,uneven ground, cobblestone floor, inadequate, or nonexistent sidewalks, etc. All of thesetypes add to the mobility problems of each tourist (use of wheelchairs, baby carriages, andolder people with different mobility limitations) producing constraint paths or streets thatcertain types of people can not visit. To identify and classify the streets of a city accordingto some types of limitations or parameters, an algorithm is proposed.
In Figure 1, we show the decisions made about the labeling of street difficulty:
ISPRS Int. J. Geo-Inf. 2021, 10, 491 4 of 15
Avoid
Avoid if possible
No problems
0 m 3 m 6 m
p ≥ 10%
10% > p ≥ 8%p < 8%
p ≥ 8%
8% > p ≥ 6%p < 6%
p ≥ 6%
6% > p ≥ 4%p < 4%
de =10
de=5
de=2
dp = 10
dp = p
dp = p
c) Others mobility problems (do)
Railing (dr) = -1
Inadequate ground (dg) = +1 or +10
Sidewalks (dsw) = +5 or +10
a) Stairs (dst) b) Slopes (dsl)
d) Final difficulty (d)
d=0 d=6 d=10
dp = 10
dp = αp, where α=10/8
dp =αp, where α=10/8
dp = 10
dp = αp, where α=10/6
dp =αp, where α=10/6
d = λ1dst + λ2dsl + λ3dodo = dr + dg + dsw
Figure 1. Accessibility scheme: Calculation of the difficulty of a street.
3.2.1. Stairs Difficulty Estimation (dst)
Following the specifications of stairs in [38], we estimate three levels of stairs difficultyordered by color, using the indications of the users (see Figure 1a):
• Avoid stairs: This difficulty level is the most restrictive. It indicates all people thatcan not use stairs (e.g., people in wheelchairs, or people who prefer the option ofavoiding all stairs). All streets in this level have been registered as inaccessible paths(the difficulty of the street is dst = 10);
• Avoid if possible: This difficulty level means that a person can use stairs, but it is betternot to use them if possible, due to mobility problems. All people belonging to this levelprefer not to use stairs (e.g., people with a baby carriage or people who have selectedthis option). All streets in this level have been registered as moderate-difficulty paths(the difficulty of the street is dst = 5);
• No mobility problems: This difficulty level means that there are no stairs constraints.People can use all kind of stairs. All streets in this level are low difficulty paths (thedifficulty of the street is dst = 2).
3.2.2. Slope Difficulty Estimation (dsl)
When attending to architectural design considerations, ramps are a problem becausebuilding or monument entrances could be inaccessible due to the difference betweenindoor and outdoor levels. Governments and organizations work on policies to improvethe accessibility of these places. However, the slopes o streets affect people with mobilityconstraints.
Many streets with an elevated slope result in inaccessible routes due to differencesin level. In Table 1, we show the maximum recommended slope of a ramp, following thespecifications of Technical Accessibility Code of Spain Buildings [38], and their associateddifficulty based on a parameter α that represents the ration between length and slopeobtained from the maximum ramp permitted for this code (see Figure 1b).
With respect to the ratio α, we select different values according to the maximum valueof the range of the slope in each level. If we select the minimum value of the range (0.6 and0.4 in orange and green levels, respectively) we will reduce the threshold of the difficultyof a street and more streets will labeled with less difficulty.
ISPRS Int. J. Geo-Inf. 2021, 10, 491 5 of 15
Table 1. The difficulty of a street attending to its recommended slope and length.
There are other obstacles in streets that directly affect the mobility of people withlimitations of movements. Regarding the ground, an inadequate floor (cobblestone floor,bad condition floor, etc.) could limit the access of many people, such as a person with awheelchair. Moreover, the conditions of sidewalks are crucial. If a street has no sidewalks,or their conditions are irregular, the use of these streets is restricted. Moreover, we havelabeled as problematic streets other cases such as the kerb height of sidewalks, which canbe a major obstacle for wheelchair users. In the case of a pedestrian street or a living street,there is no difficulty in terms of sidewalks (if the pavement is irregular, the difficulty isapplied in this category). If a street where there are stairs or a ramp has a railing, that helpsto improve the mobility of the people and the difficulty of the street is reduced.
In Table 2, we show the assigned values of these obstacles. We can observe that railingsare the only element that reduces the accumulative difficulty (see Figure 1c).
Table 2. Difficulty of the different obstacles in the street.
Obstacle Moderate State Extreme State
Ground do+ = 1 do+ = 10Sidewalks do+ = 5 do+ = 10
Railing do− = 1 do− = 1
3.2.4. Final Difficulty Estimation (D)
To calculate the final difficulty of a street, we sum all partial values of mobilityproblems as follows:
D = λ1dst + λ2dsl + λ3do. (1)
The parameters λ1, λ2, and λ3 represent a weighting of the different restoration levels.With these parameters we could control the state of different elements of a city (e.g., if asidewalk can not be restored, we assume a value of 1).
We propose 3 accessibility levels, labeled by color (see Figure 1d), to represent theaccessibility of the streets. With respect to the mobility restrictions for a specific person, wespecify another three levels from a low restrictive level, when a person has few mobilityproblems (e.g., a person who can use stairs), to a high restrictive level, when a person hasseveral mobility restrictions (e.g., a person who can not use stairs). In Table 3, we can seethe accessibility levels, the final decision, and users characteristics of different streets. Forinstance, a street labeled with a final difficulty of 12, will be an inaccessible street that onlyhealthy people can use.
ISPRS Int. J. Geo-Inf. 2021, 10, 491 6 of 15
Table 3. Three accessibility levels of a street.
Difficulty Colour Level Street Label Users
D ≥ 10 Red Inaccessible Healthy people10 > D ≥ 6 Orange Problematic People with moderate mobility
D < 6 Green Accessible All people
4. Experiments and Results4.1. Constructing Urban City Networks
In this section, we study a case study: The city of Avila, Spain. Is an awarded city interms of accessibility.
The construction of its accessibility and commerce networks is shown. Note that bothnetworks are undirected because we focus on the difficulty of the streets independentof the direction of the path, and we are interested in the commerce information of them.Testing different values of lambda, as λ = 0.8, we observe that few streets have beenaffected (e.g., only seven streets will change from a red level color to orange, and studyingthese streets, the accessibility labeled could be wrong). For that, we assume the lambdaparameter is equal to the unit because the city can not be strongly restored due to itshistorical restrictions (UNESCO World Heritage City). With respect to the ratio α, wehave tested the maximum value (0.8 and 0.6 in orange and green levels, respectively) andthe minimum value of the range (0.6 and 0.4). However, in our case study, there are nodifferences (only two streets will change from the red to orange level, and we see as thestate of both streets could be ambiguous).
4.1.1. Accessibility Network
Given a list of final difficulties of streets or partial sections of these streets, we constructa network through a primary graph as follows. Let GA(V, E, W), an undirected weightedgraph where V is the set of n nodes, representing the intersections between streets, E is theset of e edges or streets, and W is a weighted matrix, which contains the difficulty values ofall streets (D).
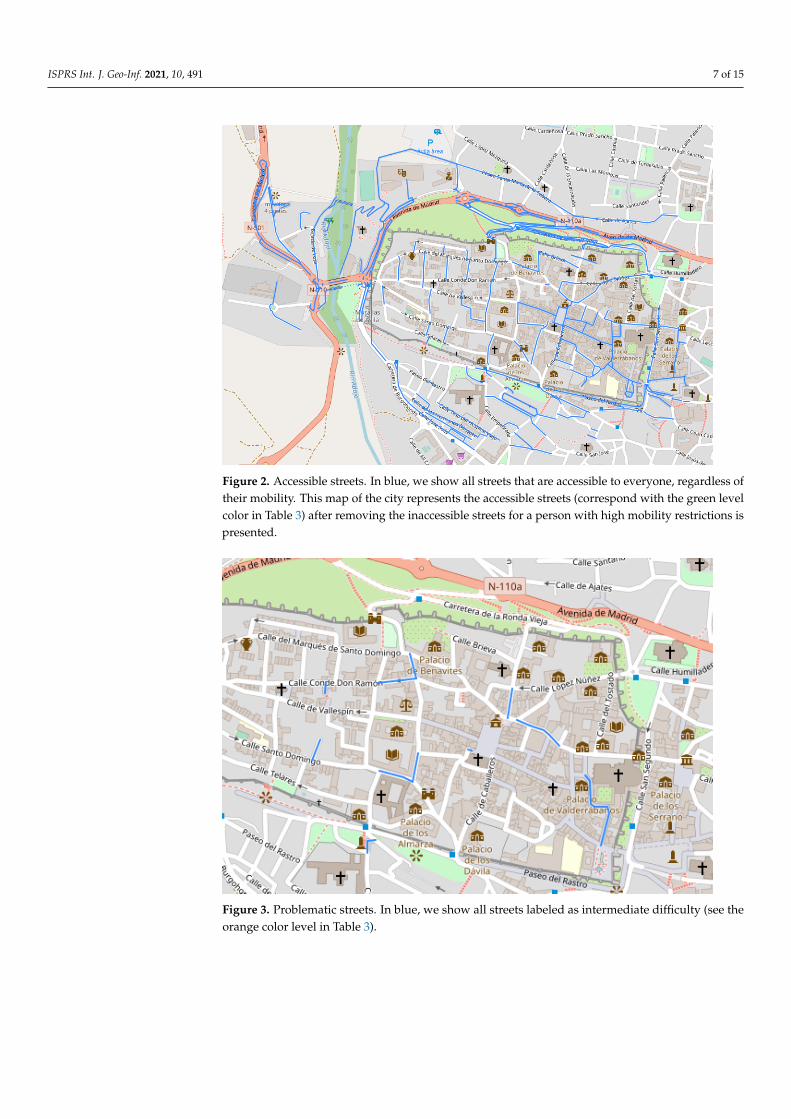
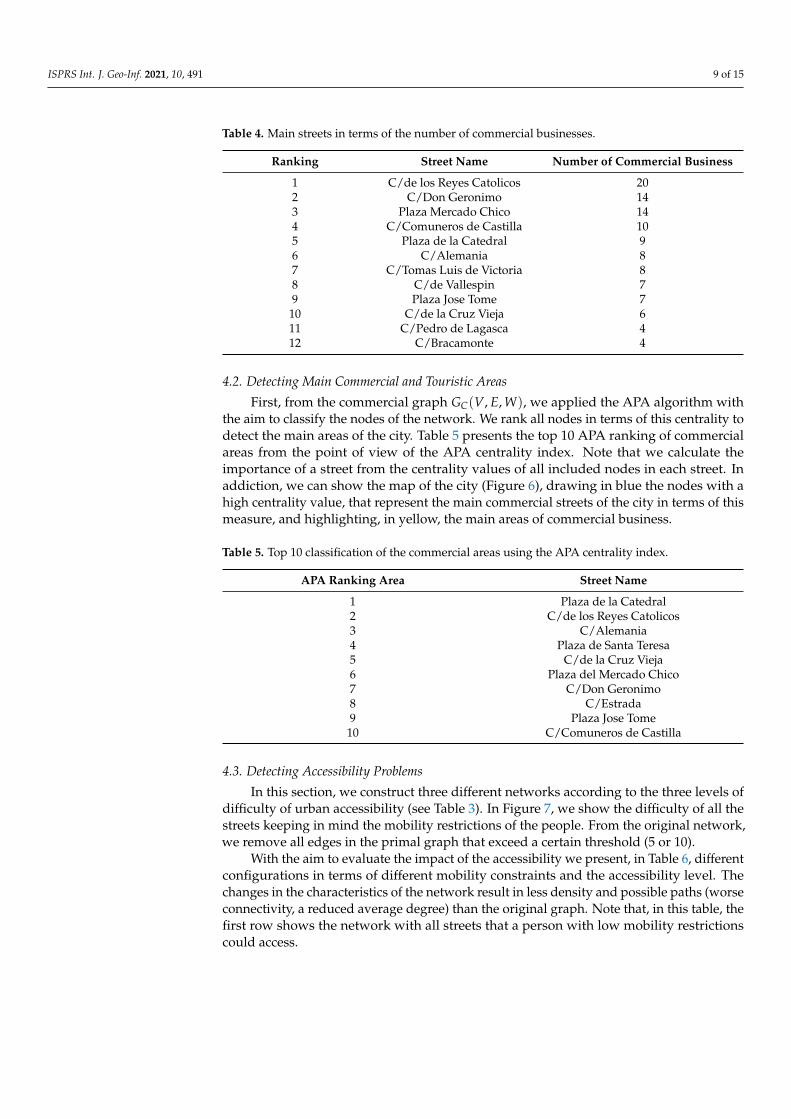
We create three different graphs representing the accessibility according to the differentconstrained mobility levels: (i) Low, a graph with the accessible streets that all peoplecould use (see Figure 2), (ii) moderate, adding to accessible streets some problematic streets(see Figure 3) that people with moderate mobility could use, and (iii) high, where allinaccessible streets (see Figure 4) have been removed, and only people without mobilityconstraints could access.
ISPRS Int. J. Geo-Inf. 2021, 10, 491 7 of 15
Figure 2. Accessible streets. In blue, we show all streets that are accessible to everyone, regardless oftheir mobility. This map of the city represents the accessible streets (correspond with the green levelcolor in Table 3) after removing the inaccessible streets for a person with high mobility restrictions ispresented.
Figure 3. Problematic streets. In blue, we show all streets labeled as intermediate difficulty (see theorange color level in Table 3).
ISPRS Int. J. Geo-Inf. 2021, 10, 491 8 of 15
Figure 4. Inaccessible streets. In blue, we show all streets that can not be accessed by people withimportant mobility problems (e.g., people with wheelchairs), that corresponds with the red colorlevel in Table 3.
4.1.2. Commercial Network
In Figure 5, we show the street with the most commercial businesses in the studiedarea of the city. We list, in Table 4, the top streets regarding the number of businesses.
Given a list of the commercial businesses of every street, we construct a primarygraph GC(V, E, W) (undirected weighted graph) where V is the set of n nodes, representingthe intersections between streets, E is the set of e edges (streets), and W is a weightedmatrix, which contains the sum of all commercial businesses of each street (explained inSection 2.2).
Figure 5. Top commercial business streets of the city.
ISPRS Int. J. Geo-Inf. 2021, 10, 491 9 of 15
Table 4. Main streets in terms of the number of commercial businesses.
Ranking Street Name Number of Commercial Business
1 C/de los Reyes Catolicos 202 C/Don Geronimo 143 Plaza Mercado Chico 144 C/Comuneros de Castilla 105 Plaza de la Catedral 96 C/Alemania 87 C/Tomas Luis de Victoria 88 C/de Vallespin 79 Plaza Jose Tome 7
10 C/de la Cruz Vieja 611 C/Pedro de Lagasca 412 C/Bracamonte 4
4.2. Detecting Main Commercial and Touristic Areas
First, from the commercial graph GC(V, E, W), we applied the APA algorithm withthe aim to classify the nodes of the network. We rank all nodes in terms of this centrality todetect the main areas of the city. Table 5 presents the top 10 APA ranking of commercialareas from the point of view of the APA centrality index. Note that we calculate theimportance of a street from the centrality values of all included nodes in each street. Inaddiction, we can show the map of the city (Figure 6), drawing in blue the nodes with ahigh centrality value, that represent the main commercial streets of the city in terms of thismeasure, and highlighting, in yellow, the main areas of commercial business.
Table 5. Top 10 classification of the commercial areas using the APA centrality index.
APA Ranking Area Street Name
1 Plaza de la Catedral2 C/de los Reyes Catolicos3 C/Alemania4 Plaza de Santa Teresa5 C/de la Cruz Vieja6 Plaza del Mercado Chico7 C/Don Geronimo8 C/Estrada9 Plaza Jose Tome
10 C/Comuneros de Castilla
4.3. Detecting Accessibility Problems
In this section, we construct three different networks according to the three levels ofdifficulty of urban accessibility (see Table 3). In Figure 7, we show the difficulty of all thestreets keeping in mind the mobility restrictions of the people. From the original network,we remove all edges in the primal graph that exceed a certain threshold (5 or 10).
With the aim to evaluate the impact of the accessibility we present, in Table 6, differentconfigurations in terms of different mobility constraints and the accessibility level. Thechanges in the characteristics of the network result in less density and possible paths (worseconnectivity, a reduced average degree) than the original graph. Note that, in this table, thefirst row shows the network with all streets that a person with low mobility restrictionscould access.
ISPRS Int. J. Geo-Inf. 2021, 10, 491 10 of 15
Figure 6. Map of most important areas according to the APA centrality measure.
Figure 7. Difficulty values of the main streets of the city. The background color means the streetaccessibility levels for three different mobility restrictions.
Low Green 452 (56.99%) 3.85Low Orange 464 (58.51%) 4.51
Moderate Green 449 (56.62%) 3.85Moderate Orange 464 (58.51%) 4.65
High Green 445 (56.11%) 3.71High Orange 458 (57.75%) 4.43
4.4. How to Increase the Touristic Impact: Densifying the Network
Following the results obtained in Table 6, it is possible to evaluate the inaccessiblebusinesses in a case study where the mobility constraints are low.
In Table 7, we can see that a quarter (25.42%) of the businesses of the city are locatedon accessible streets for people without major restrictions in mobility, but people with highmobility problems can not access them. Moreover, 8.75% of them are inaccessible for allpeople with any mobility problem (they are only accessible for healthy people).
Table 7. Commercial accessibility before restoration.
Accessibility Level Inaccessible Business (%)
Green 25.42%Orange 8.75%
Some streets could be made more accessible through different actions such as im-proving the pavement (D = D − 5), adding a railing (D = D − 1), and improving oradding the sidewalks (D = D − 5). In Table 8, we show the number of streets whoseaccessibility difficulty is slightly higher than the thresholds. For example, for a person withlow mobility restrictions, if we restore a street by adding a railing, we can make four streetsmore accessible, even one of the streets will be fully accessible. Improving the pavement orthe sidewalks of 282 streets will be more accessible (orange accessibility level), and 58 ofthem will be completely accessible (green accessibility level).
After the restoration of previous streets, the network is denser than the original, andthe number of the commercial inaccessible businesses is reduced from 25.42% to 21.32%with a slight restoration and to 8.76% with a moderate restoration in the best case (seeTable 9). With a strong restoration of the city, almost all business will be accessible by mostof the people (0.71%).
ISPRS Int. J. Geo-Inf. 2021, 10, 491 12 of 15
Table 9. Commercial accessibility after restoration.
Accessibility Level Thresholds Exceeded (α) Inaccessible Business (%)
Green α < 1 21.32%α < 5 8.76%
Orange α < 1 8.61%α < 5 0.71%
Finally, we show a case study of the restoration of three streets: Calle del Tostado,Calle de Caballeros, and Calle de la Cruz Vieja. After studying these streets, we propose thefollowing actions:
• To widen a sidewalk in Calle del Tostado, reducing its accessibility difficulty to 0. Thereare two restaurants and a hotel located on the street;
• To widen a sidewalk in a small stretch of street Calle de Caballeros, reducing its accessi-bility difficulty to 0. There are seven businesses, a restaurant and a hotel located onthe street;
• To add appropriate sidewalks in Calle de la Cruz Vieja, reducing its accessibility dif-ficulty to 2.14. There are two restaurants, a hostel, and a business located on thestreet.
According to these changes, we recalculate the connectivity of the city with APAcentrality measure, and we show how the average centrality of different streets changesand the impact that this produces in terms of accessibility on different areas of the city:Historic and commercial streets of the city. Then, in Table 10, a comparison of the averageof the APA centrality of main streets of the city in terms of accessibility before and after therestoration of the selected three streets are presented. The second column is the impact ofthe restoration calculating the difference of the averages between APA centrality measuresof the main streets (historical area) before and after restoration and the third column issimilar to the second column however by taking the main commercial streets (see Table 5).
For instance, the impact of the restoration (for people with low mobility problems) ofthese three streets is an improvement of 12.9% (centrality) in the streets belonging to thehistoric area and 4.71% in the streets more important in terms of business.
Table 10. Comparison of the average of the APA centrality of main streets of the city in terms ofaccessibility before and after the restoration of the selected three streets.
Mob. Constraints Historic Center Impact Commercial Impact
High 3.3467 × 10⁻⁴ (+11.41%) 1.8928 × 10⁻⁵ (+0.95%)
From these results, we can see the advantages of the restoration of some streets. More-over, if we adapt several streets of the city we achieve an improvement of their accessibilityand reduce the number of inaccessible businesses. We have a more connected city (a densergraph, and a uniform degree of all streets), which means more equal accessibility to themain streets of the city, where the tourist could take more possible paths and access morebusinesses in the city.
5. Discussion
In this paper, we focus on studying the accessibility of all people that visit a city withsome mobility restrictions and its effects in other aspects, such as the economy (accessibilityto all businesses of a city). For that, the proposed algorithm measures the difficulty of eachstreet attending to the existence of stairs, slopes, railings, and the state of sidewalks andthe pavement. This difficulty has different parameters to allow change for the restoration
ISPRS Int. J. Geo-Inf. 2021, 10, 491 13 of 15
possibilities of the streets in a city, and we choose the values of these parameters followingthe specifications of the Technical Accessibility Code of Spain Buildings.
Concerning parameters that represent the restoration levels (lambda in Equation (1)),these values help to control the state of restoration of different elements of a city. If weselect a low value, it means that we relax the difficulty with respect to the thresholds. In ourcase study, in theory, the best value is the unit because it is difficult to restore a historicalarea of the city of Avila. To test this hypothesis, we probe a smaller value of lambda (0.8)and we observe few changes (only seven streets will change from the red level color toorange), and comparing with manual labeling, these streets could be wrong. For that, thebest value in our case study is 1.
After constructing the urban and commercial networks, we applied the APA algorithmto the commercial graph, with the aim of ranking the nodes. As a result, Table 5 presentsthe top 10 APA ranking of commercial areas.
Focusing on the impact of accessibility, Table 6 shows different configurations in termsof different mobility constraints and accessibility levels. It can be observed that changesin the characteristics of the network result in less density than the original graph. Then,following the results obtained in that Table, we evaluate the inaccessible businesses wherethe mobility constraints are low. Table 7 show that a quarter (25.42%) of the businessesof the city are located on inaccessible streets for people with high mobility problems.Moreover, 8.75% of them are only accessible for healthy people.
Our following step is to study how to increase the accessibility of some streets throughdifferent actions such as improving the pavement, adding a railing, and improving oradding the sidewalks. It can be seen in Table 9 that after the restoration of some streets, thenetwork is denser than the original, and the number of commercial inaccessible businessesis reduced from 25.42% to 21.32% with a slight restoration and to 8.76% with a moderaterestoration in the best case. With a strong restoration of the city, almost all businesses willbe accessible.
Finally, we go into more detail by analyzing how the improving of the accessibility ofthree streets could affect the entire city. To demonstrate this, we recalculate the connectivityof the city with APA centrality measure of the main streets of the city in terms of accessibilitybefore and after the restoration (see Table 10). An analysis of the aforementioned tableshows that adapting several streets of the city, it is possible to have a more connected cityin terms of accessibility.
6. Conclusions
The methodology proposed in this work highlights the importance of restoring somestreets in a city, which produces an improvement in the accessibility of a city, and inaddition, commerce and tourism benefit. Although the concept is clear, the main problemis the limitations in changes on areas of a historic city, because of heritage laws whichmake a strong restoration impossible. As a result of that, we focus on demonstrating how asimple improvement of two or three streets (e.g., installing railings) could positively affectthe accessibility of a city. Another detected problem is the length of a path: Our methodcan obtain a personalized path for each person with accessibility problems, but this pathcould be different to the shortest route. That is, this methodology gives priority to a lessdifficult path even if it is longer than the shortest path.
We propose a methodology for labeling the estimated difficulty of all streets of a cityin terms of different parameters of accessibility, such as stairs, the slopes of a street, theexistence of railings, the state of a sidewalk, or irregular grounds.
In our experiments, focused on a case study of the city of Avila (Spain). By labelingthe difficulty, we generate the network of accessibility for different mobility constraints.We study the most important areas in terms of the number of businesses using the APAcentrality index, and compare it with the network of accessibility to show the inaccessiblezones of a city, wherein the worse case (43.01%) shows the impossibility of people withmobility problems accessing 25.42% of commerce in the city.
ISPRS Int. J. Geo-Inf. 2021, 10, 491 14 of 15
Finally, we show a simulated situation where three streets are restored. The resultsshow how accessibility (12.90% in the city center) and commercial impact (4.71%) areimproved.
Author Contributions: All authors contributed equally to this work. All authors have read andagreed to the published version of the manuscript.
Funding: This research was funded by Diputación de Ávila (Convocatoria de Ayudas a la Investi-gación sobre Temas Abulenses 2019).
Conflicts of Interest: The authors declare no conflict of interest.
References1. Russo, A.P.; Scarnato, A. “Barcelona in common”: A new urban regime for the 21st-century tourist city? J. Urban Aff. 2018,
40, 455–474. [CrossRef]2. Urry, J. Mobilities: New Perspectives on Transport and Society; Routledge: London, UK, 20163. Clavé, S.A. Urban tourism and walkability. In The Future of Tourism; Springer: Berlin/Heidelberg, Germany, 2019; pp. 195–211.4. Russo, A.P. The “vicious circle” of tourism development in heritage cities. Ann. Tour. Res. 2002, 29, 165–182. [CrossRef]5. Gaglione, F.; Gargiulo, C.; Zucaro, F. Elders’ quality of life. A method to optimize pedestrian accessibility to urban services.
TeMA J. Land Use Mobil. Environ. 2019, 12, 295–312.6. Allen, W.B.; Liu, D.; Singer, S. Accesibility measures of US metropolitan areas. Transp. Res. Part B Methodol. 1993, 27, 439–449.
[CrossRef]7. Maroto, A.; Zofío, J.L. Accessibility gains and road transport infrastructure in Spain: A productivity approach based on the
Malmquist index. J. Transp. Geogr. 2016, 52, 143–152. [CrossRef]8. Domínguez, T.; Fraiz, J.A.; Alén, E. Economic profitability of accessible tourism for the tourism sector in Spain. Tour. Econ. 2013,
19, 1385–1399. [CrossRef]9. Rodríguez-Echeverría, J.; Semanjski, I.; Van Gheluwe, C.; Ochoa, D.; IJben, H.; Gautama, S. Density-Based Spatial Clustering and
Ordering Points Approach for Characterizations of Tourist Behaviour. ISPRS Int. J. Geo-Inf. 2020, 9, 686. [CrossRef]10. Zaragozí, B.; Trilles, S.; Gutiérrez, A. Passive Mobile Data for Studying Seasonal Tourism Mobilities: An Application in a
Mediterranean Coastal Destination. ISPRS Int. J. Geo-Inf. 2021, 10, 98. [CrossRef]11. Domènech, A.; Mohino, I.; Moya-Gómez, B. Using Flickr Geotagged Photos to Estimate Visitor Trajectories in World Heritage
Cities. ISPRS Int. J. Geo-Inf. 2020, 9, 646. [CrossRef]12. Crucitti, P.; Latora, V.; Porta, S. Centrality measures in spatial networks of urban streets. Phys. Rev. E 2006, 73, 036125. [CrossRef]13. Hennemann, S.; Derudder, B. An alternative approach to the calculation and analysis of connectivity in the world city network.
Environ. Plan. B Plan. Des. 2014, 41, 392–412. [CrossRef]14. Curado, M.; Tortosa, L.; Vicent, J.F.; Yeghikyan, G. Understanding mobility in Rome by means of a multiplex network with data.
J. Comput. Sci. 2021, 51, 101305. [CrossRef]15. Kim, Y.A.; Song, H.S. Strategies for predicting local trust based on trust propagation in social networks. Knowl.-Based Syst. 2011,
24, 1360–1371. [CrossRef]16. Wang, S.; Du, Y.; Deng, Y. A new measure of identifying influential nodes: Efficiency centrality. Commun. Nonlinear Sci. Numer.
Simul. 2017, 47, 151–163. [CrossRef]17. Zhang, X.; Zhu, J.; Wang, Q.; Zhao, H. Identifying influential nodes in complex networks with community structure. Knowl.-Based
Syst. 2013, 42, 74–84. [CrossRef]18. Albert, R.; Jeong, H.; Barabási, A.-L. Diameter of the world-wide web. Nature 1999, 401, 130–131. [CrossRef]19. Newman, M.E. The structure and function of complex networks. SIAM Rev. 2003, 45, 167–256. [CrossRef]20. Estrada, E.; Bodin, Ö. Using network centrality measures to manage landscape connectivity. Ecol. Appl. 2008, 18, 1810–1825.
[CrossRef]21. Freeman, L.C. Centrality in social networks conceptual clarification. Soc. Netw. 1978, 1, 215–239. [CrossRef]22. Agryzkov, T.; Oliver, J.L.; Tortosa, L.; Vicent, J.F. An algorithm for ranking the nodes of an urban network based on the concept of
PageRank vector. Appl. Math. Comput. 2012, 219, 2186–2193. [CrossRef]23. Agryzkov, T.; Tortosa, L.; Vicent, J.F. New highlights and a new centrality measure based on the Adapted PageRank Algorithm
for urban networks. Appl. Math. Comput. 2016, 291, 14–29. [CrossRef]24. Agryzkov, T.; Curado, M.; Tortosa, L.; Vicent, J.F. Extending the Adapted PageRank Algorithm Centrality to Multiplex Networks
with Data Using the PageRank Two-Layer Approach. Symmetry 2019, 11, 284. [CrossRef]25. Gaglione, F.; Cottrill, C.; Gargiulo, C. Urban services, pedestrian networks and behaviors to measure elderly accessibility. Transp.
Res. Part D Transp. Environ. 2021, 90, 102687. [CrossRef]26. Handy, S.L.; Niemeier, D.A. Measuring accessibility: An exploration of issues and alternatives. Environ. Plan. A 1997,
29, 1175–1194. [CrossRef]27. Ben-Akiva, M. Disaggregate travel and mobility choice models and measures of accessibility. In Behavioural Travel Modelling;
28. Kwan, M.P. Space-time and integral measures of individual accessibility: A comparative analysis using a point-based framework.Geogr. Anal. 1998, 30, 191–216. [CrossRef]
29. Páez, A.; Scott, D.M.; Morency, C. Measuring accessibility: Positive and normative implementations of various accessibilityindicators. J. Transp. Geogr. 2012, 25, 141–153. [CrossRef]
30. Sarlas, G.; Páez, A.; Axhausen, K.W. Betweenness-accessibility: Estimating impacts of accessibility on networks. J. Transp. Geogr.2020, 84, 102680. [CrossRef]
31. Asero, V.; Gozzo, S.; Tomaselli, V. Building tourism networks through tourist mobility. J. Travel Res. 2016, 55, 751–763. [CrossRef]32. Ayuntamiento, D.Á. Guía de Recursos Accesibles de la Ciudad de Ávila; Ayuntamiento de Ávila: Ávila, Spain, 200833. Oficina Municipal de Accesibilidad (Avila, Spain). 2007. Available online: http://www.avila.es/articles/accesibilidad
(accessed on 29 May 2021).34. Arcos, F.J.M. Turismo accesible, turismo para todos en una ciudad patrimonio de la humanidad: El caso de Ávila. Rev. Tur.
Desenvolv. 2009, 11, 73–79.35. OpenStreetMap. Available online: https://www.openstreetmap.org (accessed on 29 May 2021).36. Overpass Turbo. Available online: https://overpass-turbo.eu (accessed on 29 May 2021).37. Microsoft Bing. Available online: https://www.bing.com/maps (accessed on 29 May 2021).38. de la Edificación, L.d.O.; Parte, I. Código Técnico de la Edificación; Minvivienda: Madrid, Spain, 2006.