+ All Categories
Home > Documents > A new paradigm of international migration between the ... HUGO, Graeme 1 A new paradigm of...

A new paradigm of international migration between the ... HUGO, Graeme 1 A new paradigm of...

Date post: 21-Apr-2018
Category:
Upload: builiem
View: 220 times
Download: 3 times
Share this document with a friend
67
1 HUGO, Graeme 1 A new paradigm of international migration between the European Union and Australia: Patterns and Implications GRAEME HUGO Professor of Geography and Director of the National Centre for Social Applications of GIS, University of Adelaide National Europe Centre Paper No. 62 Paper presented to conference entitled The Challenges of Immigration and Integration in the European Union and Australia, 18-20 February 2003, University of Sydney
Transcript

1 HUGO, Graeme

1

A new paradigm of international migration between the European Union and Australia:

Patterns and Implications

GRAEME HUGO Professor of Geography and Director of the National Centre for Social

Applications of GIS, University of Adelaide

National Europe Centre Paper No. 62

Paper presented to conference entitled The Challenges of Immigration and Integration in the European

Union and Australia, 18-20 February 2003, University of Sydney

2 HUGO, Graeme

2

Abstract: International migration between the European Union (EU) and Australia has a

long history. However, the pattern of this migrational flow has undergone some profound

changes in the last decade. This paper provides an Australian-end perspective on these

changes using the 2001 Census of Population and Housing, arrival/departure information

and survey results to establish the nature and scale of these changes. Australia is

recognised, along with Canada, the United States and New Zealand, as a ‘traditional

country of immigration’ and the EU has been one of the largest single suppliers of settlers

to Australia with 12 percent of Australians at the 2001 Census being born in the EU and a

similar number being Australian-born with a EU-born parent. However, with the massive

global shifts occurring in international migration, the migration relationship has become

much more complex. On the one hand, Australia has entered a new paradigm of

international migration in which non-permanent settlement movements have assumed

central significance. The EU has been a major source of such people moving to Australia.

There has long been a substantial counter flow of people moving from Australia to the EU

among which former settlers have dominated. In recent years the numbers of Australian-

born moving on a permanent or long-term basis to the EU has increased substantially. It is

argued that the bulk of research knowledge in Australia is based on the settlement

paradigm which is now only a minor part of migration between Australia and Europe.

There is a need to reorient research activity in Australia to encompass the new forms of

movement. In addition to identifying the scale of the new forms of international migration

influencing movements between the EU and Australia, trends in that movement and the

composition of flows are explored. This paper traces a number of the policy implications

which arise.

3 HUGO, Graeme

3

INTRODUCTION

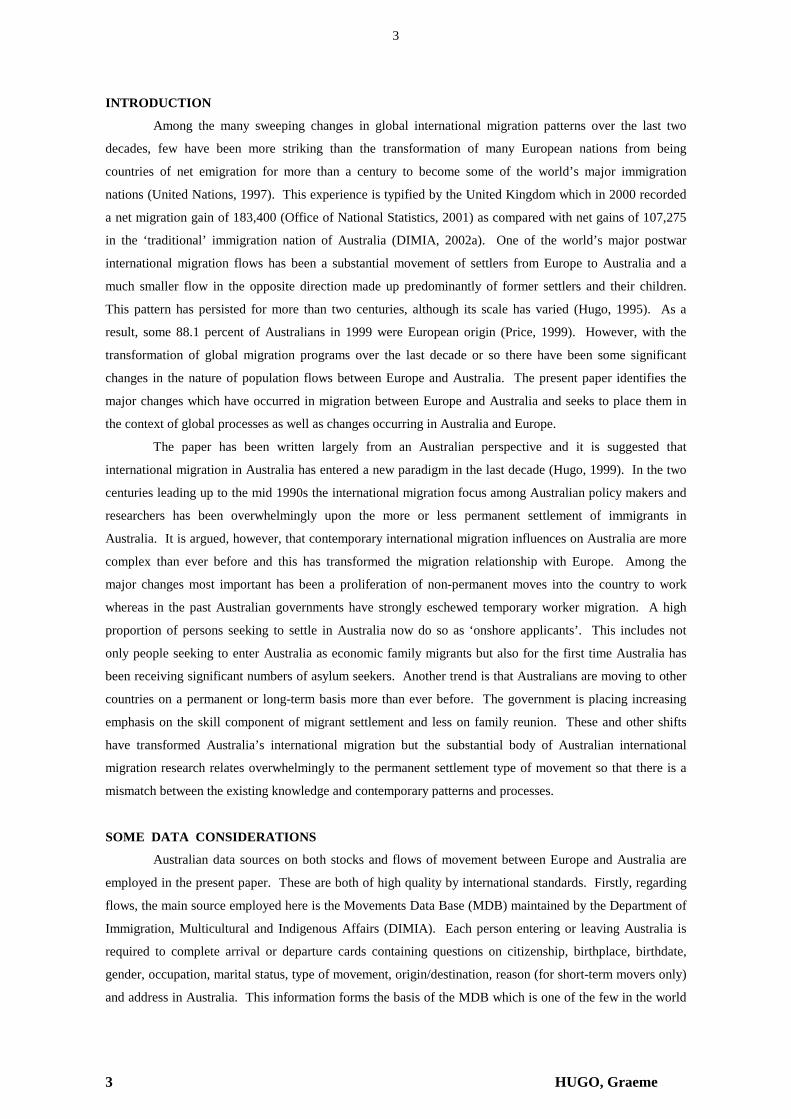
Among the many sweeping changes in global international migration patterns over the last two

decades, few have been more striking than the transformation of many European nations from being

countries of net emigration for more than a century to become some of the world’s major immigration

nations (United Nations, 1997). This experience is typified by the United Kingdom which in 2000 recorded

a net migration gain of 183,400 (Office of National Statistics, 2001) as compared with net gains of 107,275

in the ‘traditional’ immigration nation of Australia (DIMIA, 2002a). One of the world’s major postwar

international migration flows has been a substantial movement of settlers from Europe to Australia and a

much smaller flow in the opposite direction made up predominantly of former settlers and their children.

This pattern has persisted for more than two centuries, although its scale has varied (Hugo, 1995). As a

result, some 88.1 percent of Australians in 1999 were European origin (Price, 1999). However, with the

transformation of global migration programs over the last decade or so there have been some significant

changes in the nature of population flows between Europe and Australia. The present paper identifies the

major changes which have occurred in migration between Europe and Australia and seeks to place them in

the context of global processes as well as changes occurring in Australia and Europe.

The paper has been written largely from an Australian perspective and it is suggested that

international migration in Australia has entered a new paradigm in the last decade (Hugo, 1999). In the two

centuries leading up to the mid 1990s the international migration focus among Australian policy makers and

researchers has been overwhelmingly upon the more or less permanent settlement of immigrants in

Australia. It is argued, however, that contemporary international migration influences on Australia are more

complex than ever before and this has transformed the migration relationship with Europe. Among the

major changes most important has been a proliferation of non-permanent moves into the country to work

whereas in the past Australian governments have strongly eschewed temporary worker migration. A high

proportion of persons seeking to settle in Australia now do so as ‘onshore applicants’. This includes not

only people seeking to enter Australia as economic family migrants but also for the first time Australia has

been receiving significant numbers of asylum seekers. Another trend is that Australians are moving to other

countries on a permanent or long-term basis more than ever before. The government is placing increasing

emphasis on the skill component of migrant settlement and less on family reunion. These and other shifts

have transformed Australia’s international migration but the substantial body of Australian international

migration research relates overwhelmingly to the permanent settlement type of movement so that there is a

mismatch between the existing knowledge and contemporary patterns and processes.

SOME DATA CONSIDERATIONS

Australian data sources on both stocks and flows of movement between Europe and Australia are

employed in the present paper. These are both of high quality by international standards. Firstly, regarding

flows, the main source employed here is the Movements Data Base (MDB) maintained by the Department of

Immigration, Multicultural and Indigenous Affairs (DIMIA). Each person entering or leaving Australia is

required to complete arrival or departure cards containing questions on citizenship, birthplace, birthdate,

gender, occupation, marital status, type of movement, origin/destination, reason (for short-term movers only)

and address in Australia. This information forms the basis of the MDB which is one of the few in the world

4 HUGO, Graeme

4

to contain comprehensive information on both immigrants and emigrants. People leaving or coming in to

Australia are classified into three types of categories according to their intended length of their stay in

Australia or overseas:

• Permanent Movements

- Immigrants are persons arriving with the intention of settling permanently in Australia.

- Emigrants are Australian residents (including former settlers) departing with the stated

intention of staying abroad permanently.1

• Long-Term Movements

- Overseas arrivals of visitors with the intended or actual length of stay in Australia of

12 months or more.

- Departures of Australian residents with intended or actual length of stay abroad of

12 months or more.

• Short-Term Movements

- Travellers whose intended or actual stay in Australia or abroad is less than 12 months.

Clearly there are some problems associated with the use of ‘intentions’ as the key element in the definitions

of type of movement for the MDB. It is apparent that there are no guarantees that intentions will become

reality and as a result there is a significant amount of category jumping which occurs (Hugo, 1994, Chapter

Three). Zlotnik (1987, 933-934) has also been critical of the concept of residence used in these definitions

as a ‘fertile breeding ground for confusion’. Nevertheless the MDB provides useful and comprehensive

information on flows of people into and out of Australia which have few equals globally.

Turning to sources of information about the stocks of migrants, the quinquennial national censuses

of population and housing are utilised. Table 1 shows the immigration related questions asked at Australian

censuses and indicates that a comprehensive range of questions have been asked, especially in postwar

censuses. Of particular interest was the introduction in 1971 of a birthplace of parents question which has

been in each subsequent census and the experiment with an ancestry question in 1986 and 2001. The latter

has been excluded from several censuses because, although it produced a great deal of new insight into the

diversity of Australia’s population it generally failed to identify third and older generations of immigrants

(Khoo, 1989). Censuses have been conducted in Australia each five years since 1961 and have a low rate of

under-enumeration (less than 2 percent). The census allows us to identify the first generation migrants and

their Australia-born children and a number of their characteristics with a high degree of accuracy. However,

the census does not provide information on former residents who have emigrated out of Australia. With

respect to persons travelling out of Australia on a temporary basis, some information is obtainable if those

persons left households behind who could report their absence in a question on the census schedule relating

to usual residents who are absent on the night of the census. Visitors to Australia who happen to be in the

nation on the night of the census are counted in the de facto enumeration but excluded from most data on

birthplace.

1 However, before 1974 former settlers were not classified as emigrants unless they had been in Australia

for at least 12 months.

5 HUGO, Graeme

5

Table 1: Immigration and Ethnicity Related Topics Included in Australian Population

Censuses, 1911-2001

Source: Paice, 1990; ABS, 2000

Topics -

Persons

1911 1921 1933 1947 1954 1961 1966 1971 1976 1981 1986 1991 1996 2001

Birthplace * * * * * * * * * * * * * *

Birthplace of

parents

* * * * * * * *

Year of arrival * * * * * * * * * * * * * *

(Period of residence in

Australia)

Citizenship * * * * * * * * *(1) *(1) *(2) * * *

Aboriginal/TSI

origin

* * * * * * *(3) *(4) *(4) * * * * *

(Race)

Ethnic origin *(5) *

Number of

overseas

* * * * * * *

residents or

visitors

Language use *(6) *(7) *(8) *(9) *(10) * * *

Religion * * * * * * * * * * * * * *

Notes:

(1) Prior to 1976, ‘nationality’ rather than ‘citizenship’ was asked.

(2) Since 1986 the person has been asked whether or not they were an Australian citizen.

(3) In all censuses prior to 1971 respondents were required to state their race and, where race was mixed,

to specify the proportion of each.

(4) In the 1971 and 1976 censuses a question with response categories of European, Aboriginal, Torres

Strait Islander and other was included.

(5) A question on each person’s ancestry was asked for the first time in 1986.

(6) Question asked whether the person could read and write.

(7) Question asked whether the person could read and write a foreign language if unable to read and write

English.

(8) The 1976 census asked for ‘all languages regularly used’.

(9) In 1981 ability to speak English was asked.

(10) Since 1986 two separate questions have been asked – Language used and ability to speak English.

6 HUGO, Graeme

6

SETTLER MIGRATION FROM EUROPE TO AUSTRALIA

As a country with 23.1 percent (2001) of its population born overseas and 19.2 percent (1996)

being Australia-born with at least one parent born overseas, Australia is closer to its immigrant origins than

all other OECD countries. Only 2.2 percent of the 2001 population was of indigenous origin with the

remainder being immigrants or the descendants of post-1788 arrivals in Australia. Hence Price (1999)

estimates that the ethnic strength2 of Europeans in the Australian population as 88.1 percent in 1999. The

history of immigration from Europe to Australia in the first two centuries of non-indigenous settlement has

been comprehensively described in a number of works (e.g. Appleyard, 1959, 1964; Eggleston, 1933;

Crowley, 1954; Sherrington, 1980; Richards, 1991; Haines and Schlomoritz, 1990; Price, 1963; Borrie,

1954; Borrie and Price, 1982). Our main focus here is on the last decade but it is important to make brief

reference to the earlier period.

If one roughly divides non-indigenous settlement in Australia into the five periods designated in

Table 2, Europeans, especially people from the United Kingdom and Ireland, dominated the first four. The

growth of the Europe-born population is depicted in Figure 1 and Table 3. It will be noted that it grew

steadily in the nineteenth century peaking at 901,618. In the depressed 1890s and early years of Federation

it declined to 664,323 recovering to 807,358 in 1933 due to the immigration years following World War I. It

declined in the depression years of the 1930s and World War II to reach its lowest point for almost a century

in 1947 at 651,606 when also for the first time since European settlement began the proportion of the

foreign-born in the population fell below a tenth. The postwar period, as in many other dimensions of

immigration and settlement, saw a transformation in the scale and composition of European immigration to

Australia. Table 3 indicates that the British and Irish dominated the Europe-born population in Australia

throughout the nineteenth century.

2 Ethnic strength is derived by adding fractions of ancestry for generations.

7 HUGO, Graeme

7

Table 2: Eras in Non-Indigenous Settlement in Australia

Era Approximate Years Characteristics of Settler Intake

The Convict Period 1788-1840 • 157,161 convicts transported

• Free settlement predominantly from the UK

and Ireland

The Pre-Federation

Settlement Era

1840-1901 • Free settlement from the UK and Ireland

(much assisted)

• Limited other European settlement

• Some Asian migration (much of it

temporary)

The White Australia Era 1901-1947 • Overwhelmingly British-UK settlement

(much of it assisted)

• Limited other European settlement

The Post-War European

Era

1947-1975 • Opening of free settlement to non-British

European groups

• Continuation of UK/Ireland being the

predominant origin of settlers

• Gradual loosening of White Australia Policy

The Multicultural Era 1975-present • Opening up of settlement to non-European

origins

• Reduction of inflow of Europeans

• Increasingly planned nature of intake

Figure 1: Growth of the Europe-Born Population in Australia, 1861-2001

Source: Price et al., 1984; Australian Censuses, 1901-2001

0

500000

1000000

1500000

2000000

2500000

1861

1971

1881

1891

1901

1911

1921

1933

1947

1954

1961

1966

1971

1976

1981

1986

1991

1996

2001

Year

Num

ber

8 HUGO, Graeme

8

Table 3: Europe-Born Persons in Australia, 1861-2001

Source: Price et al., 1984; Australian Censuses, 1901-2001

Census Year Percent Overseas-

Born

Europe-Born

Population

Percent British

Isles

Intercensal Percent

per Annum Growth

1861 62.8 671,049 93.8

1971 46.5 726,323 93.5 +0.79

1881 36.8 757,514 92.0 +0.42

1891 31.8 901,618 91.0 +1.76

1901 32.8 753,832 90.6 -1.77

1911 27.1 664,323 91.6 -1.26

1921 25.5 744,244 88.8 +1.14

1933 23.6 807,358 83.5 +0.68

1947 9.8 651,606 57.7 -1.52

1954 14.3 1,155,064 47.5 +8.52

1961 17.0 1,596,212 47.5 +4.73

1966 18.4 1,893,511 49.6 +3.48

1971 20.2 2,196,478 50.0 +3.01

1976 20.1 2,210,817 52.4 +0.13

1981 20.9 2,232,718 52.4 +0.20

1986 21.1 2,221,802 50.9 -0.10

1991 22.5 2,300,773 51.1 +0.70

1996 22.8 2,217,009 50.9 -0.74

2001 23.1 2,136,052 50.9 -0.74

There were small flows from other parts of Europe (Borrie, 1954) but at the turn of the century the

UK/Ireland-born made up 91 percent of the Europe-born in Australia and 79.8 percent of all foreign-born.

The inmovement of a significant number of non-British Europeans, especially from Southern Europe (Price,

1963) in the high immigration years following World War II, slightly diluted the British dominance but in

1947 they made up 83.5 percent of all Europe-born persons in Australia.

The unprecedented increase in the scale of immigration to Australia in the postwar period is evident

in Figure 2. This saw the proportion of the nation’s population born overseas increase from almost treble to

reach 23.1 percent in 2001. It was not only a transformation in the scale of settlement but also in

composition. Figure 3 indicates that the postwar era has seen an increasing diversity in the intake which has

seen a reduction in the dominance of the UK/Ireland-born in the settler intake.

9 HUGO, Graeme

9

Figure 2: Australia: Annual Migration, 1850-2002

Source: Price, 1979; Hugo, 1986; ABS, Overseas Arrivals and Departures Bulletins; DIMIA,

Immigration Update, various issues

180

160

140

120

100

80

60

40

20

0

-20

-40

-601850 1860 1870 1880 1890 1990 1910 1920 1930 1940 1950 1960 1970 1980 1990 2000

YEAR

(000)

Bristish Net (ethnic stock)

Total British immigrationAssisted immigration

Total NetSettler Arrivals

Australian Long-term Net

180

160

140

120

100

80

60

40

20

0

-20

-40

-60

Figure 3: Australia: Settler Arrivals by Region of Last Residence, 1947-2002

Source: DIMIA, Australian Immigration Consolidated Statistics and Immigration Update, various

issues; ABS, Migration Australia, various issues

0

50000

100000

150000

200000

250000

300000

*194

5-47

1948

-49

1950

-51

1952

-53

1954

-55

1956

-57

1958

-59

1960

-61

1962

-63

1964

-65

1966

-67

1968

-69

1970

-71

1972

-73

1974

-75

1976

-77

1978

-79

1980

-81

1982

-83

1984

-85

1986

-87

1988

-89

1990

-91

1992

-93

1994

-95

1996

-97

1998

-99

2000

-01

Year

Num

ber

UK and Ireland Other Europe Africa Americas NZ and Pacific Middle East Asia

10 HUGO, Graeme

10

The early postwar years saw a very rapid growth of the European population which doubled in a decade and

doubled again in the 1960s to reach 2.2 million in 1971. Table 3 shows that over this period annual growth

in the European population was over 8 percent in the early postwar years, 4.7 percent in the late 1950s and

over 3 percent in the 1960s. European domination of Australian immigration during this period is in fact

understated in Figure 3 since there was an influx of people of European origin but born in former European

colonies in Asia, and to a lesser extent, Africa and immigrated to Australia during the decolonisation years

(Hugo, 2003). The initial influx of over 300,000 Displaced Persons from Eastern Europe (Kunz, 1988) were

the harbingers for later the large waves from Germany, the Netherlands, Poland, Italy, Greece and

Yugoslavia and smaller numbers from other European nations (Appendix A). Table 4 shows how the

population in these groups grew massively in the early postwar years with several reaching their peak

numbers in Australia in 1961 or 1971. These early postwar years saw a progressive increase in the cultural

diversity in the Australian population that was overwhelmingly Anglo-Celtic in 1945 and which began a

multicultural transformation which has continued. The share of the UK/Ireland-born in the European

population fell from 83.5 percent in 1947 to 47.5 percent in 1961.

Table 4: Growth of Largest Europe-Born Populations, 1947-2001

Source: Census of Population and Housing

Birthplace 1947

Population

Peak

Population Year

2001

Population

Population

Change

1996-2001

UK/Ireland 543,829 1,173,865 1991 1,085,248 -37,551

Italy 33,638 289,447 1971 218,718 -19,498

Former Yugoslavia 5,867 181,811 2001 181,811 +13,752

Greece 12,292 160,200 1971 116,431 -10,093

Germany 14,583 114,915 1991 108,220 -2,112

Netherlands 2,174 102,086 1961 83,324 -4,574

Poland 6,524 68,931 1991 58,110 -7,009

Malta 3,239 58,747 1981 46,998 -3,873

11 HUGO, Graeme

11

There was a slowing down in the growth of the Australian European population in 1971 as the

pressures to migrate out of many European countries diminished. At the same time the gradual dismantling

of the White Australia Policy saw a considerable widening of the countries from which Australia drew

settlers. Figure 3 shows how after 1970 the intake has increasingly been drawn from Asia, New Zealand and

the Pacific, and to a lesser extent the Americas and Africa. Accordingly, the Europe-born population has

stabilised around 2 million. Examination of the annual data regarding immigrants to Australia from Europe

Figure 4 indicates that the postwar period can be divided into two distinct phases. In the period up to the

early 1970s was of high levels of immigration and settlement, with inflow of more than 80,000 in more than

half the years.

Figure 4: Australia: Immigrants from Europe, 1951-2002

Source: CBCS, Demography Bulletins; DIMIA, Australian Immigration Consolidated Statistics

and Immigration Update, various issues; ABS, Migration Australia, various issues

Note: Data for 2001-02 comprise immigrants by country of birth. Data prior to this date comprise

immigrants by country of last residence. From 1960, data are for financial years. Prior to this,

data are for calendar years. Data for 2001 are not available.

However, in the second half of the postwar period, with the exception of the early 1980s, the inflow has been

around one quarter this size. The shift in postwar immigration is also reflected in Figure 5 which shows that

up to the early 1970s, Europeans made up more than 80 percent of settlers in Australia. This proportion

plummeted in the 1970s, and in most subsequent years Europeans were less than a third of settlers.

Figure 5: Immigrants from Europe as a Percentage of Total Immigrants, 1951-2002

0

20000

40000

60000

80000

100000

120000

140000

160000

1951

1953

1955

1957

1959

1961

1963

1965

1967

1969

1971

1973

1975

1977

1979

1981

1983

1985

1987

1989

1991

1993

1995

1997

1999

2001

Year

Num

ber

12 HUGO, Graeme

12

Source: CBCS, Demography Bulletins; DIMIA, Australian Immigration Consolidated Statistics

and Immigration Update, various issues; ABS, Migration Australia, various issues

Note: Data for 2001-02 comprise immigrants by country of birth. Data prior to this date comprise

immigrants by country of last residence. From 1960, data are for financial years. Prior to this,

data are for calendar years. Data for 2001 are not available.

In terms of European settler immigration to Australia, Figure 6 shows that there have been three

main eras. The first up to World War II when immigration was overwhelmingly European and

overwhelmingly British. The next quarter century saw a continuation of European dominance but a rapid

fall in the component born in England and Ireland. The last twenty-five years have seen a reduction in the

proportion of Australia’s overseas-born made up of Europeans.

0

10

20

30

40

50

60

70

80

90

10019

51

1953

1955

1957

1959

1961

1963

1965

1967

1969

1971

1973

1975

1977

1979

1981

1983

1985

1987

1989

1991

1993

1995

1997

1999

2001

Year

Per c

ent

13 HUGO, Graeme

13

Figure 6: Birthplace of the Overseas-Born Population, 1861-2001

Source: Price et al., 1984; Australian Censuses

71 1901 11 21 1933 20011861 81 91

United Kingdom/Ireland-born

Other Europe-born

Other Overseas-born

9181716154470

10

20

30

40

50

60

70

100

90

80

YEAR

The demographic impact of postwar immigration in Australia has been considerable. Kippen and

McDonald (2000) estimated that between the war and 2000 immigration was responsible for adding

7 million to the population and that if postwar net immigration was zero the national population would be

8 million instead of 19 million. However, more important as this numerical have been the social, cultural

and economic transformations in which immigration has played a role. A major element in this has been the

transformation of Australia from an overwhelmingly British dominated population to a multicultural society.

Table 5 indicates this, showing that the proportion of the national population born in dominantly non-

English speaking nations declined from 98.1 to 86 percent between 1947 and 2001, while that born in Asian

countries increased from 0.3 to 6.5 percent. The shift which has occurred is evident in the rates of growth of

various foreign-born groups.

14 HUGO, Graeme

14

Table 5: Change in the Composition of the Australian Population by Place of Birth, 1947-2001

Source: ABS, 1947 and 2001 Censuses

1947 2001

Number of

Persons Percent

Number of

Persons Percent

English speaking origin 7,438,892 98.1 15,232,338 86.0

Australia 6,835,171 90.2 13,629,685 76.9

United Kingdom and Ireland 543,829 7.2 1,086,480 6.1

New Zealand 43,619 0.6 355,765 2.0

United States and Canada 10,304 0.1 80,983 0.5

South Africa 5,969 0.1 79,425 0.4

Non-English speaking origin 140,466 1.9 2,485,110 14.0

Other Europe 109,586 1.4 1,046,967 5.9

Asia* 23,293 0.3 1,151,438 6.5

Other Africa 1,531 0.0 104,811 0.6

Other America 1,323 0.0 79,821 0.5

Other Oceania 4,733 0.1 99,361 0.6

Total 7,579,358 100.0 17,717,448 100.0

* Includes Middle East

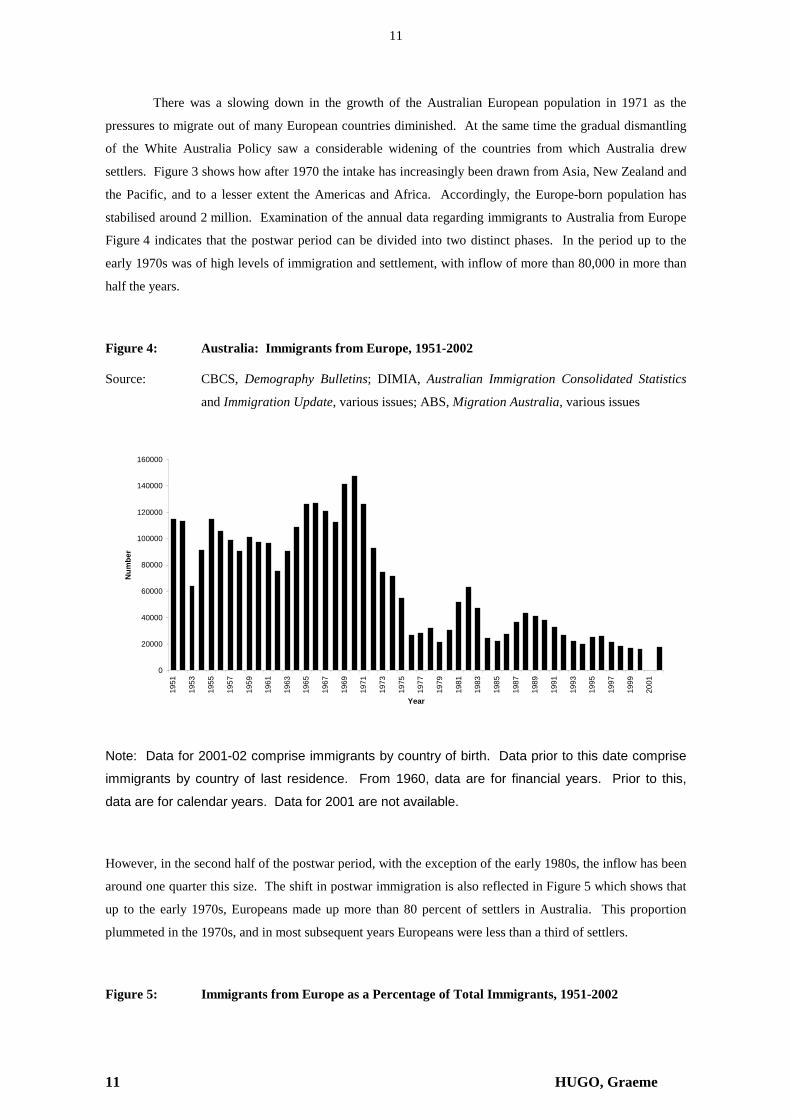
Table 6 shows that only the Russian Federation was among the 10 fastest growing birthplace groups in the

nation in the 1990s expanding at 6 percent per annum. It will be noted that virtually all of the 10 fastest

growing countries are ‘south’ nations, mainly from Asia. On the other hand, the slowest growing (indeed

decreasing) birthplace groups were all European.

Immigration to Australia is a more highly planned and controlled process than in almost any other

major immigration nation. In the three postwar decades the imperatives of Australian immigration policy

were both economic and demographic. On the one hand, there were massive labour shortages in the postwar

boom period and labour – skilled, semi-skilled and unskilled – was needed for the massive growth in

manufacturing. Also, there was a ‘populate or perish’ argument in the aftermath of the nation being almost

invaded by Japan during the war. With the end of the ‘long boom’ in the 1970s, the reduction in

manufacturing employment and increases in unemployment, immigration policy was redefined to involve a

planned numerical intake made up of a number of policy components:

Table 6: Australia: Fastest and Slowest Growing Groups of Foreign-Born Persons, 1991-2001*

15 HUGO, Graeme

15

Source: ABS, 1991 and 2001 Censuses

Country of Origin Number of Persons

2001

Percent Growth

1991-2001

Fastest growing groups:

Iraq 24,832 16.9

Afghanistan 11,297 15.3

Samoa 13,254 8.7

Pakistan 11,917 7.2

Korea, Republic of 38,902 6.4

China 142,781 6.1

Russian Federation 15,020 6.0

Taiwan 22,418 5.6

Thailand 23,599 5.3

South Africa 79,425 4.9

India 95,455 4.5

Slowest growing groups:

Germany 108,220 -0.6

Cyprus 19,482 -1.3

Austria 19,313 -1.3

Malta 46,998 -1.3

Netherlands 83,325 -1.4

Spain 12,662 -1.5

Italy 218,718 -1.5

Portugal 15,441 -1.5

Greece 116,430 -1.6

Poland 58,113 -1.7

Hungary 22,752 -1.8

* Countries with 10,000 or more persons in 2001.

The Migration Program operates within set planning levels and is made up of humanitarian and

non-humanitarian programs. The former involves:

• The Refugee Program which provides protection for people outside their country fleeing

persecution.

• Special Humanitarian Programs (SHP) which comprise the In-country Special Humanitarian

Program for people suffering persecution within their own country, and the Global Special

16 HUGO, Graeme

16

Humanitarian Program for people who have left their country because of significant discrimination

amounting to a gross violation of human rights.

• The Special Assistance Category (SAC) which embraces groups determined by the Minister for

Immigration and Multicultural Affairs to be of special concern to Australia and in real need, but

who do not fit within traditional humanitarian categories. This program also assists those internally

and externally displaced people who have close family links in Australia.

A new category in the humanitarian program in recent years is the Temporary Protection Visa

(TPV). This was introduced in October 1999 and is granted to most of the asylum seekers who enter

Australia unlawfully and who are assessed as meeting the requirements for refugee status. This is in contrast

to those refugees who settle in Australia under the three traditional ‘offshore’ categories listed above. The

‘onshore’ component numbered 3,891 in 2001-02 and 5,741 in 2000-01 and comprised predominantly non-

Europeans. Europeans have, however, made up a significant proportion of the offshore component of

refugee-humanitarian migrations in recent years as Table 7 indicates. This is a function of the conflicts

which have displaced populations in the former Yugoslavia and former USSR.

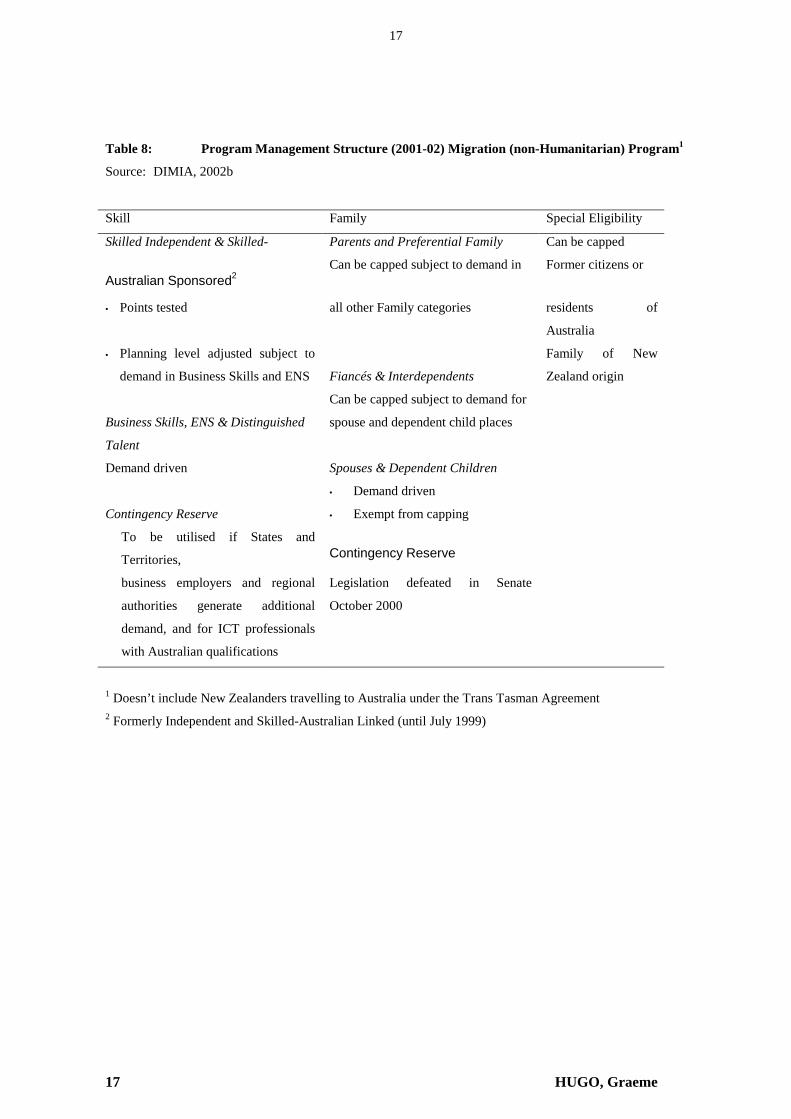
Within the non-humanitarian part of the Program there are three main components

summarised in Table 8 – Family, Skill and Special Eligibility although within each there are a number

of sub-programs.

Some components, i.e. Business Skills, Employer Nominated Scheme (ENS), Distinguished

Talent, Spouses and Dependent Children are demand driven and not subject to capping. Increases in

demand for these visas, beyond planned levels, are compensated by reductions in other program

components, i.e. Independent and Skilled-Australian Linked, Parents, Fiancés and Interdependents.

Family Migration consists of a number of categories under which a potential migrant can be sponsored

by a relative who is an Australian citizen or permanent resident of Australia.

Table 7: Outcomes of the Offshore Component of Australia’s Humanitarian Program by Region

from 1997-98 to 2001-02

Source: Rizvi, 2002, p. 29

17 HUGO, Graeme

17

Table 8: Program Management Structure (2001-02) Migration (non-Humanitarian) Program1

Source: DIMIA, 2002b

Skill Family Special Eligibility

Skilled Independent & Skilled- Parents and Preferential Family Can be capped

Australian Sponsored2 Can be capped subject to demand in Former citizens or

• Points tested all other Family categories residents of

Australia

• Planning level adjusted subject to

demand in Business Skills and ENS

Fiancés & Interdependents

Family of New

Zealand origin

Can be capped subject to demand for

Business Skills, ENS & Distinguished spouse and dependent child places

Talent

Demand driven Spouses & Dependent Children

• Demand driven

Contingency Reserve • Exempt from capping

To be utilised if States and

Territories, Contingency Reserve

business employers and regional

authorities generate additional

demand, and for ICT professionals

with Australian qualifications

Legislation defeated in Senate

October 2000

1 Doesn’t include New Zealanders travelling to Australia under the Trans Tasman Agreement 2 Formerly Independent and Skilled-Australian Linked (until July 1999)

18 HUGO, Graeme

18

In recent years there has been an increased emphasis on economic and skill criteria in the selection

of settlers (Birrell, 1999). The Skill Migration component of the program consists of a number of categories

for prospective migrants where there is demand in Australia for their particular occupational skills,

outstanding talents or business skills. These categories are:

• Independent migrants - not sponsored by an employer or relative in Australia. They must pass a

points test which includes skills, age and English language ability (21,778 visas in 2001-02).

• Skilled-Australian Linked - commenced on 1 July 1997 (replacing the Concessional Family

Category). Applicants must pass a points test on skills, age and English ability and receive

additional points for sponsorship by relatives in Australia (4,586 visas in 2001-02). Also includes

Regional Linked for those sponsored by relatives in regional areas (not points tested).

• Employer sponsored - Employers may nominate (or ‘sponsor’) personnel from overseas through the

Employer Nomination Scheme (ENS), Regional Sponsored Migration Scheme (RSMS) and Labour

Agreements. These visas enable Australian employers to fill skilled permanent vacancies with

overseas personnel if they cannot find suitably qualified workers in Australia. A total of 1,817

visas were granted in 2001-02.

• Business skills migration - encourages successful business people to settle permanently in Australia

and develop new business opportunities (6,409 visas in 2001-02).

• Distinguished talent - for distinguished individuals with special or unique talents of benefit to

Australia (72 visas in 2001-02).

The 2001-02 migration program resulted in 93,0803 non-humanitarian immigrants settling in

Australia. This was the largest intake for a decade. It was also the most number of skilled immigrants ever

taken by Australia (Rizvi 2002, p. 20). The planning levels for each of the next four years are within the

range of 100,000 and 110,000 places (66,000 in the skill stream). The shift away from family to skilled

migration years in Australia is shown in Figure 7.

Figure 7: Australia: Migration Program Outcomes by Stream

Source: DIMIA Population Flows: Immigration Aspects, various issues and DIMIA 2002c

3 Note: this excludes New Zealanders and Humanitarian arrivals.

19 HUGO, Graeme

19

It will be noted in Table 9 that people born in the United Kingdom and Ireland are slightly

overrepresented among family, sponsored and independent settlers and heavily overrepresented among

employee nominated migrants and special eligibility migrants. They are underrepresented among business

migrants and refugees. Other Europeans are slightly overrepresented among family, employee nominated

and special eligibility settlers. They are strongly overrepresented among refugees and underrepresented

among sponsored, business and independent migrants. Overall, then, there is a small underrepresentation of

Europeans in the Skilled Migration settlement categories.

Table 9: Settler Arrivals Born in Europe Compared With Total Intake According to Eligibility

Category, 2001-02

Source: DIMIA, 2002a, 7

Eligibility Category UK and

Ireland

Other

Europe Total

Percent of

Total from

Percent of

Total from

0

10000

20000

30000

40000

50000

60000

70000

1989

-90

1990

-91

1991

-92

1992

-93

1993

-94

1994

-95

1995

-96

1996

-97

1997

-98

1998

-99

1999

-00

2000

-01

2001

-02

2002

-03

(pla

nned

)

Year

Num

ber

Family Skill Special Eligibility

20 HUGO, Graeme

20

Number Number Number

UK and

Ireland

Other

Europe

Family 2,744 3,045 23,344 11.8 13.0

Skill

Sponsored 760 331 5,960 12.8 5.6

ENS 451 270 1,817 24.8 14.9

Business 274 137 6,409 4.3 2.1

Independent 3,580 1,418 21,850 16.4 6.5

Special Eligibility 119 31 176 67.6 17.6

Humanitarian Program - 2,412 6,732 0.0 35.8

Non-Program Migration

NZ Citizen 972 347 21,458 4.5 1.6

Other 353 167 1,154 30.6 14.5

Total 9,253 8,158 88,900 10.4 9.2

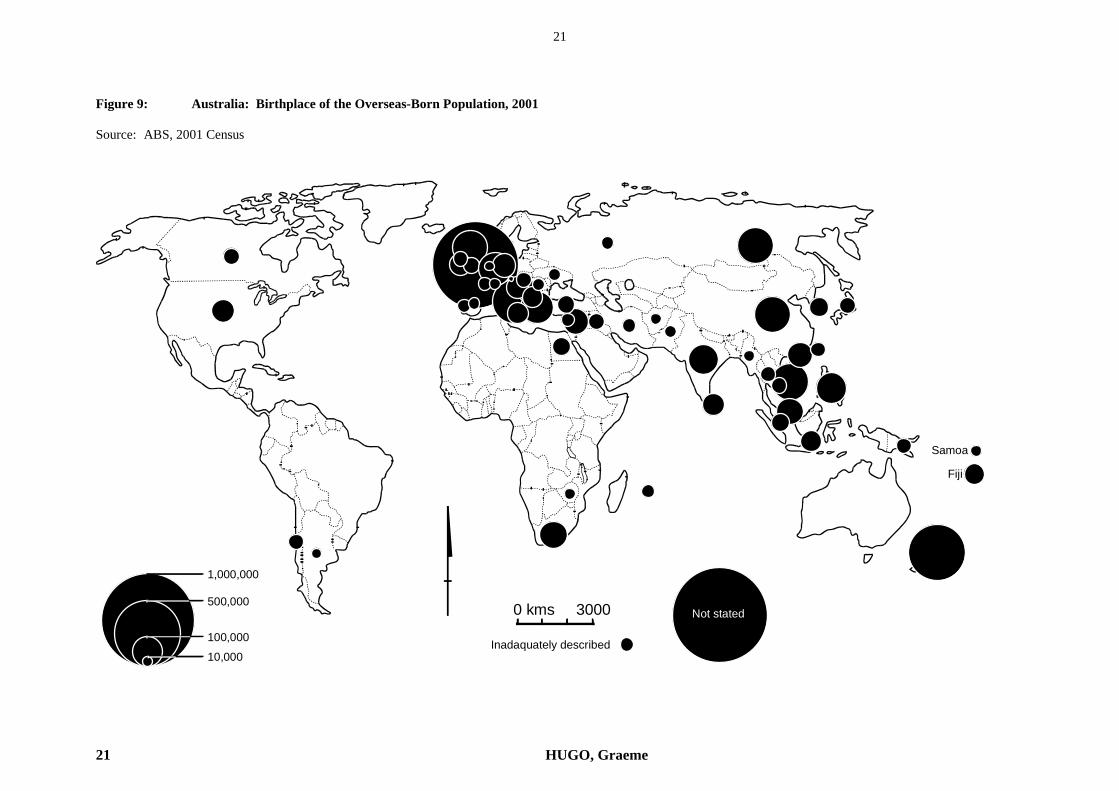
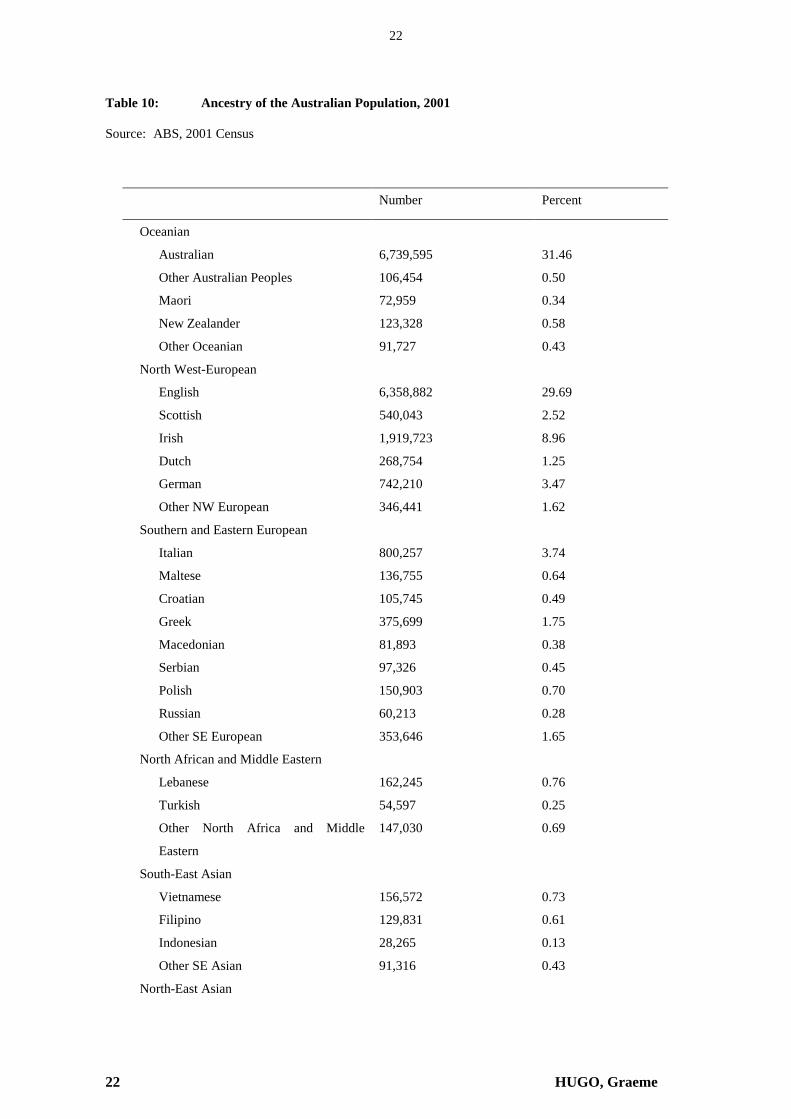
In considering this section on European settler migration to Australia it is important to stress that

while in recent times non-European inmovement has increased, Figure 9 indicates that Europe and especially

the United Kingdom are still dominant in the foreign-born population. This is also reflected in the

dominance of European ancestry among the Australian population. The 2001 Census included, for the first

time in 15 years, an ancestry question and Table 10 indicates the dominance of Europeans.

21 HUGO, Graeme

21

Figure 9: Australia: Birthplace of the Overseas-Born Population, 2001

Source: ABS, 2001 Census

0 kms 3000

Fiji

Samoa

Inadaquately described

Not stated

1,000,000

500,000

100,00010,000

22 HUGO, Graeme

22

Table 10: Ancestry of the Australian Population, 2001

Source: ABS, 2001 Census

Number Percent

Oceanian

Australian 6,739,595 31.46

Other Australian Peoples 106,454 0.50

Maori 72,959 0.34

New Zealander 123,328 0.58

Other Oceanian 91,727 0.43

North West-European

English 6,358,882 29.69

Scottish 540,043 2.52

Irish 1,919,723 8.96

Dutch 268,754 1.25

German 742,210 3.47

Other NW European 346,441 1.62

Southern and Eastern European

Italian 800,257 3.74

Maltese 136,755 0.64

Croatian 105,745 0.49

Greek 375,699 1.75

Macedonian 81,893 0.38

Serbian 97,326 0.45

Polish 150,903 0.70

Russian 60,213 0.28

Other SE European 353,646 1.65

North African and Middle Eastern

Lebanese 162,245 0.76

Turkish 54,597 0.25

Other North Africa and Middle

Eastern

147,030 0.69

South-East Asian

Vietnamese 156,572 0.73

Filipino 129,831 0.61

Indonesian 28,265 0.13

Other SE Asian 91,316 0.43

North-East Asian

23 HUGO, Graeme

23

Chinese 556,553 2.60

Other NE Asian 80,676 0.38

Southern and Central Asian

Indian 156,624 0.73

Other Southern and Central Asian 139,223 0.65

Peoples of the Americas 140,121 0.65

Sub-Saharan Africa 103,750 0.48

Total 21,419,356 100.00

Note: Table excludes inadequately described, not stated and not applicable.

24 HUGO, Graeme

24

TRENDS IN NON-PERMANENT MOVEMENT

There has been a tendency in Australia for all international migration attention to be focused on

movement associated with permanent settlement in Australia. However, non-permanent movements have

long been important in Australia (Price, 1979). Moreover, they have become of much greater significance in

recent years. Table 11 shows that both long-term and short-term movement into and out of Australia have

increased much faster than permanent migration over the last two decades.

Table 11: Growth of Population Movement Into and Out of Australia, 1982-83 to 2001-02

Source: Bureau of Immigration and Population Research, 1993; DIMIA, 2002a

1982-83 2001-02

Percent Growth

1982-2002

Arrivals

Permanent 83,010 88,900 +7.1

Long-term 79,730 264,471 +231.7

Short-term 2,171,200 8,113,300 +273.7

Departures

Permanent 24,830 48,241 +94.3

Long-term 72,460 171,446 +136.6

Short-term 2,166,600 8,205,700 +278.7

Notes:

• Permanent movement - persons migrating to Australia and residents departing permanently.

• Long-term movement - visitors arriving and residents departing temporarily with the

intention to stay in Australia or abroad for twelve months or more, and the departure of

visitors and the return of residents who had stayed in Australia or abroad for twelve months

or more.

• Short-term movement - travellers whose intended or actual stay in Australia or abroad is

less than twelve months.

Firstly, regarding short-term movement, there has been a rapid acceleration of both foreigners

visiting Australia and Australians going overseas on a short-term basis. The number of visitor visas granted

in 2001-02 was 3,368,170, representing a 6.4 percent fall over the previous year due to the effects of

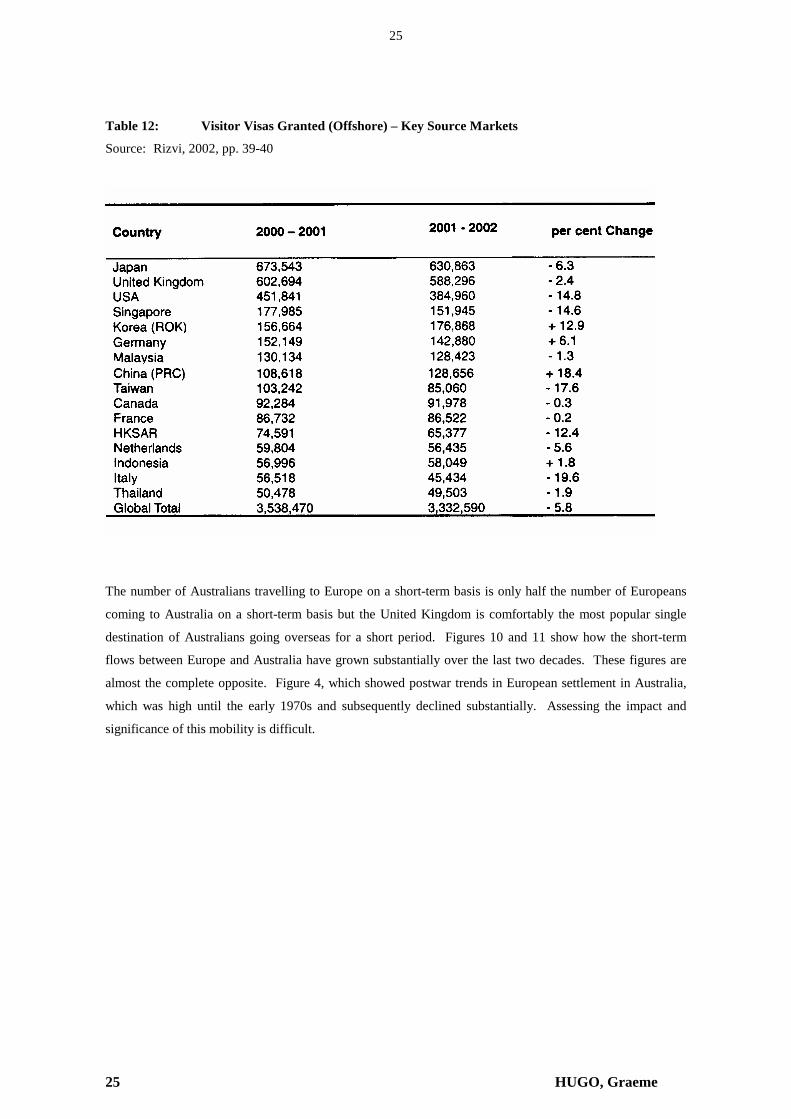
11th September 2001 but also the fact that the previous year contained the Sydney Olympics. Table 12

shows the changes that have occurred in visitor numbers in the last year. It will be noted that five European

countries are among thew 16 largest senders of visitors to Australia. While Japan is the main origin of short-

term visitors to Australia, it is closely followed by the United Kingdom.

25 HUGO, Graeme

25

Table 12: Visitor Visas Granted (Offshore) – Key Source Markets

Source: Rizvi, 2002, pp. 39-40

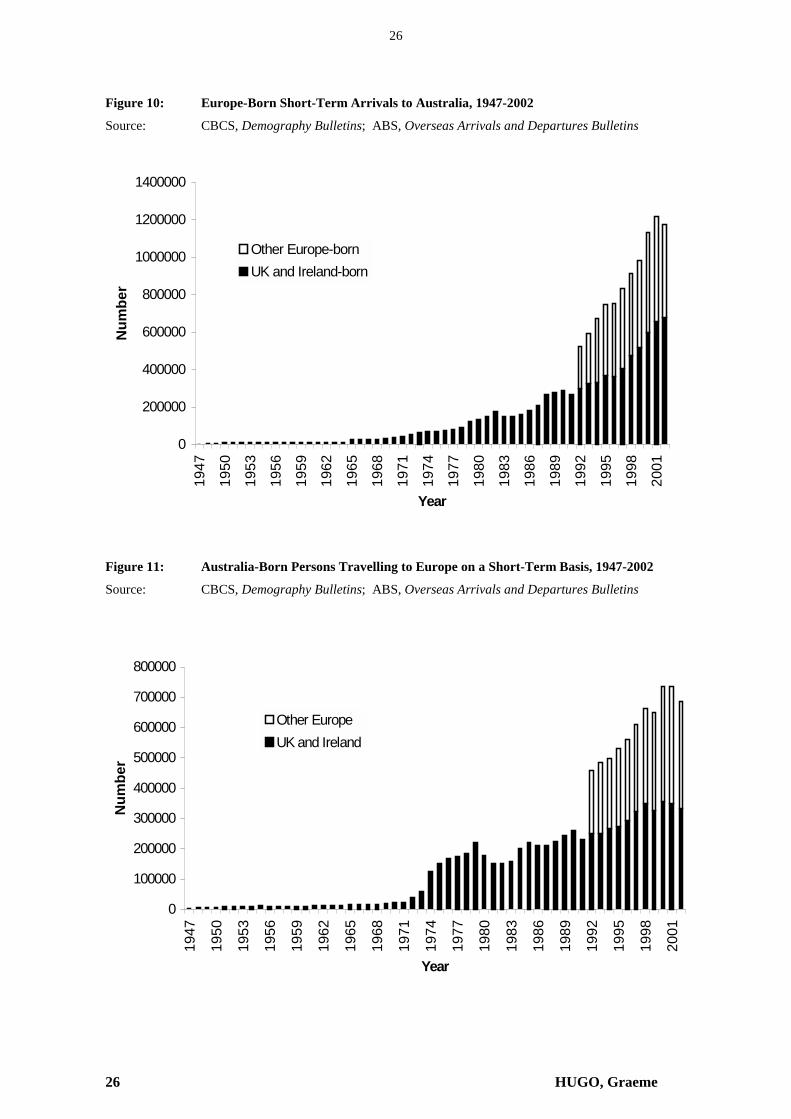
The number of Australians travelling to Europe on a short-term basis is only half the number of Europeans

coming to Australia on a short-term basis but the United Kingdom is comfortably the most popular single

destination of Australians going overseas for a short period. Figures 10 and 11 show how the short-term

flows between Europe and Australia have grown substantially over the last two decades. These figures are

almost the complete opposite. Figure 4, which showed postwar trends in European settlement in Australia,

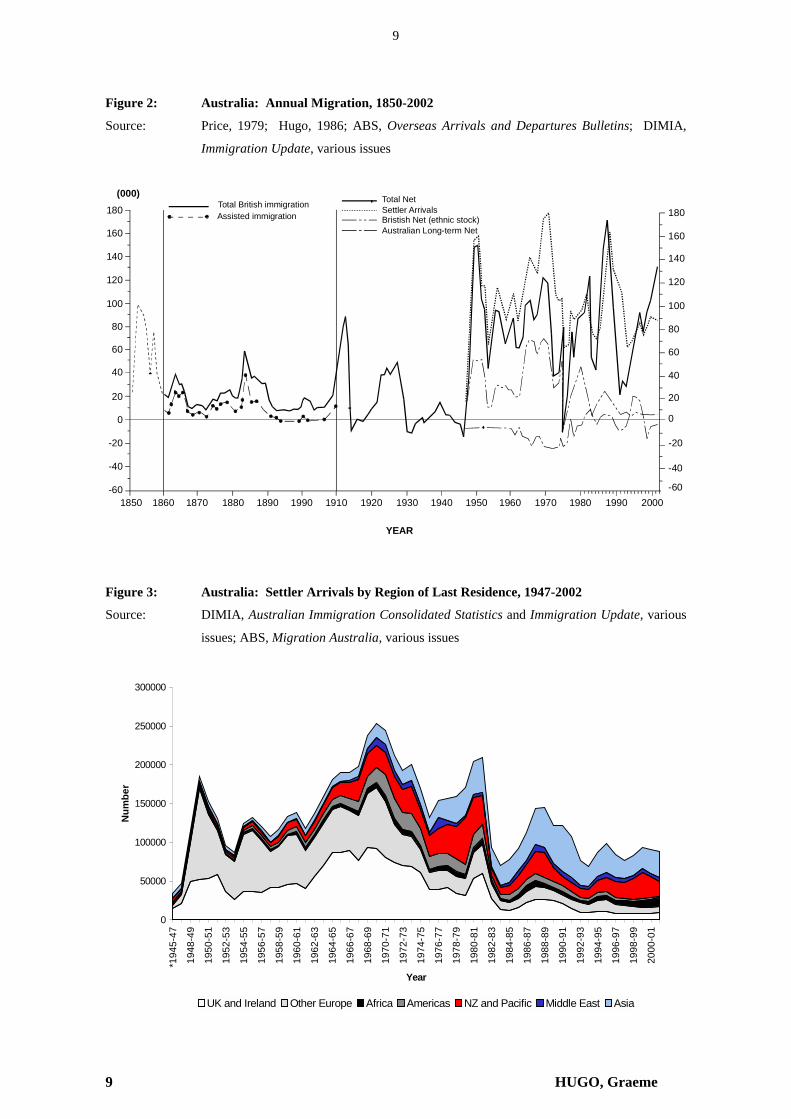
which was high until the early 1970s and subsequently declined substantially. Assessing the impact and

significance of this mobility is difficult.

26 HUGO, Graeme

26

Figure 10: Europe-Born Short-Term Arrivals to Australia, 1947-2002

Source: CBCS, Demography Bulletins; ABS, Overseas Arrivals and Departures Bulletins

Figure 11: Australia-Born Persons Travelling to Europe on a Short-Term Basis, 1947-2002

Source: CBCS, Demography Bulletins; ABS, Overseas Arrivals and Departures Bulletins

0

200000

400000

600000

800000

1000000

1200000

140000019

47

1950

1953

1956

1959

1962

1965

1968

1971

1974

1977

1980

1983

1986

1989

1992

1995

1998

2001

Year

Num

ber

Other Europe-bornUK and Ireland-born

0

100000

200000

300000

400000

500000

600000

700000

800000

1947

1950

1953

1956

1959

1962

1965

1968

1971

1974

1977

1980

1983

1986

1989

1992

1995

1998

2001

Year

Num

ber

Other EuropeUK and Ireland

27 HUGO, Graeme

27

It is interesting to note in Figure 12, however, that business and family based visits of Europeans to Australia

are similar in size to those of Australians going to Europe but it is in tourism that the incomers are twice as

numerous as the Australians going to Europe. There are, of course, differences in the mix of reasons for

visiting in the various nations in Europe. While the United Kingdom and Ireland account for around half of

both short-term visitors and permanent settlers from Europe, the other main origins of short-term visitors are

Germany, France, Italy, Switzerland and the Netherlands compared with Yugoslavia, Germany, former

USSR and Baltic States and Croatia.

While the amount of visitor movement between Europe and Australia has increased substantially

over the last two decades it has declined as a proportion of all short-term movement to and from Australia as

Figure 13 indicates. The proportions have fallen from over a quarter to less than a fifth of all such

movement. While Europeans visiting has increased, that from Asia has increased faster.

Australia has long had an emphasis on attracting permanent settlers to the country and a strongly

expressed opposition to programs of inmovement of temporary and contract workers. During the labour

shortage years of the 1950s and 1960s Australia’s migration solution to the problem contrasted sharply with

that of European nations like Germany and France when it explicitly opted to concentrate on attracting

permanent migrants to meet worker shortages rather than contract workers. This thinking has changed

dramatically since the mid 1990s with the introduction of new visa types involving temporary migration for

work (Birrell and Healy, 1997). These often cut across the long-term and short-term categories. Hence

there has been a shift in worker migration to Australia which has seen an increase in non-permanent moves.

There has been a recognition that in the context of globalised labour markets it is essential to have

mechanisms to allow non-permanent entry of workers at least in certain groups. Nevertheless, this form of

entry has not been extended to unskilled and low-skilled areas and has been open to people with particular

skills and entrepreneurs. Hence there has been an increase in people coming to Australia as short-term or

long-term entrants and being able to work in the country.

28 HUGO, Graeme

28

Figure 12: Reasons for Short-Term Visits to Australia by Europeans and to Europe by

Australians

Source: ABS, 1997

Figure 13: Proportion of Short-term Overseas Visits to and from Australia, 1986 to 2001

Source: ABS, 1997 and ABS, Overseas Arrivals and Departures, various issues

0

5

10

15

20

25

30

1986

1987

1988

1989

1990

1991

1992

1993

1994

1995

1996

1997

1998

1999

2000

2001

Year

Per c

ent

Australians visiting EuropeEuropeans visiting Australia

29 HUGO, Graeme

29

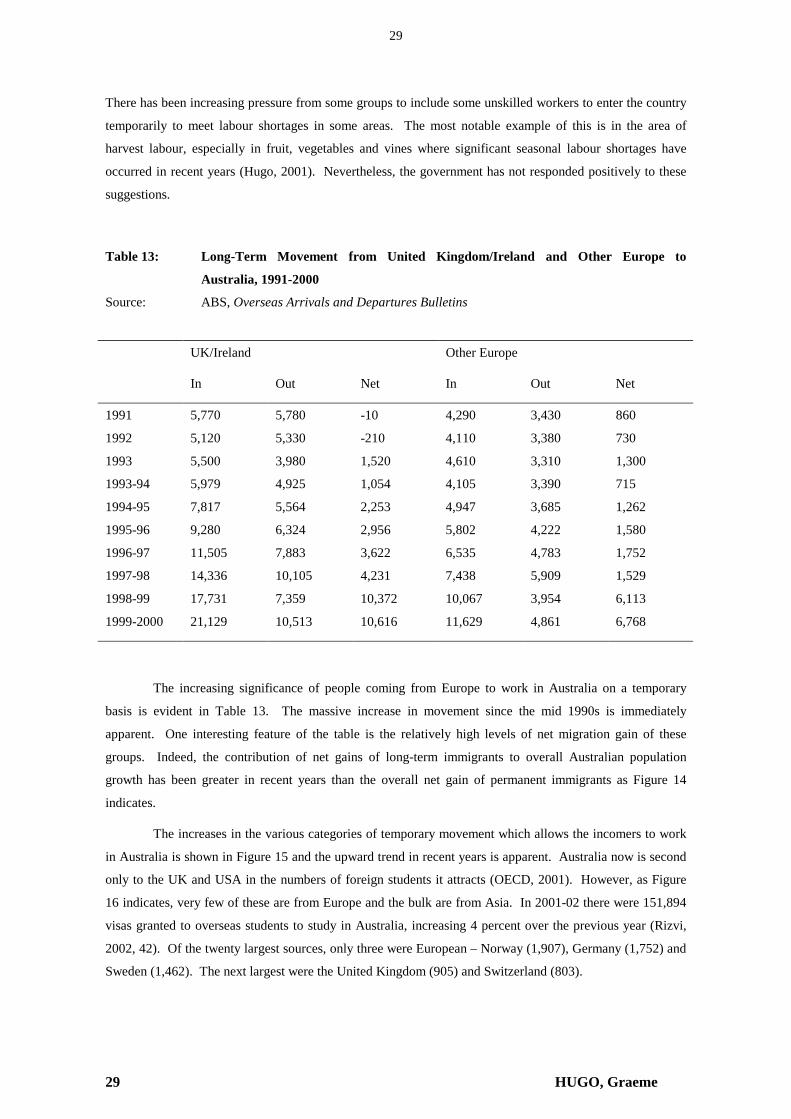
There has been increasing pressure from some groups to include some unskilled workers to enter the country

temporarily to meet labour shortages in some areas. The most notable example of this is in the area of

harvest labour, especially in fruit, vegetables and vines where significant seasonal labour shortages have

occurred in recent years (Hugo, 2001). Nevertheless, the government has not responded positively to these

suggestions.

Table 13: Long-Term Movement from United Kingdom/Ireland and Other Europe to

Australia, 1991-2000

Source: ABS, Overseas Arrivals and Departures Bulletins

UK/Ireland Other Europe

In Out Net In Out Net

1991 5,770 5,780 -10 4,290 3,430 860

1992 5,120 5,330 -210 4,110 3,380 730

1993 5,500 3,980 1,520 4,610 3,310 1,300

1993-94 5,979 4,925 1,054 4,105 3,390 715

1994-95 7,817 5,564 2,253 4,947 3,685 1,262

1995-96 9,280 6,324 2,956 5,802 4,222 1,580

1996-97 11,505 7,883 3,622 6,535 4,783 1,752

1997-98 14,336 10,105 4,231 7,438 5,909 1,529

1998-99 17,731 7,359 10,372 10,067 3,954 6,113

1999-2000 21,129 10,513 10,616 11,629 4,861 6,768

The increasing significance of people coming from Europe to work in Australia on a temporary

basis is evident in Table 13. The massive increase in movement since the mid 1990s is immediately

apparent. One interesting feature of the table is the relatively high levels of net migration gain of these

groups. Indeed, the contribution of net gains of long-term immigrants to overall Australian population

growth has been greater in recent years than the overall net gain of permanent immigrants as Figure 14

indicates.

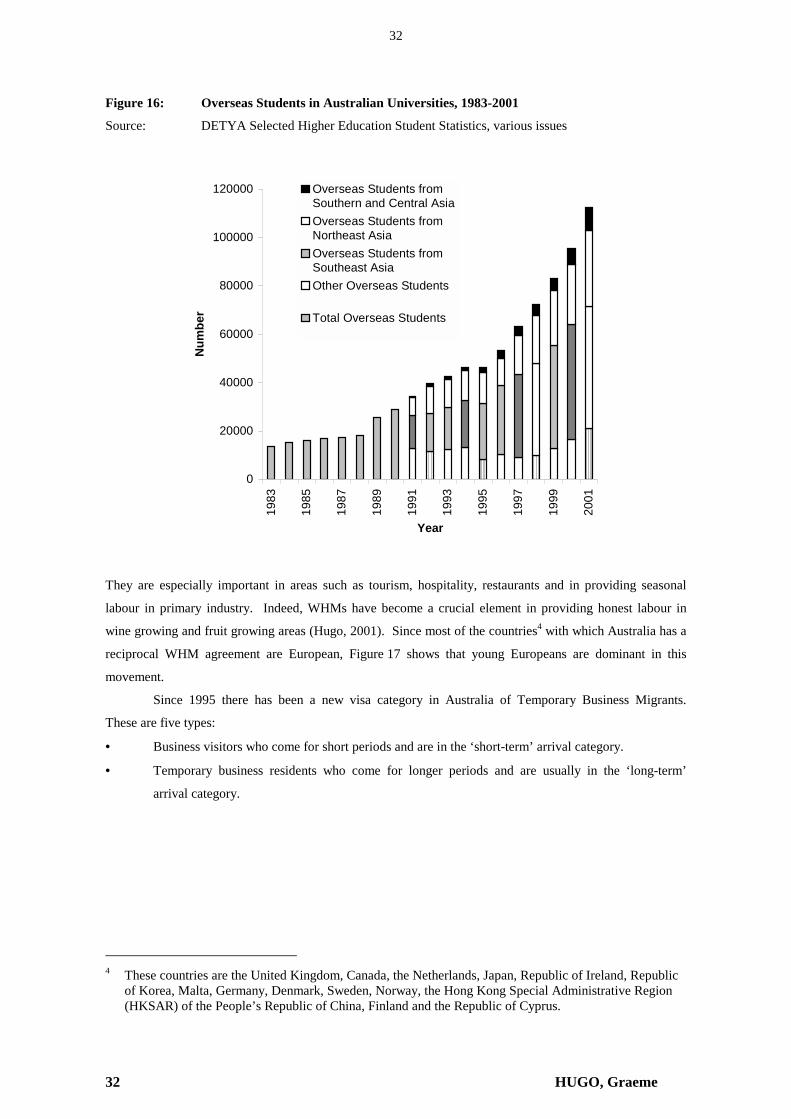
The increases in the various categories of temporary movement which allows the incomers to work

in Australia is shown in Figure 15 and the upward trend in recent years is apparent. Australia now is second

only to the UK and USA in the numbers of foreign students it attracts (OECD, 2001). However, as Figure

16 indicates, very few of these are from Europe and the bulk are from Asia. In 2001-02 there were 151,894

visas granted to overseas students to study in Australia, increasing 4 percent over the previous year (Rizvi,

2002, 42). Of the twenty largest sources, only three were European – Norway (1,907), Germany (1,752) and

Sweden (1,462). The next largest were the United Kingdom (905) and Switzerland (803).

30 HUGO, Graeme

30

Figure 14: Australia: Net Permanent and Long-Term Movement as a Percentage of Total Net

Migration Gain, 1983-2002

Source: DIMIA, Immigration Update, various issues

The second category of visa in which temporary entrants to Australia can work are Working

Holiday Makers (WHMs). WHMs are foreign nationals aged 18-30 from selected countries with which

Australia has a reciprocal arrangement, who can work under certain conditions for up to 12 months

(Australian Parliamentary Joint Study Committee on Migration, 1997). Their numbers have increased

dramatically and reached 85,200 in 2001-02 more than doubling in the 1990s. Kinnaird (1999) reports that

while the economic impact nationally of WHM migration is limited it has significant impacts in specific

industries in specific areas.

0

20

40

60

80

100

120

1983

1984

1985

1986

1987

1988

1989

1990

1991

1992

1993

1994

1995

1996

1997

1998

1999

2000

2001

2002

Year

Per c

ent

Permanent Movement (%net) Long-term Movement (%net)

31

HU

GO

, Graem

e

31

Figure 15: Tem

porary Migration to A

ustralia by Category, 1986-2002

Source: D

IMIA

Population Flows: Imm

igration Aspects, various issues; DIM

IA 2002d

Total

050000

100000150000200000250000300000350000400000450000500000

1986-87

1987-88

1988-89

1989-90

1990-91

1991-92

1992-93

1993-94

1994-95

1995-96

1996-97

1997-98

1998-99

1999-2000

2000-01

Year

Number of Visas Granted/Issued

Overseas Students

0100002000030000400005000060000700008000090000

100000

1986-87

1987-88

1988-89

1989-90

1990-91

1991-92

1992-93

1993-94

1994-95

1995-96

1996-97

1997-98

1998-99

1999-2000

2000-01

Year

Number

Working Holiday M

akers

0100002000030000400005000060000700008000090000

1986-87

1987-88

1988-89

1989-90

1990-91

1991-92

1992-93

1993-94

1994-95

1995-96

1996-97

1997-98

1998-99

1999-2000

2000-01

2001-02Year

Number of Working Holiday Visas Granted (Off-shore)

Temporary Business Entrants

0

50000

100000

150000

200000

250000

300000

350000

1986-87

1987-88

1988-89

1989-90

1990-91

1991-92

1992-93

1993-94

1994-95

1995-96

1996-97

1997-98

1998-99

1999-2000

2000-01

Year

Number of Temporary Business Entry Visas Issued

32 HUGO, Graeme

32

Figure 16: Overseas Students in Australian Universities, 1983-2001

Source: DETYA Selected Higher Education Student Statistics, various issues

They are especially important in areas such as tourism, hospitality, restaurants and in providing seasonal

labour in primary industry. Indeed, WHMs have become a crucial element in providing honest labour in

wine growing and fruit growing areas (Hugo, 2001). Since most of the countries4 with which Australia has a

reciprocal WHM agreement are European, Figure 17 shows that young Europeans are dominant in this

movement.

Since 1995 there has been a new visa category in Australia of Temporary Business Migrants.

These are five types:

• Business visitors who come for short periods and are in the ‘short-term’ arrival category.

• Temporary business residents who come for longer periods and are usually in the ‘long-term’

arrival category.

4 These countries are the United Kingdom, Canada, the Netherlands, Japan, Republic of Ireland, Republic

of Korea, Malta, Germany, Denmark, Sweden, Norway, the Hong Kong Special Administrative Region (HKSAR) of the People’s Republic of China, Finland and the Republic of Cyprus.

0

20000

40000

60000

80000

100000

120000

1983

1985

1987

1989

1991

1993

1995

1997

1999

2001

Year

Num

ber

Overseas Students fromSouthern and Central AsiaOverseas Students fromNortheast AsiaOverseas Students fromSoutheast AsiaOther Overseas Students

Total Overseas Students

33 HUGO, Graeme

33

Figure 17: Australia: Working Holiday Makers Arrivals, 2000

Source: Drawn from data in DIMIA, 2001

• Independent executives who enter Australia for the purpose of establishing, or buying into a

business and managing that business.

• Medical practitioners – qualified general and specialist medical practitioners where there is a

demonstrated need for employing practitioners from overseas.

• Educational – this visa is for qualified people to join educational and research organisations to fill

academic teaching and research positions that cannot be filled from within the Australian labour

market.

Figure 15 indicates there has been a fall in this category since a peak in 1996-97 and in 2000-01 a total of

260,957 Business Visitors visas were granted and 40,493 Temporary Business Residence visas, 3,411

Independent Executive visas, 3,438 Medical Practitioner visas and 1,738 Educational visas. In 2000-01 the

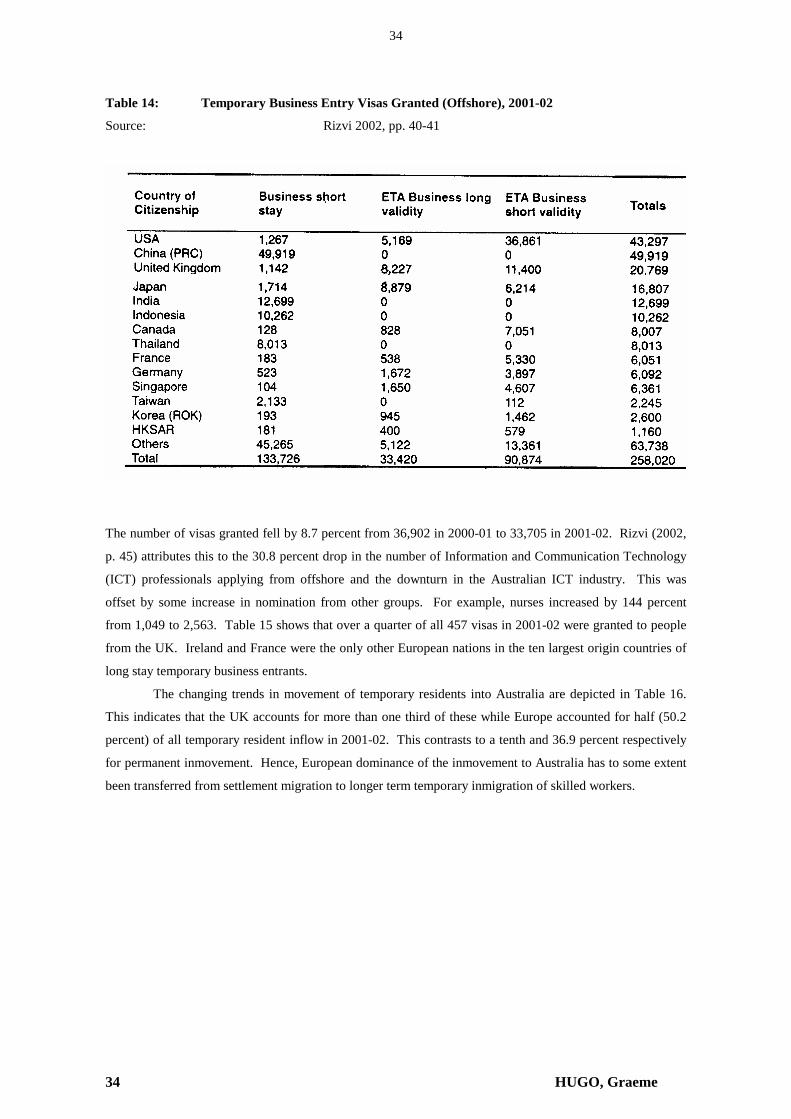
total inflow was 310,037. In 2001-02 there were 258,020 Business Visitor Visas granted – 0.9 percent lower

than in 2000-01. The main countries of origin of business visitors are depicted in Table 14 and while the

overall pattern is dominated by people from Asia, it is apparent that Europeans are much more significant

among the longer term business entrants. The Temporary Business Entry (Long Stay) sub-class 457 visa

enables highly qualified/skilled persons to enter Australia for up to 4 years to take up pre-nominated

positions with approved Australian sponsor-employers, mostly in professional or management positions

(Rizvi, 2002, p. 45).

34 HUGO, Graeme

34

Table 14: Temporary Business Entry Visas Granted (Offshore), 2001-02

Source: Rizvi 2002, pp. 40-41

The number of visas granted fell by 8.7 percent from 36,902 in 2000-01 to 33,705 in 2001-02. Rizvi (2002,

p. 45) attributes this to the 30.8 percent drop in the number of Information and Communication Technology

(ICT) professionals applying from offshore and the downturn in the Australian ICT industry. This was

offset by some increase in nomination from other groups. For example, nurses increased by 144 percent

from 1,049 to 2,563. Table 15 shows that over a quarter of all 457 visas in 2001-02 were granted to people

from the UK. Ireland and France were the only other European nations in the ten largest origin countries of

long stay temporary business entrants.

The changing trends in movement of temporary residents into Australia are depicted in Table 16.

This indicates that the UK accounts for more than one third of these while Europe accounted for half (50.2

percent) of all temporary resident inflow in 2001-02. This contrasts to a tenth and 36.9 percent respectively

for permanent inmovement. Hence, European dominance of the inmovement to Australia has to some extent

been transferred from settlement migration to longer term temporary inmigration of skilled workers.

35 HUGO, Graeme

35

Table 15: Temporary Business Entry (Long Stay) Visa Grants 2000-01 and 2001-02

Source: Rizvi, 2002, p. 46

Table 16: Australia: Inflows of Temporary Residents by Region/Country of Citizenship,

Financial Years 1990-91 to 2001-02 (Thousands)

Source: Rizvi, 2002, p. 94

36 HUGO, Graeme

36

37 HUGO, Graeme

37

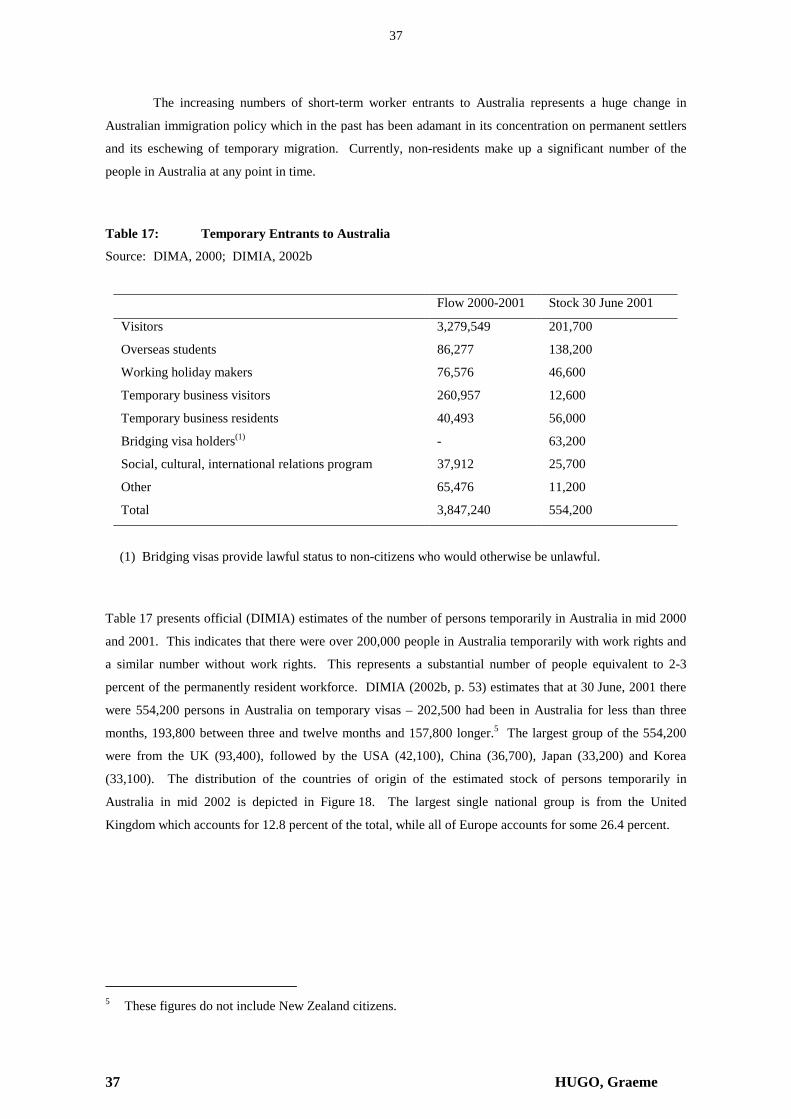
The increasing numbers of short-term worker entrants to Australia represents a huge change in

Australian immigration policy which in the past has been adamant in its concentration on permanent settlers

and its eschewing of temporary migration. Currently, non-residents make up a significant number of the

people in Australia at any point in time.

Table 17: Temporary Entrants to Australia

Source: DIMA, 2000; DIMIA, 2002b

Flow 2000-2001 Stock 30 June 2001

Visitors 3,279,549 201,700

Overseas students 86,277 138,200

Working holiday makers 76,576 46,600

Temporary business visitors 260,957 12,600

Temporary business residents 40,493 56,000

Bridging visa holders(1) - 63,200

Social, cultural, international relations program 37,912 25,700

Other 65,476 11,200

Total 3,847,240 554,200

(1) Bridging visas provide lawful status to non-citizens who would otherwise be unlawful.

Table 17 presents official (DIMIA) estimates of the number of persons temporarily in Australia in mid 2000

and 2001. This indicates that there were over 200,000 people in Australia temporarily with work rights and

a similar number without work rights. This represents a substantial number of people equivalent to 2-3

percent of the permanently resident workforce. DIMIA (2002b, p. 53) estimates that at 30 June, 2001 there

were 554,200 persons in Australia on temporary visas – 202,500 had been in Australia for less than three

months, 193,800 between three and twelve months and 157,800 longer.5 The largest group of the 554,200

were from the UK (93,400), followed by the USA (42,100), China (36,700), Japan (33,200) and Korea

(33,100). The distribution of the countries of origin of the estimated stock of persons temporarily in

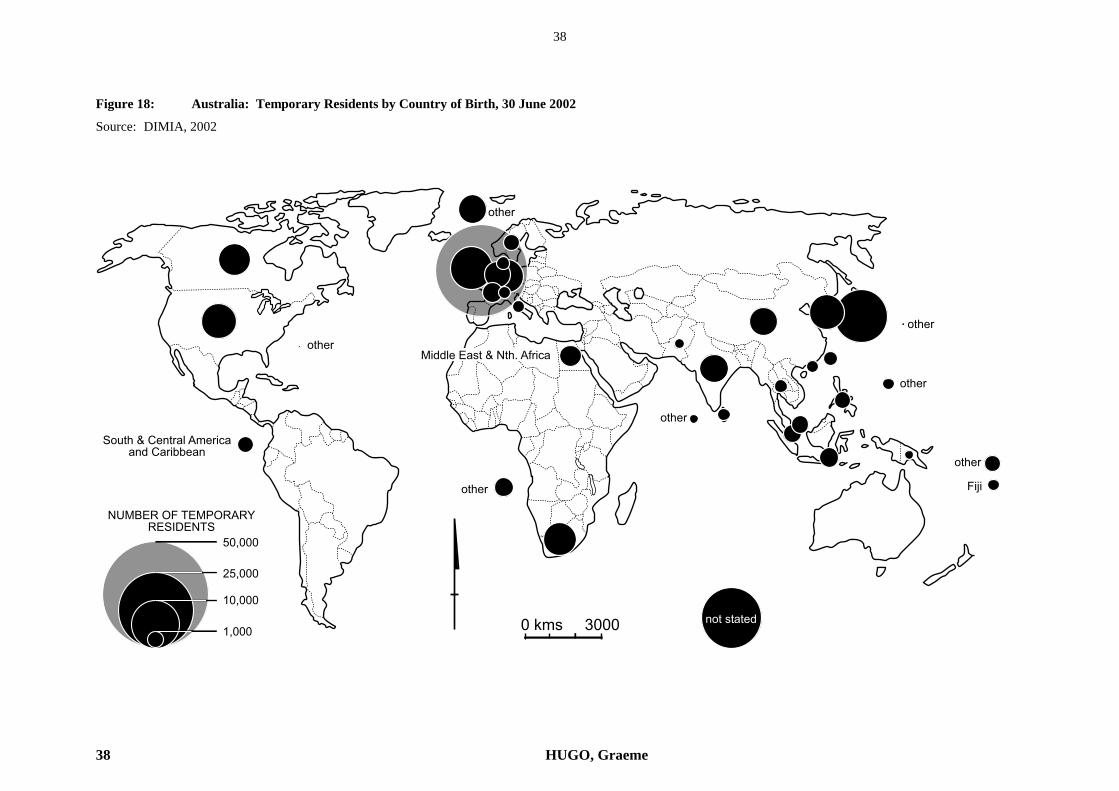
Australia in mid 2002 is depicted in Figure 18. The largest single national group is from the United

Kingdom which accounts for 12.8 percent of the total, while all of Europe accounts for some 26.4 percent.

5 These figures do not include New Zealand citizens.

38 HUGO, Graeme

38

Figure 18: Australia: Temporary Residents by Country of Birth, 30 June 2002

Source: DIMIA, 2002

��������������

���

�� �

�� �

�� �

�� �

�� �

�� ������ �������������������

�������� �������� �������������� ��

�� �

������� �� ���

�� ���

!" ���

"� ���

�#�$�%�&��'��(&%�%)%��*+��'�

39 HUGO, Graeme

39

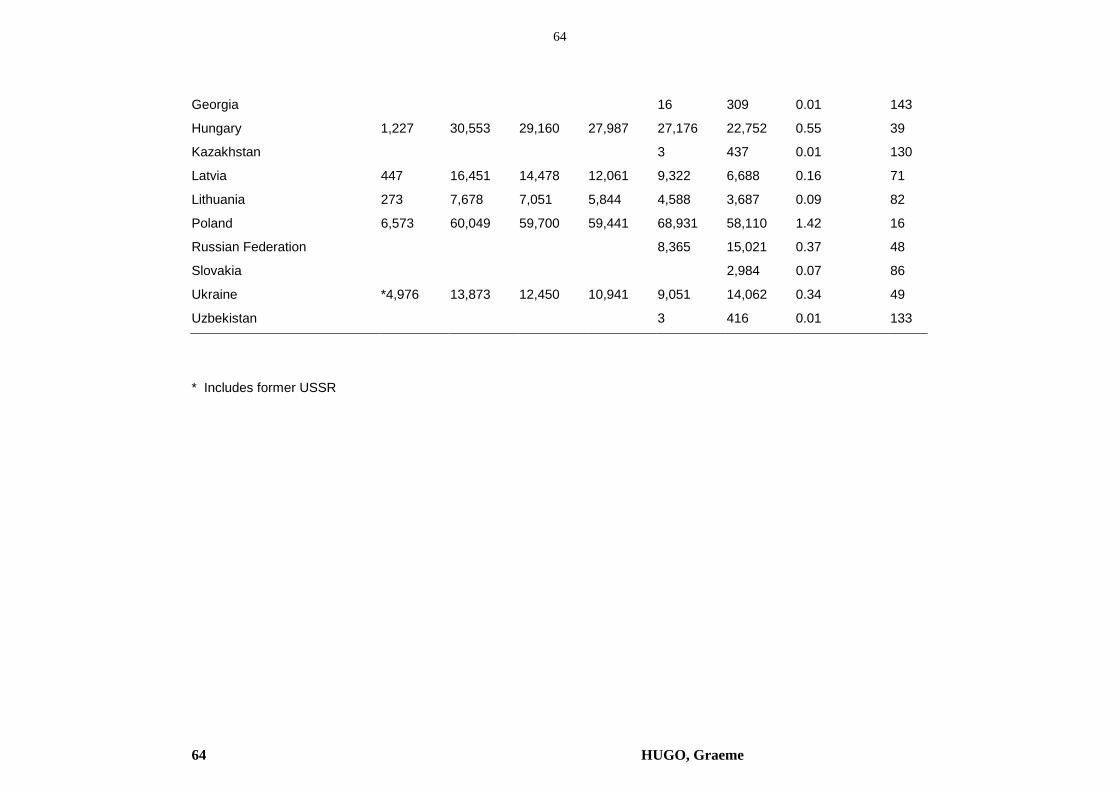
While the UK is the dominant origin of both permanent settlers and temporary residents from Europe,

the other major countries vary between the two categories. Hence Table 18 shows that former USSR

and Yugoslavia nations are important among settlers. Western and northern European countries are

dominant among visitors and temporary visitors.

Table 18: Ten Largest European Origins of Settlers, Temporary Residents and Visitors

Coming to Australia, 2001-02

Source: DIMIA, 2002a

Settlers Temporary Resident Entry Visitors

United Kingdom United Kingdom United Kingdom

FR of Yugoslavia Germany Germany

Former USSR and Baltic States Ireland France

Germany Netherlands Netherlands

Croatia France Italy

Ireland Sweden Switzerland

Netherlands Denmark Ireland

Bosnia Herzegovina Italy Sweden

Former Yugoslavia Norway Austria

Romania Switzerland Denmark

It is interesting that while Europeans now make up less than a third of settlers coming to

Australia, they still make up more than a half of the total overseas-born population counted in Australia

at the 2001-02 Census. The comparative overrepresentation in the newly dominant non-permanent

flows to Australia, however, results in Europeans accounting for more than a half of the stock of such

people in Australia in mid 2002. Hence Table 19 shows that the overall representation of Europeans

among the permanently resident and the temporarily resident population in Australia is similar.

It is somewhat puzzling that while there has been a transformation of the Europe-Australian

migration regime in the last decade that the overwhelming bulk of our research knowledge is of the

declining element in that movement – relocation of Europeans to settle more or less permanently in

Australia. Our understanding of the cultural, economic, social and demographic effects and

significance of the burgeoning temporary movements remain very limited while we know a great deal

about postwar European settlement in Australia.

Table 19: Australia: Origins of the Australian Foreign-Born Total and Temporary

Resident Populations, 2001 and 2002

Source: ABS 2001 census and DIMIA

40 HUGO, Graeme

40

Total Overseas-Born,

2001

Temporary Resident

Overseas-Born, 2002

Total Percent* Total Percent*

Oceania 455,126 11.1 1,892 1.7

Europe and Former USSR 2,136,158 52.3 60,563 53.1

Middle East and North Africa 213,942 5.2 1,854 1.6

Southeast Asia 497,076 12.2 6,289 5.5

Northeast Asia 298,831 7.3 22,181 19.5

Southern Asia 184,130 4.5 4,577 4.0

India 95,452 2.3 3,356 2.9

Northern America 81,403 2.0 9,616 8.4

Southern America 75,691 1.9 984 0.9

Africa 141,696 3.5 6,044 5.3

Not stated 1,051,805** - 16,053 -

Total 5,135,858 100.0 130,053 100.0

* Excluding ‘Not stated’.

** Includes ‘Inadequately described’, ‘At sea’ and ‘Not elsewhere classified’.

This is partly a function of the demise of the Bureau of Immigration Research (Fincher, 2001) which

coincided with a paradigmatic shift in Australian immigration (Hugo, 1999). However, it also is that

most of our research remains rooted in a conceptualisation of immigration which was applicable to the

first four decades of the postwar period but which is now only one element in a much more complex

pattern of flows. There is a need for a more inclusive view of immigration to be taken.

41 HUGO, Graeme

41

Table 20: Onshore Residence Visa Grants as a Percentage of Total Migration Program

Visas Granted

Source: DIMIA, Population Flows: Immigration Aspects, various issues

1989-90 11.6

1990-91 10.3

1991-92 14.8

1992-93 21.2

1993-94 17.4

1994-95 25.3

1995-96 17.7

1996-97 22.4

1997-98 22.8

1998-99 22.2

1999-2000 24.7

2000-01 28.1

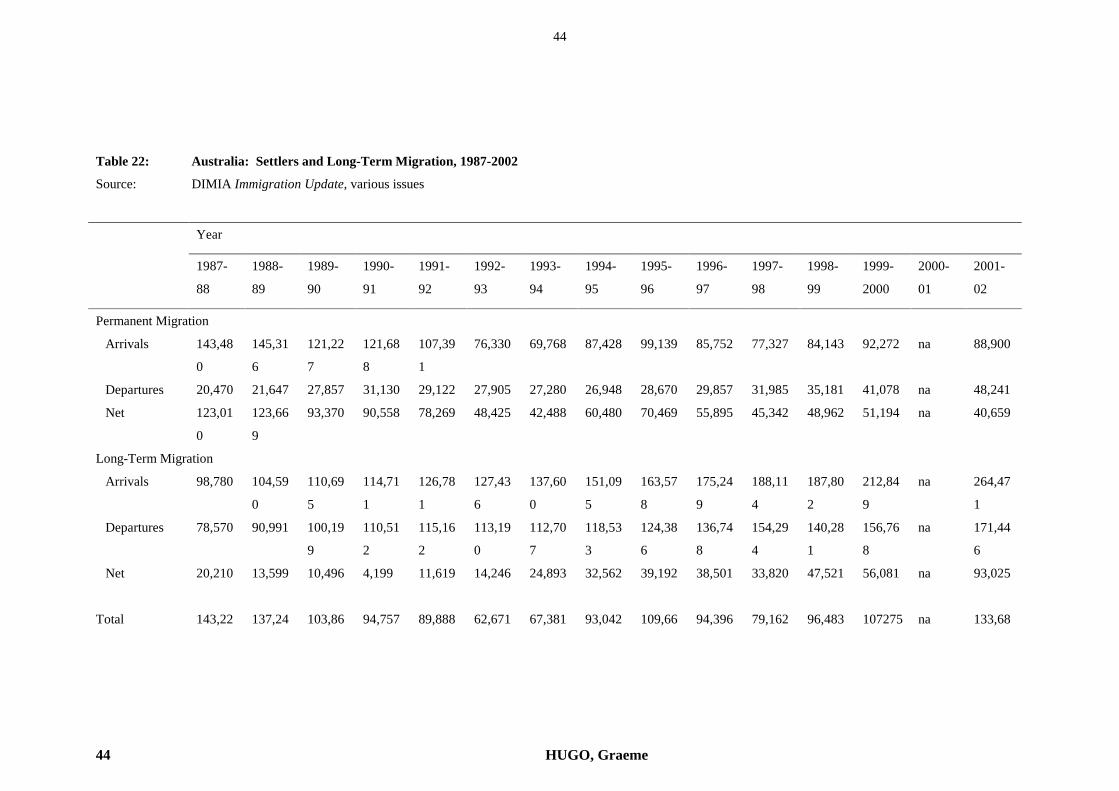
There are many elements of the new movement which need to be urgently examined. From a

demographic perspective, one crucial area relates to the extent the new temporary movement had to

permanent settlement. Certainly, Table 20 shows how there has been a substantial increase in the

proportion of ‘settlers’ obtaining an ‘onshore’ residence visa grant by virtue of the fact that they apply

for immigration while being resident in Australia on a temporary visa. It shall be noted that this does

not include the substantial numbers (1999-2002, 8,409 persons) of former asylum seekers who were

granted a Temporary Protection Visa. This raises a number of issues such as:

• To what extent is the long-term net gain a temporary phenomenon which will eventually

disappear? If all workers arriving under visa categories like temporary business, working

holiday, student etc. eventually leave Australia, one would expect the losses to eventually be

more or less equal to the gains.

• Clearly, there is some leakage across from long-term to permanent settlement. It has been

estimated (Ruddock, 2002) that in 2000-01 about 10 percent of skilled temporary entrants

changed to permanent residence. This suggests that there is significant ‘category jumping’

from long-term to permanent status and hence some double counting in the net gains of

permanent and long-term residents. The extent of category jumping has been estimated by the

ABS and is included in Table 21. It would appear that the category jumping has been quite

large (35,100) in 2002 suggesting that this is becoming a most important phenomenon.

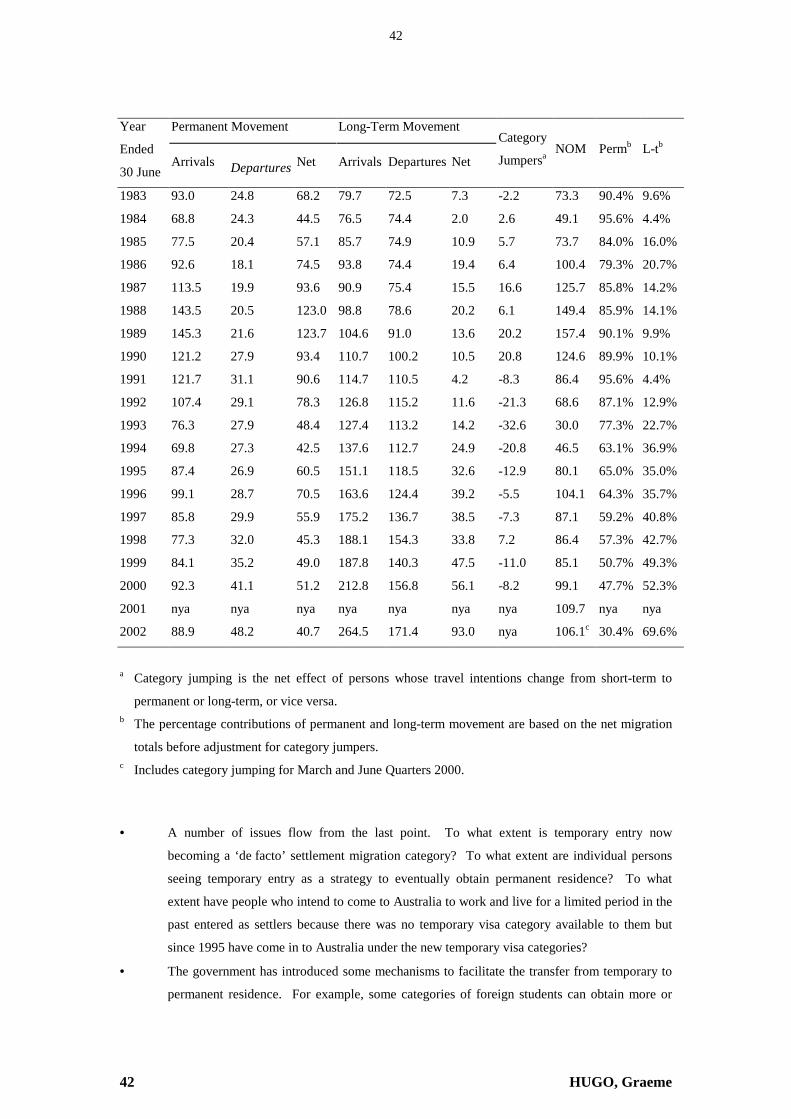
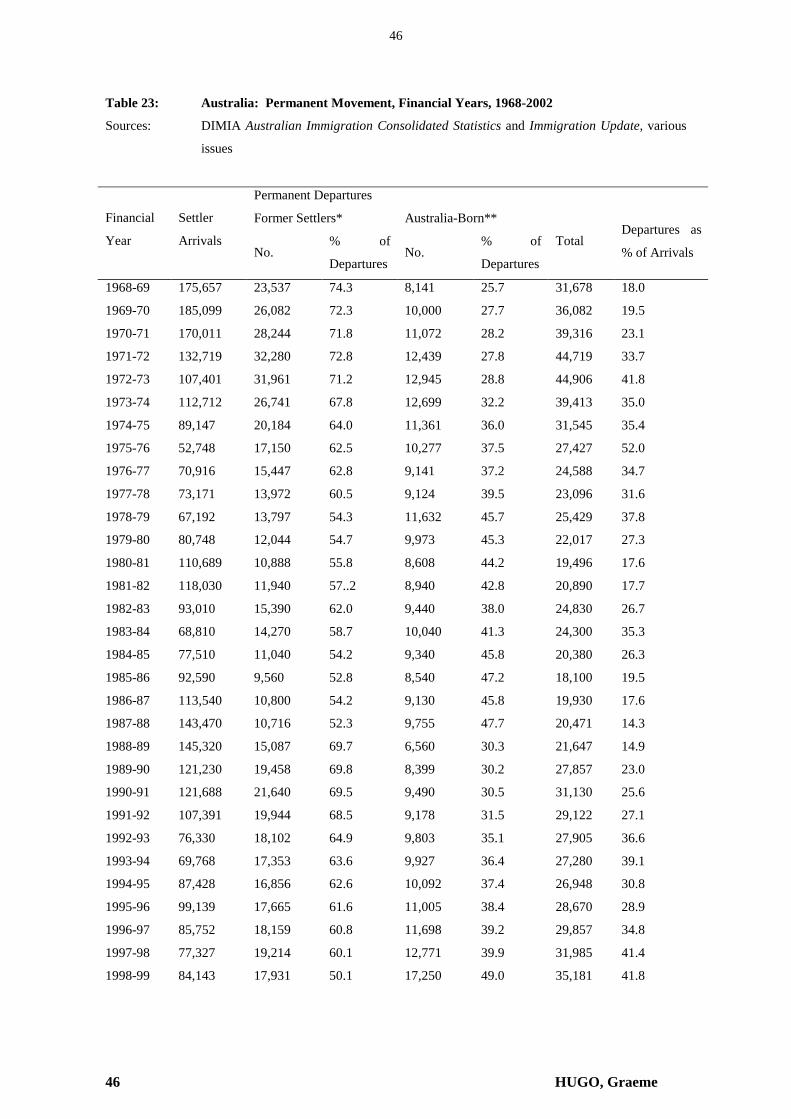
Table 21: Components of Net Overseas Migration (‘000), 1983-2002

Source: DIMA 2000, p. 106; ABS 2002, p. 29

42 HUGO, Graeme

42

Permanent Movement Long-Term Movement Year

Ended

30 June Arrivals Departures Net Arrivals Departures Net

Category

Jumpersa NOM Permb L-tb

1983 93.0 24.8 68.2 79.7 72.5 7.3 -2.2 73.3 90.4% 9.6%

1984 68.8 24.3 44.5 76.5 74.4 2.0 2.6 49.1 95.6% 4.4%

1985 77.5 20.4 57.1 85.7 74.9 10.9 5.7 73.7 84.0% 16.0%

1986 92.6 18.1 74.5 93.8 74.4 19.4 6.4 100.4 79.3% 20.7%

1987 113.5 19.9 93.6 90.9 75.4 15.5 16.6 125.7 85.8% 14.2%

1988 143.5 20.5 123.0 98.8 78.6 20.2 6.1 149.4 85.9% 14.1%

1989 145.3 21.6 123.7 104.6 91.0 13.6 20.2 157.4 90.1% 9.9%

1990 121.2 27.9 93.4 110.7 100.2 10.5 20.8 124.6 89.9% 10.1%

1991 121.7 31.1 90.6 114.7 110.5 4.2 -8.3 86.4 95.6% 4.4%

1992 107.4 29.1 78.3 126.8 115.2 11.6 -21.3 68.6 87.1% 12.9%

1993 76.3 27.9 48.4 127.4 113.2 14.2 -32.6 30.0 77.3% 22.7%

1994 69.8 27.3 42.5 137.6 112.7 24.9 -20.8 46.5 63.1% 36.9%

1995 87.4 26.9 60.5 151.1 118.5 32.6 -12.9 80.1 65.0% 35.0%

1996 99.1 28.7 70.5 163.6 124.4 39.2 -5.5 104.1 64.3% 35.7%

1997 85.8 29.9 55.9 175.2 136.7 38.5 -7.3 87.1 59.2% 40.8%

1998 77.3 32.0 45.3 188.1 154.3 33.8 7.2 86.4 57.3% 42.7%

1999 84.1 35.2 49.0 187.8 140.3 47.5 -11.0 85.1 50.7% 49.3%

2000 92.3 41.1 51.2 212.8 156.8 56.1 -8.2 99.1 47.7% 52.3%

2001 nya nya nya nya nya nya nya 109.7 nya nya

2002 88.9 48.2 40.7 264.5 171.4 93.0 nya 106.1c 30.4% 69.6%

a Category jumping is the net effect of persons whose travel intentions change from short-term to

permanent or long-term, or vice versa. b The percentage contributions of permanent and long-term movement are based on the net migration

totals before adjustment for category jumpers. c Includes category jumping for March and June Quarters 2000.

• A number of issues flow from the last point. To what extent is temporary entry now

becoming a ‘de facto’ settlement migration category? To what extent are individual persons

seeing temporary entry as a strategy to eventually obtain permanent residence? To what

extent have people who intend to come to Australia to work and live for a limited period in the

past entered as settlers because there was no temporary visa category available to them but

since 1995 have come in to Australia under the new temporary visa categories?

• The government has introduced some mechanisms to facilitate the transfer from temporary to

permanent residence. For example, some categories of foreign students can obtain more or

43 HUGO, Graeme

43

less automatic permanent residence if they have particular skills in high demand in the labour

market.

The interface between permanent and temporary work-related migration to Australia is an important

area of both policy and theoretical significance but little is currently known regarding it.

EMIGRATION

There is a tendency for Australia to be categorised as a purely immigration country but, in

fact, it is also a country of significant emigration. Table 22 shows that over recent years departures on

a permanent or long-term basis have been very substantial. In 2001-02 permanent departures

numbered 48,241 compared with an average of 30,539 over the previous 14 years. This represents a

17.4 percent increase over 1999-2000 and a 61.6 percent increase over 5 years earlier. This is in spite

of the fact that permanent arrivals in 2001-02 were 88,900 and well below the 14 year average of

100,012. Table 23 shows that while the ratio of permanent emigration to permanent immigration has

varied between 14 and 52 percent since 1968, the ratio has been comparatively high in recent years.

Over the post-war period there has been a close relationship between immigration and emigration

trends with the latter tending to follow the former with a small time lag. This is because, as Table 23

indicates, former settlers have been a major part of emigration over the years.

44 HUGO, Graeme

44

Table 22: Australia: Settlers and Long-Term Migration, 1987-2002

Source: DIMIA Immigration Update, various issues

Year

1987-

88

1988-

89

1989-

90

1990-

91

1991-

92

1992-

93

1993-

94

1994-

95

1995-

96

1996-

97

1997-

98

1998-

99

1999-

2000

2000-

01

2001-

02

Permanent Migration

Arrivals 143,48

0

145,31

6

121,22

7

121,68

8

107,39

1

76,330 69,768 87,428 99,139 85,752 77,327 84,143 92,272 na 88,900

Departures 20,470 21,647 27,857 31,130 29,122 27,905 27,280 26,948 28,670 29,857 31,985 35,181 41,078 na 48,241

Net 123,01

0

123,66

9

93,370 90,558 78,269 48,425 42,488 60,480 70,469 55,895 45,342 48,962 51,194 na 40,659

Long-Term Migration

Arrivals 98,780 104,59

0

110,69

5

114,71

1

126,78

1

127,43

6

137,60

0

151,09

5

163,57

8

175,24

9

188,11

4

187,80

2

212,84

9

na 264,47

1

Departures 78,570 90,991 100,19

9

110,51

2

115,16

2

113,19

0

112,70

7

118,53

3

124,38

6

136,74

8

154,29

4

140,28

1

156,76

8

na 171,44

6

Net 20,210 13,599 10,496 4,199 11,619 14,246 24,893 32,562 39,192 38,501 33,820 47,521 56,081 na 93,025

Total 143,22 137,24 103,86 94,757 89,888 62,671 67,381 93,042 109,66 94,396 79,162 96,483 107275 na 133,68

45 HUGO, Graeme

45

Permanent and

Long-Term Net

Gain

0 2 6 1 4

% Net

Migration from

Long-Term

Movement

14.1 9.9 10.1 4.4 12.9 22.7 36.9 35.0 35.7 40.8 42.7 49.3 52.3 na 69.6

46 HUGO, Graeme

46

Table 23: Australia: Permanent Movement, Financial Years, 1968-2002

Sources: DIMIA Australian Immigration Consolidated Statistics and Immigration Update, various

issues

Permanent Departures

Former Settlers* Australia-Born** Financial

Year

Settler

Arrivals No.

% of

Departures No.

% of

Departures

Total Departures as

% of Arrivals

1968-69 175,657 23,537 74.3 8,141 25.7 31,678 18.0

1969-70 185,099 26,082 72.3 10,000 27.7 36,082 19.5

1970-71 170,011 28,244 71.8 11,072 28.2 39,316 23.1

1971-72 132,719 32,280 72.8 12,439 27.8 44,719 33.7

1972-73 107,401 31,961 71.2 12,945 28.8 44,906 41.8

1973-74 112,712 26,741 67.8 12,699 32.2 39,413 35.0

1974-75 89,147 20,184 64.0 11,361 36.0 31,545 35.4

1975-76 52,748 17,150 62.5 10,277 37.5 27,427 52.0

1976-77 70,916 15,447 62.8 9,141 37.2 24,588 34.7

1977-78 73,171 13,972 60.5 9,124 39.5 23,096 31.6

1978-79 67,192 13,797 54.3 11,632 45.7 25,429 37.8

1979-80 80,748 12,044 54.7 9,973 45.3 22,017 27.3

1980-81 110,689 10,888 55.8 8,608 44.2 19,496 17.6

1981-82 118,030 11,940 57..2 8,940 42.8 20,890 17.7

1982-83 93,010 15,390 62.0 9,440 38.0 24,830 26.7

1983-84 68,810 14,270 58.7 10,040 41.3 24,300 35.3

1984-85 77,510 11,040 54.2 9,340 45.8 20,380 26.3

1985-86 92,590 9,560 52.8 8,540 47.2 18,100 19.5

1986-87 113,540 10,800 54.2 9,130 45.8 19,930 17.6

1987-88 143,470 10,716 52.3 9,755 47.7 20,471 14.3

1988-89 145,320 15,087 69.7 6,560 30.3 21,647 14.9

1989-90 121,230 19,458 69.8 8,399 30.2 27,857 23.0

1990-91 121,688 21,640 69.5 9,490 30.5 31,130 25.6

1991-92 107,391 19,944 68.5 9,178 31.5 29,122 27.1

1992-93 76,330 18,102 64.9 9,803 35.1 27,905 36.6

1993-94 69,768 17,353 63.6 9,927 36.4 27,280 39.1

1994-95 87,428 16,856 62.6 10,092 37.4 26,948 30.8

1995-96 99,139 17,665 61.6 11,005 38.4 28,670 28.9

1996-97 85,752 18,159 60.8 11,698 39.2 29,857 34.8

1997-98 77,327 19,214 60.1 12,771 39.9 31,985 41.4

1998-99 84,143 17,931 50.1 17,250 49.0 35,181 41.8

47 HUGO, Graeme

47

1999-2000 92,272 20,844 50.7 20,234 49.3 41,078 44.5

2000-01 na na na na na na na

2001-02 88,900 24,095 49.9 24,146 50.1 48.241 54.3

* Data 1988-89 to 2001-02 constitute permanent overseas-born departures due to a change in

definition by DIMA. Data prior to this constitute former settler departures.

** Data prior to 1988-89 constitute permanent departures other than former settlers.

The return migration effect may have been understated in the data since a significant number of the

Australia-born are the children born in Australia to overseas-born returnees. On the other hand, the return

migration element is exaggerated to the extent that overseas-born persons who migrated to Australia as child

dependents with parents decide to move out of Australia independently after they reach adulthood.

Figure 19: Australia: Number of Emigrants to UK/Ireland and Other Europe in Relation to

Total Emigrants

Source: DIMIA, Immigration Update, various issues

Note: Data for 2001 are not available.

Figure 19 depicts the trends in emigration to Europe and it is apparent that the trends have followed

the increase in total emigration. In 2001-02 Europe was the destination of almost a third (31.2 percent) of

0

10000

20000

30000

40000

50000

60000

1988

1989

1990

1991

1992

1993

1994

1995

1996

1997

1998

1999

2000

2001

2002

Year

Num

ber

Emigrants to Other CountriesEmigrants to Other EuropeEmigrants to UK-Ireland

48 HUGO, Graeme

48

Australia-born persons indicating they were leaving Australia permanently (7,538 persons) and a quarter

(24.6 percent) of the overseas-born population leaving permanently (5,918 persons) (DIMIA, 2002a).

The distinction between the Australia-born and the overseas-born among emigrants is an important

one. The latter group are referred to as ‘settler loss’ and at times this has been an issue of concern to the

Australian government who has seen this as an indicator of the success (or lack of success) of the

immigration program. In fact, it would seem that around a fifth of all settlers subsequently leave Australia,

many returning to the country of birth, although the proportions vary widely between different birthplace

groups. In fact, much of the settler loss is not associated with any ‘failure’ on the part of the settler since

many intended for their stay to be temporary in the first place, other moves are triggered by life cycle events

such as death of a relative or divorce while a significant number return ‘home’ to retire after completing

their working life in Australia.

Among European groups, the highest rate of settler loss tends to be among the UK/Ireland-born

group. European settler loss peaked in 1972 with the emigration of 26,400. This was three years after the

peak immigration gain from Europe (145,000 settlers) reflecting the fact that half of all settler loss occurs

within the first five years of settlement (ABS, 1997). These numbers have subsequently declined in concert

with the decline in immigration from Europe so that in 1995, 4,900 Europe-born settlers emigrated from

Australia but by 2002 they had increased to 5,918. This may have been a function of the increasing skill

element in immigration since it has been found that the more highly educated and skilled groups of settlers

experience higher levels of settler loss than unskilled groups (Hugo, 1994). It may also partly be associated

with the fact that a large number of European immigrants who arrived in the early postwar years as young

adults are now entering the retirement years so that there has been an upswing in retirement return migration.

Over a third (34 percent) of Europe-born settlers leaving Australia had lived here for more than twenty years

(ABS, 1997, 18). The increasing significance of the latter factor is reflected in data on Australian overseas

pensions paid to foreign addresses. The Australian social security scheme is portable and although the true

amount of retirement return migration is hidden somewhat by bilateral country agreements on pensions, in

2001, 54,291 pensions were paid overseas and 18 of the top 20 nations receiving overseas pensions were

European. This represents a substantial increase over the last decade as Table 24 indicates.

49 HUGO, Graeme

49

Table 24: Australia: Overseas Pensions Paid in Fortnight Ending 15 June 1992 and 26 June

2001

Source: Centrelink

Recipients Amount $A Country

1992 2001 1992 2001

Greece 7,555 8,742 2,023,062 2,783,318

Italy 10,661 24,638 1,623,884 3,176,345

United Kingdom 3,678 3,314 821,948 822,721

Turkey 1,294 1,869 332,256 591,811

Yugoslavia 1,166 1,070 320,513 354,186

Malta 1,214 n.a. 270,512 n.a.

Croatia 695 1,303 196,680 432,407

New Zealand 685 14 192,257 3,283

Spain 783 4,074 188,405 605,419

Portugal 512 1,141 137,325 284,008

Others 6,249 20,476 1,664,705 3,802,685

The distribution of European destinations among emigrants from Australia varies somewhat

between the settler loss and Australia-born components as is reflected in Table 25. The UK and Ireland are

the dominant destination for both groups but it is especially so among the Australia-born. Among Southern

Europeans, on the other hand, settler loss is the dominant form of movement, much of it of the retirement

migration type.

Despite the significance of settler loss, it is now the permanent emigration of Australia-born

persons which is becoming an important focus of discussion. Table 25 indicates that in 2001-02, 7,538

Australia-born persons left Australia with the intention of not returning to live here compared with a

European settler loss of 5,918. When these figures are put against the equivalent permanent immigration

figures in Table 26 it is found that there is almost equal sized permanent movement from Australia to Europe

than there is in the traditionally important Europe to Australia direction. Indeed, if it were not for the

significant refugee/humanitarian related movement from the former Yugoslavia and USSR there would be a

net flow from Australia to Europe. Indeed, there were net losses in 2001-02 to Ireland, Cyprus, Greece,

Italy, Portugal, Spain, Malta, Austria, Belgium, France, Netherlands, Switzerland, Finland and Norway.

Table 25: Permanent Departures of Australia-Born and Former Settlers to Europe, 2001-02

Source: DIMIA, 2002a

50 HUGO, Graeme

50

Australia-Born Overseas-Born Destination

Number Percent Number Percent

UK and Ireland 5,392 71.5 3,498 59.1

Southern Europe 551 7.3 947 16.0

Western Europe 1,270 16.8 1,108 18.7

Northern Europe 220 2.9 182 3.1

Eastern Europe 105 1.4 183 3.1

Total Europe 7,538 100.0 5,918 100.0

Table 26: Australia: Permanent Immigration From and Emigration To Europe, 2001-02

Source: DIMIA, 2002a

Immigration by

Birthplace

Departures by

Destination Net Migration

Ratio of

Immigration:

Departures

UK and Ireland 9,253 8,890 +363 1.04

Southern Europe 4,118 1,498 +2,620 2.75

Western Europe 1,712 2,378 -666 0.72

Northern Europe 321 402 -81 0.80

Eastern Europe 1,151 288 +863 4.00

Total Europe 17,411 13,456 +3,955 1.29

Total 88,900 24,146 +64,756 3.68

Moreover within the UK, which has been the traditional source of immigrants to Australia, there were 100

Australia-UK emigrants for every 104 UK-Australia settlers. This ‘balance’ between inmigration and

emigration is not evident in interactions with Asia, Africa and South America where there are more than five

immigrants for every emigrant on average. However, for the USA and Canada there was a substantial net

emigration loss (1,730 immigrants and 4,716 emigrants).

Before considering in more detail the remigration of the Australia-born, it is necessary to include in

the analysis data on long-term departure from Australia (i.e. persons indicating that they intended to leave

Australia for more than a year but did intend to return). There is considerable ‘category jumping’ between

the long-term and permanent departure categories. Table 27 indicates that long-term departures reached

unprecedented levels in 2001-02 of 171,446. This was well above the 14 year average of 123,128 and 9.4

percent more than two years earlier. Clearly, there has been a significant growth of movement out of

Australia in recent years (Hugo, Rudd and Harris, 2001), increasing by 22.2 percent between 1998-99 and

51 HUGO, Graeme

51

2001-02. Here the pattern for Australian residents is interesting with the numbers increasing by 10 percent

over the previous three years. In 2001-02 there was a net migration loss of 3,473 through ‘long-term’

movement among the Australia-born compared with a net gain of 96,498 among the overseas-born.

The patterns of long-term movement to and from Europe are summarised in Table 28. This

indicates that there has been a significant increase in the long-term outmovement of Australian residents to

the UK and Ireland over the last decade.

Tables 29 and 30 put the long-term and permanent outmovement of Australia-born to the UK and to

other European destinations together. In 1999-2000, 33.1 percent of all Australians leaving the country on a

permanent or long-term (an anticipated absence of over a year) basis went to the UK. It will be noted that

the numbers have almost doubled over the last six years (Table 29). Females outnumber males in the

movement but there has been a faster increase in male outmovement than in female outmovement in recent

years. The movement to elsewhere in Europe is much smaller but it has increased substantially in recent

years.

52 HUGO, Graeme

52

Table 27: Australia: Long-Term Movement, 1959-60 to 2001-02

Source: DIMA Australian Immigration Consolidated Statistics and Immigration Update, various

issues

Arrivals Departures Net Overseas Movement

Australian

Residents

Overseas

Visitors

Total Australian

Residents

Overseas

Visitors

Total Australian

Residents

Overseas

Visitors

Total

1959-60 16,049 11,748 27,797 24,730 7,838 32,568 -8,681 3,910 -4,771

1960-61 16,870 13,320 30,190 28,542 11,823 40,365 -11,672 1,497 -10,175

1961-62 19,301 13,423 32,724 33,370 12,591 45,961 -14,069 832 -13,237

1962-63 21,376 13,971 35,347 34,324 13,219 47,543 -12,948 752 -12,196

1963-64 23,066 14,170 37,236 39,931 12,325 52,256 -16,865 1,845 -15,020

1964-65 24,065 16,484 40,549 42,702 13,640 56,342 -18,637 2,844 -15,793

1965-66 27,279 18,461 45,740 51,785 11,808 63,593 -24,506 6,653 -17,853

1966-67 31,161 20,078 51,239 53,750 12,707 66,457 -22,589 7,371 -15,218

1967-68 37,032 23,341 60,373 51,847 12,516 64,363 -14,815 10,825 -3,990

1968-69 37,376 24,442 61,818 53,296 13,817 67,113 -15,920 10,625 -5,295

1969-70 38,711 29,842 68,553 63,454 17,414 80,868 -24,743 12,428 -12,315

1970-71 43,554 31,225 74,779 66,463 19,928 86,391 -22,909 11,297 -11,612

1971-72 51,356 27,713 79,069 68,069 23,328 91,397 -16,713 4,385 -12,328

1972-73 58,292 26,733 85,025 67,379 23,579 90,958 -9,087 3,154 -5,933

1973-74 64,297 27,212 91,509 60,636 21,246 81,882 3,661 5,966 9,627

1974-75 60,239 23,615 83,854 72,397 24,386 96,783 -12,158 -771 -12,929

1975-76 60,224 21,687 81,911 64,475 21,528 86,003 -4,251 159 -4,092

1976-77 59,193 26,133 85,326 68,792 19,724 88,516 -9,599 6,409 -3,190

1977-78 57,311 28,043 85,354 60,099 19,194 79,293 -2,788 8,849 6,061

1978-79 60,947 34,064 95,011 57,255 21,216 78,471 3,692 12,848 16,540

1979-80 59,963 29,586 89,549 52,114 19,228 71,342 7,849 10,358 18,207

1980-81 59,871 34,220 94,091 47,848 18,778 66,626 12,023 15,442 27,465

1981-82 57,860 34,760 92,620 46,500 20,310 66,810 11,360 14,450 25,810

1982-83 48,990 30,740 79,730 47,020 25,440 72,460 1,970 5,300 7,270

1983-84 49,190 27,280 76,470 49,490 24,950 74,440 -300 2,330 2,030

1984-85 53,770 31,980 85,750 51,710 23,160 74,870 2,060 8,820 10,880

1985-86 56,560 37,250 93,810 49,690 24,670 74,360 6,870 12,580 19,450

1986-87 53,597 67,325 120,92

2

48,854 26,538 75,392 4,743 40,787 45,530

1987-88 54,804 43,978 98,782 50,499 28,054 78,553 4,305 15,924 20,229

1988-89 53,798 50,766 104,56

4

57,733 33,258 90,991 -3,935 17,508 13,573

53 HUGO, Graeme

53

1989-90 53,967 56,728 110,69

5

62,300 37,899 100,19

9

-8,333 18,829 10,496

1990-91 59,062 55,649 114,71

1

66,883 43,629 110,51

2

-7,821 12,020 4,199

1991-92 62,920 63,861 126,78

1

67,191 47,971 115,16

2

-4,271 15,890 11,619

1992-93 69,594 57,842 127,43

6

65,446 47,744 113,19

0

4,148 10,098 14,246

1993-94 75,600 62,000 137,60

0

64,786 47,921 112,70

7

10,814 14,079 24,893

1994-95 79,063 72,032 151,09

5

68,377 50,156 118,53

3

10,686 21,876 32,562

1995-96 79,206 84,372 163,57

8

70,253 54,133 124,38

6

8,953 30,239 39,192

1996-97 80,170 95,079 175,24

9

73,777 62,971 136,74

8

6,393 32,108 38,501

1997-98 84,358 103,756 188,11

4

79,422 74,872 154,29

4

4,936 28,884 33,820

1998-99 67,910 119,892 187,80

2

82,861 57,420 140,28

1

-14,951 62,472 47,521

1999-

2000

79,651 133,198 212,84

9

84,918 71,850 156,76

8

-5,267 61,348 56,081

2000-01 na na na na na na na na na

2001-02 88,598 175,873 264,47

1

92,071 79,375 171,44

6

-3,473 96,498 93,025

54 HUGO, Graeme

54

Table 28: Australia: Long-Term Movement To and From Europe and Australia, 1994-2000

Source: ABS, Migration Australia, various issues

Long-Term Australian Resident Long-Term Australian Visitor

UK and Ireland Other Europe UK and Ireland Other Europe

Total Long Term Net

Migration

In Out Net In Out Net In Out Net In Out Net UK and

Ireland

Other

Europe

1994 21,443 16,563 4,880 12,367 8,363 4,004 5,979 4,925 1,054 4,105 3,390 715 5,934 4,719

1995 21,306 18,080 3,226 12,426 8,088 4,338 7,817 5,564 2,253 4,947 3,685 1,262 5,479 5,600

1996 21,314 19,286 2,028 11,900 7,771 4,129 9,280 6,324 2,956 5,802 4,222 1,580 4,984 5,709

1997 22,253 21,027 1,226 11,670 6,698 4,972 11,505 7,883 3,622 6,535 4,783 1,752 4,848 6,724

1998 23,679 24,960 -1,281 11,323 8,298 3,025 14,336 10,105 4,231 7,438 5,909 1,529 2,950 4,554

1999 20,775 28,304 -7,529 8,398 8,131 267 17,731 7,359 10,372 10,067 3,954 6,113 2,843 6,380

2000 26,957 29,424 -2,467 9,412 8,292 1,120 21,129 10,513 10,616 11,629 4,861 6,768 8,149 5,648

55 HUGO, Graeme

55

Table 29: Permanent and Long-Term Outmovement of the Australia-Born Who Went to the

UK, 1994-2000

Source: DIMA Movements Data Base (unpublished)

Year Total Sex Ratio

(m/100f) Percent

1994-95 14,657 71.5 28.3

1995-96 15,873 70.2 29.2

1996-97 17,812 74.5 30.9

1997-98 21,209 80.1 33.7

1998-99 25,210 79.3 33.9

1999-2000 26,493 79.0 33.1

Table 30: Australia: Permanent and Long-Term Outmovement of the Australia-Born to

Continental Europe, 1994-2000

Source: DIMA Movements Data Base

Year Germany France Other Europe

1994-95 738 473 3,963

1995-96 664 457 3,961

1996-97 713 457 4,057

1997-98 672 557 4,532

1998-99 845 630 4,985

1999-2000 904 684 5,401

It is of importance to examine the workforce characteristics of those Australia-born who are

moving to other countries on a long-term or permanent basis. Table 31 shows that the movement to the

main destination countries is dominated by highly skilled groups. Almost 60 percent of workers going to the

UK, the largest single destination are drawn from the manager, administrative, professional and associate

professional categories while 72.8 percent of these going to the USA are in those occupations. This

compares with 37.7 percent of all employed persons in Australia being in this group. Hence it is very much

56 HUGO, Graeme

56

a ‘brain drain’ phenomena which is selective of highly skilled groups. Moreover, it is clear from Table 31

that this selectivity characterises the flows to other destinations as well.

57 HUGO, Graeme

57

Table 31: Long-Term and Permanent Departures of Australia-Born to Other Areas by

Occupation, 1994-2000

Source: DIMA Movements Data Base

Managers, Administrative, Professionals

and Para Professional Country Total Workers

No. %

United Kingdom 95,961 57,464 59.8

New Zealand 17,303 10,329 59.7

United States 31,199 22,686 73.0

Germany 2,677 1,933 72.2

France 1,934 1,369 70.7

Other Europe 14,845 9,127 61.5

Singapore 7,876 6,566 83.4

Hong Kong 6,423 5,362 83.5

Malaysia 3,727 3,002 80.5

Japan 7,418 5,855 78.9

Other Asia 19,786 15,190 76.8

Other 35,491 24,720 69.8

Another important characteristic of the emigrants which needs to be considered is age. Table 32 shows the

age-sex breakdown of Australia-born persons leaving permanently or on a long-term basis. The pattern is

one of an overwhelming concentration in the young adult age groups. There are some significant

differences. In the movement to the UK two thirds of the migrants are aged between 20 and 29 years. These

are clearly part of the reciprocal movement to the Australian Working Holiday Maker Program, i.e. it

involves young people on holidays who intend to return to Australia after a year or two. The pattern in the

US is quite different. There is currently no Working Holiday Program with the US so each of the people

going on a long-term basis need to qualify for movement under a work related criteria. It is interesting that

the age structure of movement to the US is somewhat older than that to the UK. This reflects the fact that

movement to the US is overwhelming of people who are already in the workforce and are not a recent

graduate. Moreover, it is interesting that many young Australian families including dependent children are

moving to the US. The proportion of Australia-born aged less than 10 years in the movement to the US is

58 HUGO, Graeme

58

twice that to the UK due to the fact that young professionals often with their families dominate among the

migration to the US.

Table 32: Permanent and Long-Term Departures of Australia-Born to Other Areas by Age

Structure

Source: DIMA Movements Data Base

Destination Percent Aged 20-29 Percent Aged 30-39

United Kingdom 64.5 16.0

New Zealand 23.6 20.3

United States 32.2 26.7

Germany 36.5 24.6

France 31.6 25.4

Other Europe 34.5 21.2

Singapore 20.1 27.5

Hong Kong 18.1 26.2

Malaysia 12.3 24.2

Japan 45.6 24.4

Other Asia 15.2 23.8

Other 25.4 21.9

A survey of Australians based overseas was undertaken by the author and two colleagues in 2002

which included the completion of questionnaires by 763 Australians based in the UK or elsewhere in

Europe. There is insufficient space here to detail the results but a few points can be made:

• Most respondents gave economic/employment reasons for leaving Australia.

• Less than a fifth indicated they had no intention of returning to live in Australia and over half had

definite intentions to do so.

• Most gave lifestyle and family reasons for returning.

• More than three quarters ‘still call Australia home and see themselves as Australian’.

• A quarter had annual earnings in excess of A$200,000.

Australia has a diaspora of more than 900,000 citizens living more or less permanently overseas

and more than a third are in Europe (Department of Foreign Affairs and Trade, 2002). This raises a number

59 HUGO, Graeme

59

of issues which can only be briefly mentioned here. With such a large and highly qualified diaspora in

relation to the national resident population, the issue of brain drain arises. It is apparent, however, that

Australia has experienced, and continues to experience, a net gain of highly skilled workers through

international migration. Indeed, the introduction of a liberalised temporary worker entry policy has meant

that the intake of skilled workers into Australia has greatly increased. The number of person years of skilled

workers added to the Australian labour market by non-permanent migration is substantially greater than that

added through traditional settlement migration. Yet prior to the mid 1990s this form of international

migration provided only a miniscule amount of skilled labour to the national labour market. The

introduction of new categories of temporary labour movement has thus added substantially to the brain gain

experienced by the country. In net terms there can be no doubt that Australia continues to experience a

substantial ‘brain gain’. The proportion of this gain coming from Europe has declined but not as much as

appears to be the case from an examination of percent settlement data.

On the other hand, there can equally be no doubt that the movement of skilled workers out of the

nation has increased over the same period. One element of this has been the inevitable outmovement of the

skilled workers entering Australia under temporary visas but there has been an increase in the numbers of

Australian citizens leaving as well. While the latter may well, in many ways, represent a ‘loss’ to Australia

it has been shown that skilled emigrants can contribute significantly to their home economy.

• Sending remittances to the home country which can improve the balance of payments situation.

Indeed, in several Asian nations such remittances are larger earners of foreign currency than any

single good trade.

• Encouraging investment of their foreign-based companies in their home area.

• Creating bridgeheads for the export of Australian goods and services.

• Eventually returning to the home nation, not only with enhanced skills and wealth to invest but also

the business linkages to facilitate the development of industry at home.

The increase in the number of Australians going overseas on a long term or permanent basis has

certainly raised the level of public discussion about an ‘Australian brain drain’. For example, the federal

government’s 29 January 2001 statement Backing Australia’s Ability: An Innovation Action Plan for the

Future had a number of initiatives to attract back and retain leading Australian researchers. There has been

expressions of concern from some professional groups about the loss of young skilled people overseas.

The upswing in outmovement of Australia-born young people with skills is a function of:

• The longstanding tradition of young Australians travelling overseas on extended working holidays.

Such a practice has become more possible than previously through such programs as the WHM

Program but also through processes of globalisation which have put overseas travel within the reach

of more Australians.

• The new element, however, is the internationalisation of labour markets which means that young

skilled Australians are looking for jobs in labour markets which extend beyond Australia’s

boundaries. In addition, more who get jobs in Australia do so with employers who are themselves

60 HUGO, Graeme

60

multi-nationals or have links with companies in other countries that facilitate the transfer of

Australian staff.

There are two ways of looking at this development. One is to say that this represents a significant

loss to Australia and a lack of return on community investment in the education of young people. Such

reactions would argue for policies which attempt to keep young people in Australia. An alternative approach

is one which accepts that there will be a significant outmovement of young Australians for both of the

reasons mentioned above. However, this approach should not accept that all of these skilled Australia-born

emigrants are lost to Australia. A major priority would be to ensure that a substantial proportion of these

emigrants are in fact circulators rather than emigrants. If the majority return to Australia after spending a

period working overseas, their value to Australia will be even greater than if they stayed in Australia. This is

because:

• They will return more experienced than when they left and in a globalising world the international

experience will be of value to their Australian employers seeking to compete in international

markets.

• They will have substantial overseas networks and contacts which will assist their Australian

employers in penetrating overseas markets.

• They may bring back with them capital as investment from their larger overseas employers. This

has certainly been the case in the Indian information technology industry.

Moreover, while they are still overseas they can still be contributing to development within Australia:

• By remitting sums back to Australia.

• By serving as bridgeheads of Australian businesses in the destination nations. An example here is

how Australian mining engineers in Asia have been instrumental in making Australian mining and

mining supplies companies paramount in the region.

CONCLUSION

The migration relationship between Europe and Australia has changed profoundly, especially in the

last decade. Whereas the early postwar years saw more than two million Europeans migrate to, and settle in,

Australia. In recent years the numbers have dwindled dramatically such that a majority of European

countries now experience a net gain of population by migration from Australia. Even for the UK which has

been the dominant origin of non-indigenous Australia over two centuries, the two flows of permanent

migration are similar in size. An important element in the reverse flow is Australia-born young people who

are responding largely to a globalisation of labour markets, especially skilled labour markets. Indeed for its

national population size, Australia has a very significant diaspora, especially in Europe. However, a

concentration on the permanent displacement of population through settlement type migration conceals the

fact that there has been a massive escalation in temporary movements between Australia and Europe. There

is a tendency to dismiss these types of movements as ephemeral and lacking in substantial and long-term

impact but this is certainly not the case, although we have only a scant research base to draw upon. In many

61 HUGO, Graeme

61

ways policy development has outpaced progress in research in this respect and there is a pressing need to

reorient much migration research activity to encompass the new forms and patterns of mobility.

62 HUGO, Graeme

62

APPENDIX A: LARGEST EUROPE-BORN GROUPS IN AUSTRALIA, 1947-2001 Source: Australian Censuses 1947-2001

Overseas-Born

Rank Birthplace

1947 1961 1971 1981 1991 2001 2001 2001

North-West Europe

Channel Islands 2,074 1,929 0.05 96

England 381,592 556,478 842,032 889,124 909,043 847,365 20.64 1

Isle of Man 747 670 0.02 119

Northern Island 5,539 13,158 21,936 21,958 25,034 21,746 0.53 41

Scotland 102,998 132,811 159,292 151,629 156,638 137,252 3.34 6

Wales 11,864 15,898 23,096 24,110 27,956 26,051 0.63 31

Ireland 39,274 37,057 41,854 45,780 52,373 50,235 1.22 21

Western Europe

Austria 4,219 23,807 23,941 22,805 22,118 19,313 0.47 43

Belgium 572 2,083 4,172 4,314 4,759 1,900 0.05 75

France 2,215 5,409 11,845 13,335 15,890 17,268 0.42 45

Germany 14,567 109,315 110,811 110,758 114,915 108,220 2.64 8

Netherlands 2,174 102,083 99,295 96,044 95,818 83,324 2.03 11

Switzerland 1,663 4,281 6,854 7,726 9,888 10,753 0.26 58

Denmark 2,759 5,654 7,566 7,911 9,368 9,029 0.22 64

Finland 1,373 6,488 10,359 9,507 9,110 8,258 0.20 65

Iceland 358 463 0.01 128

Norway 2,024 3,219 3,306 2,935 2,713 4,324 0.11 80

63 HUGO, Graeme

63

Sweden 2,209 2,674 3,725 4,404 6,009 6,818 0.17 69

Southern and Eastern Europe

Southern Europe

Gibraltar 412 416 0.01 132

Italy 33,632 228,296 289,476 275,883 254,780 218,718 5.33 3

Malta 3,238 39,337 53,681 57,001 53,838 46,998 1.14 23

Portugal 76 958 6,967 11,768 18,001 15,441 0.38 47

Spain 992 3,831 14,663 15,153 14,708 12,662 0.31 52

South Eastern Europe

Albania 1,402 1,473 1,380 1,364 988 1,451 0.04 102

Bosnia and Herzegovina 23,848 0.58 34

Bulgaria 525 1,396 1,421 1,678 1,764 2,571 0.06 89

Croatia 51,909 1.26 20

Cyprus 681 8,576 13,267 23,332 22,212 19,482 0.47 42

Former Yugoslav Republic of Macedonia 43,527 1.06 25

Greece 12,291 77,333 160,200 146,625 136,327 116,431 2.84 7

Moldova 19 477 0.01 126

Romania 493 4,391 4,662 1,861 11,328 12,821 0.31 51

Slovenia 6,685 0.16 72

Yugoslavia, Federal Republic of 55,365 1.35 17

Eastern Europe

Armenia 396 900 0.02 114

Belarus 1,039 0.03 112

Czech Republic 6,973 0.17 67

Estonia 1,102 6,046 5,313 5,040 3,381 2,389 0.06 92

64 HUGO, Graeme

64

Georgia 16 309 0.01 143

Hungary 1,227 30,553 29,160 27,987 27,176 22,752 0.55 39

Kazakhstan 3 437 0.01 130

Latvia 447 16,451 14,478 12,061 9,322 6,688 0.16 71

Lithuania 273 7,678 7,051 5,844 4,588 3,687 0.09 82

Poland 6,573 60,049 59,700 59,441 68,931 58,110 1.42 16

Russian Federation 8,365 15,021 0.37 48

Slovakia 2,984 0.07 86

Ukraine *4,976 13,873 12,450 10,941 9,051 14,062 0.34 49

Uzbekistan 3 416 0.01 133

* Includes former USSR

65 HUGO, Graeme

65

REFERENCES

Appleyard, R.T., 1959. British Emigration - End of an Era, Current Affairs Bulletin, 24(6).

Appleyard, R.T., 1964. British Emigration to Australia, Australian National University, Canberra.

Australian Bureau of Statistics (ABS). Migration Australia, various issues, ABS, Canberra.

Australian Bureau of Statistics (ABS). Overseas Arrivals and Departures, Australia, Catalogue No.

3402.0, ABS, Canberra.

Australian Bureau of Statistics (ABS), 1997. Australian Social Trends 1997, Catalogue No. 4102.0,

ABS, Canberra.

Australian Bureau of Statistics (ABS), 2000. How Australia Takes a Census, Catalogue No. 2903.0,

ABS, Canberra.

Australian Bureau of Statistics (ABS), 2002. Australian Demographic Statistics June Quarter 2002,

Catalogue No. 3101.0, ABS, Canberra.

Birrell, B., 1999. Residential Relocation in Sydney and the NSW Coast Over the Period 1991 to 1996,

People and Place, 7(2), 48-59.

Birrell, B. and Healy, E., 1997. Globalisation and Temporary Entry, People and Place, 5(4), 43-52.

Borrie, W.D., 1954. Italians and Germans in Australia: A Study of Assimilation, Cheshire, Melbourne.

Borrie, W.D. and Price, C., 1982. Immigration, The Australian Encyclopedia, Grolier Society, Sydney,

221-225.

Bureau of Immigration and Population Research (BIMPR), 1993. Immigration Update, June Quarter

1992, AGPS, Canberra.

Commonwealth Bureau of Census and Statistics (CBCS). Demography, various issues, CBCS,

Canberra.

Crowley, F.K., 1954. The British Contribution to the Australian Population, 1860-1919, University

Studies in History and Economics, University of Western Australia, 2(2).

Department of Education, Training and Youth Affairs (DETYA). Selected Higher Education Student

Statistics, various issues, AGPS, Canberra.

Department of Immigration and Multicultural Affairs (DIMA), 2000. Population Flows: Immigration

Aspects, 2000 Edition, AGPS, Canberra.

Department of Immigration and Multicultural Affairs (DIMA), 2001. Temporary Entrants 1999-2000,

AGPS, Canberra.

Department of Immigration, Multicultural and Ethnic Affairs (DIMIA). Australian Immigration

Consolidated Statistics, various issues, AGPS, Canberra.

Department of Immigration, Multicultural and Ethnic Affairs (DIMIA). Immigration Update, various

issues, AGPS, Canberra.

Department of Immigration, Multicultural and Indigenous Affairs (DIMIA), 2002a. Immigration

Update 2001-2002, AGPS, Canberra.

Department of Immigration, Multicultural and Indigenous Affairs (DIMIA), 2002b. Population Flows:

Immigration Aspects, December 1999, AGPS, Canberra.

66 HUGO, Graeme

66

Department of Immigration and Multicultural and Indigenous Affairs (DIMIA), 2002c. Migration

Program Planning Levels, Fact Sheet 20, DIMIA, Canberra.

Department of Immigration and Multicultural and Indigenous Affairs (DIMIA), 2002d. Working

Holiday Maker Program, Fact Sheet 49, DIMIA, Canberra.

Eggleston, F.W. et al. (ed.), 1933. The Peopling of Australia, Melbourne University Press, Parkville.

Fincher, R., 2001. Immigration Research in the Politics of an Anxious Nation, Environment and

Planning D: Society and Space, 19, 25-42.

Haines, R. and Shlomowitz, R., 1990. Nineteenth Century Immigration from the United Kingdom to

Australia, An Estimate of the Percentage who were Government-Assisted, Flinders University

of South Australia, Bedford Park.

Hugo, G.J., 1986. Australia’s Changing Population: Trends and Implications, Oxford University

Press, Melbourne.

Hugo, G.J., 1994. The Economic Implications of Emigration from Australia, AGPS, Canberra.

Hugo, G.J., 1995. Migration Between Australia and Britain: Past and Present, pp. 7-96 in D. Lowe

(ed.), Immigration and Integration: Australia and Britain, Bureau of Immigration,

Multicultural and Population Research, Melbourne; Sir Robert Menzies Centre for Australian

Studies, Melbourne and London.

Hugo, G.J., 1999. A New Paradigm of International Migration in Australia, New Zealand Population

Review, 25(1-2), 1-39.

Hugo, G.J., 2001. International Migration and Agricultural Labour in Australia. Paper prepared for

Changing Face Workshop, Imperial Valley, California, 16-18 January.

Hugo, G.J., 2003. Asian Migration to Australia: Changing Trends and Implications, Scottish

Geographical Journal.

Hugo, G.J., Rudd, D. and Harris, K., 2001. Emigration from Australia: Economic Implications, CEDA

Information Paper No. 77, CEDA, Melbourne.

Joint Standing Committee on Migration (JSCM), 1997. Working Holiday Makers: More than Tourists,

AGPS, Canberra.

Khoo, S.E., 1989. Census 86: Data Quality - Ancestry, Australian Bureau of Statistics, Canberra.

Kinnaird, B., 1999. Working Holiday Makers: More Than Tourists - Implications of the Report of the

Joint Standing Committee on Migration, People and Place, 7(1), 39-52.

Kippen, R. and McDonald, P., 2000. Australia’s Population in 2000: The Way We Are and the Ways

We Might Have Been, People and Place, 8(3), 10-17.

Kunz, E.F., 1988. Displaced Persons: Calwell’s New Australians, Australian National University

Press, Sydney.

Organisation for Economic Cooperation and Development (OECD), 2001. Student Mobility Between

and Towards OECD Countries: A Comparative Analysis. Paper presented at ‘International

Mobility of Highly Skilled Workers: From Statistical Analysis to the Formulation of Policies’,

Seminar organised by OECD (DSTI/DEELSA), Paris, 11 and 12 June.

Paice, J., 1990. The 1990s – Is the Australian Census of Population and Housing Relevant? Paper

presented at the Australian Population Association Conference, Melbourne, November.

67 HUGO, Graeme

67

Price, C.A., 1963. Southern Europeans in Australia, Research School of Social Sciences, Australian

National University, Canberra.

Price, C.A., 1979. Australian Immigration: A Bibliography and Digest , No 4, Department of

Demography, Australian National University, Canberra.

Price, C.A., 1999. Australian Population: Ethnic Origins, People and Place, 7(4), 12-16.

Price, C.A. et al., 1984. Birthplaces of Australian Population 1861-1981, Working Papers in

Demography, No. 13, Australian National University, Canberra.

Richards, E. (ed.), 1991. Poor Australian Immigrants in the Nineteenth Century, Division of Historical

Studies and Centre for Immigration and Multicultural Studies, Research School of Social

Sciences, Australian National University, Canberra.

Rizvi, A., 2002. SOPEMI 2003: Australia. Report by Australia’s Correspondent to SOPEMI,

November.

Ruddock, P., 2002. Record Temporary Entrants Contribute to Economy. DIMIA Media Release,

MPS 1/2002, Canberra: DIMIA.

Sherington, G., 1980. Australia's Immigrants, 1788-1978, Allen and Unwin, Sydney.

United Nations 1997. World Population Monitoring, 1997: Issues of International Migration and

Development: Selected Aspects, United Nations, New York.

Warnes, A.M., 2001. The International Dispersal of Pensioners from Affluent Countries, International

Journal of Population Geography, 7, 373-388.

Zlotnik, H., 1987. The Concept of International Migration as Reflected in Data Collection Systems,

International Migration Review, Special Issue, Vol. 21.


Recommended