36
A NEW PARTNERSHIP: RAIL TRANSIT AND CONVENTION GROWTH
A NEW PARTNERSHIP: RAIL TRANSIT AND CONVENTION GROWTH
A New Partnership: Rail Transit and Convention GrowthNovember 2013
Author: American Public Transportation Association
Lead Author: Darnell Chadwick Grisby, Director of Policy Development and Research
Cover photo credits: ©Cesar Russ Photography, Choose Chicago; San Francisco Travel Association photo by Naina Ayya; Las Vegas Monorail News
Rail Cities photo credits: Meet Minneapolis; San Francisco Travel Association photo by Scott Chernis; ©Kevin C. Rose/AtlantaPhotos.com
Non-Rail Cities photo credits: ©Cheryl Gerber, New Orleans Sacramento Convention & Visitors Bureau; Las Vegas News Bureau; ©Tom Myers, Sacramento Convention & Visitors Bureau
Copyright © 2013
The American Public Transportation Association (APTA) is a nonprofit international association of 1,500 public and private sector organizations, engaged in the areas of bus, paratransit, light rail, commuter rail, subways, waterborne services, and intercity and high-speed passenger rail. This includes: transit systems; planning, design, construction, and finance firms; product and service providers; academic institutions; transit associations and state departments of transportation. APTA is the only association in North America that represents all modes of public transportation. APTA members serve the public interest by providing safe, efficient and economical transit services and products. More than 90 percent of the people using public transportation in the United States and Canada ride APTA member systems.
The U.S. Travel Association is the national, non-profit organization representing all components of the travel industry that generates $2.0 trillion in economic output and supports 14.6 million American jobs. U.S. Travel’s mission is to increase travel to and within the United States. Visit www.ustravel.org.
A NEW PARTERSHIP: RAIL TRANSIT AND CONVENTION GROWTH I
TABLE OF CONTENTS
Executive Summary . . . . . . . . . . . . . . . . . . . . . . . . . . . . . . . . . . . . . . . . . . . . . . . . . . . . . . . . . . . . . . . . . . . . . . . . . . . 1
Introduction . . . . . . . . . . . . . . . . . . . . . . . . . . . . . . . . . . . . . . . . . . . . . . . . . . . . . . . . . . . . . . . . . . . . . . . . . . . . . . . . . . 2
Key Findings . . . . . . . . . . . . . . . . . . . . . . . . . . . . . . . . . . . . . . . . . . . . . . . . . . . . . . . . . . . . . . . . . . . . . . . . . . . . . . . . . 4
Rail Cities . . . . . . . . . . . . . . . . . . . . . . . . . . . . . . . . . . . . . . . . . . . . . . . . . . . . . . . . . . . . . . . . . . . . . . . . . . . . . . . . . . . . 7
Atlanta . . . . . . . . . . . . . . . . . . . . . . . . . . . . . . . . . . . . . . . . . . . . . . . . . . . . . . . . . . . . . . . . . . . . . . . . . . . . . . . . . . . . . . 8
Chicago . . . . . . . . . . . . . . . . . . . . . . . . . . . . . . . . . . . . . . . . . . . . . . . . . . . . . . . . . . . . . . . . . . . . . . . . . . . . . . . . . . . . 10
District of Columbia . . . . . . . . . . . . . . . . . . . . . . . . . . . . . . . . . . . . . . . . . . . . . . . . . . . . . . . . . . . . . . . . . . . . . . . . . .12
Minneapolis . . . . . . . . . . . . . . . . . . . . . . . . . . . . . . . . . . . . . . . . . . . . . . . . . . . . . . . . . . . . . . . . . . . . . . . . . . . . . . . . . .14
Portland . . . . . . . . . . . . . . . . . . . . . . . . . . . . . . . . . . . . . . . . . . . . . . . . . . . . . . . . . . . . . . . . . . . . . . . . . . . . . . . . . . . . .16
San Francisco . . . . . . . . . . . . . . . . . . . . . . . . . . . . . . . . . . . . . . . . . . . . . . . . . . . . . . . . . . . . . . . . . . . . . . . . . . . . . . . .18
The Non-Rail Cities . . . . . . . . . . . . . . . . . . . . . . . . . . . . . . . . . . . . . . . . . . . . . . . . . . . . . . . . . . . . . . . . . . . . . . . . . . .20
Las Vegas . . . . . . . . . . . . . . . . . . . . . . . . . . . . . . . . . . . . . . . . . . . . . . . . . . . . . . . . . . . . . . . . . . . . . . . . . . . . . . . . . . . .21
New Orleans . . . . . . . . . . . . . . . . . . . . . . . . . . . . . . . . . . . . . . . . . . . . . . . . . . . . . . . . . . . . . . . . . . . . . . . . . . . . . . . . 23
Orlando . . . . . . . . . . . . . . . . . . . . . . . . . . . . . . . . . . . . . . . . . . . . . . . . . . . . . . . . . . . . . . . . . . . . . . . . . . . . . . . . . . . . 25
Sacramento . . . . . . . . . . . . . . . . . . . . . . . . . . . . . . . . . . . . . . . . . . . . . . . . . . . . . . . . . . . . . . . . . . . . . . . . . . . . . . . . . 27
Tampa . . . . . . . . . . . . . . . . . . . . . . . . . . . . . . . . . . . . . . . . . . . . . . . . . . . . . . . . . . . . . . . . . . . . . . . . . . . . . . . . . . . . . . 29
The Takeaway . . . . . . . . . . . . . . . . . . . . . . . . . . . . . . . . . . . . . . . . . . . . . . . . . . . . . . . . . . . . . . . . . . . . . . . . . . . . . . . 31
I I A NEW PARTERSHIP: RAIL TRANSIT AND CONVENTION GROWTH
ACKNOWLEDGEMENTS
Author: American Public Transportation Association
Lead Author: Darnell Chadwick Grisby, Director of Policy Development and Research
Analysis: American Public Transportation Association
Matthew Dickens, Policy Analyst
Contributions: U .S . Travel Association
Erik Hansen, Director, Domestic Policy
Allie Barth, Director, Industry Communications
Acknowledged Individuals:
American Public Transportation Association
Michael Melaniphy, President and CEO
Arthur Guzzetti, Vice President, Policy
Rosemary Sheridan, Vice President, Communications and Marketing
Mantill Williams, Director, Advocacy Communications
U .S . Travel Association
Roger Dow, President and CEO
Jonathan Grella, Senior Vice President, Public Affairs
Patricia Rojas-Ungár, Vice President, Government Relations
Greg Staley, Vice President, Communications
A NEW PARTERSHIP: RAIL TRANSIT AND CONVENTION GROWTH 1
Executive SummaryAs fewer Americans are driving cars and recent generational trends show an exodus from rural areas into cities and suburbs with interconnected transit and walkable alternatives, locations that offer multimodal transportation systems are increasingly popular places to live. However, new historical data analysis proves that these same cities are desirable places to travel to as well.
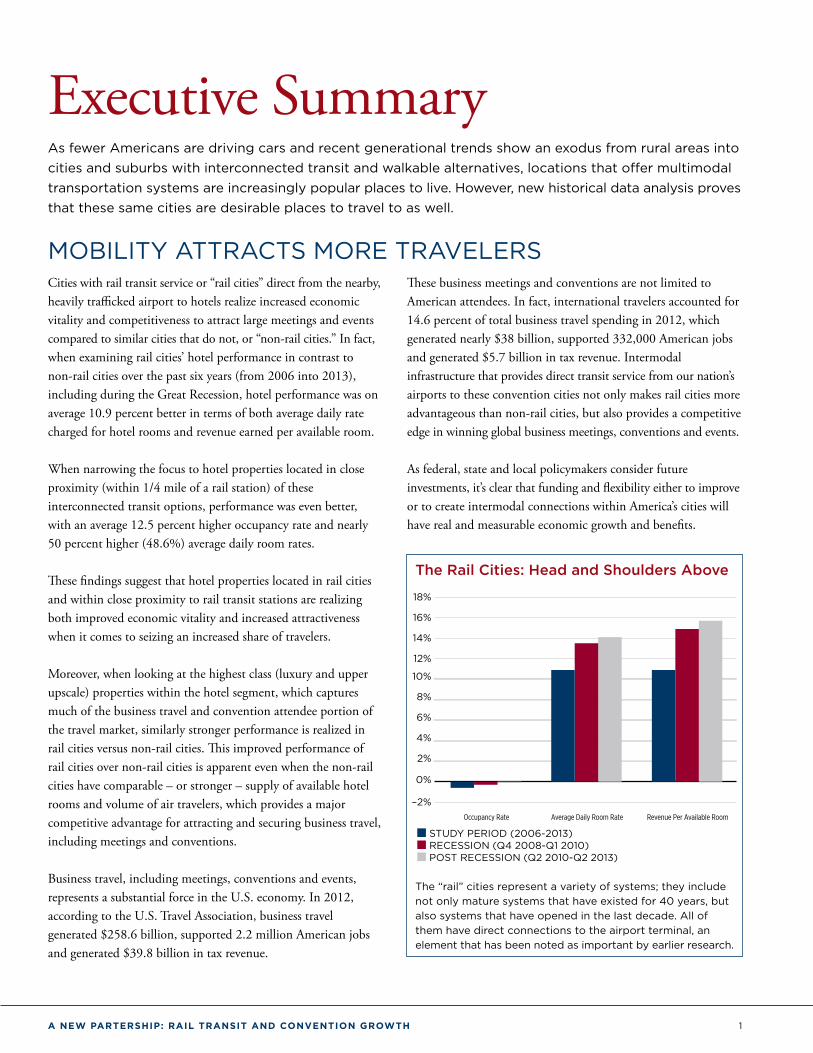
MOBILITY ATTRACTS MORE TRAVELERSCities with rail transit service or “rail cities” direct from the nearby, heavily trafficked airport to hotels realize increased economic vitality and competitiveness to attract large meetings and events compared to similar cities that do not, or “non-rail cities.” In fact, when examining rail cities’ hotel performance in contrast to non-rail cities over the past six years (from 2006 into 2013), including during the Great Recession, hotel performance was on average 10.9 percent better in terms of both average daily rate charged for hotel rooms and revenue earned per available room.
When narrowing the focus to hotel properties located in close proximity (within 1/4 mile of a rail station) of these interconnected transit options, performance was even better, with an average 12.5 percent higher occupancy rate and nearly 50 percent higher (48.6%) average daily room rates.
These findings suggest that hotel properties located in rail cities and within close proximity to rail transit stations are realizing both improved economic vitality and increased attractiveness when it comes to seizing an increased share of travelers.
Moreover, when looking at the highest class (luxury and upper upscale) properties within the hotel segment, which captures much of the business travel and convention attendee portion of the travel market, similarly stronger performance is realized in rail cities versus non-rail cities. This improved performance of rail cities over non-rail cities is apparent even when the non-rail cities have comparable – or stronger – supply of available hotel rooms and volume of air travelers, which provides a major competitive advantage for attracting and securing business travel, including meetings and conventions.
Business travel, including meetings, conventions and events, represents a substantial force in the U.S. economy. In 2012, according to the U.S. Travel Association, business travel generated $258.6 billion, supported 2.2 million American jobs and generated $39.8 billion in tax revenue.
These business meetings and conventions are not limited to American attendees. In fact, international travelers accounted for 14.6 percent of total business travel spending in 2012, which generated nearly $38 billion, supported 332,000 American jobs and generated $5.7 billion in tax revenue. Intermodal infrastructure that provides direct transit service from our nation’s airports to these convention cities not only makes rail cities more advantageous than non-rail cities, but also provides a competitive edge in winning global business meetings, conventions and events.
As federal, state and local policymakers consider future investments, it’s clear that funding and flexibility either to improve or to create intermodal connections within America’s cities will have real and measurable economic growth and benefits.
The Rail Cities: Head and Shoulders Above
–2%
0%
2%
4%
6%
8%
10%
12%
14%
16%
18%
Revenue Per Available RoomAverage Daily Room RateOccupancy Rate
n STUDY PERIOD (2006-2013) n RECESSION (Q4 2008-Q1 2010) n POST RECESSION (Q2 2010-Q2 2013)
The “rail” cities represent a variety of systems; they include not only mature systems that have existed for 40 years, but also systems that have opened in the last decade. All of them have direct connections to the airport terminal, an element that has been noted as important by earlier research.
2 A NEW PARTERSHIP: RAIL TRANSIT AND CONVENTION GROWTH
IntroductionMOBILITY IN AMERICAAfter decades of declining ridership and disinvestment, the sustained efforts of the federal government, along with state and local partners led to a rise in public transportation ridership that began in 1995 and continues to this day. Contributions to this increase have been identified as both generational preferences and changes in perception.
Generational shifts, including a move back to the cities and walkable suburban areas by Millennials and Empty Nesters, have also contributed to increased transit use and residential construction in areas with strong transit networks. In fact, research conducted by the American Public Transportation Association shows residential property values were 41.6 percent more resilient during the Great Recession if they were located within a quarter mile of fixed-guideway public transportation. Millennials are leading the trend. According to a recent report by the American Public Transportation Association, Millennials are multi-modal and take the best modal option for each individual trip. These trends make public transportation increasingly competitive.
Moreover, fewer Americans are driving cars. The most common metric to measure vehicle use has been down since 2004. In the vast majority of states, the number of miles driven is down; even as the economy improves, vehicle miles traveled fail to recover. The ongoing shift illustrates that even though automobiles remain an integral component of our transportation network, alternatives to the car are increasingly important and have begun to impact economic outcomes.
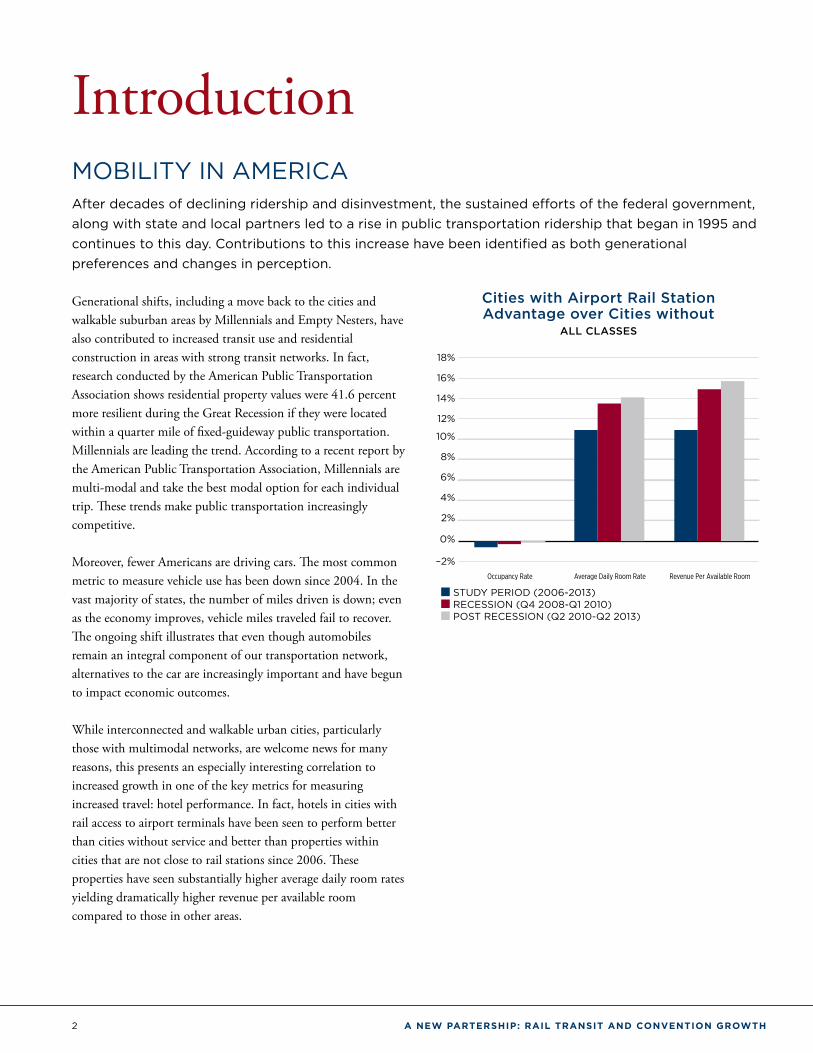
While interconnected and walkable urban cities, particularly those with multimodal networks, are welcome news for many reasons, this presents an especially interesting correlation to increased growth in one of the key metrics for measuring increased travel: hotel performance. In fact, hotels in cities with rail access to airport terminals have been seen to perform better than cities without service and better than properties within cities that are not close to rail stations since 2006. These properties have seen substantially higher average daily room rates yielding dramatically higher revenue per available room compared to those in other areas.
Cities with Airport Rail Station Advantage over Cities without
ALL CLASSES
–2%
0%
2%
4%
6%
8%
10%
12%
14%
16%
18%
Revenue Per Available RoomAverage Daily Room RateOccupancy Rate
n STUDY PERIOD (2006-2013) n RECESSION (Q4 2008-Q1 2010) n POST RECESSION (Q2 2010-Q2 2013)
A NEW PARTERSHIP: RAIL TRANSIT AND CONVENTION GROWTH 3
INTRODuCTION
EVALUATING HOTEL PERFORMANCE IN RAIL CITIES VERSUS NON-RAIL CITIES
This study compares transit and non-transit cities to key hotel performance metrics from first quarter 2006 to second quarter 2013. The Great Recession had a profound impact on the U.S. economy, including the hotel segment of the travel industry; to acknowledge this, analysis was further segmented into the Recession period from fourth quarter 2008 to first quarter 2010 and Post-Recession or Recovery period from second quarter 2012 to second quarter 2013.
The hotel performance metrics over these time periods compared:
■ Cities with airport rail to cities without airport rail; ■ Cities with airport rail’s hotels within ¼ mile of a rail station to hotels outside this radius; and
■ Both of the two above groupings, but exclusively for hotels most likely to host meetings, convention and business travel groups.
Research from Airport Cooperative Research Program Report 4: Ground Access to Major Airports by Public Transportation was utilized to shape the scope of this research; only cities with direct access to airport terminals via rail were considered as potential “rail cities” for the report. The focus of the report was narrowed to a sample of six U.S. cities with direct access (without a transfer) to airport terminals via rail.
The “non rail” cities selected for further analysis were chosen because they rank highest in overall volume of available hotel rooms and/or are home to airports with the largest volume of passenger boardings, according to 2012 data.
The industry leader in providing hotel performance metrics is STR. STR gathers lodging industry supply, demand and performance data from hotels located in more than 160 countries. More than 45,000 hotels globally, representing more than 5.8 million rooms, are currently using STR products to benchmark hotel performance, which also benefit non-hoteliers that gauge market performance, supply and demand, and forecasts. Key STR indicators used throughout this report are:
■ Occupancy: Occupancy is the percentage of available rooms that were sold during a specified period of time. Occupancy
is calculated by dividing the number of rooms sold by rooms available.
■ Average Daily Rate (ADR): ADR is a measure of the average rate paid for rooms sold, calculated by dividing room revenue by rooms sold.
■ Revenue Per Available Room (RevPAR): RevPAR is the total guest room revenue divided by the total number of available rooms. RevPAR differs from ADR because RevPAR is affected by the amount of unoccupied available rooms, while ADR shows only the average rate of rooms actually sold.
Another key hotel industry term used throughout this report is Market Class (Class), which is an industry categorization for hotel types. Class is based on a hotel’s ADR, and is divided into six class segments:
■ Luxury ■ Upper Upscale ■ Upscale ■ Upper Midscale ■ Midscale ■ Economy
Luxury and Upper Upscale Classes are the focus of this analysis, as those Classes capture much of the conference or meeting convention and business traveler business. These types of travelers are most likely to utilize public transportation from the airport. Therefore, an analysis of the performance of these hotel Classes illustrates the impact of transit on these high-performing destinations examined in this report.
Additionally, it should be known that this paper reports on observed behaviors and does not state a confirmed causal relationship.
4 A NEW PARTERSHIP: RAIL TRANSIT AND CONVENTION GROWTH
Key Findings INTERCONNECTED CITIES DELIVER STRONG PERFORMANCE
In good times and bad, cities with connected transportation showed stronger hotel performance across key indicators, particularly in attracting business travelers through conventions and meetings, than those that do not offer such transportation infrastructure options. Moreover, hotel properties realized even better performance when located in close proximity to these stations providing transportation service.
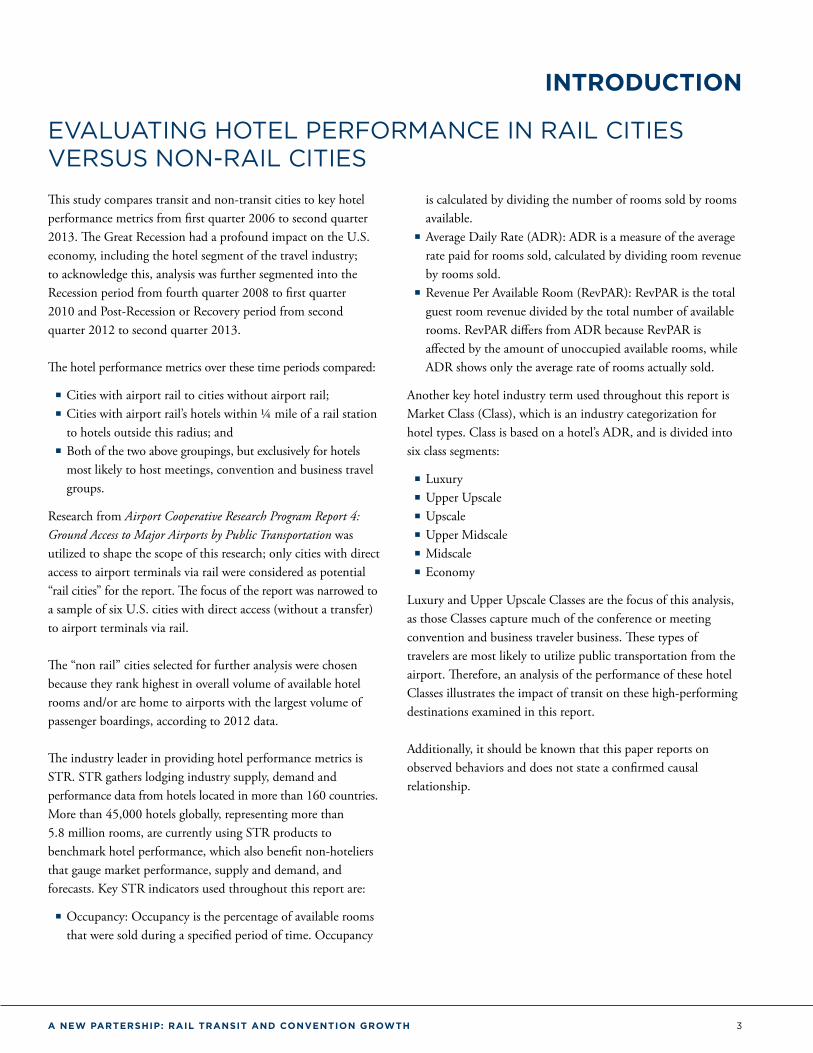
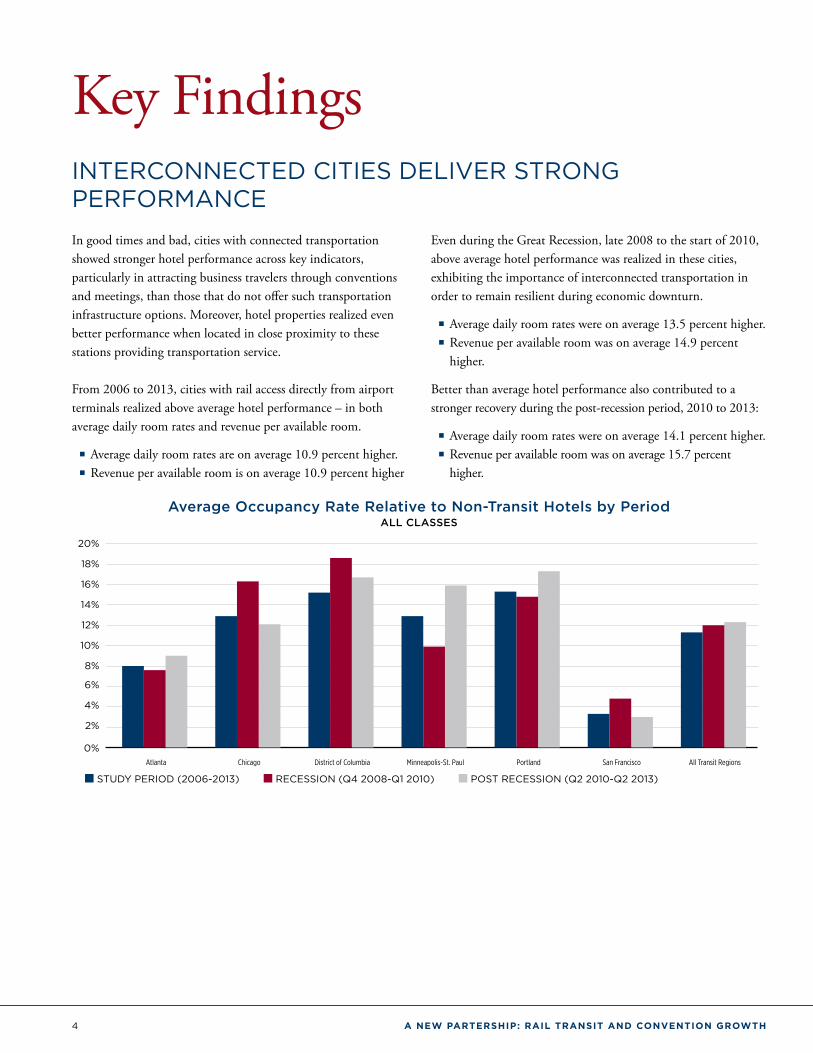
From 2006 to 2013, cities with rail access directly from airport terminals realized above average hotel performance – in both average daily room rates and revenue per available room.
■ Average daily room rates are on average 10.9 percent higher. ■ Revenue per available room is on average 10.9 percent higher
Even during the Great Recession, late 2008 to the start of 2010, above average hotel performance was realized in these cities, exhibiting the importance of interconnected transportation in order to remain resilient during economic downturn.
■ Average daily room rates were on average 13.5 percent higher. ■ Revenue per available room was on average 14.9 percent higher.
Better than average hotel performance also contributed to a stronger recovery during the post-recession period, 2010 to 2013:
■ Average daily room rates were on average 14.1 percent higher. ■ Revenue per available room was on average 15.7 percent higher.
Average Occupancy Rate Relative to Non-Transit Hotels by Period ALL CLASSES
0%
2%
4%
6%
8%
10%
12%
14%
16%
18%
20%
All Transit RegionsSan FranciscoPortlandMinneapolis-St. PaulDistrict of ColumbiaChicagoAtlanta
n STUDY PERIOD (2006-2013) n RECESSION (Q4 2008-Q1 2010) n POST RECESSION (Q2 2010-Q2 2013)
A NEW PARTERSHIP: RAIL TRANSIT AND CONVENTION GROWTH 5
KEy FINDINGS
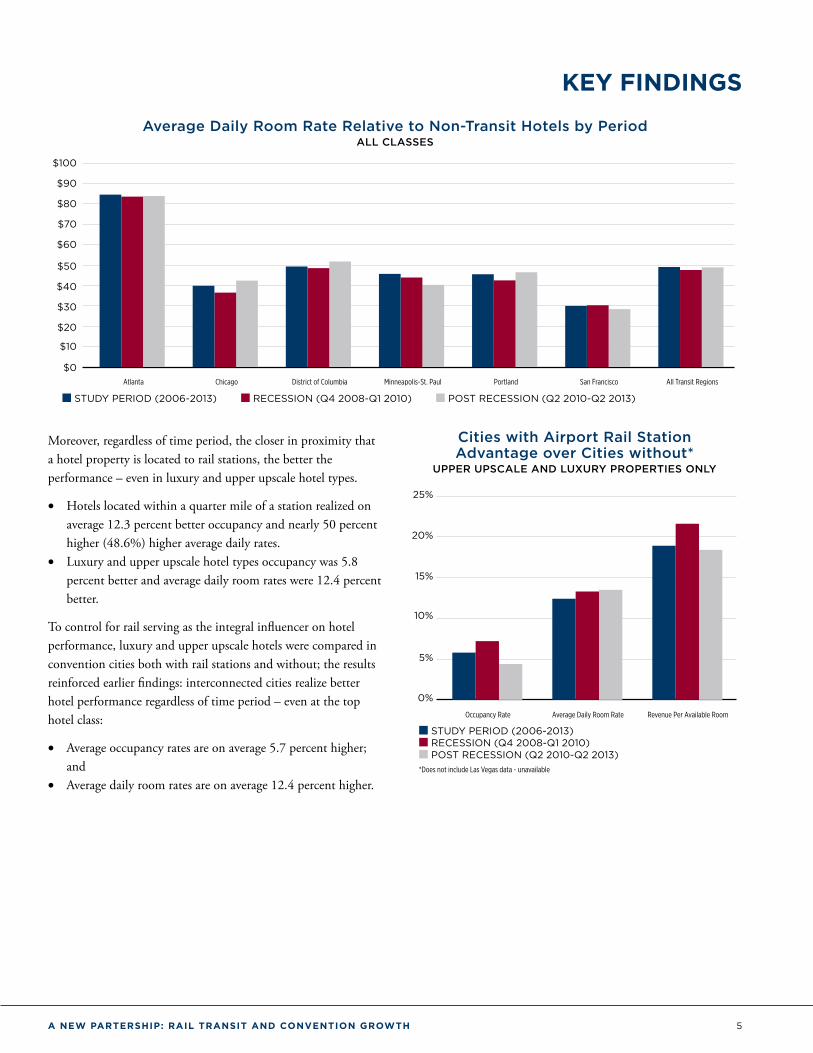
Average Daily Room Rate Relative to Non-Transit Hotels by Period ALL CLASSES
$0
$10
$20
$30
$40
$50
$60
$70
$80
$90
$100
All Transit RegionsSan FranciscoPortlandMinneapolis-St. PaulDistrict of ColumbiaChicagoAtlanta
n STUDY PERIOD (2006-2013) n RECESSION (Q4 2008-Q1 2010) n POST RECESSION (Q2 2010-Q2 2013)
Moreover, regardless of time period, the closer in proximity that a hotel property is located to rail stations, the better the performance – even in luxury and upper upscale hotel types.
• Hotels located within a quarter mile of a station realized on average 12.3 percent better occupancy and nearly 50 percent higher (48.6%) higher average daily rates.
• Luxury and upper upscale hotel types occupancy was 5.8 percent better and average daily room rates were 12.4 percent better.
To control for rail serving as the integral influencer on hotel performance, luxury and upper upscale hotels were compared in convention cities both with rail stations and without; the results reinforced earlier findings: interconnected cities realize better hotel performance regardless of time period – even at the top hotel class:
• Average occupancy rates are on average 5.7 percent higher; and
• Average daily room rates are on average 12.4 percent higher.
Cities with Airport Rail Station Advantage over Cities without*
UPPER UPSCALE AND LUXURY PROPERTIES ONLY
0%
5%
10%
15%
20%
25%
Revenue Per Available RoomAverage Daily Room RateOccupancy Rate
n STUDY PERIOD (2006-2013) n RECESSION (Q4 2008-Q1 2010) n POST RECESSION (Q2 2010-Q2 2013)*Does not include Las Vegas data - unavailable
6 A NEW PARTERSHIP: RAIL TRANSIT AND CONVENTION GROWTH
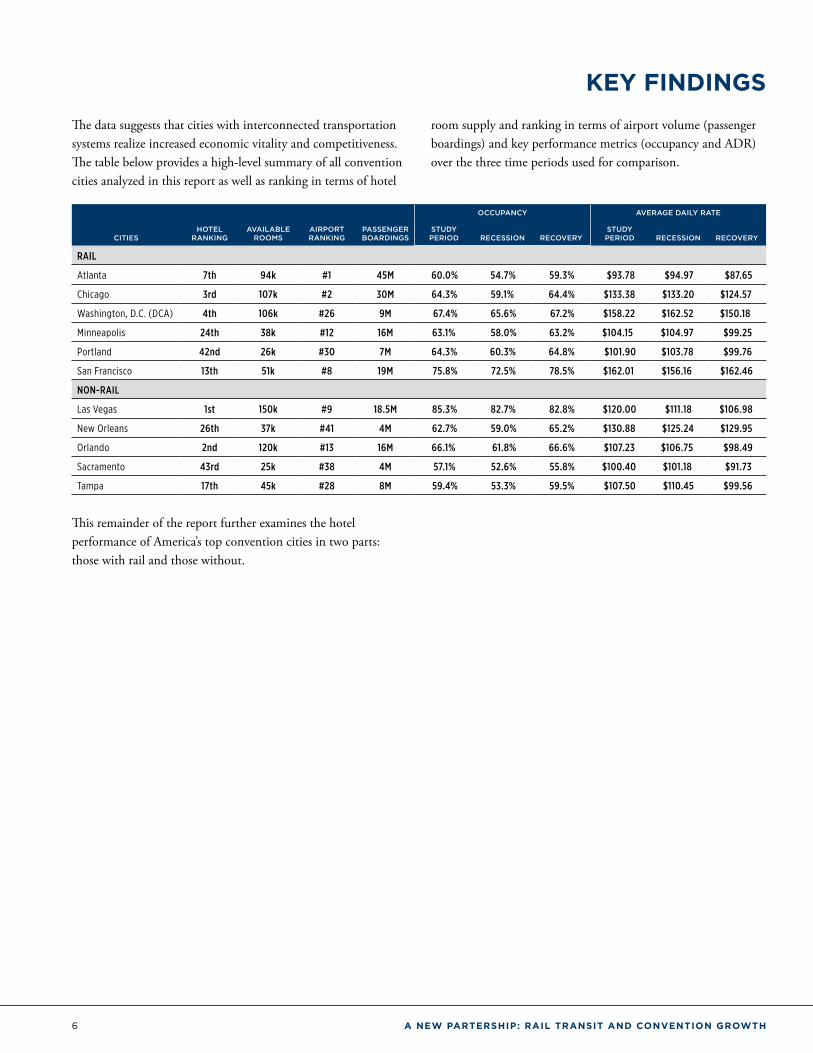
KEy FINDINGS The data suggests that cities with interconnected transportation systems realize increased economic vitality and competitiveness. The table below provides a high-level summary of all convention cities analyzed in this report as well as ranking in terms of hotel
room supply and ranking in terms of airport volume (passenger boardings) and key performance metrics (occupancy and ADR) over the three time periods used for comparison.
OCCUPANCY AVERAGE DAILY RATE
CITIESHOTEL
RANKINGAVAILABLE
ROOMSAIRPORT RANKING
PASSENGER BOARDINGS
STUDY PERIOD RECESSION RECOVERY
STUDY PERIOD RECESSION RECOVERY
RAIL
Atlanta 7th 94k #1 45M 60.0% 54.7% 59.3% $93.78 $94.97 $87.65
Chicago 3rd 107k #2 30M 64.3% 59.1% 64.4% $133.38 $133.20 $124.57
Washington, D.C. (DCA) 4th 106k #26 9M 67.4% 65.6% 67.2% $158.22 $162.52 $150.18
Minneapolis 24th 38k #12 16M 63.1% 58.0% 63.2% $104.15 $104.97 $99.25
Portland 42nd 26k #30 7M 64.3% 60.3% 64.8% $101.90 $103.78 $99.76
San Francisco 13th 51k #8 19M 75.8% 72.5% 78.5% $162.01 $156.16 $162.46
NON-RAIL
Las Vegas 1st 150k #9 18.5M 85.3% 82.7% 82.8% $120.00 $111.18 $106.98
New Orleans 26th 37k #41 4M 62.7% 59.0% 65.2% $130.88 $125.24 $129.95
Orlando 2nd 120k #13 16M 66.1% 61.8% 66.6% $107.23 $106.75 $98.49
Sacramento 43rd 25k #38 4M 57.1% 52.6% 55.8% $100.40 $101.18 $91.73
Tampa 17th 45k #28 8M 59.4% 53.3% 59.5% $107.50 $110.45 $99.56
This remainder of the report further examines the hotel performance of America’s top convention cities in two parts: those with rail and those without.
A NEW PARTERSHIP: RAIL TRANSIT AND CONVENTION GROWTH 7
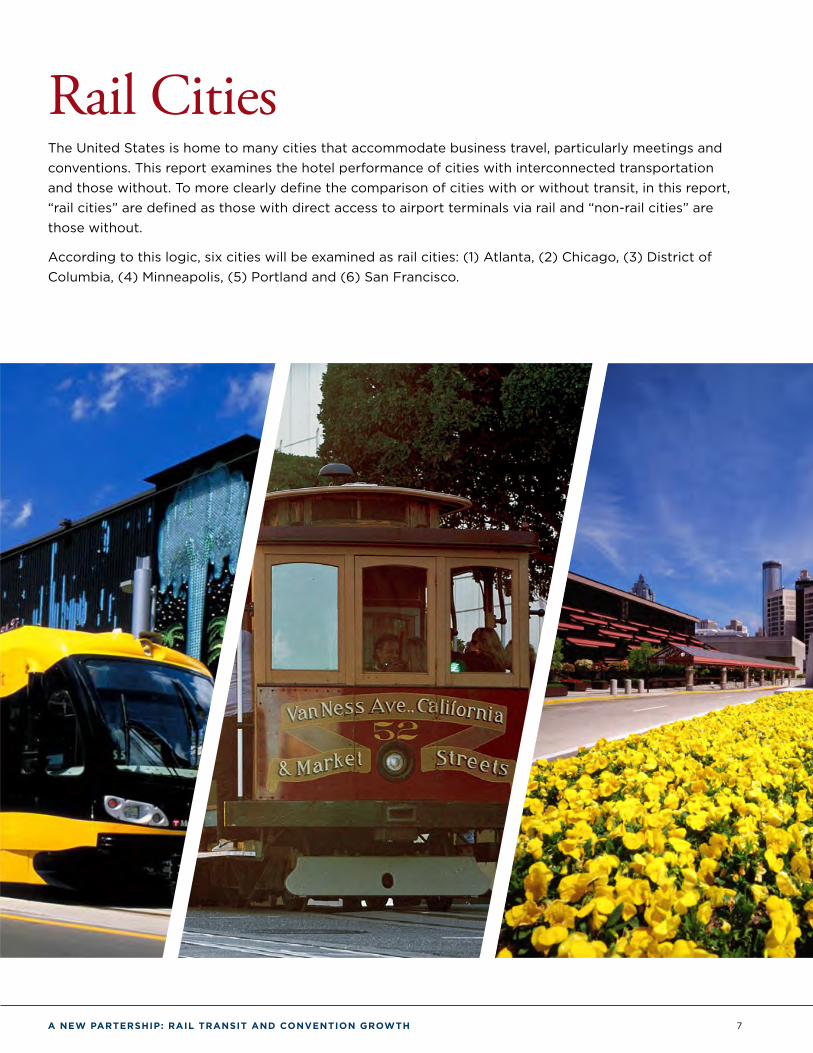
Rail CitiesThe United States is home to many cities that accommodate business travel, particularly meetings and conventions. This report examines the hotel performance of cities with interconnected transportation and those without. To more clearly define the comparison of cities with or without transit, in this report, “rail cities” are defined as those with direct access to airport terminals via rail and “non-rail cities” are those without.
According to this logic, six cities will be examined as rail cities: (1) Atlanta, (2) Chicago, (3) District of Columbia, (4) Minneapolis, (5) Portland and (6) San Francisco.

8 A NEW PARTERSHIP: RAIL TRANSIT AND CONVENTION GROWTH
RAIL CITIES
ATLANTA
The Metropolitan Atlanta Rapid Transit Authority (MARTA) has 38 rail stations and carried 217,000 riders per day in 2012. According to the Bureau of Transportation Statistics, Atlanta’s Hartsfield-Jackson International Airport ranked first in passenger boardings in the U.S. in 2012 with 45,192,870 – a three percent increase over 2011.
MARTA’s Airport service began in 1988, and the station is one of the busiest in the system. The station is a part of the airport, located right next to baggage claim.
When it comes to hosting meetings and conventions, Atlanta is a well-known meetings destination. Atlanta ranks 7th in the number of hotel rooms with 93,586 hotel rooms located in 786 properties.
Hotels Close to MARTA Realized Significantly Greater ADR
Atlanta • Average Daily Room Rate
$60
$80
$100
$120
$140
$160
$180
9/136/133/1312/129/126/123/1212/119/116/113/1112/109/106/103/1012/099/096/093/0912/089/086/083/0812/079/076/073/0712/069/066/063/06
$136.75
$167.05
$75.86
$89.70
NON-TRANSIT TRANSIT
Meetings and Convention Attendees Spend More for Hotel Near MARTA
Atlanta • Average Daily Room Rate LUXURY & UPPER UPSCALE PROPERTIES
$100
$120
$140
$160
$180
$200
9/136/133/1312/129/126/123/1212/119/116/113/1112/109/106/103/1012/099/096/093/0912/089/086/083/0812/079/076/073/0712/069/066/063/06
$148.30
$124.51
$153.49
$179.29
NON-TRANSIT TRANSIT
A NEW PARTERSHIP: RAIL TRANSIT AND CONVENTION GROWTH 9
RAIL CITIES
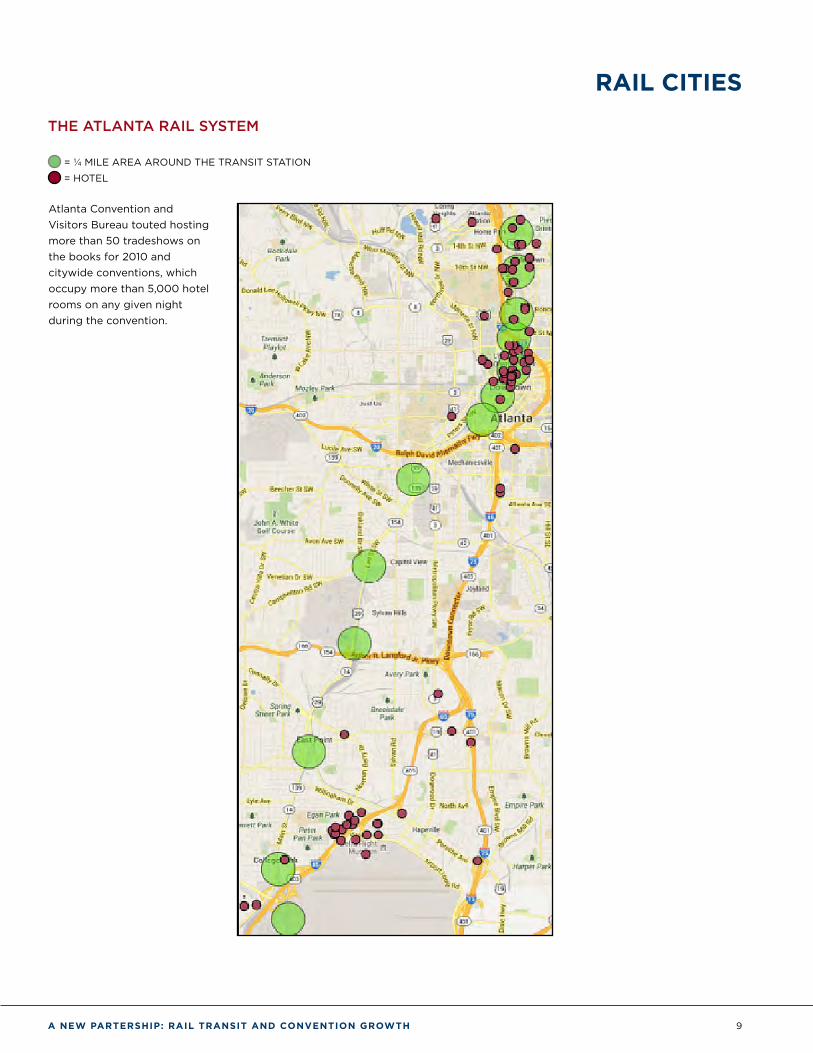
THE ATLANTA RAIL SYSTEM
= ¼ MILE AREA AROUND THE TRANSIT STATION
= HOTEL
Atlanta Convention and Visitors Bureau touted hosting more than 50 tradeshows on the books for 2010 and citywide conventions, which occupy more than 5,000 hotel rooms on any given night during the convention.

10 A NEW PARTERSHIP: RAIL TRANSIT AND CONVENTION GROWTH
RAIL CITIES
CHICAGO
The Chicago Transit Authority (CTA) has 144 train stations and served 728,000 people a day in 2012. According to the Bureau of Transportation Statistics, Chicago O’Hare International Airport ranked 2nd in the U.S. with 29,983,544 passenger boardings in 2012 – 0.7 percent increase over 2011.
CTA’s O’Hare International Airport service began in 1984, and the station is located in the lower level of Terminal 2.
Chicago is regularly selected to host meetings and conventions; it is ranked 3rd in the number of hotel rooms with 107,773 rooms located in 716 properties.
Hotels Near CTA Command Higher Rates
Chicago • Average Daily Room Rate
100
130
160
190
220
250
9/136/133/1312/129/126/123/1212/119/116/113/1112/109/106/103/1012/099/096/093/0912/089/086/083/0812/079/076/073/0712/069/066/063/06
$143.83
$200.27
$158.81
$116.59
NON-TRANSIT TRANSIT
Even “Meetings” Properties Gain Edge Near Transit
Chicago • Average Daily Room Rate LUXURY & UPPER UPSCALE PROPERTIES
100
130
160
190
220
250
9/136/133/1312/129/126/123/1212/119/116/113/1112/109/106/103/1012/099/096/093/0912/089/086/083/0812/079/076/073/0712/069/066/063/06
$204.16
$167.41
$162.19
$211.39
NON-TRANSIT TRANSIT
A NEW PARTERSHIP: RAIL TRANSIT AND CONVENTION GROWTH 11
RAIL CITIES
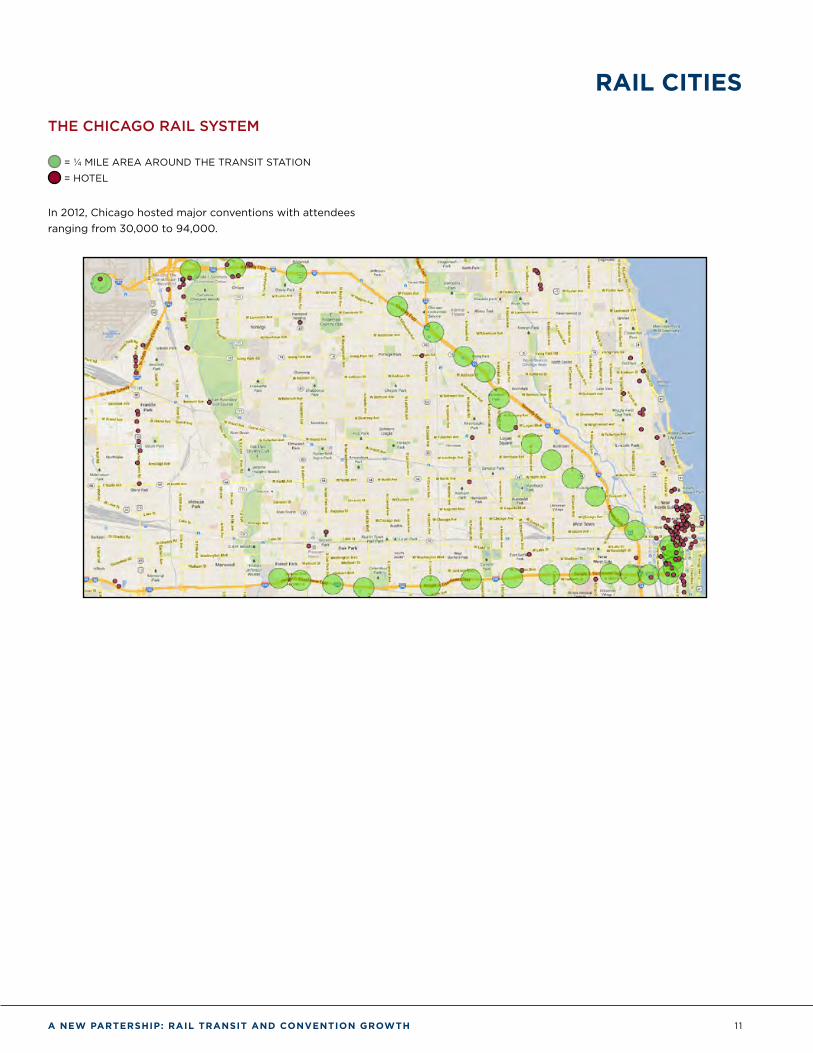
THE CHICAGO RAIL SYSTEM
= ¼ MILE AREA AROUND THE TRANSIT STATION
= HOTEL
In 2012, Chicago hosted major conventions with attendees ranging from 30,000 to 94,000.
12 A NEW PARTERSHIP: RAIL TRANSIT AND CONVENTION GROWTH
RAIL CITIES
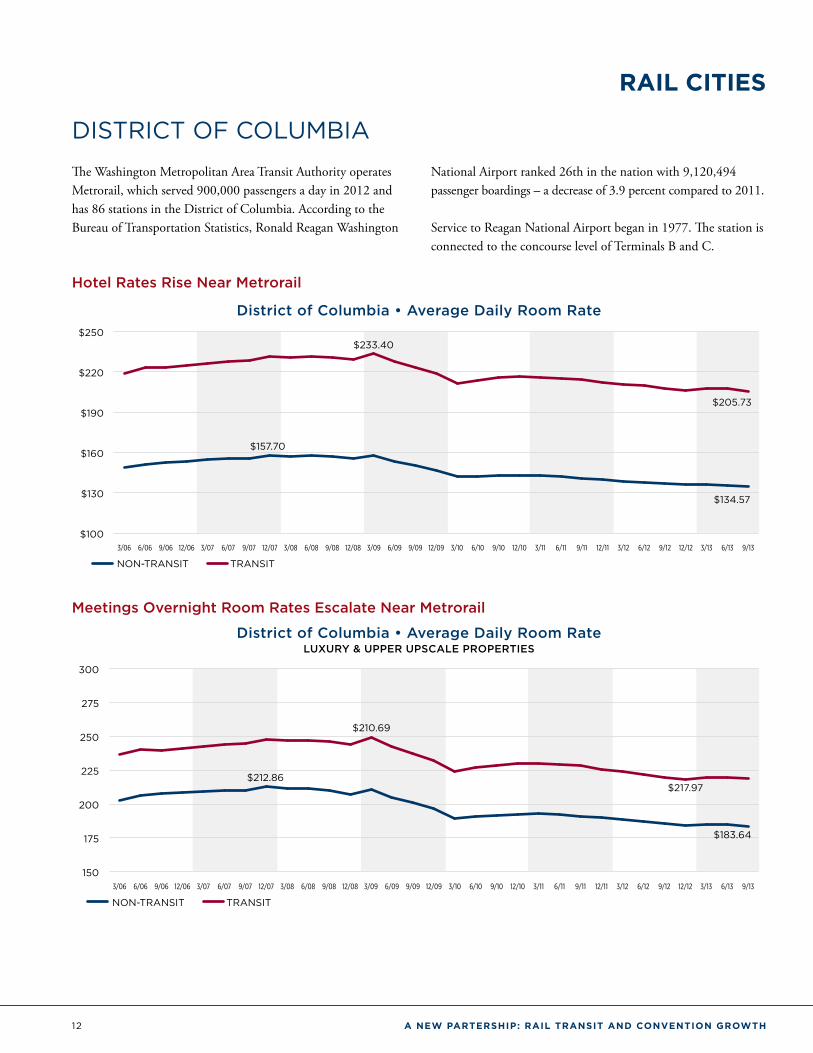
DISTRICT OF COLUMBIA
The Washington Metropolitan Area Transit Authority operates Metrorail, which served 900,000 passengers a day in 2012 and has 86 stations in the District of Columbia. According to the Bureau of Transportation Statistics, Ronald Reagan Washington
National Airport ranked 26th in the nation with 9,120,494 passenger boardings – a decrease of 3.9 percent compared to 2011.
Service to Reagan National Airport began in 1977. The station is connected to the concourse level of Terminals B and C.
Hotel Rates Rise Near Metrorail
District of Columbia • Average Daily Room Rate
$100
$130
$160
$190
$220
$250
9/136/133/1312/129/126/123/1212/119/116/113/1112/109/106/103/1012/099/096/093/0912/089/086/083/0812/079/076/073/0712/069/066/063/06
$233.40
$205.73
$134.57
$157.70
NON-TRANSIT TRANSIT
Meetings Overnight Room Rates Escalate Near Metrorail
District of Columbia • Average Daily Room Rate LUXURY & UPPER UPSCALE PROPERTIES
150
175
200
225
250
275
300
9/136/133/1312/129/126/123/1212/119/116/113/1112/109/106/103/1012/099/096/093/0912/089/086/083/0812/079/076/073/0712/069/066/063/06
$183.64
$217.97
$210.69
$212.86
NON-TRANSIT TRANSIT
A NEW PARTERSHIP: RAIL TRANSIT AND CONVENTION GROWTH 13
RAIL CITIES
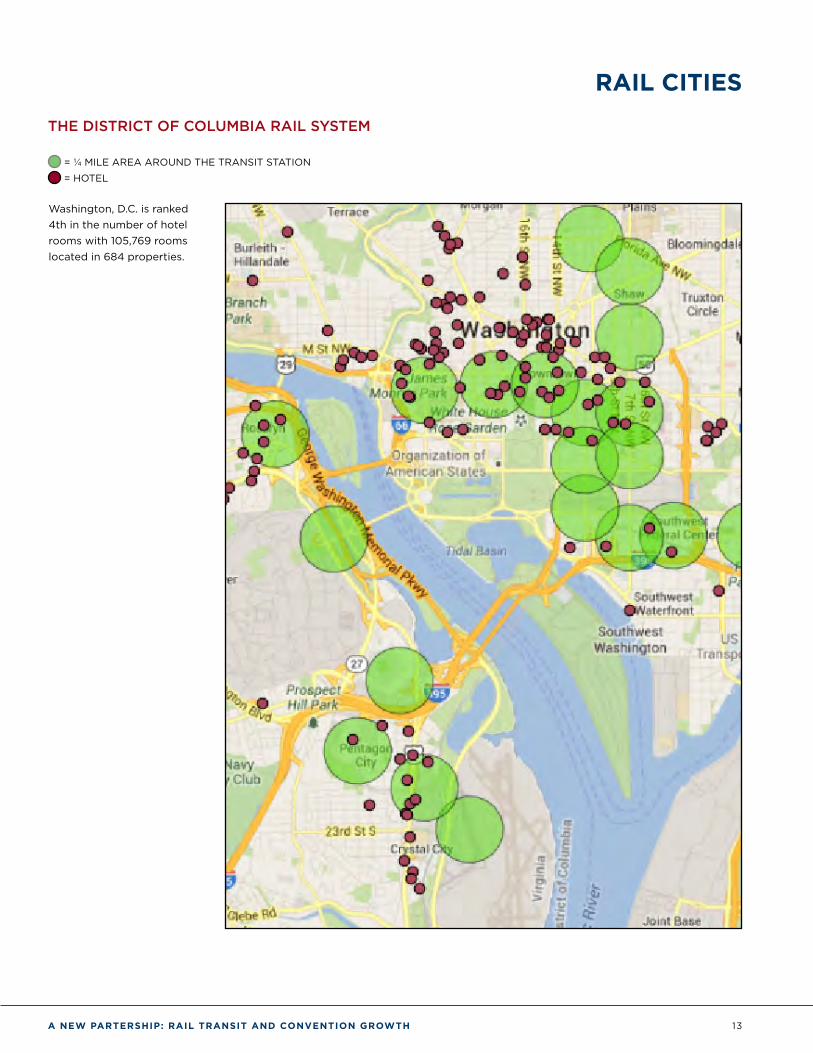
THE DISTRICT OF COLUMBIA RAIL SYSTEM
= ¼ MILE AREA AROUND THE TRANSIT STATION
= HOTEL
Washington, D.C. is ranked 4th in the number of hotel rooms with 105,769 rooms located in 684 properties.
14 A NEW PARTERSHIP: RAIL TRANSIT AND CONVENTION GROWTH
RAIL CITIES
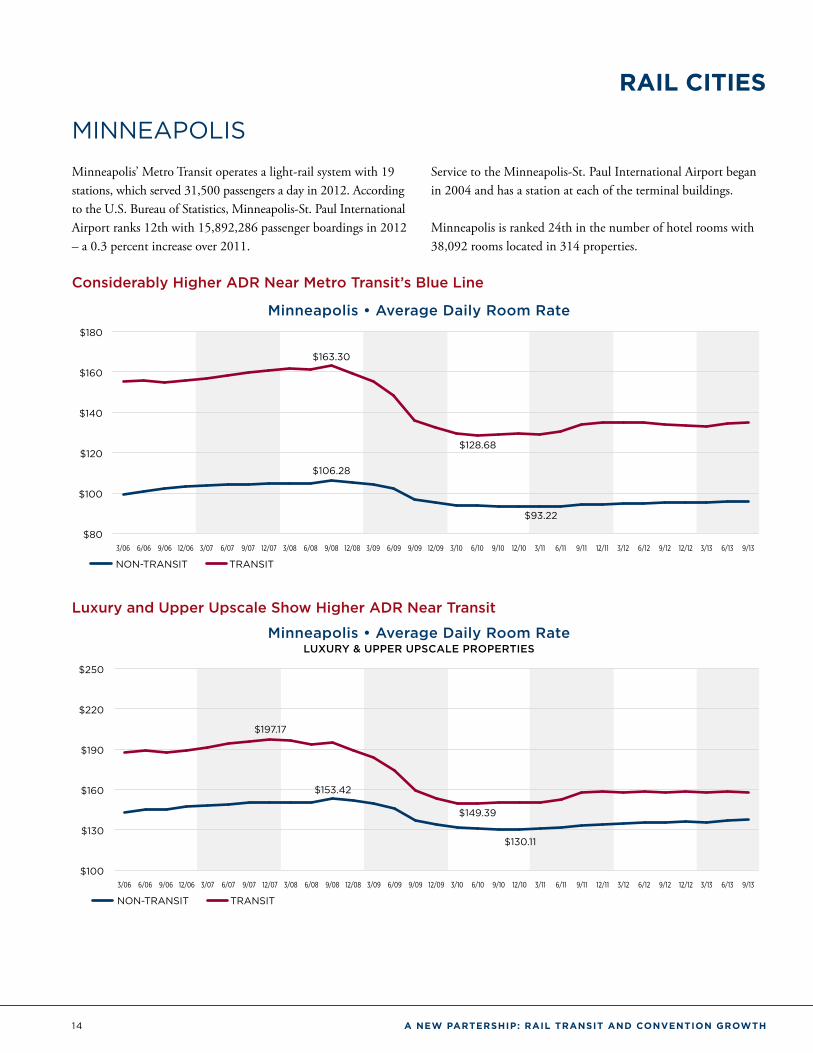
MINNEAPOLIS
Minneapolis’ Metro Transit operates a light-rail system with 19 stations, which served 31,500 passengers a day in 2012. According to the U.S. Bureau of Statistics, Minneapolis-St. Paul International Airport ranks 12th with 15,892,286 passenger boardings in 2012 – a 0.3 percent increase over 2011.
Service to the Minneapolis-St. Paul International Airport began in 2004 and has a station at each of the terminal buildings.
Minneapolis is ranked 24th in the number of hotel rooms with 38,092 rooms located in 314 properties.
Considerably Higher ADR Near Metro Transit’s Blue Line
Minneapolis • Average Daily Room Rate
$80
$100
$120
$140
$160
$180
9/136/133/1312/129/126/123/1212/119/116/113/1112/109/106/103/1012/099/096/093/0912/089/086/083/0812/079/076/073/0712/069/066/063/06
$163.30
$106.28
$93.22
$128.68
NON-TRANSIT TRANSIT
Luxury and Upper Upscale Show Higher ADR Near Transit
Minneapolis • Average Daily Room Rate LUXURY & UPPER UPSCALE PROPERTIES
$100
$130
$160
$190
$220
$250
9/136/133/1312/129/126/123/1212/119/116/113/1112/109/106/103/1012/099/096/093/0912/089/086/083/0812/079/076/073/0712/069/066/063/06
$197.17
$153.42
$130.11
$149.39
NON-TRANSIT TRANSIT
A NEW PARTERSHIP: RAIL TRANSIT AND CONVENTION GROWTH 15
RAIL CITIES
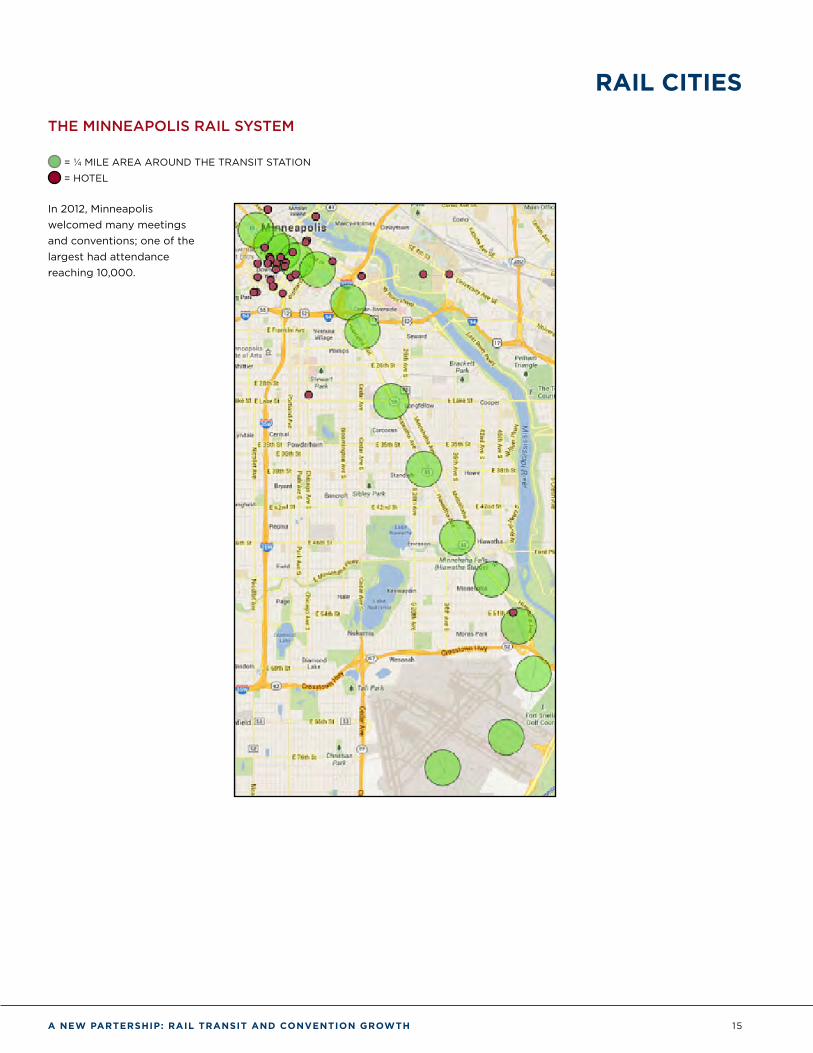
THE MINNEAPOLIS RAIL SYSTEM
= ¼ MILE AREA AROUND THE TRANSIT STATION
= HOTEL
In 2012, Minneapolis welcomed many meetings and conventions; one of the largest had attendance reaching 10,000.
16 A NEW PARTERSHIP: RAIL TRANSIT AND CONVENTION GROWTH
RAIL CITIES
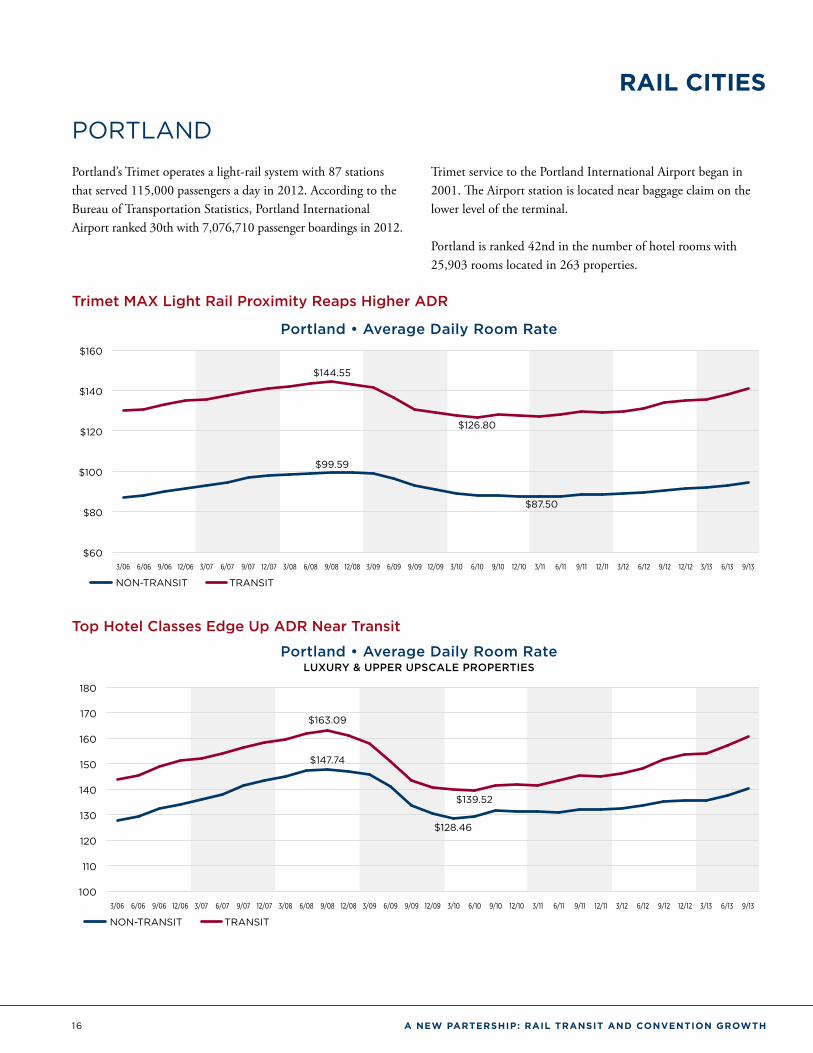
PORTLAND
Portland’s Trimet operates a light-rail system with 87 stations that served 115,000 passengers a day in 2012. According to the Bureau of Transportation Statistics, Portland International Airport ranked 30th with 7,076,710 passenger boardings in 2012.
Trimet service to the Portland International Airport began in 2001. The Airport station is located near baggage claim on the lower level of the terminal.
Portland is ranked 42nd in the number of hotel rooms with 25,903 rooms located in 263 properties.
Trimet MAX Light Rail Proximity Reaps Higher ADR
Portland • Average Daily Room Rate
$60
$80
$100
$120
$140
$160
9/136/133/1312/129/126/123/1212/119/116/113/1112/109/106/103/1012/099/096/093/0912/089/086/083/0812/079/076/073/0712/069/066/063/06
$126.80
$87.50
$144.55
$99.59
NON-TRANSIT TRANSIT
Top Hotel Classes Edge Up ADR Near Transit
Portland • Average Daily Room Rate LUXURY & UPPER UPSCALE PROPERTIES
100
110
120
130
140
150
160
170
180
9/136/133/1312/129/126/123/1212/119/116/113/1112/109/106/103/1012/099/096/093/0912/089/086/083/0812/079/076/073/0712/069/066/063/06
$128.46
$139.52
$163.09
$147.74
NON-TRANSIT TRANSIT
A NEW PARTERSHIP: RAIL TRANSIT AND CONVENTION GROWTH 17
RAIL CITIES
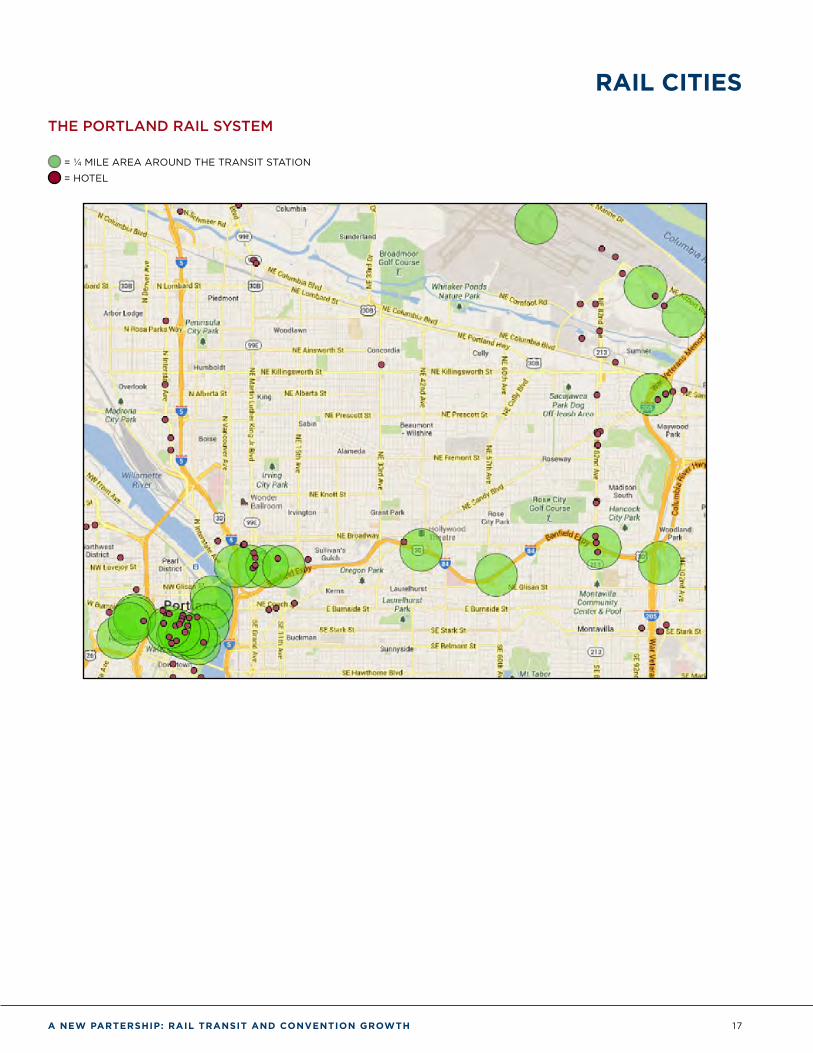
THE PORTLAND RAIL SYSTEM
= ¼ MILE AREA AROUND THE TRANSIT STATION
= HOTEL
18 A NEW PARTERSHIP: RAIL TRANSIT AND CONVENTION GROWTH
RAIL CITIES
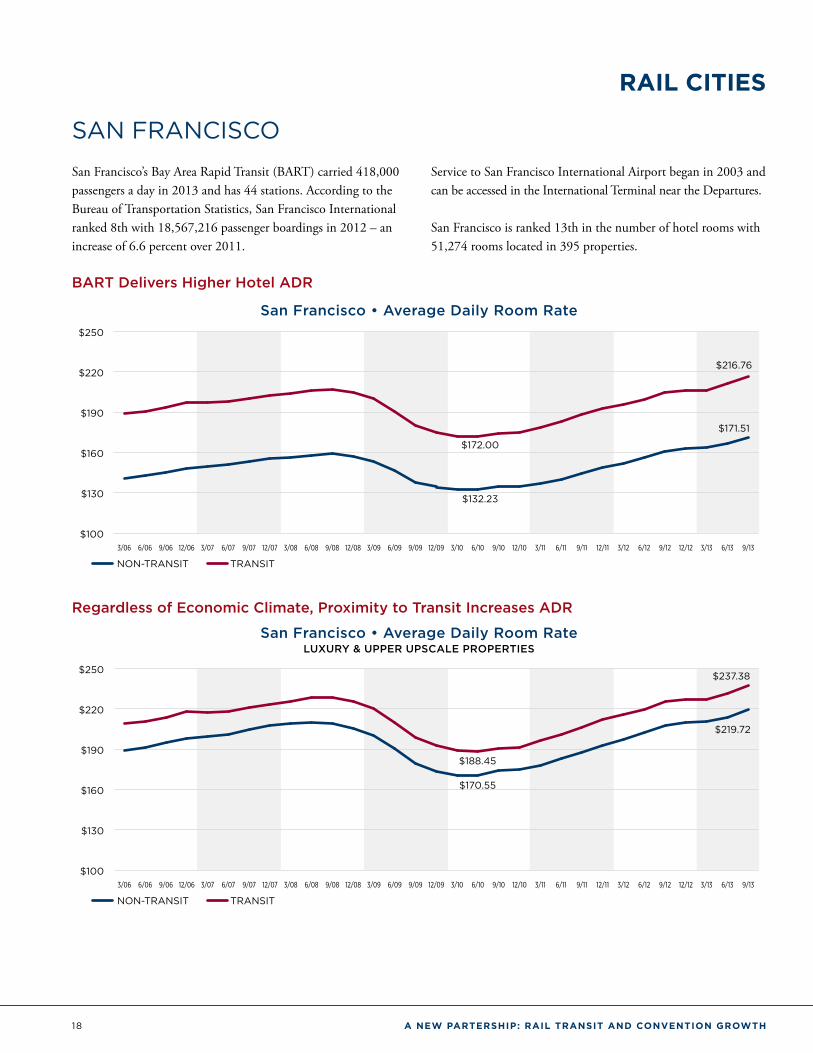
SAN FRANCISCO
San Francisco’s Bay Area Rapid Transit (BART) carried 418,000 passengers a day in 2013 and has 44 stations. According to the Bureau of Transportation Statistics, San Francisco International ranked 8th with 18,567,216 passenger boardings in 2012 – an increase of 6.6 percent over 2011.
Service to San Francisco International Airport began in 2003 and can be accessed in the International Terminal near the Departures.
San Francisco is ranked 13th in the number of hotel rooms with 51,274 rooms located in 395 properties.
BART Delivers Higher Hotel ADR
San Francisco • Average Daily Room Rate
$100
$130
$160
$190
$220
$250
9/136/133/1312/129/126/123/1212/119/116/113/1112/109/106/103/1012/099/096/093/0912/089/086/083/0812/079/076/073/0712/069/066/063/06
$171.51
$216.76
$172.00
$132.23
NON-TRANSIT TRANSIT
Regardless of Economic Climate, Proximity to Transit Increases ADR
San Francisco • Average Daily Room Rate LUXURY & UPPER UPSCALE PROPERTIES
$100
$130
$160
$190
$220
$250
9/136/133/1312/129/126/123/1212/119/116/113/1112/109/106/103/1012/099/096/093/0912/089/086/083/0812/079/076/073/0712/069/066/063/06
$237.38
$170.55
$188.45
$219.72
NON-TRANSIT TRANSIT
A NEW PARTERSHIP: RAIL TRANSIT AND CONVENTION GROWTH 19
RAIL CITIES
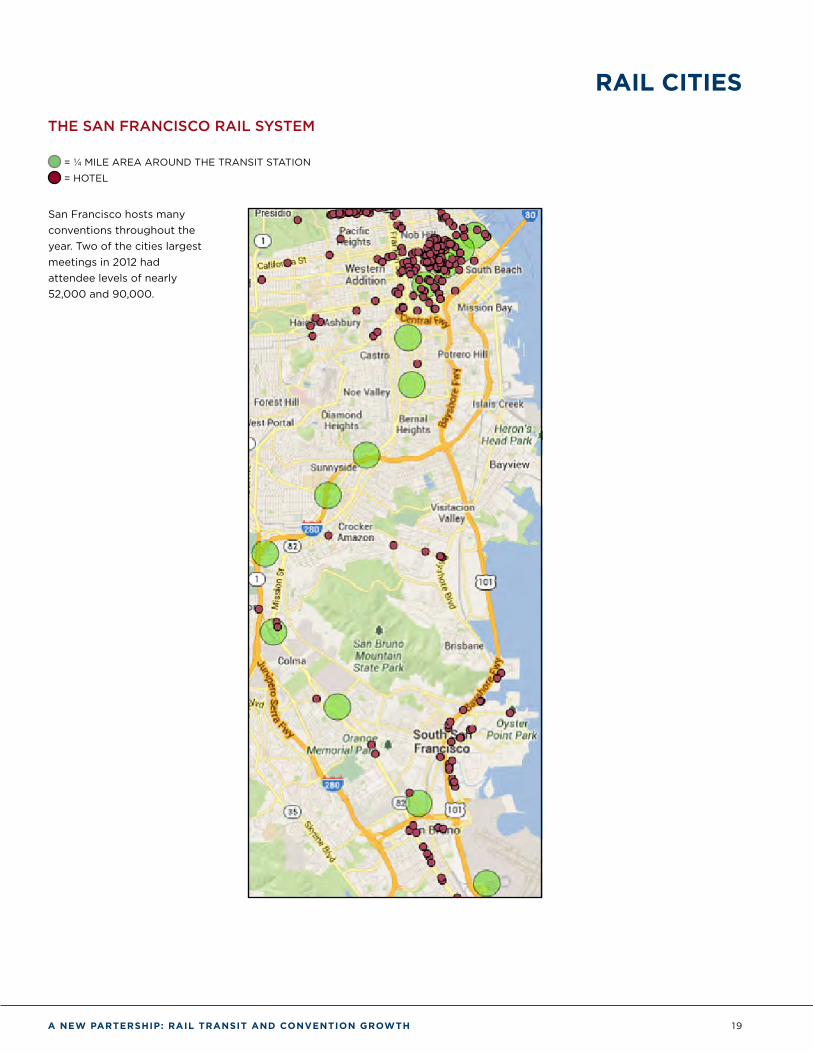
THE SAN FRANCISCO RAIL SYSTEM
= ¼ MILE AREA AROUND THE TRANSIT STATION
= HOTEL
San Francisco hosts many conventions throughout the year. Two of the cities largest meetings in 2012 had attendee levels of nearly 52,000 and 90,000.
20 A NEW PARTERSHIP: RAIL TRANSIT AND CONVENTION GROWTH
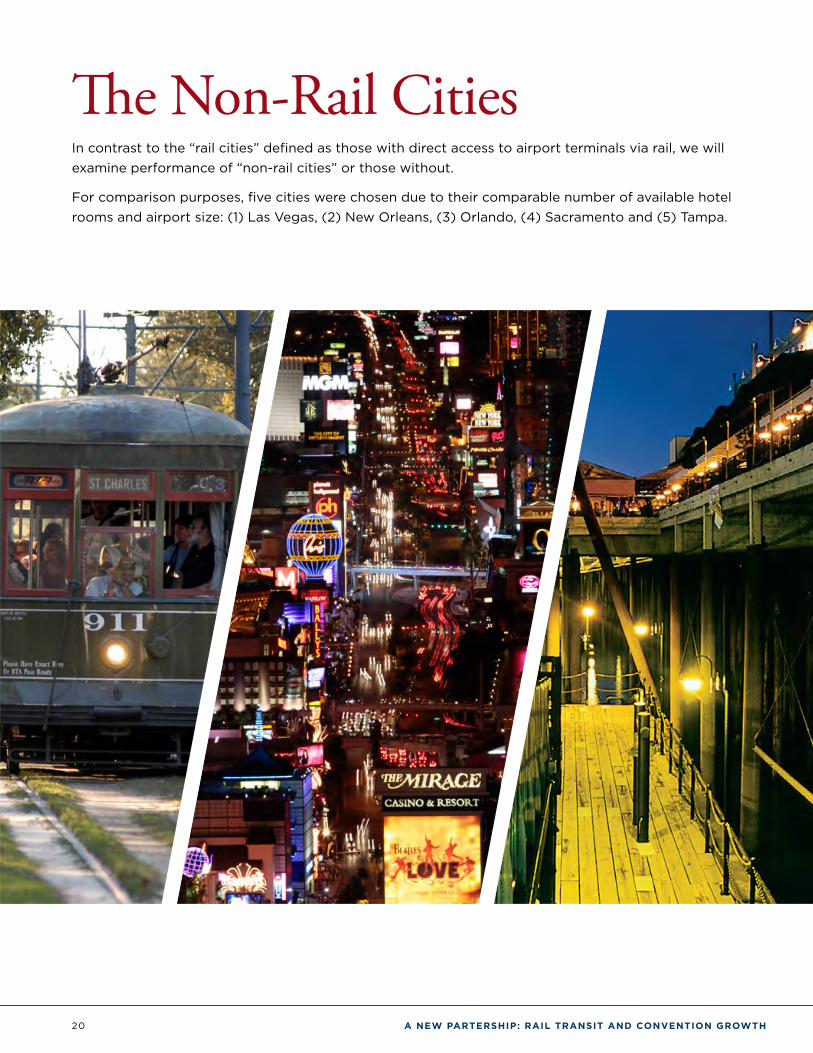
The Non-Rail CitiesIn contrast to the “rail cities” defined as those with direct access to airport terminals via rail, we will examine performance of “non-rail cities” or those without.
For comparison purposes, five cities were chosen due to their comparable number of available hotel rooms and airport size: (1) Las Vegas, (2) New Orleans, (3) Orlando, (4) Sacramento and (5) Tampa.
A NEW PARTERSHIP: RAIL TRANSIT AND CONVENTION GROWTH 21
THE NON-RAIL CITIES
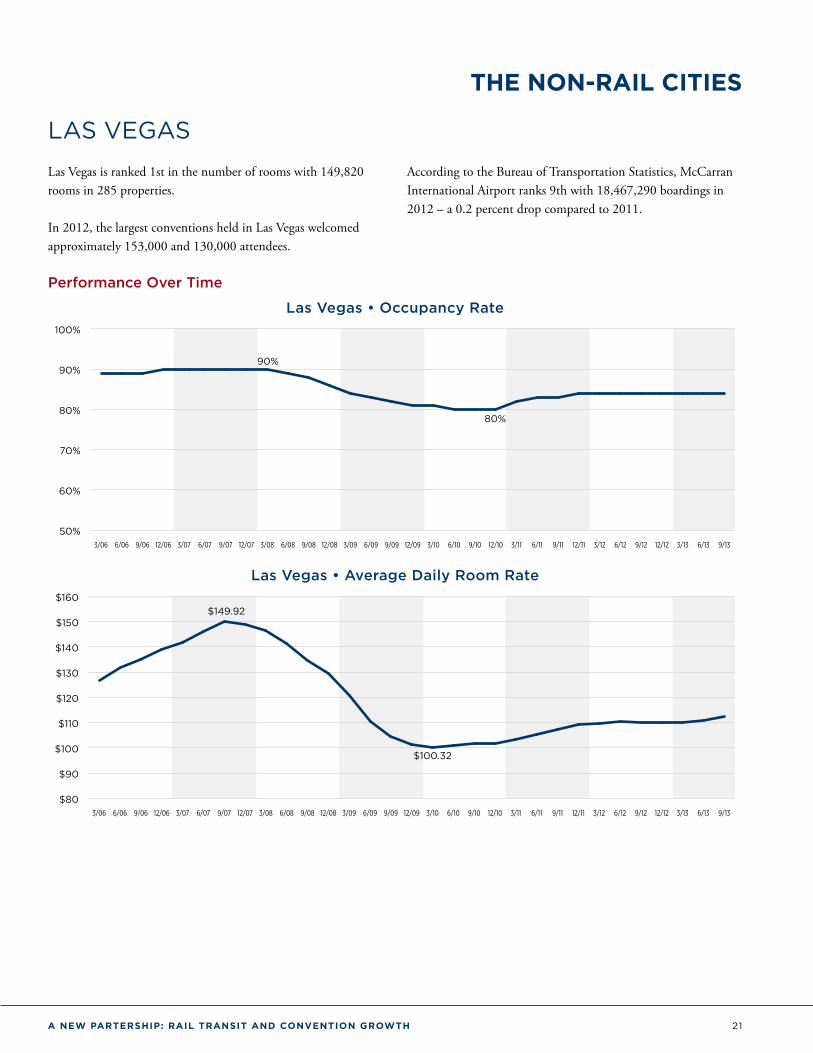
LAS VEGAS
Las Vegas is ranked 1st in the number of rooms with 149,820 rooms in 285 properties.
In 2012, the largest conventions held in Las Vegas welcomed approximately 153,000 and 130,000 attendees.
According to the Bureau of Transportation Statistics, McCarran International Airport ranks 9th with 18,467,290 boardings in 2012 – a 0.2 percent drop compared to 2011.
Performance Over Time
Las Vegas • Occupancy Rate
50%
60%
70%
80%
90%
100%
9/136/133/1312/129/126/123/1212/119/116/113/1112/109/106/103/1012/099/096/093/0912/089/086/083/0812/079/076/073/0712/069/066/063/06
80%
90%
Las Vegas • Average Daily Room Rate
$80
$90
$100
$110
$120
$130
$140
$150
$160
9/136/133/1312/129/126/123/1212/119/116/113/1112/109/106/103/1012/099/096/093/0912/089/086/083/0812/079/076/073/0712/069/066/063/06
$100.32
$149.92
22 A NEW PARTERSHIP: RAIL TRANSIT AND CONVENTION GROWTH
THE NON-RAIL CITIES
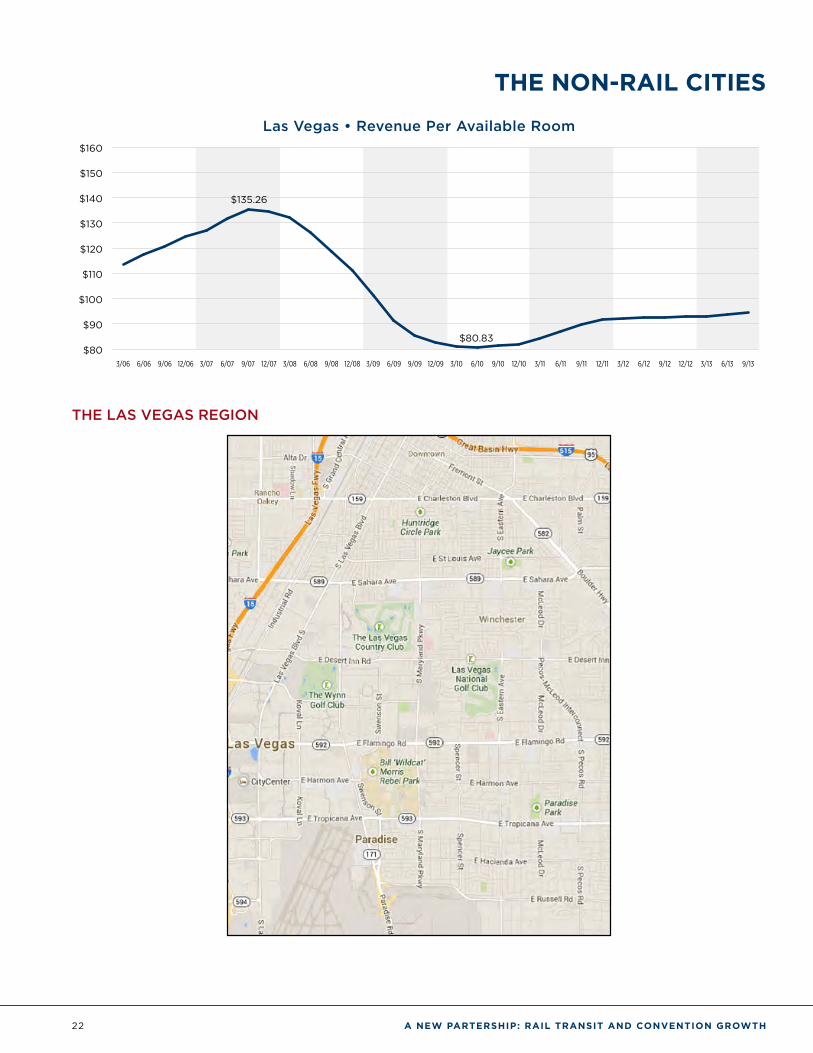
Las Vegas • Revenue Per Available Room
$80
$90
$100
$110
$120
$130
$140
$150
$160
9/136/133/1312/129/126/123/1212/119/116/113/1112/109/106/103/1012/099/096/093/0912/089/086/083/0812/079/076/073/0712/069/066/063/06
$80.83
$135.26
THE LAS VEGAS REGION
A NEW PARTERSHIP: RAIL TRANSIT AND CONVENTION GROWTH 23
THE NON-RAIL CITIES
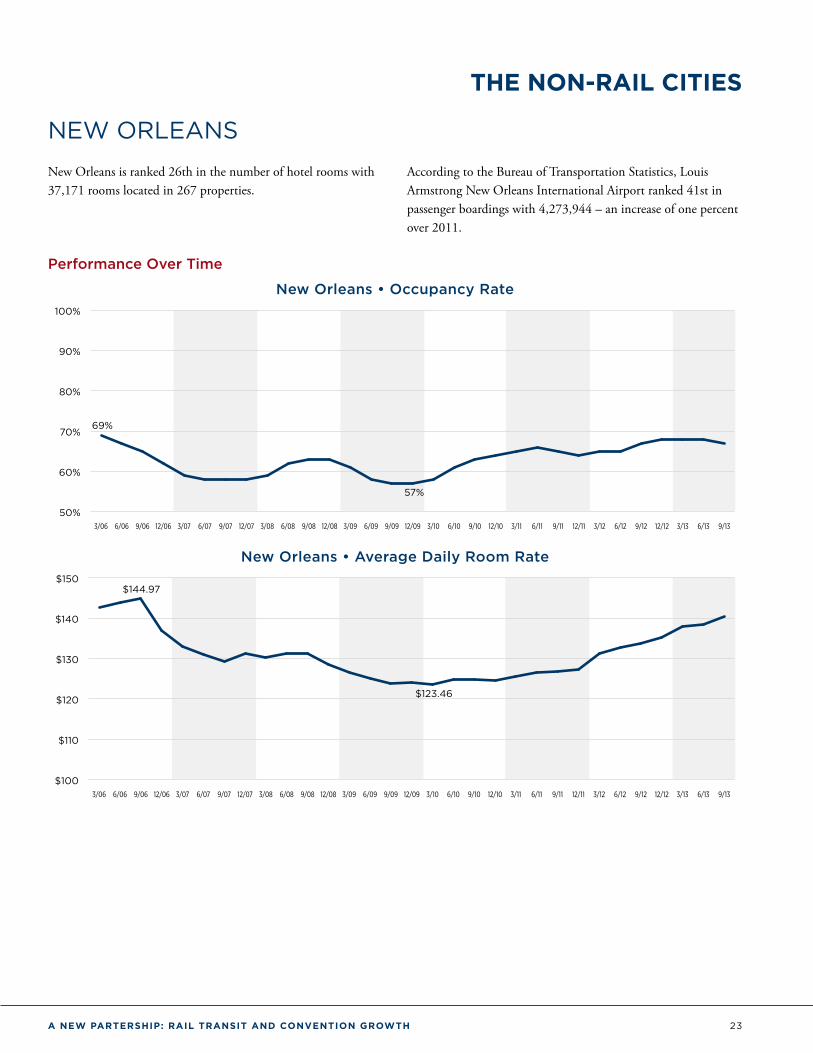
NEW ORLEANS
New Orleans is ranked 26th in the number of hotel rooms with 37,171 rooms located in 267 properties.
According to the Bureau of Transportation Statistics, Louis Armstrong New Orleans International Airport ranked 41st in passenger boardings with 4,273,944 – an increase of one percent over 2011.
Performance Over Time
New Orleans • Occupancy Rate
50%
60%
70%
80%
90%
100%
9/136/133/1312/129/126/123/1212/119/116/113/1112/109/106/103/1012/099/096/093/0912/089/086/083/0812/079/076/073/0712/069/066/063/06
57%
69%
New Orleans • Average Daily Room Rate
$100
$110
$120
$130
$140
$150
9/136/133/1312/129/126/123/1212/119/116/113/1112/109/106/103/1012/099/096/093/0912/089/086/083/0812/079/076/073/0712/069/066/063/06
$123.46
$144.97
24 A NEW PARTERSHIP: RAIL TRANSIT AND CONVENTION GROWTH
THE NON-RAIL CITIES
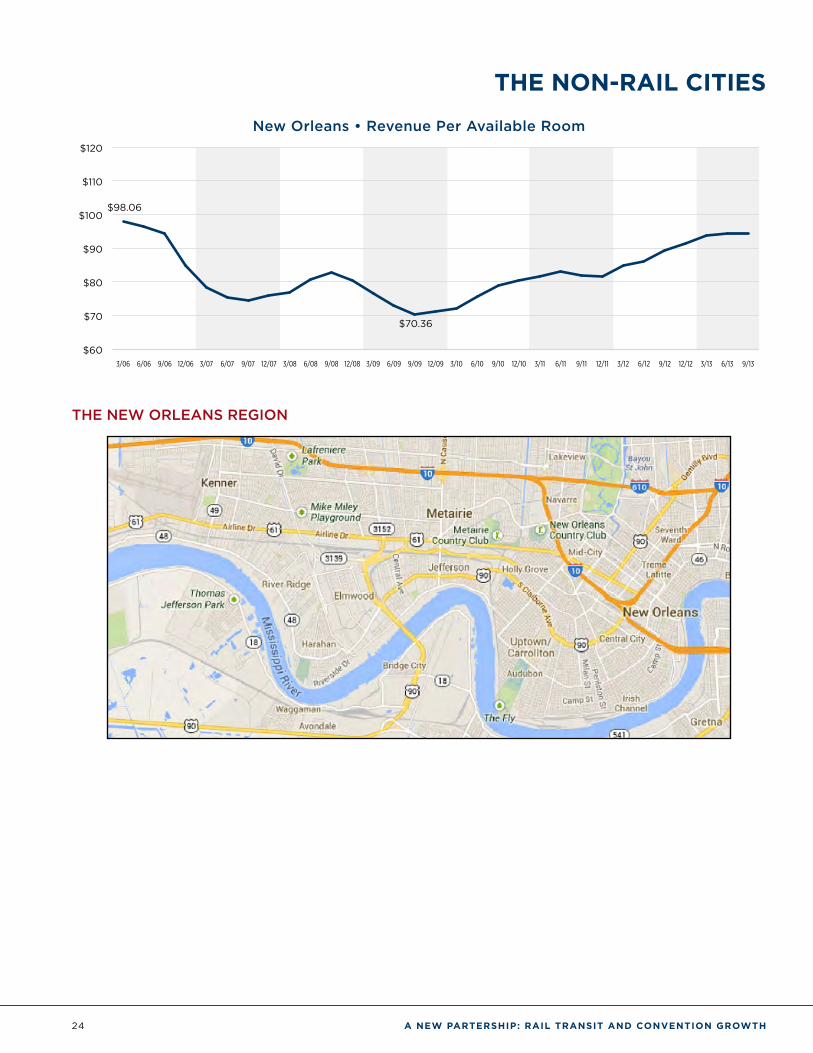
New Orleans • Revenue Per Available Room
$60
$70
$80
$90
$100
$110
$120
9/136/133/1312/129/126/123/1212/119/116/113/1112/109/106/103/1012/099/096/093/0912/089/086/083/0812/079/076/073/0712/069/066/063/06
$70.36
$98.06
THE NEW ORLEANS REGION
A NEW PARTERSHIP: RAIL TRANSIT AND CONVENTION GROWTH 25
THE NON-RAIL CITIES
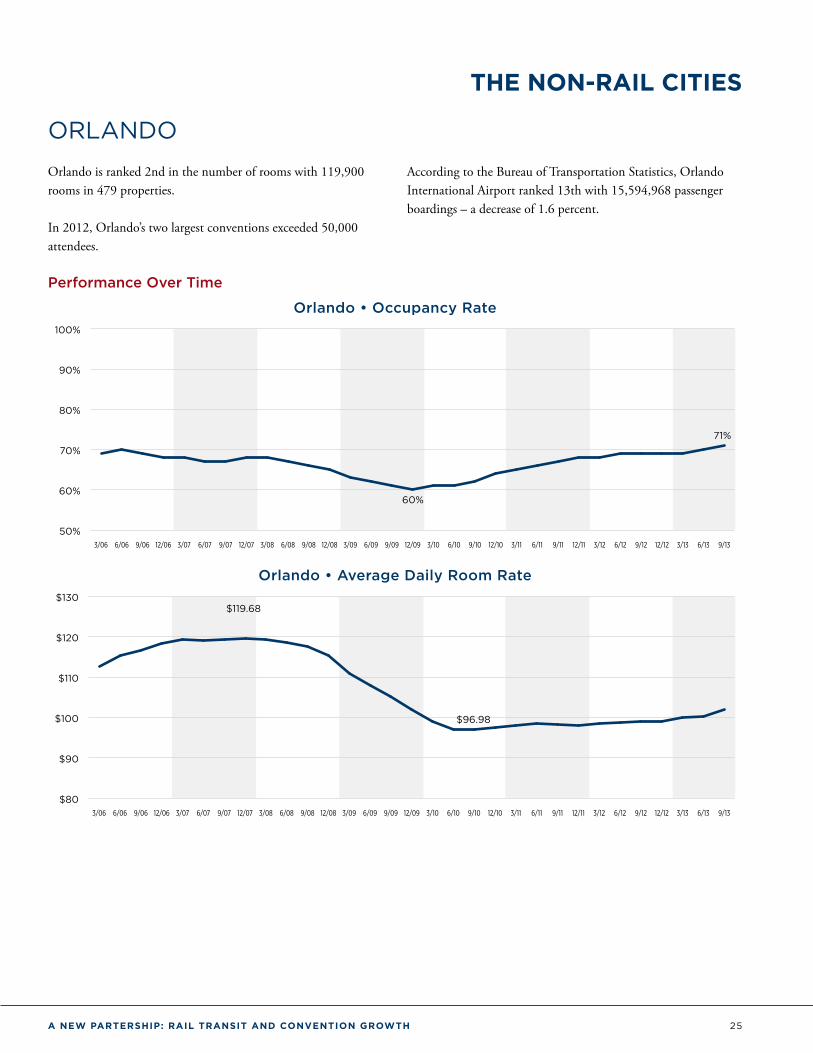
ORLANDO
Orlando is ranked 2nd in the number of rooms with 119,900 rooms in 479 properties.
In 2012, Orlando’s two largest conventions exceeded 50,000 attendees.
According to the Bureau of Transportation Statistics, Orlando International Airport ranked 13th with 15,594,968 passenger boardings – a decrease of 1.6 percent.
Performance Over Time
Orlando • Occupancy Rate
50%
60%
70%
80%
90%
100%
9/136/133/1312/129/126/123/1212/119/116/113/1112/109/106/103/1012/099/096/093/0912/089/086/083/0812/079/076/073/0712/069/066/063/06
60%
71%
Orlando • Average Daily Room Rate
$80
$90
$100
$110
$120
$130
9/136/133/1312/129/126/123/1212/119/116/113/1112/109/106/103/1012/099/096/093/0912/089/086/083/0812/079/076/073/0712/069/066/063/06
$96.98
$119.68
26 A NEW PARTERSHIP: RAIL TRANSIT AND CONVENTION GROWTH
THE NON-RAIL CITIES
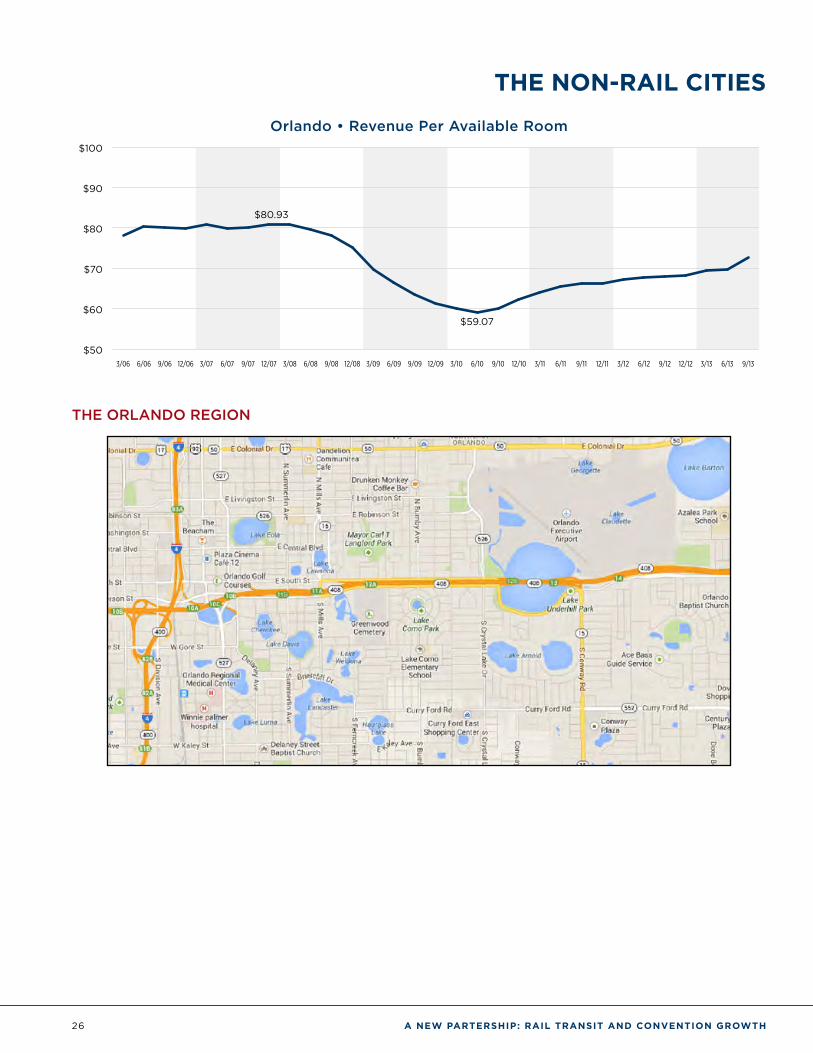
Orlando • Revenue Per Available Room
$50
$60
$70
$80
$90
$100
9/136/133/1312/129/126/123/1212/119/116/113/1112/109/106/103/1012/099/096/093/0912/089/086/083/0812/079/076/073/0712/069/066/063/06
$59.07
$80.93
THE ORLANDO REGION

A NEW PARTERSHIP: RAIL TRANSIT AND CONVENTION GROWTH 27
THE NON-RAIL CITIES
SACRAMENTO
Sacramento is ranked 43rd in the number of hotel rooms with 24,886 rooms located in 292 properties.
According to the Bureau of Transportation Statistics, Sacramento International Airport was ranked 38th with 4,326,178 passenger boardings – a decrease of 0.7 percent compared to 2011.
Performance Over Time
Sacramento • Occupancy Rate
50%
60%
70%
80%
90%
100%
9/136/133/1312/129/126/123/1212/119/116/113/1112/109/106/103/1012/099/096/093/0912/089/086/083/0812/079/076/073/0712/069/066/063/06
50%
64%
Sacramento • Average Daily Room Rate
$70
$80
$90
$100
$110
$120
9/136/133/1312/129/126/123/1212/119/116/113/1112/109/106/103/1012/099/096/093/0912/089/086/083/0812/079/076/073/0712/069/066/063/06
$90.89
$111.87
28 A NEW PARTERSHIP: RAIL TRANSIT AND CONVENTION GROWTH
THE NON-RAIL CITIES
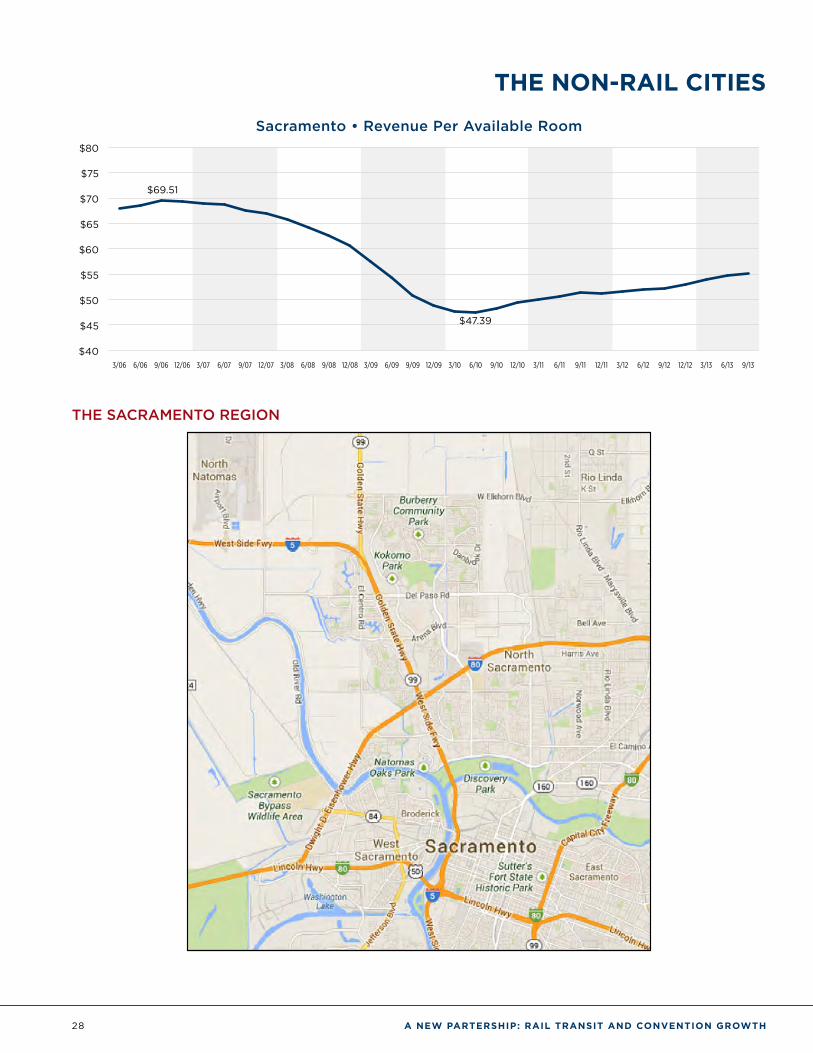
Sacramento • Revenue Per Available Room
$40
$45
$50
$55
$60
$65
$70
$75
$80
9/136/133/1312/129/126/123/1212/119/116/113/1112/109/106/103/1012/099/096/093/0912/089/086/083/0812/079/076/073/0712/069/066/063/06
$47.39
$69.51
THE SACRAMENTO REGION
A NEW PARTERSHIP: RAIL TRANSIT AND CONVENTION GROWTH 29
THE NON-RAIL CITIES
TAMPA
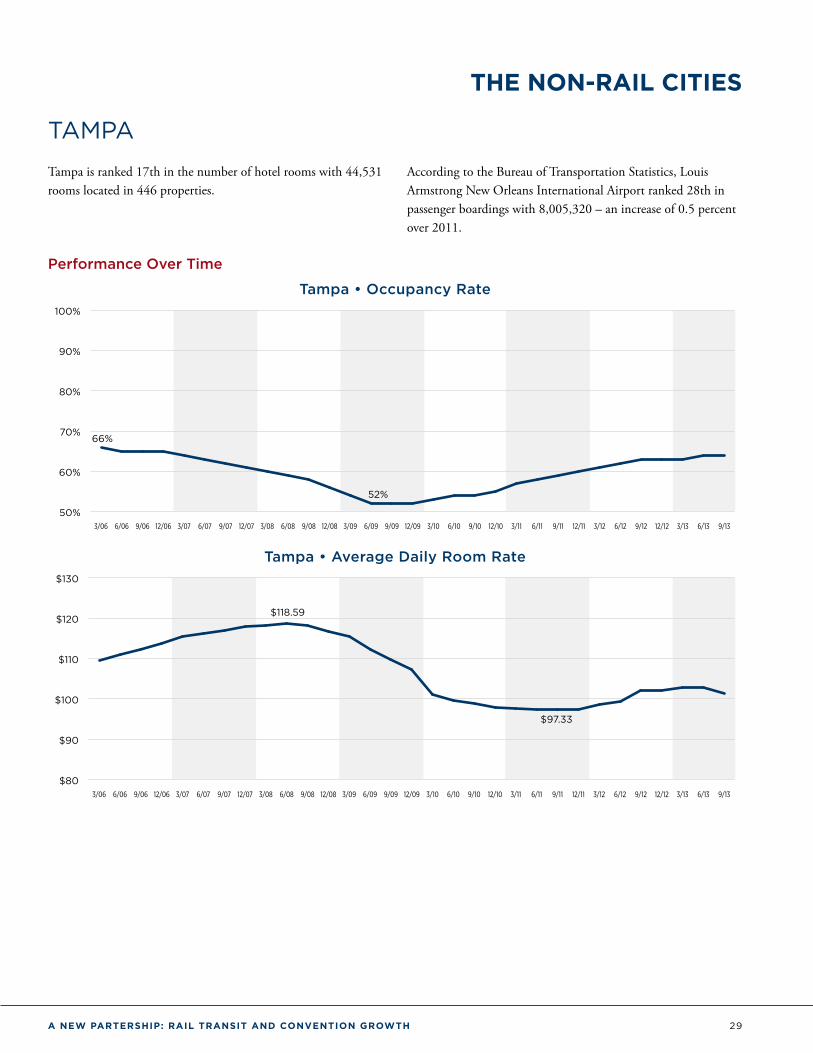
Tampa is ranked 17th in the number of hotel rooms with 44,531 rooms located in 446 properties.
According to the Bureau of Transportation Statistics, Louis Armstrong New Orleans International Airport ranked 28th in passenger boardings with 8,005,320 – an increase of 0.5 percent over 2011.
Performance Over Time
Tampa • Occupancy Rate
50%
60%
70%
80%
90%
100%
9/136/133/1312/129/126/123/1212/119/116/113/1112/109/106/103/1012/099/096/093/0912/089/086/083/0812/079/076/073/0712/069/066/063/06
52%
66%
Tampa • Average Daily Room Rate
$80
$90
$100
$110
$120
$130
9/136/133/1312/129/126/123/1212/119/116/113/1112/109/106/103/1012/099/096/093/0912/089/086/083/0812/079/076/073/0712/069/066/063/06
$97.33
$118.59
30 A NEW PARTERSHIP: RAIL TRANSIT AND CONVENTION GROWTH
THE NON-RAIL CITIES
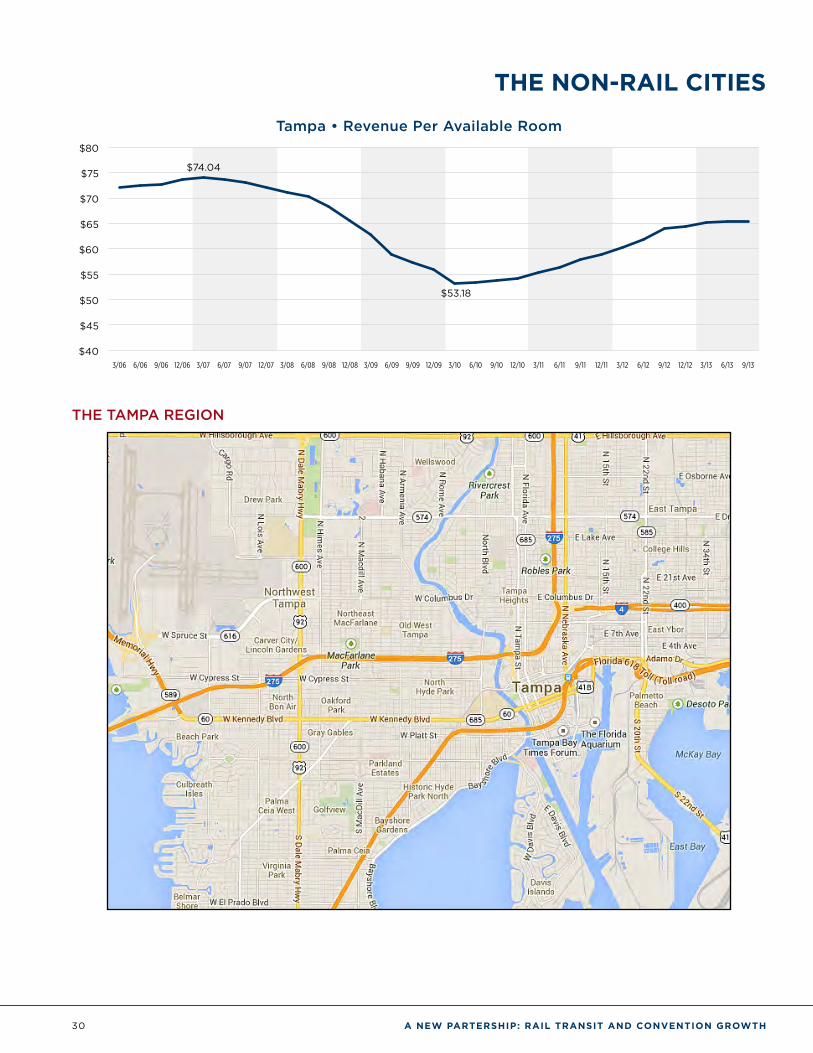
Tampa • Revenue Per Available Room
$40
$45
$50
$55
$60
$65
$70
$75
$80
9/136/133/1312/129/126/123/1212/119/116/113/1112/109/106/103/1012/099/096/093/0912/089/086/083/0812/079/076/073/0712/069/066/063/06
$53.18
$74.04
THE TAMPA REGION
A NEW PARTERSHIP: RAIL TRANSIT AND CONVENTION GROWTH 31
The TakeawayTRANSIT INFRASTRUCTURE MATTERS
Though a variety of factors can influence hotel average daily rates and revenue per available room, the preponderance of the evidence suggests a strong correlation between the performance of hotel properties and their perceived or actual proximity with regional amenities.
Rail connections to the airport terminal allow greater choice in how travelers interface with a region’s amenities, and this study shows that the availability of rail access to airport terminals can actually strengthen the attractiveness of destinations overall as well the performance of properties near rail stations – particularly when it comes to welcoming meeting and convention attendees.
In order for some of our nation’s great convention cities to be more competitive and to command higher rates for available
hotel rooms, as the rail cities have illustrated, transportation investments to interconnect these high-demand airports to the cities world-class amenities should be considered.
Federal, state and local policymakers should consider the economic benefits that intermodal connections bring to the lodging and travel industries when weighing the costs of future investments in intermodal connections. Smart spending in transportation infrastructure reaps benefits not only for the local city and state, but allow for the entire nation to remain globally competitive.

1100 New York Avenue, NW, Suite 450 Washington, D.C. 20005–3934 tel 202.408.8422 • ustravel.org
1666 K Street NW, 11th Floor Washington, DC 20006
tel 202.496.4800 • apta.com


