Page 1
1
A NEW SMART PROCESS
FOR
PIPELINE INTEGRITY MONITORING
by
Cosmas Chidozie Nwankwo Institute of Energy and Sustainable Development (IESD)
De Montfort University Leicester, England
11 May 2021
Page 2
2
DECLARATION
I can confirm that no material described in this thesis has been submitted
for the award of any other degree or qualification in any other university
or college of advanced education.
I can also confirm that any concept or diagram not explicitly
acknowledged in this thesis is an original personal work or are derived
as part of a non-confidential work for which I was a team member.
Cosmas Chidozie Nwankwo 11 May 2021
Page 3
3
ACKNOWLEDGEMENTS
I wish to acknowledge my dear wife Celina Ijeoma Nwankwo and our children: Uche; Ifeoma;
Chisom; Chukwudi and Chukwuemeka for their support and encouragement throughout this
research.
I am also greatly indebted to Dr Seng Chong and Dr Neil Brown for their steers and guidance as
project supervisors.
I am also indebted to Schlumberger UK Limited for their kind donation of PIPESIM simulation
software upon which this research was based.
Page 4
4
ABSTRACT
Most of the prospecting areas used for hydrocarbon exploitation in the Niger Delta were originally
virgin lands but has suffered urban encroachment such that any hydrocarbon loss of containment
would lead to pollution, loss of lives, major fires, and loss of major assets. Pipeline loss of
containment during petroleum evacuation were mainly due to corrosion but around the year 2000,
pipeline vandalism which started as a way of protesting lack of development projects by host
communities, rapidly grew into an industry for crude theft through hot tapping. The cost of crude
oil theft is estimated at £1bln per month and it is reported that some 1000 people have died due to
pipeline explosion in Nigeria within the period 2004 to 2014.
Several unsuccessful initiatives like amnesty and employment of repentant oil thieves by
government; burying originally surface pipelines, and regular helicopter surveillance overflies
along pipeline routes were attempted to arrest the pipeline vandalism environment. This research
is a new initiative in the fight against crude oil theft through a technical process that provide an
early information to the operator of the position and rate of crude oil theft such that the situation
could be appropriately arrested, thereby creating revenue security, preventing loss of containment
fires, and potential deaths that could have arisen if there is explosion due to loss of containment.
Two analytical methods, which uses the pipeline pressure gradient as a basis were independently
verified in leak point identification and leak rate estimation in the proposed smart process for
pipeline integrity monitoring. The leak point identification is based on pressure gradient relaxation
while the leak rate estimation is based on enclosed angle vector relaxation. A near perfect (100%)
accuracy in leak point determination and a 93.44% average leak rate prediction accuracy was
demonstrated based on the proposed smart process for pipeline integrity monitoring.
Page 5
5
Some of the advantages of this new process is simplicity, retrofit ability and no demand for skills
reassessment for operators as it fits into normal operations. The enclosed angle vector relaxation
concept, which is one of the main contributions of this research: is a new knowledge addition to
Physis and Fluid Mechanics; a discovery and a process invention.
Page 6
6
List of Abbreviations and Acronyms
Page 8
8
Contents DECLARATION ............................................................................................................................ 2 ACKNOWLEDGEMENTS ............................................................................................................ 3 Table of tables ............................................................................................................................... 13 1 INTRODUCTION ................................................................................................................ 14
1.1 Introduction ................................................................................................................... 14
1.2 Research motivation...................................................................................................... 21 1.3 Reflexivity, positionality and research mind map ........................................................ 23 1.4 Research Aims, Objectives and Impacts ....................................................................... 27
Research aims. .......................................................................................................... 27 Research objectives ................................................................................................... 28 Research impacts ...................................................................................................... 29
1.5 Thesis structure ............................................................................................................. 29
2 RESEARCH METHODOLOGY.......................................................................................... 39 2.1 Introduction ................................................................................................................... 39 2.2 Pathway to knowledge innovation ................................................................................ 39 2.3 Research method ........................................................................................................... 42
2.4 Research process ........................................................................................................... 50 Research hypothesis .................................................................................................. 50
Data based observation. ............................................................................................ 51
Confirmation of hypothesis....................................................................................... 53
3 LITERATURE REVIEW ..................................................................................................... 55 3.1 Introduction ................................................................................................................... 55
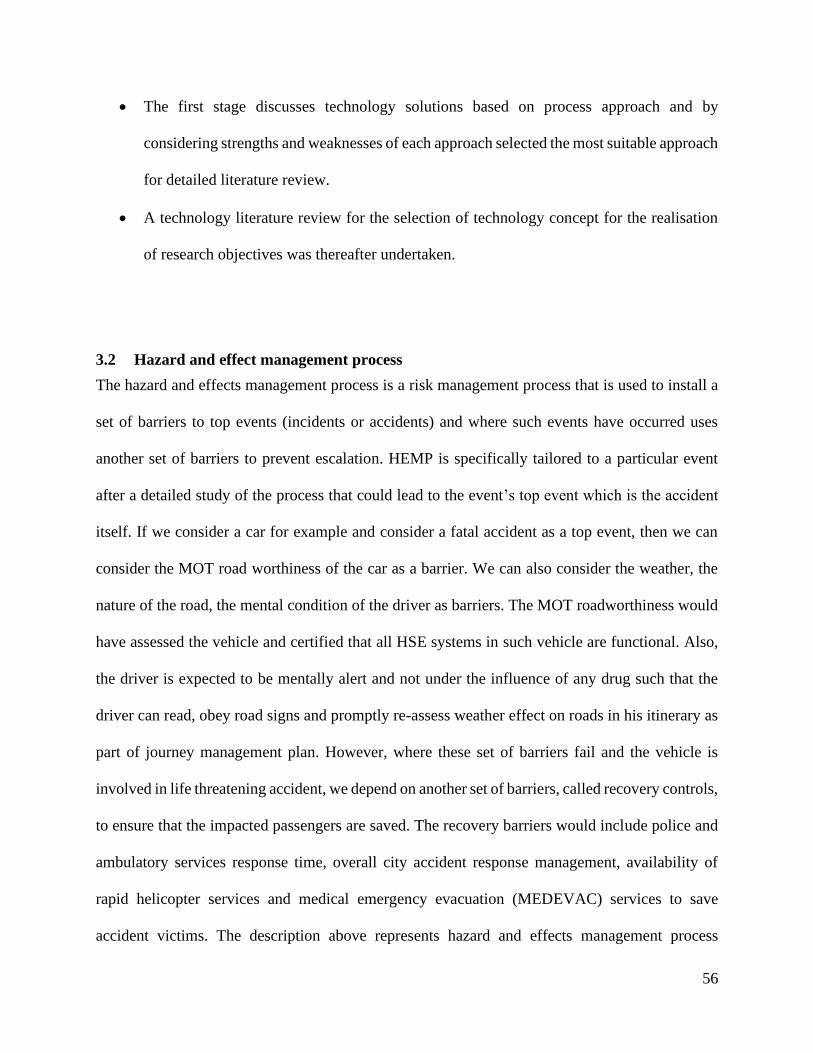
3.2 Hazard and effect management process ........................................................................ 56 3.3 Technology preselection review ................................................................................... 60
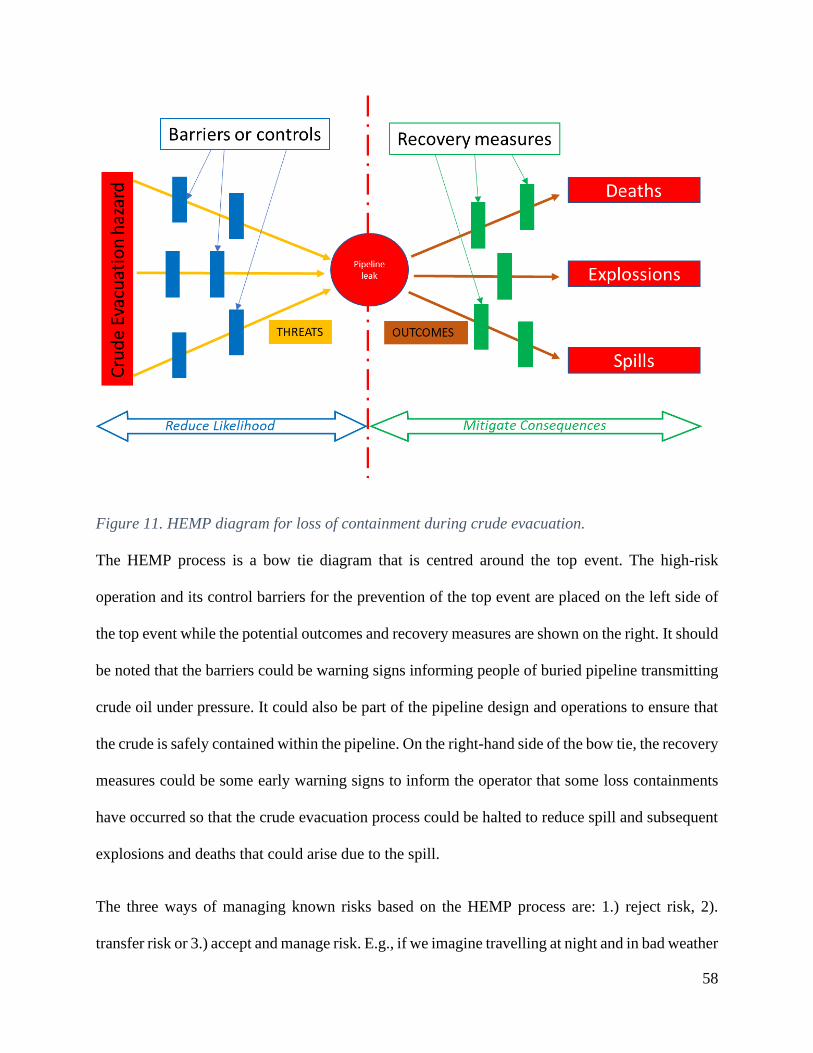
Incidental Observation .............................................................................................. 61
External sensor-based systems .................................................................................. 62 Internal sensor-based systems ................................................................................... 63
Summary of technology process review ................................................................... 64 3.4 Technology literature review ........................................................................................ 66
Fiscal reconciliation .................................................................................................. 66 Corrosion monitoring ................................................................................................ 68
Hydraulic flow simulation ........................................................................................ 71 Smart fields operation ............................................................................................... 76 Fibre optic sensing .................................................................................................... 80 Frequency response function modelling ................................................................... 82 Floating micro robots ................................................................................................ 91
3.5 Chapter summary .......................................................................................................... 94 4 TECHNOLOGY CONCEPT SELECTION ......................................................................... 97
4.1 Introduction ................................................................................................................... 97 4.2 Technology concept selection report ............................................................................ 97
4.3 Smart fields operations synopsis ................................................................................. 101 4.4 Chapter summary ........................................................................................................ 103
5 SMART PIPELINE INTEGRITY MONITORING REQUIREMENT .............................. 104
5.1 Introduction ................................................................................................................. 104 5.2 Digital Twining concept ............................................................................................. 109
Page 9
9
5.3 Solution pathfinder mind map .................................................................................... 112 5.4 Post leak data diagnostic method ................................................................................ 116
5.5 Pre-leak data prognostic method ................................................................................. 118 Causal reasoning ..................................................................................................... 119 Neural Network ....................................................................................................... 122
5.6 Machine Learning ....................................................................................................... 132 5.7 Chapter summary ........................................................................................................ 134
6 DATA ACQUISITION STRATEGY ................................................................................. 136 6.1 Introduction ................................................................................................................. 136 6.2 Design of Experiments ................................................................................................ 137
Basis for design ....................................................................................................... 138 Simulation setup and strategy ................................................................................. 138 Simulation software ................................................................................................ 139 Pipesim solver software .......................................................................................... 140
6.3 Chapter summary ........................................................................................................ 144
7 PIPELINE SECTIONAL LEAK EXPERIMENTS ............................................................ 145
7.1 Introduction ................................................................................................................. 145 7.2 Basis for simulation setup ........................................................................................... 145 7.3 Single sectional leak experiment ................................................................................ 149
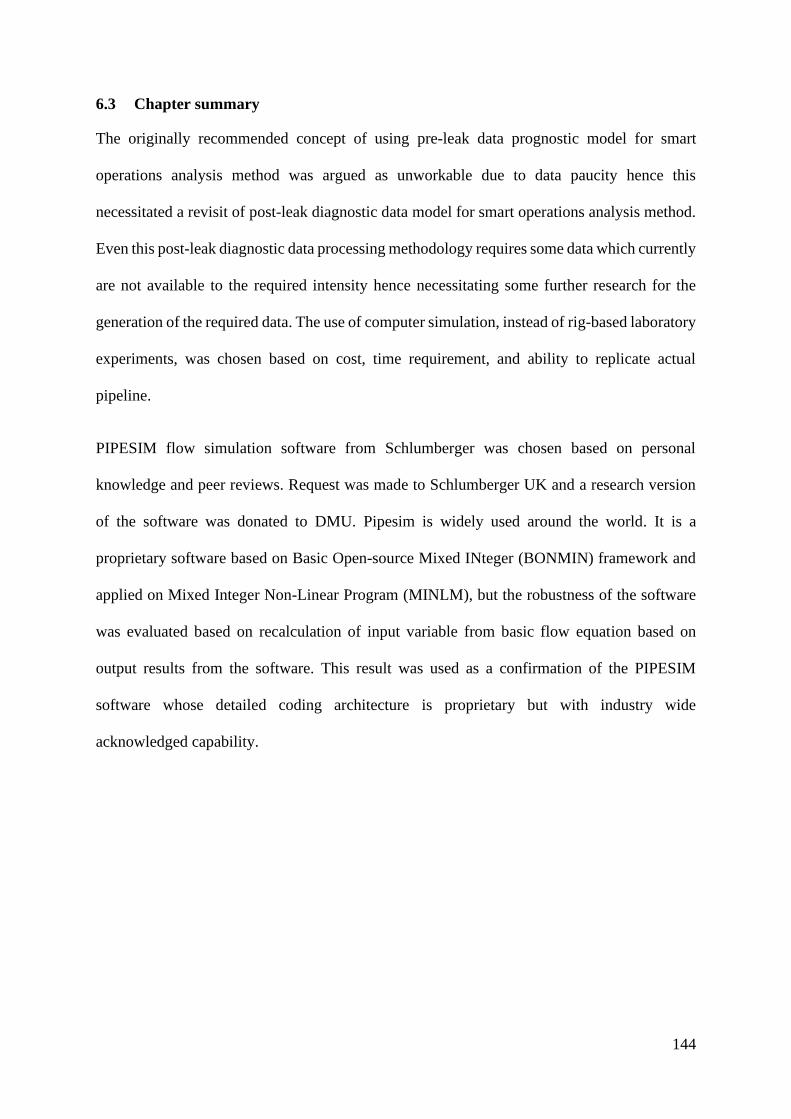
7.4 Simulation result discussion ....................................................................................... 151
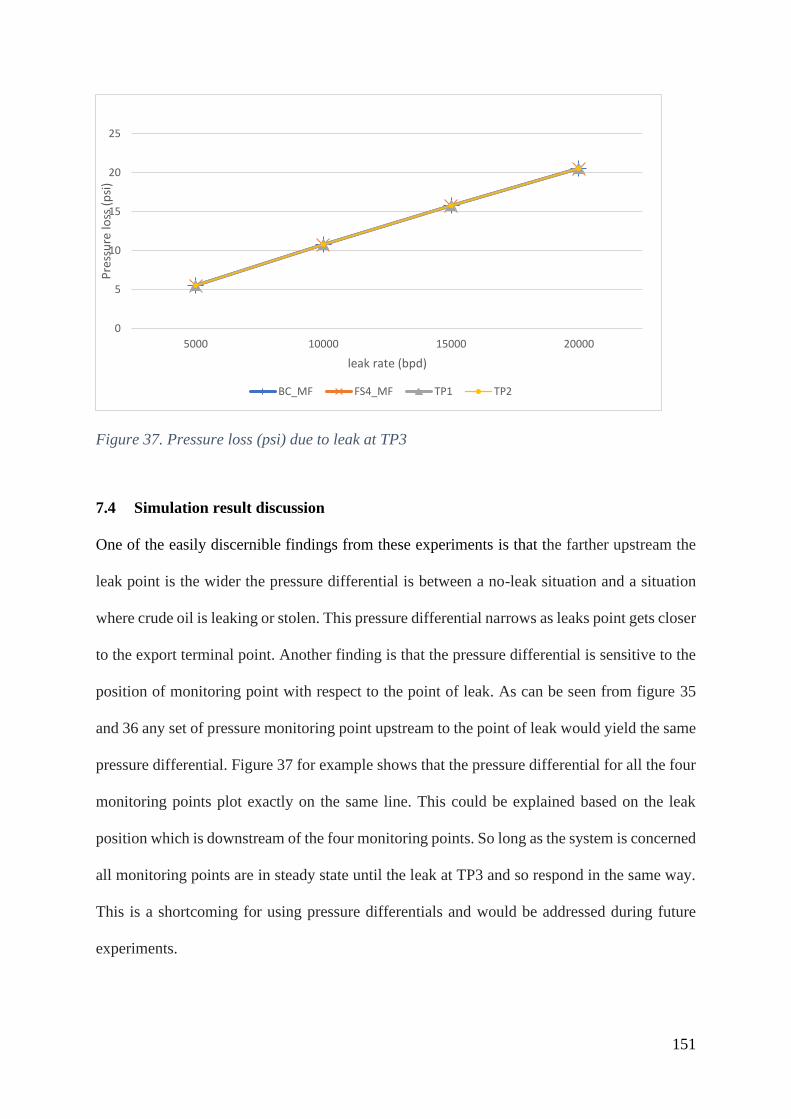
7.5 Predicting leak using pressure differential .................................................................. 153 7.6 Discussion ................................................................................................................... 155 7.7 Chapter summary ........................................................................................................ 156
8 BASIS FOR USE OF PRESSURE GRADIENTS IN LEAK EXPERIMENTS ................ 158 8.1 Introduction ................................................................................................................. 158
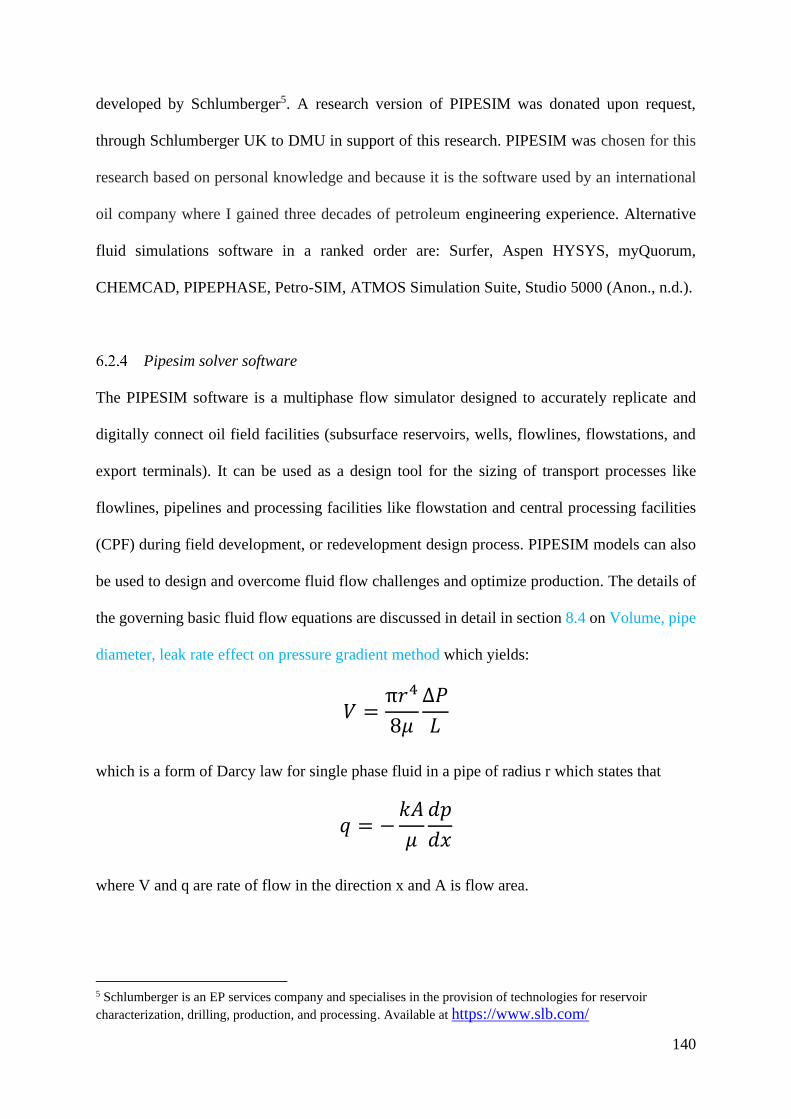
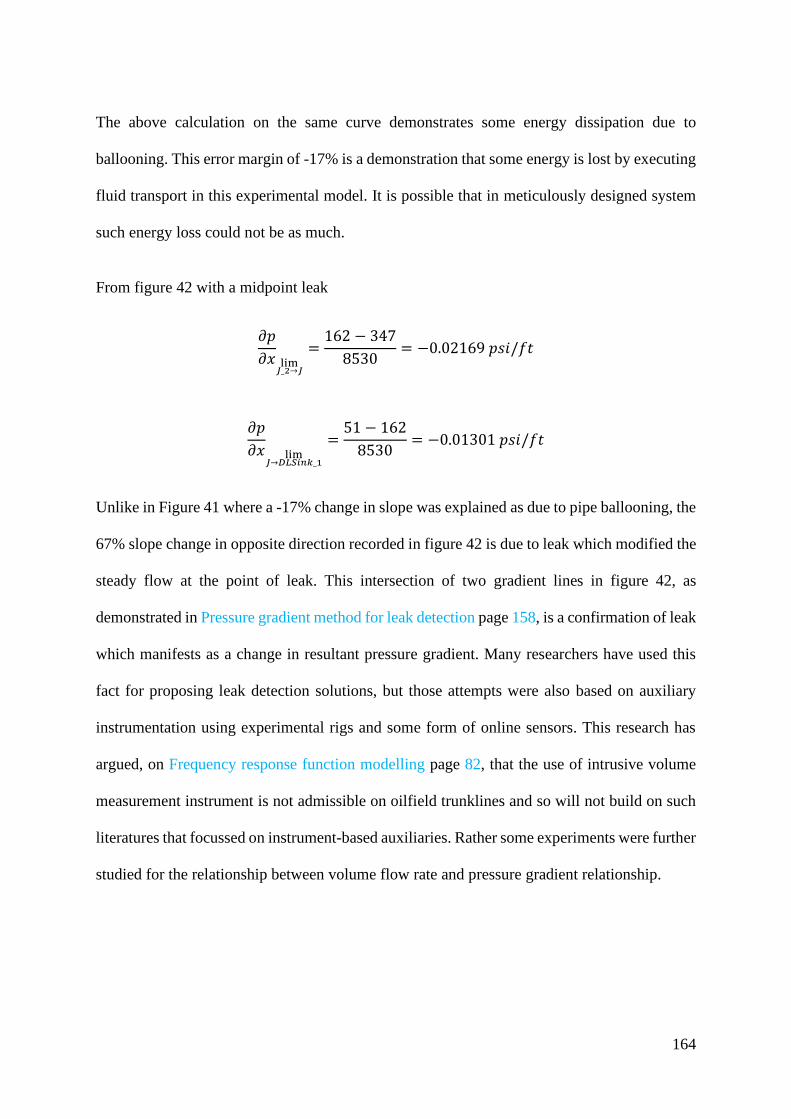
8.2 Pressure gradient method for leak detection ............................................................... 158 8.3 Single leak investigation at single point using pressure gradient method. ................. 160 8.4 Volume, pipe diameter, leak rate effect on pressure gradient method ........................ 165
Experimental setup and results ............................................................................... 165 Pressure gradient response to volume ..................................................................... 166
Discussions ............................................................................................................. 167
8.5 Pressure gradient relationship to volume flow rate..................................................... 167 8.6 Chapter summary ........................................................................................................ 172
9 MULTIPLE LEAK INVESTIGATION & NEW PROCESS IMPLEMENTATION ........ 173 9.1 Introduction ................................................................................................................. 173 9.2 Gradient intersection method for leak point detection ................................................ 174 9.3 Pressure gradient vector analysis ................................................................................ 176 9.4 Pressure gradient relaxation method for leak rate estimation ..................................... 178
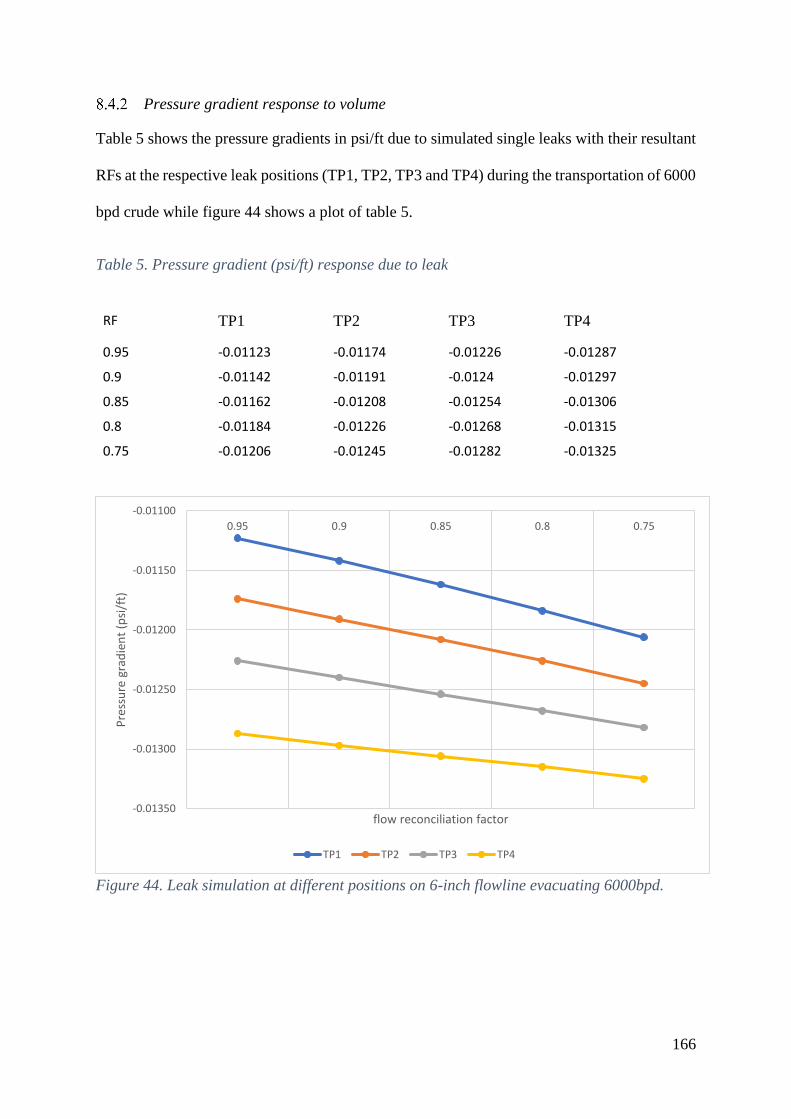
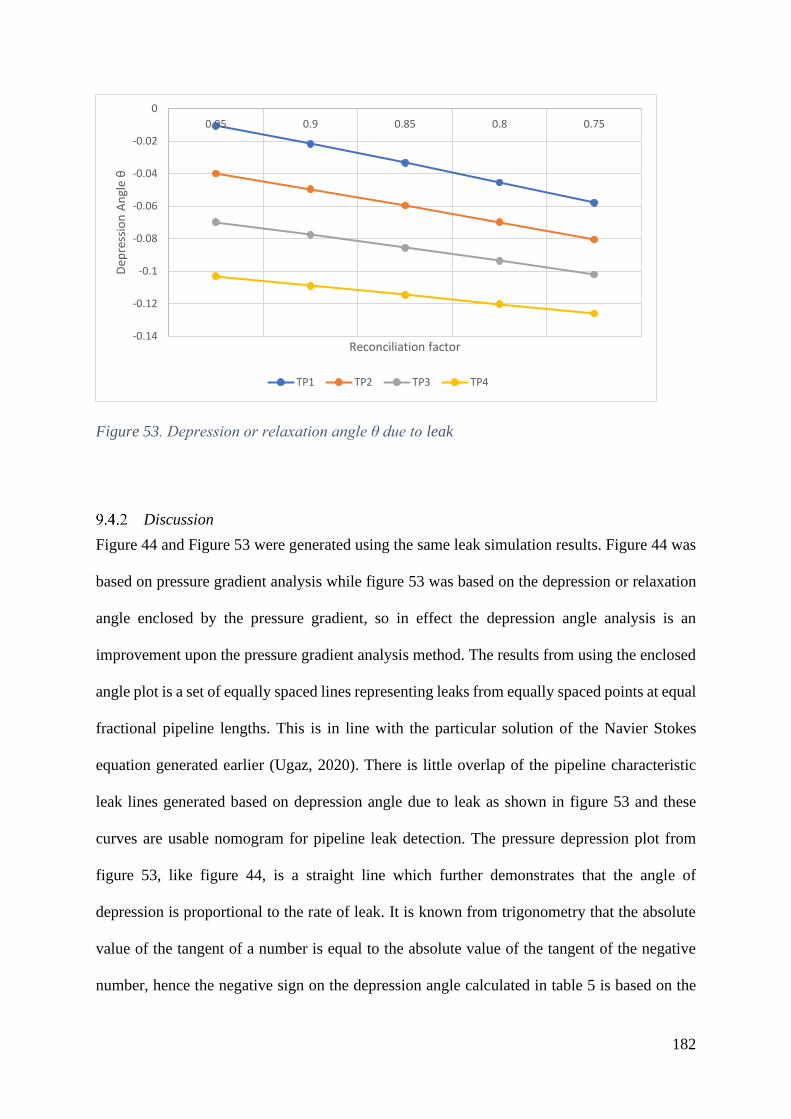
Setup and data generation methodology ................................................................. 178 Discussion ............................................................................................................... 182
9.5 Leak rate determination in multi-leak situation .......................................................... 184
Leak rate determination in multi-leak situation using PGR method....................... 184 Leak rate determination in multi-leak situation using EAVR method. .................. 190
9.6 Implementation of proposed post-leak data diagnostic leak detection method. ......... 194 Uncertainty management and reduction of leak signal variability ......................... 195
Digital Twining in pipeline fluid evacuation process ............................................. 199
Page 10
10
Pipeline digital information data acquisition system .............................................. 201 Smart process for pipeline integrity monitoring ..................................................... 203
9.7 Chapter summary ........................................................................................................ 204 10 ADDITIONAL TESTING OF EAVR METHOD FOR LEAK OR INFLOW RATE
ESTIMATION ............................................................................................................................ 208 10.1 Introduction ................................................................................................................. 208 10.2 Well inflow and choke performance prediction using EAVR. ................................... 208
10.3 Reservoir pressure effect on well production using EAVR. ....................................... 212 10.4 Chapter summary ........................................................................................................ 214
11 CONCLUSIONS AND RECOMENDATIONS ................................................................. 215
11.1 Proposed smart process for pipeline integrity monitoring. ......................................... 215 11.2 Discussion ................................................................................................................... 220 11.3 Conditions for the application of proposed new smart process .................................. 225 11.4 New process for pipeline integrity monitoring ........................................................... 227
Data acquisition strategy ..................................................................................... 229
Data baselining.................................................................................................... 230
Leak point(s) determination ................................................................................ 230 Leak rate determination ...................................................................................... 231
11.5 New process novelty ................................................................................................... 231
11.6 Chapter summary ........................................................................................................ 233
11.7 Further research .......................................................................................................... 235 11.8 APPENDIX I. Particular solution to Navier Stokes equation (Ugaz, 2020) .............. 237
12 REFERENCES ................................................................................................................... 240
Page 11
11
Table of figures
Figure 1. Pipeline ROW encroachment site (The Guardian 2005) ............................................... 15
Figure 2. Downstream trunkline map of Nigeria (Aluko, 2015) .................................................. 17 Figure 3. Niger delta upstream trunkline map of Nigeria (Analysis 2017) .................................. 18
Figure 4. Hot tapping equipment and tools(Google 2016) ........................................................... 20 Figure 5. Loss of containment fire from illegal tapping point (Anon 2016) ................................ 23 Figure 6. Research mind map ....................................................................................................... 26 Figure 7. Innovation Venn diagram (The framework bank, 2016) ............................................... 41 Figure 8. Epistemology and learning theories (University College Dublin, 2020) ...................... 44
Figure 9. Deductive Vs Inductive reasoning (OutRespectiveWriting, 2019) ............................... 48
Figure 10. Research process ......................................................................................................... 50 Figure 11. HEMP diagram for loss of containment during crude evacuation. ............................. 58 Figure 12. Leak detection taxonomy (Henrie et al, 2017) ............................................................ 61
Figure 13. Corrosion monitoring probe schematics (Alabama Specialty Products, 2020) ........... 70
Figure 14. A typical onshore network from reservoirs up to the gathering stations (Corken, n.d.)
....................................................................................................................................................... 73 Figure 15. Simulated hydrocarbon flow network ......................................................................... 74
Figure 16. Matched performance and forecast from simulated flow network. ............................. 75 Figure 17. Smart well design and components ............................................................................. 78
Figure 18. ABAQUS simulated offshore structure and its response to water wave (Nwankwo, C.,
2013). ............................................................................................................................................ 83 Figure 19. DRF of simulated offshore structure (Nwankwo, C., 2013) ....................................... 84
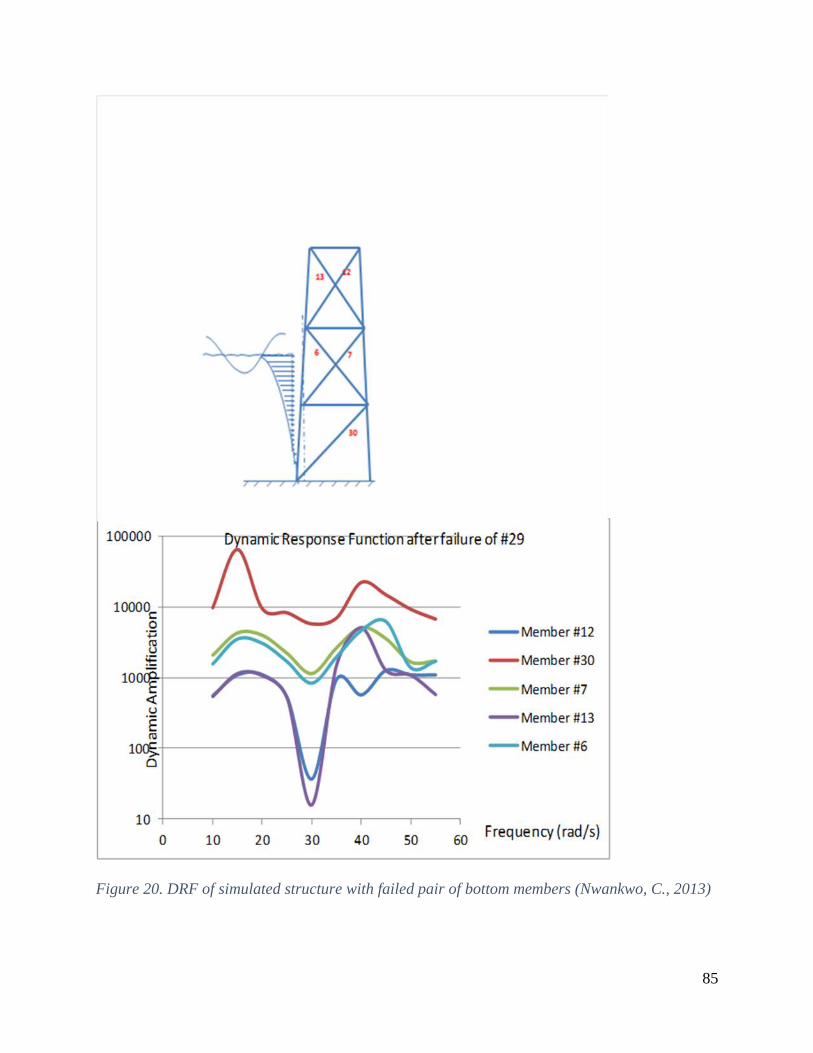
Figure 20. DRF of simulated structure with failed pair of bottom members (Nwankwo, C., 2013)
....................................................................................................................................................... 85
Figure 21. Temperature and acoustic logs acquired during leak investigation in a gas well. ...... 87
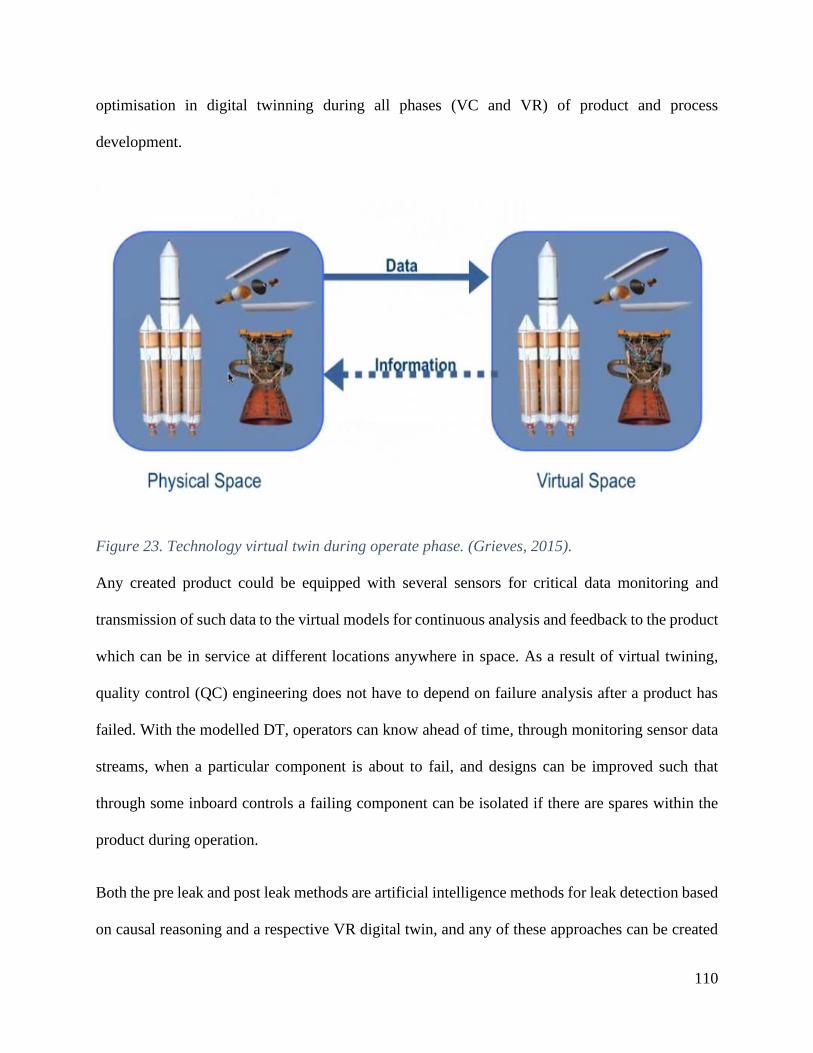
Figure 22. Smart fields operations technology progression path. ............................................... 102 Figure 23. Technology virtual twin during operate phase. (Grieves, 2015). .............................. 110 Figure 24. Digital twin sophistication levels (Russell, 2019). .................................................... 111
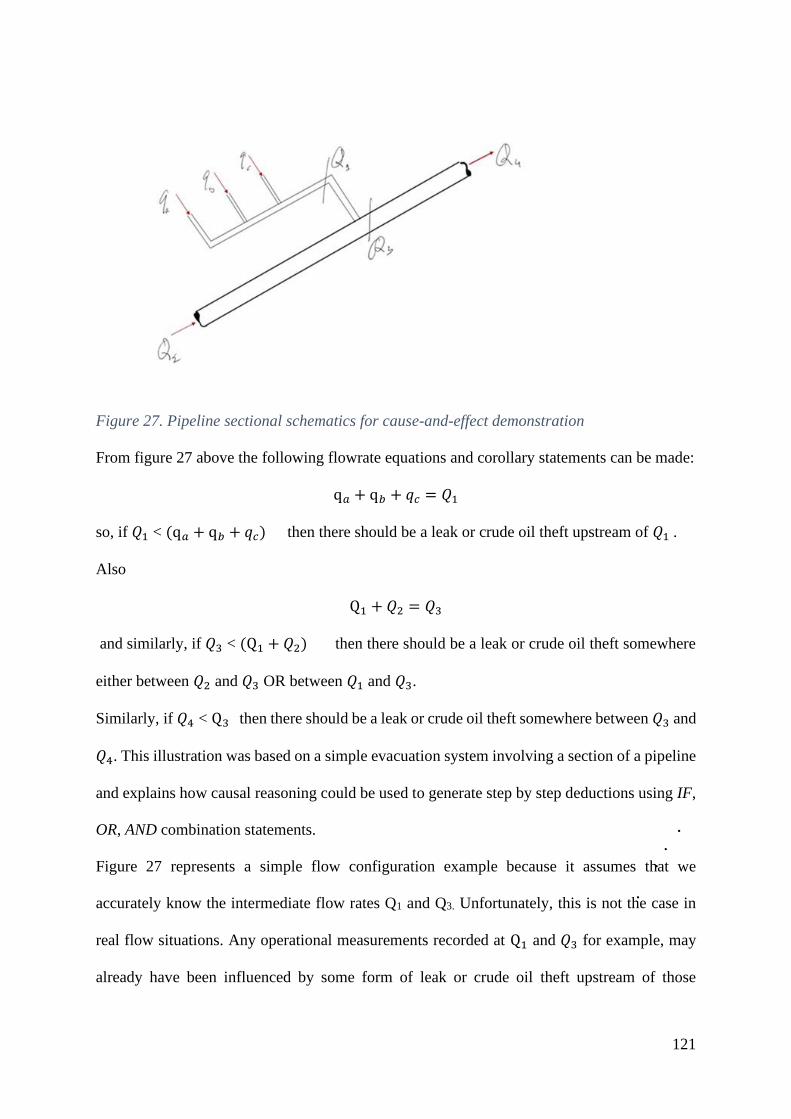
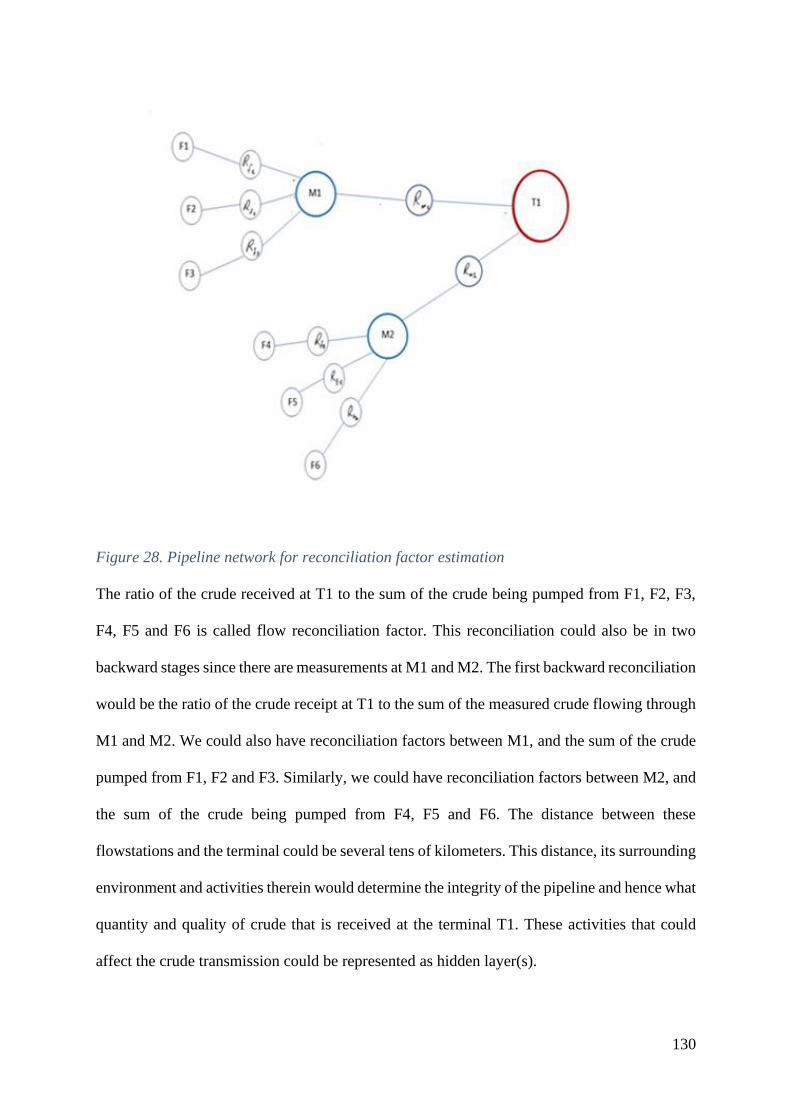
Figure 25. Solution pathfinder mind map ................................................................................... 114 Figure 26. Pipeline leak cause and effect diagram ..................................................................... 120 Figure 27. Pipeline sectional schematics for cause-and-effect demonstration ........................... 121 Figure 28. Pipeline network for reconciliation factor estimation ............................................... 130 Figure 29. Pre-leak data prognostic ANN workflow for crude theft detection .......................... 132
Figure 30. Niger delta oilfield acreage map................................................................................ 137 Figure 31. Simulation experimental setup .................................................................................. 139
Figure 32. Trunkline case simulation experiment ....................................................................... 147 Figure 33. Trunkline case simulation experiment with crude theft tapping points. ................... 148 Figure 34. Trunkline case pressure profile without a leak .......................................................... 148 Figure 35. Pressure loss (psi) due to leak at TP1 ........................................................................ 150 Figure 36. Pressure loss (psi) due to leak at TP2 ........................................................................ 150
Figure 37. Pressure loss (psi) due to leak at TP3 ........................................................................ 151
Page 12
12
Figure 38. TP2 leak monitoring chart from two pressure monitoring points ............................. 154 Figure 39. Pressure gradient plot for reservoir fluid contact determination ............................... 159
Figure 40. Single leak experimental setup .................................................................................. 161 Figure 41. Evacuation pressure profile without a leak ............................................................... 162 Figure 42. Evacuation pressure profile with midpoint leak ........................................................ 163 Figure 43. Pressure gradient dependency experimental setup .................................................... 165 Figure 44. Leak simulation at different positions on 6-inch flowline evacuating 6000bpd. ...... 166
Figure 45. Volume flow rate and pressure gradient relationship ................................................ 168 Figure 46. Variation of flowrate V with pressure gradient ......................................................... 170 Figure 47. Pressure gradient variation with diameter at 2000bpd without leak ......................... 171
Figure 48. Pressure gradient variation with diameter at 6000 bpd without leak ........................ 171 Figure 49. Estimation of GOC and OWC using fluid pressure gradient plots. .......................... 175 Figure 50. (a) Leaking system vector addition. (b) Scalar vector multiplication at constant leak
situation ....................................................................................................................................... 177 Figure 51. (A) Non leaking fluid evacuation structural analogue (B) Midpoint leak fluid
evacuation structural analogue .................................................................................................... 179
Figure 52. Pipeline fluid vector diagram during fluid evacuation .............................................. 180 Figure 53. Depression or relaxation angle θ due to leak ............................................................. 182 Figure 54. Leak rate estimation experimental set up .................................................................. 185
Figure 55. PIPESIM multiple leak simulation experiment ......................................................... 186
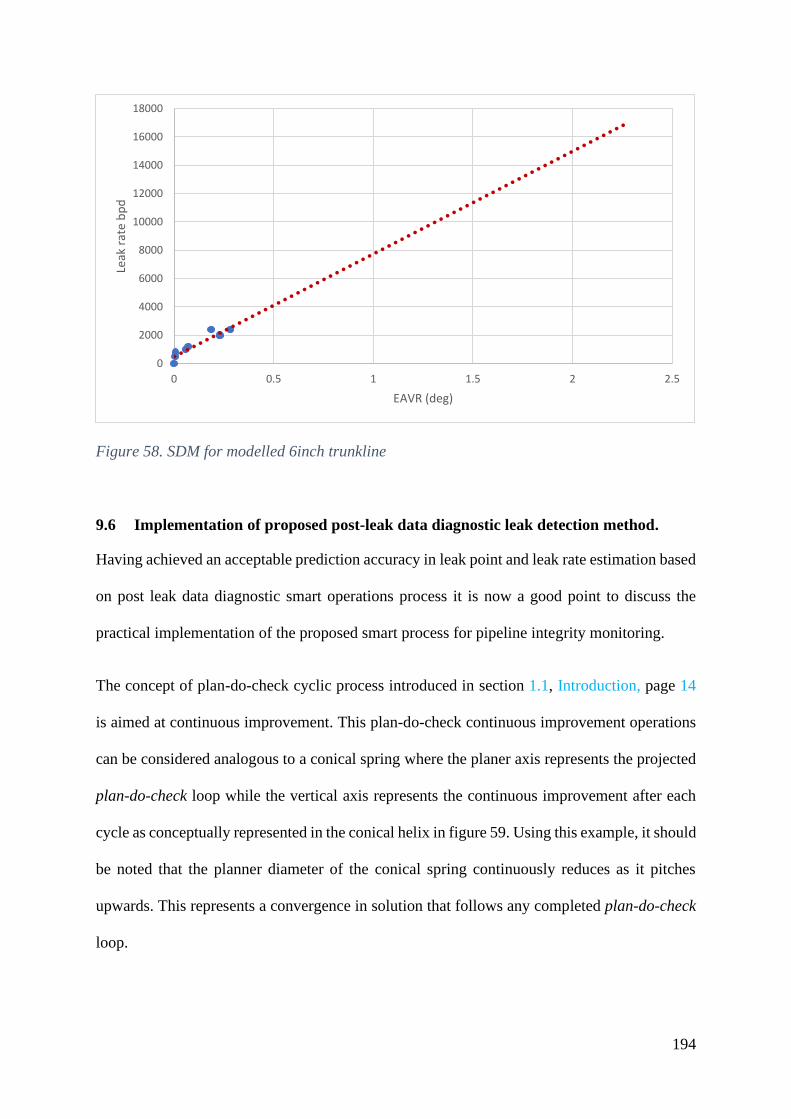
Figure 56. Delivery line transmission pressure profile with two leaks....................................... 186 Figure 57. Delivery line system curve for leak detection based on leak relaxation angle. ......... 193 Figure 58. SDM for modelled 6inch trunkline............................................................................ 194
Figure 59. Conceptualisation of plan-do-check continuous loop as a conical spring. ................ 195 Figure 60. Gas-well clean-up test data ........................................................................................ 198
Figure 61. FTHP data averaging methods .................................................................................. 198 Figure 62. Smart pipeline data acquisition system architecture. ................................................ 200 Figure 63. Future MEMS pipeline data acquisition concept (Martin M.J, 2018) ....................... 202
Figure 64. EAVR based on FTHP during Well Bean up ............................................................ 211 Figure 65. Well test system descriptive model. .......................................................................... 213
Page 13
13
Table of tables
Table 1. Technology screening table .......................................................................................... 100
Table 2. Simulation pressure results for TP2 leaks predicted from figure 38. ........................... 155 Table 3. PIPESIM output data without a leak............................................................................. 161 Table 4. PIPESIM output data with midpoint leak ..................................................................... 162 Table 5. Pressure gradient (psi/ft) response due to leak ............................................................. 166 Table 6. Calculated depression angles (θ) due to simulated leaks .............................................. 181
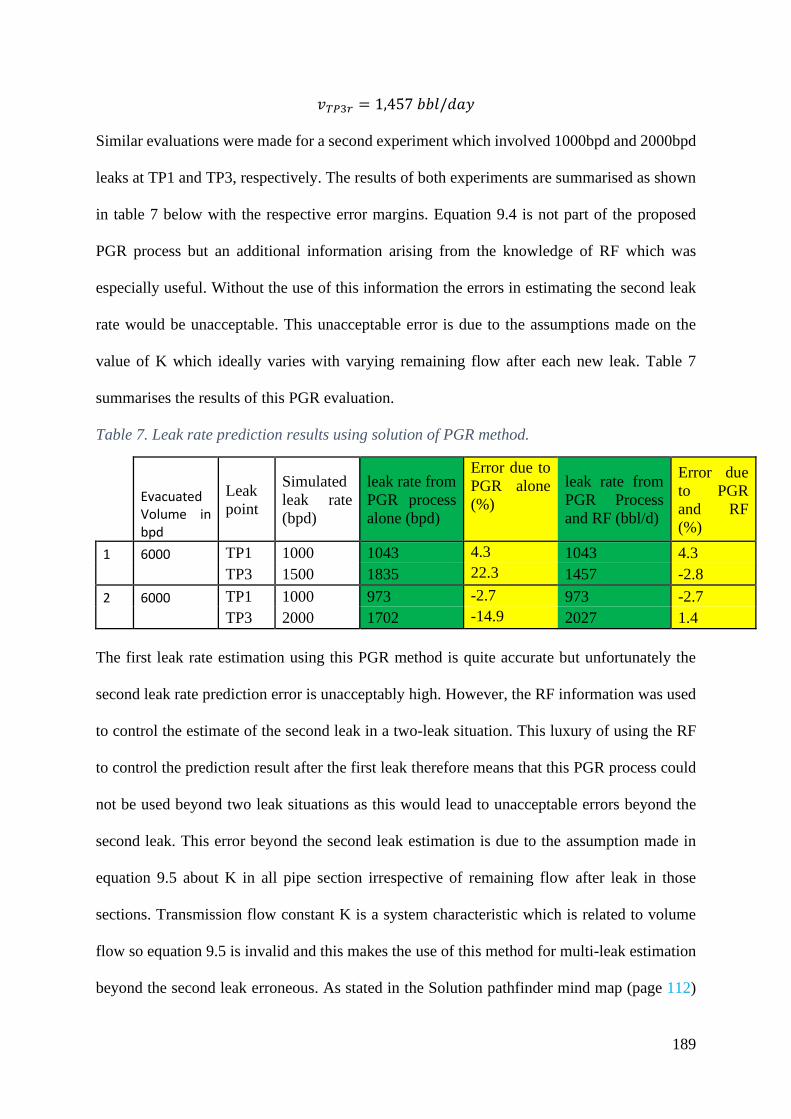
Table 7. Leak rate prediction results using solution of PGR method. ........................................ 189 Table 8. Pressure gradient in psi/ft calculated during leak simulation. ...................................... 191
Table 9. Estimation of pipeline EAVR due to leak. ................................................................... 192 Table 10. Niger delta well performance prediction table. .......................................................... 209 Table 11. Baseline and additional inflow data for Well Inflow SDM estimation. ..................... 210 Table 12. Production well test data. ............................................................................................ 212 Table 13. EAVR calculation from well test data. ....................................................................... 212
Table 14. EAVR prediction vs actual flow data. ........................................................................ 214
Table 15. Predictions from proposed new smart process for pipeline integrity monitoring. ...... 233
Page 14
14
1 INTRODUCTION
1.1 Introduction
The demand for petroleum and natural gas, which accounts for one third of total energy supply
needed to support human development through the provision of vital raw materials for habitation,
medication, transportation and industrialization, is projected to continue to increase with time,
hence the focussed effort on process safety improvements during hydrocarbon exploration,
production, processing and transport (Nwankwo, 2013). Hydrocarbon or petroleum exploitation
process involves all activities towards the mining of oil and gas and their transport to the point
where they are needed. The mining process and activities are executed in hazardously classified
areas where strict personal and process safety measures are enforced. The transport process
involves the use of pipelines to convey crude oil from wellheads to flowstations or from the
flowstations to the central processing plant via major pipeline that are called trunklines. The crude
oil being transported are inflammable, toxic, and are usually pumped under high pressure through
sensitive environments like farmlands, forest reserves, urban developments, and seabed.
Most of the prospecting areas used for oil exploration and developments in the Niger delta, which
started in the 1950s, were virgin lands for which what was considered appropriate due diligence
environmental impact assessments were made and requisite approvals from the respective
jurisdictions sought and received. However, because of urbanisation, some of these approved
facility sites (well locations, gathering stations, and pipeline right of ways) became encroached
such that any pipeline loss of containment leads to pollution, loss of lives, major fires and loss of
major assets. Figure 1 shows an encroached pipeline ROW in the Niger delta (The Guardian,
2005). Most times the residents on these encroached sites do not quite appreciate the impact of any
Page 15
15
accidental loss of hydrocarbon containment and some of these encroachment situations have
compelled shut-in of several facilities by the IOCs to minimise liabilities during accidents.
Figure 1. Pipeline ROW encroachment site (The Guardian 2005)
Accidents occur when risks are not accurately assessed or mitigated. A single accident could have
huge effect on operating cost and safety. The lost time injury frequency (LTIF) rate, which is a
quantification of lost time injuries occurring in a workplace per million hours worked, has been
devised within EP industry and indeed universally as a critical key performance indicator (KPI)
for accident prevention. This LTIFs could be considered as visible tip of an iceberg that provides
a warning sign of the large mas of ice buried under water. This is because any visible manifestation
Page 16
16
of an accident must have been surrounded with several unsafe conditions and near miss incidents.
Through the monitoring of LTIF, high potential incidents are reviewed and properly mitigated
before they could lead to accidents. These reviews assess the incident probability of occurrence
and the consequences of such occurrence. The fact that an event has a low probability of
occurrence does not necessarily mean that it will not happen, hence the evaluation of the potential
consequences of any major loss of containment event should be the focus of every risk assessment
as the cost of accidents could be huge and capable of having a significant effect on company’s
bottom line: cost of impacted lives; damage to facilities; environmental remediation cost;
associated litigation cost; loss of revenue etc. Usually, stringent procedures are instituted to
mitigate any risk that is assessed as having a high impact irrespective of the assessed probability
of occurrence.
The hydrocarbon mining activities include seismic acquisition; interpretation and mapping;
drilling; hydrocarbon processing; and transportation. A considerable effort has been made over the
years to improve on operational safety in every aspect of these mining operation around the Niger
Delta. These operational safety improvement efforts that led to considerable reduction in LTIF
could be classified in broad terms into improvements in 1) Legislation, 2) Regulation, 3)
Monitoring, and 4) Reviews that accompany any major industrial accidents (Nwankwo 2013).
Unfortunately, the hydrocarbon transport LTIF through the pipeline networks in the Niger Delta
is continually on the increase since 2000.
The Pipeline network used for hydrocarbon transport in Nigeria could be classified as those related
to upstream operations and those related to downstream operations. The upstream pipelines are
mainly owned by the E&P companies and are used for evacuation of hydrocarbon to their
respective crude oil terminals, inland refineries, or liquefied natural gas (LNG) plants. On the other
Page 17
17
hand, the downstream pipelines are used for either transportation of stabilised crude to inland
refineries or for transportation of refined products from inland refineries to major product depots
across the country. There are also some downstream pipelines for transportation of natural gas to
cities and industrial hubs for local use. Figure 2 shows the pipeline map of Nigeria for the
distribution of refined petroleum products as well as transporting crude oil to inland refineries in
Kaduna, Warri, and Port Harcourt while figure 3 shows a large network of oil and gas evacuation
pipeline for oil and gas processing and export.
Figure 2. Downstream trunkline map of Nigeria (Aluko, 2015)
Page 18
18
Figure 3. Niger delta upstream trunkline map of Nigeria (Analysis 2017)
These pipelines, especially the upstream pipelines, are used for continuous hydrocarbon
evacuation in Nigeria and hence every effort is made to prevent any form of operational
interruption on them. These crude oil and refined product pipelines have had one form of intrusion
vandalism in the past and these have led to several explosions that led to tragic loss of over 1000
lives in Nigeria within the period 2004 – 2014 (Carlson et al., 2015). Stories abound where people
have dug wells in their residential homes that connect to the petroleum product pipeline and from
the comfort of such homes siphon and sell the products which are mainly kerosene and Prime
Motor Spirit (PMS) to unsuspecting buyers (Omodanisi et al., 2014). The downstream petroleum
pipeline distribution network is not always on continuous use and hence, through suspected insider
information, the petroleum product vandals have knowledge of when the products are being
Page 19
19
pumped and hence use the offline periods to attach non-conventional hoses for illegal product
siphoning (Anifowose et al., 2012).
The pipeline loss of containment, until late 1990s, were associated with loss of integrity hence
some huge emphasis on preventive maintenance (PM) inspection and testing programmes to assess
the state of such pipelines. The activities of upstream pipeline vandals started initially as a way of
protesting the lack of development projects in the Niger delta host communities but rapidly grew
into a major industry for crude oil theft through hot tapping. The petroleum (upstream and
downstream) pipelines traverse settlements and sensitive areas hence any accidental loss of
containment is always devastating, leading to multiple fatalities, suffocation or burns in addition
to major environmental pollution.
Pipeline reliability improvement planning based on preventive maintenance (PM) and corrective
maintenance (CM) processes worked well in the Oil & Gas industries and is still particularly
useful. However, a new dimension in pipeline integrity management process was created in the
Niger delta around the year 2000 when pipeline vandalism became a new issue for consideration
in process loss of containment design and operation. The activities of pipeline vandals started
initially as a way of protesting the lack of development projects in the Niger Delta host
communities but rapidly grew into a major industry for crude theft through hot tapping.
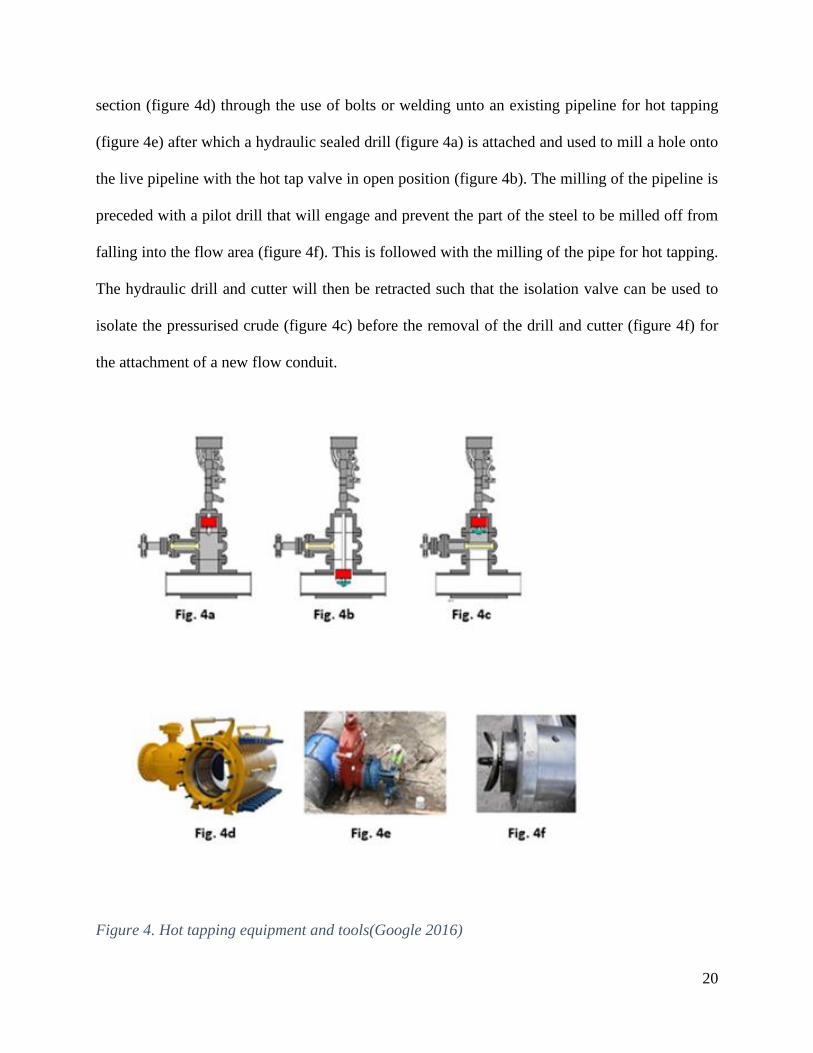
Hot or pressure tapping is the method of attaching new conduits to an existing pipe network or
pressure vessels without production interruption or depressurisation. This process is commonly
used by oil companies for bringing new fields onstream, especially when there is no nearby
production manifold. Figure 4, which encloses figures 4a, 4b, 4c, 4d, 4e and 4f shows the process
and equipment used during hot tapping. Hot tapping involves attaching an appropriate tee (T)
Page 20
20
section (figure 4d) through the use of bolts or welding unto an existing pipeline for hot tapping
(figure 4e) after which a hydraulic sealed drill (figure 4a) is attached and used to mill a hole onto
the live pipeline with the hot tap valve in open position (figure 4b). The milling of the pipeline is
preceded with a pilot drill that will engage and prevent the part of the steel to be milled off from
falling into the flow area (figure 4f). This is followed with the milling of the pipe for hot tapping.
The hydraulic drill and cutter will then be retracted such that the isolation valve can be used to
isolate the pressurised crude (figure 4c) before the removal of the drill and cutter (figure 4f) for
the attachment of a new flow conduit.
Figure 4. Hot tapping equipment and tools(Google 2016)
Page 21
21
Once illegally tapped, the newly attached conduit could be used to steal crude for illegal export or
for local refining. One of the early signals that some crude theft is ongoing is a comparison of the
fiscal reconciliation of the total fluid received at the export terminal to the summation of all the
crude pumped into the pipeline export route. The reconciliation factor (RF) would usually get close
to 1.0 without leaks or crude theft but drifts away from 1.0 depending on the rate of leak or crude
oil theft. Helicopter overflies are usually undertaken by operators to check for oil spills or recent
soil excavations along the pipeline right of way (ROW) once there are indications, from consistent
low RFs that some leaks or crude oil theft are ongoing. This non-routine surveillance overflies
sometimes lead to spill as the thieves siphoning crude, in a bid to hide from the helicopter
surveillance team, could leave the crude to flow out of containment as they drive off their tankers
or tow away their storage barges at land or swamp locations respectively.
Crude oil leaks and thefts are used interchangeably in this research because until a proper
investigation is conducted one may not know if the shortage recorded at the export terminal is due
to operational leaks or whether they are due to crude oil vandalism through hot tapping. This
interchangeable use will not affect the new process being proposed as it will be capable of
identifying the location of leak or crude oil theft.
1.2 Research motivation
Crude evacuation loss of containment leads to deaths because of explosions. It also leads to soil
and water pollution and fires whose compound effect could spiral into huge clean-up costs, loss of
revenue, huge facility repairs and remediation costs. The act of continued pipeline vandalism is
believed to have rendered some fields inoperable, thereby forcing some the international oil
Page 22
22
companies (IOCs) to divest from such hostile communities and lay off staff within the period 2000
- 2015.
This act of vandalism and crude oil theft have been reviewed and documented (The Guardian,
2013). “Much of the stolen oil is exported to foreign refineries or storage facilities, says
the report, including buyers in West Africa, the US, Brazil, China, Singapore, Thailand,
Indonesia and the Balkans. The proceeds appear to be laundered through banks and other
channels in various African countries, Dubai, Indonesia, India, Singapore, the US, the UK,
and Switzerland. The scale of the ‘bunkering’ has shocked observers. Thirty-centimetre
pipelines able to transport thousands of barrels of oil a day have been found leading
straight from pipelines into the swamps”.
The Guardian (2013) report estimates that the loss due to illegal oil theft in Nigeria amount to
some £1bln per month. Another research by Delta non-government group Stakeholder Democracy
Network (SDN) estimates that 75% of the stolen oil is being exported with the rest being refined
in illegal "artisanal refineries". More than 500 of these refineries, according to the report, are
known to have been set up in the last five years of report date, taking stolen crude and refining it
into a rough diesel for local sale. According to SDN, a medium-sized illegal refinery costs around
£3,000 to set up but can earn that back in a few weeks. But the operators need to pay hefty bribes
to the police and military, as well as to buy oil tapped off the 1,600km of pipelines that cross the
delta. Each tapping point, says SDN, can earn more than £500,000 a month but its investors must
pay armed guards, the military, contractors, local communities and even oil company staff. Figure
5 is a typical loss of containment site abandoned by pipeline vandals with brownish vegetation,
occasioned by environmental degradation, on both sides of the pipeline ROW.
Page 23
23
Figure 5. Loss of containment fire from illegal tapping point (Anon 2016)
1.3 Reflexivity, positionality and research mind map
This research was approached from the perspective of a subsurface petroleum practitioner with
some knowledge of hydrocarbon exploration and production practices in Nigeria and how similar
operations are conducted at similar deltaic environments around the world. The issue of pipeline
vandalism is related to lack of development or some legacy issues that turned the communities
hostile and non-receptive to the IOCs operating in their land. It is recognised that many of the
issues that Nigerians are struggling with exist only in Nigeria and hence researchers from other
locations will struggle to understand why such situation exist in the first place. So, this dissertation
is an effort at finding a technical solution to a local Nigerian problem. Some dialogue could even
arise questioning the importance of this research work since the clamour for clean green energy in
Page 24
24
support to world climate change initiatives. Available data still suggest that environmentally and
efficiently processed fossil fuels from crude oil would still be a part of the world energy mix for
some years to come but most importantly that fluid transportation will be with man for as long as
green gas would be transported from gas fields to LNG plants or our respective homes and
industries where the gas are needed. Also, any product from this research will also apply to any
form of fluid transportation system under suitable conditions.
There are several literatures on leak detection in urban water supply in big cities around the world.
Some of these research focus on case studies while others are based on experiments. The urban
water distribution networks, while like crude oil evacuation systems, are significantly different in
terms of cost and impact to the environment. The health, safety, and environment (HSE) cases are
different because loss of water containment in water pipes would lead to unintended irrigation as
the water will be useful to the field where it is leaking through the provision of luxurious greenfield
at appropriate whether condition. On the other hand, crude oil is inflammable and could ignite to
cause explosions, fires, and deaths during any loss of containment situation. Also, almost every
house or group of houses in a proper water pipeline network has some metering system, so
monitoring leaks is easier when compared to crude oil transport over an area of 75,000sq. km with
only a few crude oil flow measurement points. Thirdly the only known motivation for stealing
water would be to save a few Pounds Sterling a month where successful, but crude oil theft would
lead to huge financial gains. There are also lots of business controls that could deter any potential
water thief because the hurdles to be surmounted are huge and could have some cost implications
which would require a long payback period. Estate developers usually are required to apply to
other organisations for supply of water, gas, electric, telephone services etc., and the home buyer
gets a home with several contracts from these service providers who already installed controls for
Page 25
25
their services. In other countries, major trunklines are surface installation but in Nigeria, such
trunklines are buried. Even the flowlines that were originally surface were buried as a deterrent,
but this did not stop the vandalism. According to shell, crude oil theft on the pipeline network
resulted in a loss of around 11,000 barrels of oil a day (bbl/d) in 2018, which is more than the
approximate 9,000 bbl/d in 2017 and since 2012, SPDC1 has removed more than 1,160 illegal theft
points (Shell Nigeria, 2020).
Notwithstanding all the above, this research aims at providing a solution that could apply
elsewhere if this unfortunate situation manifests in such environment. In other to highlight and
address all issues relating to crude oil theft in Nigeria, a research mind map was created as shown
in figure 6.
1 Shell Petroleum Development Company (SPDC) is a Shell Operated Joint Venture Company between Shell and
other companies in Nigeria https://www.shell.com.ng/
Page 26
26
Figure 6. Research mind map
Page 27
27
The continued crude oil theft and its associated devastating economic and environmental effects
is an indication that the current reliability assurance process that relies on PM and CM actions,
whether through design or monitoring, needs improvement in the Niger delta. As a result of the
market created for stolen crude, this sub-optimal operating environment becomes more difficult to
stop. This is because the international buyers are continuously demanding stolen crude and the
pipeline vandals, or their intermediaries use the proceeds from this trade to sponsor the already
armed vandals with more sophisticated weapons for the continuation of oil theft business in
Nigeria. This operating environment is not sustainable and has had significant impact on the IOC
operating bottom-line and has continually forced such companies to continually divest from
valuable but non-operable assets. This situation creates continuous downward developmental
spiral, environmental degradation, and continual underdevelopment for Nigeria.
A recent study commissioned by Royal Dutch/Shell put the amount of oil stolen each year by
pipeline vandals in Nigeria at between 100 million and 250 million barrels. At an average of US$60
per barrel then, this translates to a loss of about US$15 billion each year (Mumuni & Oyekunle,
2007). This report is in full alignment with the Guardian report (2013) that estimates that the loss
due to illegal oil theft in Nigeria amount to some £1bln per month then.
1.4 Research Aims, Objectives and Impacts
Research aims.
This research aims at providing a technical solution that will lead to early detection of crude oil
theft or leaks. The use of mechatronics discipline and artificial intelligence workflows were
investigated and where suitable used in crafting a solution for this research.
Page 28
28
Mechatronics engineering could be viewed as modern mechanical engineering design in the sense
that the design of a complete mechanical system are performed together with that of electronics as
well as computer controls (Waterloo, 2017). The mechatronic science involves the use of sciences
or engineering principles in the provision of engineering solutions to identified products or
processes. Artificial Intelligence workflow, as it relates to crude evacuation through pipelines,
could involve the use of the pipeline flow characteristics or some of the environmental data
surrounding the pipeline being studied to determine leak points and leak rates. This research aims
at providing a technical solution that will aid the IOCs in recovering their developed hydrocarbon
with minimal losses due to pipeline vandalism. This could be achieved through the provision of
early warning system about ongoing hot tapping where possible or providing, within a reasonable
time, information of ongoing crude theft and hence rapid response for assets safeguarding
operations.
Research objectives
The objectives of this thesis are as follows:
1. To scout literature for potential technologies that could be used for monitoring and detection
of crude oil theft and leaks in pipelines.
2. To verify suitability of collected data and where appropriate conduct computer modelling
for extra data generation.
3. To use available and generated data for model creation, testing of proposed solution and
verification of useability of proposed solution.
4. To recommend a solution or new process for pipeline leak detection and leak rate estimation.
Page 29
29
Research impacts
The achievement of the proposed research objectives will:
• Contribute to safeguarding lost revenue to the government and people of Nigeria which is
currently estimated at £1bln per month.
• Contribute to improved HSE performance that could lead to reduction of lives lost due to
loss of containment explosions which was estimated at over 1000 people within the period
2004 – 2014.
• Contribute to the reduction of greenhouse gas emission from illegal refineries which
currently are not fully quantified.
1.5 Thesis structure
The process and reasoning that eventually led to the discovery of a cost-effective solution to crude
oil leak (or theft) identification and quantification during pipeline crude evacuation in the Niger
delta is discussed below.
• Chapter 1 highlights the case for action considering the quantity of crude oil stolen from
major international operating companies (IOCs), its crippling effect on the Nigerian
economy, and how these theft operations sometimes lead to loss of containment explosions,
deaths, pollution, and greenhouse gas emissions. This research was approached from the
perspective of an oil and gas practitioner who tries to compare hydrocarbon production
evacuation practices and challenges in Nigeria with that of similar deltaic environments
around the world. This necessitated some discussion on reflexivity, positionality and research
mind map which addressed questions about the importance of this research work since the
current clamour is for clean green energy in support to world climate change initiatives. The
reflexivity, positionality, and research mind map documentation was followed with the
Page 30
30
research aims and objectives and this chapter ends with an outline of proposed thesis structure
which aims at scouting available literature for potential technologies that could be used for
the development of a new process for crude oil theft detection and leak rate quantification.
• Chapter 2 is a process documentation for the selection of a research philosophy that could
progressively address the research objective and all potential issues relating to crude oil theft
in the Niger delta in a structured methodology. A Venn diagram was used to highlight some
philosophical perspectives and how they could be used to select the required research strategy
for the knowledge sought. If knowledge is being sought, as in this dissertation, for ways of
improving pipeline integrity monitoring then we must consider the feasibility and viability of
all conceivable options. It is only when our desire fuses with the feasibility and viability
attributes that an innovation is created. The adopted research process is pragmatic
epistemology which arrived at a new knowledge through deductive reasoning. The research
hypothesis was a postulation that “If we have a way of continuously measuring the steady
state conditions of a given pipeline at regular intervals (say 5 or 10 km) during operation,
then we could, through deviations trending from the steady state operation, determine the
point of leak or crude oil theft and quantify rate of leak or crude theft. Having crafted a
plausible research hypothesis, some efforts were made on how to use available data for testing
of the crafted hypothesis such that where such testing is possible the scientific testing process
can be used to support the documented research hypothesis through deductive reasoning. As
an introduction to the literature review, this chapter documents a research domain which must
be constrained by the fact that there is continuous hydrocarbon flow in trunklines. This
therefore implies that any technology for leak detection should not demand production
interruption otherwise this would require design changes and difficult to operationalise.
Page 31
31
• Chapter 3 is a literature review of potential technology solutions that could address the
research objective within the pipeline transport constraints. A considerable discussion on the
problem statement was presented here as an introduction. This was followed with a discussion
of hazard and effects management process (HEMP). HEMP is a risk management process
that is used to install a set of barriers to top events (incidents or accidents) and where such
events have occurred, due to failure of installed barriers, uses another set of barriers to prevent
escalation. The three ways of managing known risks based on the HEMP process are : 1.)
Reject risk, 2). Transfer risk or 3.) Accept and manage risk. The demand for petroleum and
natural gas, which accounts for one third of total energy supply needed to support human
development through the provision of vital raw materials for habitation, medication,
transportation and industrialization cannot be ignored hence we must accept the loss of
containment risks and find ways of minimising its associated risks. It is hoped that this
research will strengthen the crude evacuation HEMP process by adding either a control
barrier or a recovery barrier in the management of loss of containment during crude
evacuation process. This HEMP discussion was followed with literature review of potential
technologies that are capable of providing potential solution to crude oil theft problem. The
list of internal and external technologies reviewed include fiscal reconciliation; corrosion
monitoring; flow simulation; smart field operation; fibre Optic sensing; frequency response
function modelling using acoustic or vibration, and floating micro robots. The strengths,
weaknesses, and suitability of these reviewed technologies were used to arrive at some
conclusion of potential technologies for progression to testing of research hypothesis.
• Chapter 4 builds on the conclusions of the literature review to select suitable technologies for
pipeline leak detection based on research process of using deductive reasoning to see if
Page 32
32
available data can support the documented research hypothesis. The concept selection
exercise was to ensure, among other things, that the conclusions of the literature review have,
within the trunk line operational framework and boundary conditions, scanned wide enough
to identify all potential technologies for the achievement of research objective for leak
monitoring, crude oil theft detection, and quantification of leak (or crude theft). The
evaluation criteria include ability to detect leak; ability to detect pilferage; ability to estimate
rate of leak; ability to detect hot tapping locations; continuous data acquisition suitability;
suitability to trunkline operating environment (OE); technology maturity; ease of repair and
troubleshooting. This evaluation exercise yielded smart operations as the most favourable
technology. Unfortunately, the smart operations is unable to detect hot tapping operations.
Acoustic emission modelling and vibration modelling were assessed as the only technologies
capable of detecting hot tapping operations. This notwithstanding smart operations was
selected and progressed for further studies to close its operational gap. This chapter ends with
smart fields operation synoptical documentation where the smart fields operations
nomenclature as used in this thesis were explained. The basis for smart fields operations and
digital twin is simulation and there are several levels of smartness or smart operations
capability. This chapter ends with a documentation of smart fields operations technology
progression path which highlights the details of explored options for the development of a
solution for leak detection. As contained in smart pipeline operational requirement, the pre-
leak data prognostic method and the post leak data diagnostic methods were discussed.
• Chapter 5 focuses on how to close the feasibility gap on using smart operations technology.
As with most research efforts we have an idea of what a technology solution could be but the
pathway to this solution, if eventually achievable, is only attained through some doggedness.
Page 33
33
This dissertation, which eventually delivered a new smart process for pipeline integrity
monitoring, followed a rigorous but sometimes flip-flopping map on technology leads as
documented in the solution pathfinder mind map which formed a part of this chapter
introduction. Two separate approaches to using smart operations technology to achieve this
research objective which were highlighted in chapter 4 were discussed in detail. One
approach would be to start with a hypothesis and then test such hypothesis using observed
data to see if observed data follow some trends as proposed in the hypothesis. The other
approach would be to theorize on observable patterns, then test available data for
conformance and where appropriate create a theory or hypothesis. The main difference
between these two methods is that one is based on post-leak processed data while the other
is based on pre-leak processed data. In pre-leak processed data methodology, the analysis
focuses on events that could be assessed to have happened before a particular result is
achieved. For example, you need to have punctured a pipeline before a leak could be
established. In post leak processed methodology, we focus on results to determine the
preceding events. Applying post leak processing methodology, we could say that if there is a
leak on a pipeline it means that the pipeline must have been punctured. Post leak data
processing is instantaneous instrument based and requires that we have some knowledge of
what is flowing while pre-leak processing is based on artificial intelligence knowledge of past
events and data surrounding the pipeline being investigated or a similar pipeline. The
organized event data which influence pipeline leak, based on pre-leak processing are non-
existent or difficult to generate in the Niger delta and hence makes the use of pre-leak
processing methodology difficult. Post leak processed analysis methodology seems
promising since it is based on instantaneous measurements. Unfortunately, only limited
Page 34
34
measurement capability exists along most trunklines and this makes the use of the available
Niger Delta data unusable in post leak processing analysis. Machine learning (ML) was
introduced as a potential third AI method for leak position and rate estimation during fluid
evacuation. However, ML algorithm for leak point detection was assessed as potentially
luxurious as such experimentation would take an unsustainable long time to train. It was
therefore decided that the use of ML is not suitable as a third option for leak evaluation during
crude oil evacuation. Rather such ML workflow could be used to improve any System
Descriptive Model (SDM) developed using pre-leak or post-leak data. This therefore meant
that there is need to re process the available data for use in creating a new process for pipeline
integrity monitoring based on post leak data processing in support of research objective.
• Chapter 6 compares options for the generation of the required data in support of smart
operations workflow for leak detection and quantification. One option could be by laboratory
experiments to generate the required data while another option could be the re processing of
available data through computer simulation. The cheaper alternative process involving the
use of computer simulation was selected, instead of laboratory experiments based on
extremely limited cost and time resources. The research basis for design discussed our
knowledge of isothermal mass flow in a confined space which requires knowledge of
Pressure, and volume at any given position to describe a flow domain. However, having
discounted the requirement for in-line volume measurements research was now reduced to
capability to monitor pipeline leak position and rate through pressure measurements only.
This chapter ends with the basis for the selection of PIPESIM computer simulation software
which is one of the best flow simulation software used by oil and gas exploration companies
around the world.
Page 35
35
• Chapter 7 starts with a review of existing trunkline systems design in other to generate a
representative detailed design requirement for leak investigations. Models of a trunkline and
a delivery line case were created for leak simulation experiments. The first set of experiments
showed that leak detection is possible through monitoring of pressure differentials. Our
capability to further refine the results of these experiments or extend this finding to a universal
pipeline integrity monitoring was further studied. The results demonstrate that for a given
pipeline with evenly spaced pressure measurement opportunities, we could use the pressure
variations from these pressure measurement points to determine the point of crude leak or
theft from any section of the trunkline. This results conditionally support this thesis
hypothesis and was further studied for universal application.
• Chapter 8 validates the use of pressure gradient in leak detection having demonstrated that
monitoring of pipeline pressures at a few pressure nodes is just sufficient for leak detection.
Additional experiments were executed to fully quantify the relationship between known
influencing parameters like flow volume and conduit size on the rate of change of pressure
per unit distance during crude transportation. This theoretical basis was for the use of pressure
gradient for leak detection based on analogous comparison of subsurface reservoir
engineering practice of using fluid gradients to determine fluid contact planes as well as using
reservoir pressure depletion to determine the total produced volume from a reservoir whose
size is well known. An attempt was made on presenting the relationship between pressure
gradient and volume flow rate in pipes for steady state incompressible fluid using Navier
Stokes equation. The results of the PIPESIM simulation experiments agree with the
relationship between flow rate and pressure gradient derived from Navier stokes equation.
Page 36
36
• Chapter 9 focussed on the use of data analytical methods to augment pressure gradient
analysis methodology which has already been proven as useable in leak detection. Two
analytical methods for estimating leak rate in any pipeline evacuation system were verified.
The first set of analysis which is based on algebraic equations of pressure gradient line and
determination of line intersection points demonstrated that the use of gradient method is
effective in multiple leak detection in any pipeline system. This approach would however
need to be augmented to be able to assign the leak rate to the respectively identified leak
points. The second set of experiments used the concept of angular vector depression or
relaxation method to propose another solution for leak detection. This approach was also
effective in predicting both the point of leak as well as the leak rate in a single leak situation.
It was therefore conceived that a combination of the intersection method and the angular
vector relaxation method could be combined and used in the identification and quantification
of multiple leaks in any future pipeline system. The enclosed angle vector relaxation (EAVR),
which was a discovery during pressure vector manipulation, due to leak was verified as
proportional to the rate of leak and hence was documented as a necessity for pipeline leak
characteristic curve documentation upon which this recommended new process is based. The
use of pipeline system descriptive model (SDM) or pipeline leak characteristic curve was
investigated, and the results were outstanding for multiple leak investigation. This new
finding was therefore documented as a concluding confirmation to this dissertation that: If
we have a way of continuously measuring the steady state conditions at regular intervals (say
5km or 10km) on any pipeline during operation, then we could, through deviations trending
(or monitoring) from the steady state operation, determine the points of leak or crude oil theft
and the corresponding leak rates. This chapter ends with a discussion on the practical
Page 37
37
implementation of the proposed smart process for pipeline integrity monitoring like
uncertainty management and the pipeline digital data acquisition process. Having
demonstrated the documented research objective, as well as recommended some additional
recovery barriers for the management of loss of containment in the crude oil evacuation
HEMP process, marks the end of this dissertation but some further research for reprocessing
of fluid flow processes were undertaken for this new knowledge extension of the
recommended EAVR process into inflow analysis. The difference between leak and inflow
within any space or domain is sign convention. Leaks represent some fluid outflow from a
defined domain while inflow represents some fluid movement into the given domain. As a
result of this, it is believed that any technology that can be used to detect leak can also be
used to detect inflow: hence some further experiments to test the applicability of the
demonstrated EAVR into inflow prediction.
• Chapter 10 is a further verification of one of the research finding for leak and inflow
estimation using enclosed angle vector relaxation method. The proof of this new concept was
based on pressure measurements for estimation of transmission pressure gradients for the
determination of leak rates at identified leak points. Once the leak points are identified, the
same pressure gradients used in the identification of leak points can also be used in the
estimation of leak rates by comparing pre-leak pressure gradient vector and post leak gradient
vector and the angle between them which has been defined as enclosed angle vector
relaxation (EAVR). In the graphical proof of concept documented at pressure gradient vector
analysis it was felt that this EAVR can be used to estimate fluid inflow in addition to leaks.
This sounds logical since the difference between inflow and leak is that one is opposite of the
other in sign convention within the domain space being studied. This corollary was tested
Page 38
38
through two case studies in subsurface engineering. These additional tests on the capability
to extend the use of EAVR process as a universal concept for predicting leak and inflow
during fluid evacuation in conduits is now proven and is therefore recommended as part of
the smart process for pipeline integrity monitoring.
• Chapter 11 is a documentation of the progressive research conclusions that led to the new
process on pipeline integrity monitoring process and possible steps on how to design some
computer algorithm that will automatically run the process with minimal human intervention
in line with artificial intelligent workflow. The new smart process for pipeline integrity
monitoring involving: data acquisition; data baselining; leak point determination and leak
rate quantification has been developed and proven as capable of detecting multiple leaks (and
inflows) and quantifying the rate of leak (or inflows). A documentation of the conditions for
the validity of proposed new process for pipeline integrity monitoring was also made and this
chapter ends with some recommended further research areas for the perfection of proposed
new process. Specifically, this dissertation concludes that the EAVR concept, which is one
of the main contributions of this research: is a new knowledge addition to Physis and Fluid
Mechanics; is also a discovery, and a process invention.
Page 39
39
2 RESEARCH METHODOLOGY
2.1 Introduction
This dissertation is focussed on process safety improvements during hydrocarbon transport from
gathering stations to the point of export or use. The philosophical questions being addressed in this
dissertation are focused on how to stop or minimize the effect of crude oil theft in Nigeria.
This chapter discusses the process for maturing thoughts into innovation and in so doing selects
the most suitable research method for the achievement of the research objective of predicting and
quantifying crude leak or theft during crude evacuation in trunklines.
2.2 Pathway to knowledge innovation
Our aspiration is to get to an operating environment where any pipeline operator will know within
reasonable time when and where crude oil stealing is ongoing so that they could act before the
crude oil theft will lead to explosions, environmental degradation and deaths. The process of
getting from the current operating climate in the Niger delta to our desired operating climate would
be our research strategy and any of the available research methods that requires minimal effort
would be adopted as our research strategy.
A Venn diagram is shown in figure 7 to highlight some philosophical perspectives and how they
could be used to select the required research process for any knowledge innovation. If knowledge
is being sought, as in this dissertation for ways of improving pipeline integrity monitoring then we
must consider the feasibility and viability of all conceivable options. It is only when our desire
fuses with the feasibility and viability attributes that an innovation is created. The innovation
sought could as well be an improved way of executing an old activity or process. Ideas are created
Page 40
40
when concepts are conceived and articulated to address a desire. The philosophical questions on
these ideas would include whether we know what we seek, whether it is possible and whether it
can be proven. We could also ask questions like whether we know what we are getting into? These
set of preliminary research questions are necessary to avoid starting a white elephant project:
wasting a lot of resources without taking off. Getting this framing stage right is necessary and
could involve a lot of iteration and idea refinements. These set of initial work is called frontend
loading in business enterprise and is critical because experience have shown that getting it right at
framing stage would make it easy to fully achieve project objectives once the project has
progressed to detailed design stage. Attempting to force-fit a product outcome into a wrongly
framed project usually results in exponential cost and time overruns. Framing therefore should be
wide and divergent to accommodate all foreseeable solutions. One could just imagine having a
busy airport, like Heathrow, which never imagined that there could be jet planes like Airbus 380
or Boeing Dreamliner that would need a longer runway in the twenty first century.
Inspiration could be organically evolved, or it could be external to the problem being solved.
External inspiration could manifest from analogues, which could be some proven processes in
other environments. Most literature reviews are aimed at gaining insights from internal and
external inspirations and it is a collection of these potential practices worth replication that creates
a sphere of feasible options for idea realization. Some of these realizations would be assessed as
technically feasible while others would require a lot of energy and resources to reduce the
remaining uncertainties to their target solution to as low as reasonably practicable (ALARP). The
ALARP stage in any development represents a situation where you need to invest a lot of resources
to achieve very minimal improvement in project objective.
Page 41
41
Figure 7. Innovation Venn diagram (The framework bank, 2016)
Viability is evaluated based on value and the value adds most times is directly related to economic
gains which are easily measurable. Values could also be based on alignment to organizational
goals which may not be easily measurable, hence even when the economic gains are not obviously
greater than employed cost, sometimes decisions on project progression could be based on
strategic vision alignment. How do you evaluate research viability? Research could be based on
1.) Desperation, or 2.) Efficiency improvements. It should be noted that improvements in human
habitation on earth has always been a routine product of research based on continuous
improvement. Once an innovation has been established it becomes routine or taken for granted
while improvements are built around it. E.g., until the discovery of electricity man lived within the
confines of day and night as dictated by the sun and the moon. With the discovery of electricity
Page 42
42
came inventions like electric light, radio, and television (TV) and someone can have twenty-four
(24) hours without darkness. Several consumer-electricity based research are now focused on
picture and sound quality improvements, which is now the selling point for most consumer product
companies marketing TV and Radio electronics. The year 2020 was a year where activities around
the globe were halted for the first half of the year due to Corona virus (or Covid-19) pandemic.
Almost every country was directly or indirectly involved in data collection, experimentation, or
fighting through some form of research for innovation on how to stop the Covid 19 virus. This
type of research is based on desperation to reduce mortality effect of the pandemic. Space research
and its derivatives like 5G information, technology and communications (ITC) process could be
considered as products of efficiency improvement research. So where do you classify research on
crude oil theft in Nigeria. Most Nigerians would classify such research as that of desperation based
on Research motivation discussions. Europe and America would also classify that local research
as that of desperation primarily because such operation will destroy the Nigerian economy if not
addressed and a product of such failed economy of the most populous African nation would lead
to increase in illegal migration to Europe and America.
The fact that the crude evacuation or the hot tapping process generates data implies that we cannot
divorce the data generation process from the crude oil evacuation process hence this type of
arguments for demonstration of truth would influence the research method that would be adopted
for this research.
2.3 Research method
One branch of philosophy which is concerned with the theory of knowledge and its relationship to
concepts such as truth and beliefs is known as Epistemology while the other branch that focuses on
Page 43
43
what can be known and how it can be known is Ontology (Holm 2016). Ontology is traditionally
classified as metaphysics and deals with questions concerning what entities exist or may be said to
exist and how such entities may be grouped, related within a hierarchy, and subdivided according
to similarities and differences (Wikipedia, 2020). On the other hand, Epistemology, which relies on
objective facts that have been established and can be demonstrated (Research Methodology, 2020),
is the systematic or logical investigation of three fundamental questions: What is knowledge ?; Can
we have knowledge? and How do we get knowledge? (MESA COMMUNITY COLLEGE, 2020).
An attempt is made at selecting a research philosophy that could generate a technology solution
capable of reducing deaths due to crude oil explosion from pipeline loss of containment during
crude theft. A primary research, like this dissertation involves collecting data about a given subject
directly from the real world (Dana Lynn Driscoll, 2017) and, as discussed in Pathway to knowledge
innovation, we have some idea of what improvements we need, so Epistemology was adopted as a
research philosophy for the new knowledge sought.
So, can we have the knowledge and how do we demonstrate that the knowledge is achievable. The
use of mechanical observations, computer simulations, and laboratory experiments were considered
data processing options in support of this primary quantitative research based on epistemology.
Some form of secondary research methodologies in the form of literature review, which is a form
of qualitative primary research, of current technologies for pipeline leak detection were undertaken.
The terms used to describe epistemological positions vary, depending on whether it is describing
the origin or the acquisition of knowledge. A brief overview of the epistemological options is
presented in Figure 8 (University College Dublin, 2020).
Page 44
44
Figure 8. Epistemology and learning theories (University College Dublin, 2020)
Some of the philosophical orientations in epistemology were discussed by Holm (2016) who
documented among other things that: the Positivist approach stipulates that the truth or cause can
be found, tested, and verified by scientific standards; an Interpretivist approach would seek a
subjective understanding of the objective truth, assuming that the truth is shaped by the viewers’
perception and understanding; the Pragmatists approach states that instead of focusing on the
methods to use, the researcher should emphasise the problem or question at hand and use any
available approaches to understand the problem. But there are other orientations as shown in figure
8 and by other researchers who suggest that the applicable orientation depends on the problem being
solved. “Pragmatism is a deconstructive paradigm that advocates the use of mixed methods in
research, ‘sidesteps the contentious issues of truth and reality’ (Feilzer 2010, p. 8), and focuses
instead on ‘what works’ as the truth regarding the research questions under investigation
(Tashakkori & Teddlie 2003b, p. 713)” (Rayed AlGhamadi, 2020).
Page 45
45
The pragmatism or pragmativist approach was therefore selected because research involves some
mixed research methods as earlier explained and builds on earlier acquired knowledge. Pragmatic
epistemology assumes that (Romania, 2013): “1). Truth is the product of a dynamic, negotiated
collective agreement; 2). Therefore, there is no final, certain and objective knowledge to be
unveiled. Pragmatists conceive knowledge as a contingent, fallible, and operational human activity,
oriented to social practical purposes, defined by the community and 3). Structures are always the
contingent and partially unpredictable product of a process of interaction between factors or
individuals. The idea of pre-existing, transcendental and immutable structures—in the natural,
social, and theoretical world—are considered as artificial social constructions”.
The fact that pragmatism or pragmativist philosophical orientation can be built on a hypothesis
makes it more attractive such that the result of testing such hypothesis could determine the new
knowledge or world. The pragmatic epistemology was therefore used for testing a suitable
hypothesis that could be used to achieve the research objective of monitoring crude theft or leak.
The new knowledge being sought now is reduced to pipeline operational activity that could be tested
for confirmation of loss of containment. The RF is a manifestation of loss of containment, but this
is just a signal that calls for more investigation about the points of leak and the respective leak rates.
So, is there a way of checking loss of containment in pipelines during crude evacuation process?
Can this pragmatic epistemological approach be used to investigate the hypothetical postulation
that:
If we have a way of continuously measuring the steady state conditions of a given
pipeline at regular intervals (say 5 or 10 km) during operation, then we could, through
Page 46
46
deviations trending from the steady state operation, determine the point of leak or crude
oil theft and quantify rate of leak or crude theft.
A demonstration of this new world is the knowledge sought.
Pragmatism deals with the analysis of concepts and the practical implication of our choosing to take
a concept to have a certain meaning over another. The tough-minded pragmatist believes in
posteriori and empirical learning and believes that something must be proven before it can be said
to be known. We need to look at the practical consequences of belief as well as context before
choosing what to believe. According to James and Charles Sanders Peirce2 in discussion of James
Williams pragmatist philosophy, what we come to agree on through a process of investigation
becomes the truth. There are always disagreement about what is the truth so if pragmatism is to
fulfil its goal, it needs not to tell us that agreement is the answer but how to resolve any
disagreements (Carneades.org, 2015).
So, can we have the knowledge and how do we demonstrate that the knowledge is achievable. There
are several orientations of pragmatist epistemology and challenges on the concept of truth: whether
it is a negotiated agreement or whether it is one individual’s belief that makes one happy. One of
the world’s topical issue during the conclusion of this research in 2020 is the vaccination of people
around the world against the Coronavirus. Is the vaccination to protect one against the virus or is it
to give some protection against the virus or is it to give the receiver some sense of protection against
the virus? Each of these three beliefs means different things and there are elements of truth in each
of these perspective truths. Scepticism will give each of these a different interpretation and so is the
paradigm shift pragmatist. Pragmatic epistemology is about a process for believing what is true.
2 Charles Sanders Peirce (1839–1914) was the founder of American pragmatism
Page 47
47
Science has a procedure of investigation and will in due course determine which of the views of the
reason for vaccination is indeed true.
The process of discussing project feasibility yielded smart operations. Learnings about objects from
the pragmatist cannot be divorced from the objects themselves. The truth sought (about this new
process) was therefore reduced to what we can learn from the pipeline, or its immediate
environment during crude evacuation process. Is there a way of testing the research hypothesis
which states that if we can monitor the steady state conditions in a pipeline during crude evacuation
at regular intervals, then we can determine the point of leak? Electromagnetism was severally used
as an analogue to demonstrate how this truth can be supported using pragmatic epistemology.
Having a core metal, a coil and a current source does not produce an electromagnetic effect until
the coil encases the metal and there is current passing through the coil. Also, it is only when all the
crude passing through the pipelines are not received that we can suspect leak or crude theft.
So how can we know the point of crude oil theft when it is proven that indeed there is a theft? We
can use the transmission fluid parameters like pressure to identify leak points and we can also use
the activities within the near environment of the pipeline to estimate the probability of leak at a
given point. These two approaches are based on deductive reasoning and inductive reasoning
respectively. According to Jeremy Donovan “By its strictest definition, inductive reasoning proves
a general principle — your idea worth spreading — by highlighting a group of specific events,
trends, or observations. In contrast, deductive reasoning builds up to a specific principle — again,
your idea worth spreading — through a chain of increasingly narrow statements.”
(OutRespectiveWritting2019, 2019).
Page 48
48
Figure 9. Deductive Vs Inductive reasoning (OutRespectiveWriting, 2019)
Figure 9 documents the thought flow process for deductive and inductive reasoning as could be
applied to pragmatic epistemology as well as highlight the champions of the respective approaches.
Both thought processes uses some form of hypothesis and could be applied to this research on crude
oil detection process.
Attempts were made at proof of the published research hypothesis through the pragmatic
epistemology using either the deductive or inductive logic. The first attempt was using inductive
logic for prognosis of leak point. This environmental data analysis methodology focuses on all
potential external incidents that must have happened as a precondition for any expected outcome to
Page 49
49
occur. In the case of crude oil theft or leak, this focused on activities external to the pipeline being
investigated that needs to have happened to create a variance between the total crude being received
at the terminal and the total crude being pumped from the respective flowstations. Potential
activities that will lead to crude oil theft or leak include operational leaks and pipeline vandalism
for the purpose of creating leak or crude tapping point. This pre-leak prognostic data processing
workflow feasibility was evaluated using causal reasoning and artificial neural network (ANN) both
of which are artificial intelligence workflows. The observations for this approach would involve
studying logic, and inferences to see if they correlate with data influencing crude theft. The events
which influence pipeline leak, based on pre-leak data prognostic processing has been documented
as: terminal reconciliation factors; loitering along pipeline ROW; employment indices; growth of
illegal refineries; automotive activities close to pipeline ROW; periodic petroleum product
shortages. These data are difficult to generate in the Niger delta and hence makes the use of pre-
leak data prognostic processing methodology difficult. The aim of such study was to create a
pattern that could be used to test the research hypothesis so as to create a new theory or model
called SDM for prognosis of leak points.
A second analytical attempt using deductive logic for leak diagnosis using post leak data was
evaluated. Central to the support of this post-leak data diagnostic process was pressure observations
for estimation of transmission pressure gradients for the determination of leak points. Once the leak
points are identified, the same pressure gradients used in the identification of leak points can also
be used in the estimation of leak rates by comparing pre-leak pressure gradient vector and post leak
gradient vector and the angle between them which has been defined as enclosed angle vector
relaxation (EAVR).
Page 50
50
2.4 Research process
This pragmatic epistemological research process, based on the forgoing, is based on deductive
reasoning as shown in the research process depicted in figure 10.
Figure 10. Research process
Having crafted a plausible research hypothesis, some efforts were made on how to use available
data for testing of the crafted hypothesis and where such testing is possible the scientific testing
process shown in figure 10 can be used to support the documented research hypothesis.
Research hypothesis
The objective truth sought in this pragmatic epistemological research should be supported if we
are able to investigate the postulation that:
If we have a way of continuously measuring the steady state conditions of a given
pipeline at regular intervals (say 5 or 10 km) during operation, then we could, through
Page 51
51
deviations trending from the steady state operation, determine the point of leak or crude
oil theft and quantify rate of leak or theft.
Data based observation.
The importance of data in modern engineering cannot be over emphasized especially with respect
to HSE. The first set of automobiles from Daimler Benz around 1885 or the later versions of the
early 20th century had very minimal HSE instrumentation. It was important then to have a
functional vehicle that could move and stop safely as required. Even up to mid-20th century only
basic improvements in operational data like the quantity of gasoline in the gasoline tank and the
speed of travel were judged to be sufficient. Around early 1980s some of these automotive
instrumentations improved such that the fuel endurance could be estimated by integrating the
specific fuel consumption of any given automotive and the respective instantaneous speed for the
given vehicle. This innovation led to improvements in human comfort and automotive efficiency
in addition to HSE considerations as the vehicle then were able to advise the driver if there is
enough fuel to undertake any desired journey. Extras like cruise control, safety airbags, automatic
suspension dampers, and automatic air-conditioning are mechatronic processes that were added
later to make the automobiles more comfortable. With the development of the GPS, more
innovations were added such that the car would now additionally inform the driver of the position
of the nearest fuel filling station for fuel top up if the available fuel is not enough for the planned
journey.
The act of crude pumping generates data in the form of pressures, volume flow, and temperatures
during the transport process. The chemical properties of evacuated crude as well as the presence
of impurities like CO2, H2S and sand has some influence during the transport process. The crude
Page 52
52
transport data are continuously generated at two stations: the flowstations and at the terminal.
These data are manually stored and used to compute monthly reconciliation factors. The question
now is whether there is room for improvements on current data collection and analysis process.
One easy improvement would be to increase data intensity by increasing the data acquisition points
along the length of the trunkline and this has been evaluated as very useful. Like the automotive
analogy explained earlier, handling and processing of the collected data is an essential part of any
fluid evacuation data management process. Data could be manually processed and used to make
decisions which would be implemented by operators. Unfortunately, there is always a lag in
implementation time and sometimes huge demand on staff resources if manual processing is
employed considering the spread of trunk lines. This dissertation is focused on continuous
measurement and observation of the steady state conditions of nodal observation points of a given
pipeline during operation and this could not be effectively achieved via manual data gathering and
processing. The use of an electronic system that screens data streams, selects data based on pre-
set sampling frequency, validate data, and uses some logic to continuously advise operators on the
state of the pipeline integrity was therefore suggested. The most important data for this deduction
based on post-leak data based diagnostic process is the monitored transmission pressures which
can be measured with an appropriately sized transducers and transmitted through any suitable IoT
system to the data digital processing centre for use in leak prediction.
The data evaluation process could be as simple as trend monitoring with preset trigger points that
could use the traffic lighting system to advise operators on the state of the sections of the pipeline
being monitored. This could also involve continuous monitoring of expected results based on
process inputs. Depending on the data evaluation method, research result could be a qualitative
assessment or a quantitative one. This research is based on quantitative assessment as the research
Page 53
53
objective is to identify leak point and quantify the crude oil leak rate or theft. As a result, the data
processing methodology, which could involve input from several sources should be such that the
results of some form of continuous analysis, based on data observations, could be used to identify
leak point and quantify the crude oil that is leaking or being stolen.
Confirmation of hypothesis
Computer simulation experiments were designed and executed for data re processing. The data
reprocessing was to generate intermediate pressure points for use in the testing of the hypothesis
which was reduced to the research question of our ability to monitor leak through pressure
measurement only. The results of the several experiments were progressively converging and
eventually led to the use of vector methods for analysis of experimental results.
Smart operations, as documented in section 4.2: Technology concept selection report page 97 was
selected as a technology concept that could be used for the detection and quantification of leaks
during crude evacuation. As discussed in synopsis of smart operations (page 101) the post leak
data diagnostic method was eventually deployed using vector algebra as developed in section 9.3
on Pressure gradient vector analysis page 176 and selected for the development of the new smart
process for pipeline integrity monitoring. The basis for the selection was based on some analogue
experiment of comparing deflection due to structural loading and change in gradient vector due to
leak.
In summary the technology solution for the crude oil theft monitoring in the Niger delta was
delivered based on a proof of the hypothesis which is based on observed data using vector analysis
of real-time, online pressure measurements based on post-leak data diagnostic smart operations.
Page 54
54
This proof is based on deductive reasoning of the post-leak data diagnostic process based on smart
fields operations selected technology concept.
Page 55
55
3 LITERATURE REVIEW
3.1 Introduction
The current Oilfield reliability-based maintenance process for managing pipeline integrity is based
on plan-do-check loop aimed at continuous improvement. The Plan involves the generation of
integrity failure modes like the rate of corrosion. The Do involves surveillance activities for data
acquisition like corrosion logging while the Check involves a comparison of the plan and the
acquired surveillance data in other to advise on an improvement plan. The data acquisition process
is normally based on non-destructive inspection to monitor and recalibrate rate of corrosion. The
result from the acquired data is then used for remedial activity planning. Such remedial activity
could involve the repair of corroded pipeline sections. Visual inspection can sometimes be used as
a guide where the pipelines are not buried. The data acquisition focus is on material thickness
monitoring and this is usually achieved using logging tools. The logging efforts could be external
or internal. The internal logging tools could be via wireline for vertical pipes as used in oil wells.
Tractor assisted logging tools, or pigs which are pumped with fluid to sweep the pipeline being
investigated are used for logging in horizontal pipelines. One major disadvantage of internal pipe
monitoring however is that they require flow interruptions during such data acquisition operation.
The external logging on the other hand are sometimes not feasible especially where the pipelines
are buried and could sometimes be awfully expensive in deep offshore pipeline inspections.
The concept of hazard and effects management process (HEMP) was introduced as a first step
before delving into the details of seeking solution to the problem of oil theft. The research literature
review was therefore executed in two stages.
Page 56
56
• The first stage discusses technology solutions based on process approach and by
considering strengths and weaknesses of each approach selected the most suitable approach
for detailed literature review.
• A technology literature review for the selection of technology concept for the realisation
of research objectives was thereafter undertaken.
3.2 Hazard and effect management process
The hazard and effects management process is a risk management process that is used to install a
set of barriers to top events (incidents or accidents) and where such events have occurred uses
another set of barriers to prevent escalation. HEMP is specifically tailored to a particular event
after a detailed study of the process that could lead to the event’s top event which is the accident
itself. If we consider a car for example and consider a fatal accident as a top event, then we can
consider the MOT road worthiness of the car as a barrier. We can also consider the weather, the
nature of the road, the mental condition of the driver as barriers. The MOT roadworthiness would
have assessed the vehicle and certified that all HSE systems in such vehicle are functional. Also,
the driver is expected to be mentally alert and not under the influence of any drug such that the
driver can read, obey road signs and promptly re-assess weather effect on roads in his itinerary as
part of journey management plan. However, where these set of barriers fail and the vehicle is
involved in life threatening accident, we depend on another set of barriers, called recovery controls,
to ensure that the impacted passengers are saved. The recovery barriers would include police and
ambulatory services response time, overall city accident response management, availability of
rapid helicopter services and medical emergency evacuation (MEDEVAC) services to save
accident victims. The description above represents hazard and effects management process
Page 57
57
(HEMP) which is widely used in oil and gas industry and is the basis for emergency response
preparedness for any process that could lead to high potential incidents.
A systemic hazard and effects management process for the concept design phase of an autonomous
vessel has been documented (Valdez Banda et al., 2019). The hazard and effects management
process (HEMP) for the design of the top event bow-tie diagram involves:
• Hazard and potential effects identification
• Risk evaluation
• Identification or installation of safety controls or barriers
• Establishment of risk reduction measures
The hazard and effect diagram for managing loss of containment during crude evacuation process
can be represented as shown in figure 11.
Page 58
58
Figure 11. HEMP diagram for loss of containment during crude evacuation.
The HEMP process is a bow tie diagram that is centred around the top event. The high-risk
operation and its control barriers for the prevention of the top event are placed on the left side of
the top event while the potential outcomes and recovery measures are shown on the right. It should
be noted that the barriers could be warning signs informing people of buried pipeline transmitting
crude oil under pressure. It could also be part of the pipeline design and operations to ensure that
the crude is safely contained within the pipeline. On the right-hand side of the bow tie, the recovery
measures could be some early warning signs to inform the operator that some loss containments
have occurred so that the crude evacuation process could be halted to reduce spill and subsequent
explosions and deaths that could arise due to the spill.
The three ways of managing known risks based on the HEMP process are: 1.) reject risk, 2).
transfer risk or 3.) accept and manage risk. E.g., if we imagine travelling at night and in bad weather
Page 59
59
to donate blood to an accident victim in a hospital as a risk. In this given example the potential
blood donor could reject the risk by refusing to travel under the very bad weather at night. The
donor can also transfer the risk by asking for the ambulatory services to come to his or her current
location for the tests and collection of the blood being donated for transfusion. The third option
will involve accepting the risk and taking all necessary precautions to travel at night and in the bad
weather. Ismail Iqbal et al. (2021) described this hierarchical risk management approach as focus
on:1.) risk elimination, 2.) risk substitution, and 3.) risk engineering controls. Some of the
engineering controls, including those related to regulation and legislation in the USA are
documented by Henrie et al (2016)
Applying the same HEMP risk management principles to crude oil evacuation through pipelines,
the option of rejecting the risk is not acceptable. There is no other way of transporting large
volumes of liquid over a long distance on a continuous basis. Also, the option of risk transfer is
not possible. It is near impossible logistically to sell the crude without having a sea terminal from
where ocean-going vehicles could load them. It is also impossible to build inland refineries for a
few cluster of wells. So, we must accept the loss of containment risks during crude evacuation to
export terminals and find ways of minimising risk due to loss of containment. It is hoped that this
research will strengthen the crude evacuation HEMP process by adding either a control barrier or
a recovery barrier in the management of loss of containment during crude evacuation process.
Accident is a product of likelihood of the occurrence of an act, like crude loss of containment
during evacuation, and impact of the occurrence of such act (spill, explosion and deaths). The fact
that a particular incident has a low likelihood of occurrence does not imply that it could not happen
and hence HEMP ensures that suitable barriers are installed to reduce the likelihood of any high
potential accident. The control barriers in the HEMP diagram could be in any form. Using the
Page 60
60
example of vehicle accident HEMP described above, such barriers could be physical e.g., HSE
critical systems in the vehicle but it could also be regulatory e.g., thou shalt not drive under the
influence of alcohol. Other regulatory barriers include installation of road signages specifying
direction and speed limits. Similarly, loss of containment barriers for crude evacuation process
could be regulatory or physical. Regulatory controls would include design and approval processes
for authorization of pipeline installation and approvals. Physical barriers would include the
materials type, thickness used for the pipeline installation, monitoring equipment used for integrity
monitoring of the pipeline during operations etc. On the other side of the HEMP bow tie, the
recovery measures that could be installed could include timely detection of leak such that the
pumping operations can be timely stopped to reduce the likelihood of deaths due to explosion.
Other recovery measures would include the organisations emergency response (including
MEDEVAC) preparedness. There are also operational fines and punishments to organisations for
leaks due to carelessness, indolence, and dereliction of duties, among other regulatory controls.
3.3 Technology preselection review
A leak detection taxonomy from Pipeline Leak Detection Handbook is presented in figure 12
(Henrie, Morgan; Carpenter, Philip; Nicholas, 2016). Henri et al (2017) has grouped pipeline
detection technologies into two broad themes: Incidental observation and design-based leak
detection systems. The design-based leak detection system was further regrouped as those based
on external sensors and those based on internal sensors.
Page 61
61
Figure 12. Leak detection taxonomy (Henrie et al, 2017)
Based on the pipeline leak detection handbook and for the purpose of this research, the leak
detection systems can be grouped as :
• Incidental observation
• External sensor-based systems
• Internal sensor-based systems
Incidental Observation
Observation is one of the oldest process applied in leak detection. Whether it is an accidental
discovery of oil seeping out of a farmland, oil sheens on local streams, contaminated potable water
Page 62
62
table, smell of oil vapours in the air we breathe or abnormal pressure changes at operations control
centre, this incidental observation gives an indication of leak or theft. Also, the inability to receive
all that is pumped is also an indication of leak or crude oil theft. Usually, any incidental leak
observation is reported to local authorities or the operator for detailed investigation, clean up and
repairs. Part of the recovery measure in this case would be to stop the pumping operations, cordon
off impacted areas, provide emergency water and food to the local communities while the
remediation process is ongoing. It should be noted that in most cases such leaks could have gone
on for a very long time before being detected. In some cases, e.g., seepage to a farmland, the point
of detection could be used to detect the source of leak while in other cases e.g., contaminated water
from shallow potable reservoirs could be a nightmare as such shallow potable water reservoir may
be laterally extensive. This approach, though not reliable as the only source of leak detection has
a major shortcoming that the leak can go one for a long time before being detected and is incapable
of detecting crude theft as crude theft most times does not lead to loss of containment to the
surrounding.
External sensor-based systems
The use of soldiers, dogs, helicopter overflies or satellite images for surveillance of the pipeline
ROW are geared towards investigating leak source using optical, thermal, infra-red, acoustic, dyes
and tracer equipment for leak surveillance. These operations monitor: air quality for hydrocarbon
content; the location of thieves; oil sheens on farmlands or on open water surfaces and, can be used
to determine leak due to loss of containment from any evacuation pipeline. It should be noted that
crude theft most times do not lead to loss of containment because rogue conduits are attached to
redirect some of the crude flow to stationed rogue vehicles. This therefore means that even though
Page 63
63
the control room observers are able to determine that some crude theft is ongoing, such activities
will not be observed through air, soil or water sampling or observation. The helicopter overflies
are aimed at locating the operations of the crude oil theft by seeking out freshly excavated soil
locations in dense vegetations. Another downside to the use of external based sensor systems to
monitor crude oil pipeline theft is that the thieves are observant and would employ suitable means
to avoid being caught. Such means could involve hot tapping at night or during poor weather when
it is obvious that helicopter overflies cannot take place. Also, even when the observation process,
especially at operations control centre, is able to detect some crude theft it will not be able to
exactly point where the theft is ongoing, and this limits the application of the observation process
for crude theft point prediction.
Some of the external sensor systems that could be very useful in this research, as documented by
Henrie et al (2017) include fibre-based commodity sensors, fibre optic sensors and dielectric cable.
This research is not about leaks in commodity pipeline transportation, so the use of commodity
specific sensors was not considered. Dielectric sensor technology is a post leak environmental
monitoring technique for measuring the thickness of layered films and hence is not considered in
this research which aims at leak prediction or prognostication. The only suitable technologies from
these set of external based sensor systems are acoustics and fibre optic sensors.
Internal sensor-based systems
Internal sensor-based leak detection systems can be based on deviation trending and mass balance.
Also, the use of pigs and smart pigs can be used to detect leak point as documented by Henrie et
al (2017). These internal leak systems are most relevant to this research. The use of pigs and smart
pigs will be discounted because they require production interruption and hence outside the
Page 64
64
operational domain of pipeline operations. The use of free-swimming detection systems which can
also be described as micro robots were considered useful but still at its developmental infancy.
Summary of technology process review
Based on the preselection leak detection technology review we can progress this research through
a detailed literature review of internal sensor-based systems and some external based sensor
systems. Most of the leak detection systems based on external sensors are not applicable because
a leak must have happened before the can be useful. In some of the internal systems, a leak may
also have happened, but the operational design of such leak detection system is to reduce the
response time between the leak and the activation of emergency actions to stop operations and
arrest loss of containment escalation.
The available technology for leak and intrusion detection could, based on the foregoing, be
hardware based or software based or a combination of both. The hardware methods require
physical measurements which could be using acoustic, optical, ultrasonic, or some form of
environmental monitoring like soil, surface water, or air quality sampling. Software based methods
involve the use of algorithms to continuously monitor the state or rate of change in pressure,
temperature, flow rate in a closed system (Murvay & Silea 2012). The trends of such parameters
and deviations therefrom could be used to predict leak and this could be achieved without the
requirement for flow interruption.
Prior to the onset of regular pipeline vandalism in Nigeria, it was thought that every spill is related
to operation (corrosion, pressure mismatch or some system upset). However, the review results
following every spill showed that most of the spills since 2000 were due to vandalism. This
Page 65
65
operating environment motivated the international operating companies (IOCs) to collaborate with
Nigerian regulators and host communities to set up a joint investigation team (JIT) after every spill
for incident reviews. The team agreed among other things, that a way of preventing vandals from
benefiting from crime would be to ensure that post spill compensation will no longer be paid to
any host community if the JIT review reveals that any spill was because of vandalism. This
temporarily stemmed down the rising trend in spills due to vandalism until the vandals discovered
that they could make more money siphoning and selling the crude rather than receiving stipends
as compensation due to loss of farming or fishing revenue from spills.
Environmental monitoring methods, or external sensor-based leak detection systems, are outside
the scope of this research because a loss of containment need to have occurred for these methods
to be effective. The technologies based on mass balance, real time transient modelling, acoustics,
pressure point analysis, statistics or digital signal processing, optical cable sensor, and ultrasonic
flow metering were assessed as attractive. Some of these technologies could be combined e.g.,
corrosion monitoring could be based on statistical sampling for update of existing integrity models.
Also, mass balance, real time transient modelling, and pressure point analysis could be combined
into some form of smart operations monitoring technology. Pigging, which is a standard oil pipe
sweeping operation, is the process of pumping some specially designed cylinders that are called
pigs, whose external diameters are slightly less than the internal diameter of the pipes they are
designed to sweep. Any pipeline designed for pigging operation must have a pig launching pad
and a pig retrieval pad and these pads demand some production interruption during pig launching
or retrieval, respectively. Some delivery lines are designed for pigging while most trunklines are
not. Smart pigs have multi-finger callipers for monitoring the respective pipeline thickness at
respective pipeline sections during the pigging process. The use of pigging technology for
Page 66
66
trunkline integrity monitoring will not be progressed further because such technology requires
production interruption which is not desirable in major evacuation trunklines.
A detailed technology literature review of some of the more promising technologies for pipeline
integrity monitoring is presented below.
3.4 Technology literature review
Fiscal reconciliation
Crude oil is measured at different stages of its flow: at wellheads, manifolds, flow stations, central
processing facilities (CPF), up to central tank farms (CTF) or oil terminals where they are sold or
exported. Some differences, between the total crude evacuated from producing wells and total
receipts at the terminal, are usually noted during the transport process from the wellhead to the
CTF. These differences are either due to different meter accuracies, shrinkage losses due to
temperature variations, liberation of dissolved gasses, or due to leaks. The differences due to
different meter accuracies, shrinkage losses due to temperature variations, liberation of dissolved
gasses are usually minor and at most could account for a maximum of about five (5) percentage
variation. As long as these differences are within this 5% pre-set limit the difference can be
acknowledged as an acceptable reconciliation loss but if the difference is large it could be due to
an abnormal causes like pipeline leakage or pilferage that needs to be attended immediately
(Chebiyyam, 2010).
One of the early signals that some crude theft is ongoing is a comparison of the fiscal reconciliation
of the total fluid received at the export terminal to the summation of all the crude pumped into the
pipeline export route. This reconciliation process could be single or multi-staged, but most
Page 67
67
operators choose two stage reconciliation process. The single stage reconciliation process involves
the comparison of the total well head tests and the total oil receipts at the tank farm. A two-stage
reconciliation involves a 1st stage reconciliation between the oil terminal or tank farm and the
several flow stations supplying to the tank farm. The 2nd stage reconciliation uses the single stage
RF to back calculate what the intermediate stage reconciliation would be. This process could yield
the sections of the pipeline network that could be investigated due to their low RFs. There could
be additional reconciliation stages, but some form of measurement is needed for each additional
staging in the reconciliation process. Example, there could be an intermediate reconciliation
between the flowstations and the terminal at major manifolds. This would mean that we must have
a means of measuring what flows through those major manifolds. Fluid reconciliation factors
would usually get close to 1.0 without leaks or crude theft but drifts away from 1.0 depending on
the rate of leak or theft. A reconciliation factor of 0.95 is acceptable as some shrinkage losses are
expected as the crude is pumped for export. However, an RF of 0.75 implies that one out of every
four barrels produced is stolen. Helicopter overflies are usually undertaken by operators to check
for oil spills or recent soil excavations along the pipeline ROW once consistent low RFs are
recorded.
A major disadvantage of using fiscal reconciliation surveillance technology is that it is a post-
mortem approach. Fiscal reconciliation is also an end month activity as required by standard
oilfield practice and regulation hence the oil theft could have gone on for a long time before the
end month reconciliation time. Also, any reliance on fiscal reconciliation for leak or intrusion
monitoring would therefore require huge operational upgrade as additional process instruments
may have to be installed. Multistage reconciliation could be employed if we need to know the area
of leak position to some coarse accuracy, but this will increase the system operating costs and
Page 68
68
while the use of such technology could coarsely indicate an area of potential leak or crude theft it
is unable to point the exact position within that area.
Corrosion monitoring
Fatigue stress initiation in pipelines could be attributed to corrosion, manufacturing defects or
operational effects whose growth could be enhanced by cyclic loading caused by the operating
pressure of the transported fluids (Ossai et al. 2015; Shabarchin & Tesfamariam 2016). All pipeline
structures are subjected to varying and fluctuating pressure stresses and are exposed to harmful
environments externally and corrosive environment internally during their service life. The fluid
composition of the hydrocarbon being evacuated, especially the presence of carbon dioxide, could
lead to internal corrosion. To counter the effects of this operating environment special
consideration is usually made during the specification of pipe thickness, pipe physical properties,
and the martensitic treatment for pipeline steel.
Corrosion monitoring involves the use of a material scientific data to predict the pipeline material
thickness loss per unit time in any given service environment. These performance data, for the
respective service environment, are based on manufacturers experiments. Once a corrosion model
has been made, the operational integrity monitoring would involve regular data acquisition for
continuous update of created model for the prediction of pipeline failure. The frequency of data
acquisition depends on service conditions and could be changed with time to manage assessed
risks. Within the E&P business, each operating company use their proprietary software to predict
corrosion rates in terms of wall thickness reduction per unit time and use such data to determine
design safety factors during pipeline design, installation, and operation. Regular operations
monitoring is undertaken by such companies to determine actual corrosion rates during operation.
Page 69
69
Hence, based on design and operations PM surveillance programme, the state of most pipelines
could be said to be known. However, one of the major hindrances to pipeline integrity monitoring
using PM surveillance approach is accessibility to these pipelines for corrosion rate measurements.
This lack of access could be because of urban encroachment, obstructions, or legacy issues that
make the host communities hostile and hence prevent operators from having required access for
surveillance operations.
Despite these detailed understanding of corrosion mechanisms and improved corrosion monitoring
techniques, industry reports still show that internal corrosion still plays a significant role in pipeline
failures. For example, according to an Alberta Energy Regulator report (AER, 2013), from 1990
to 2012, more than 9000 failures occurred due to internal corrosion, and these failures accounts
for 54.8% of all spills in that area. It should be noted that leaks due to corrosion happen, not
necessarily because of the corrosion, which is always there, but due to lack of proper assessment
of the extent of corrosion or lack of adequate mitigation actions based on assessed corrosion risk.
Typical mitigation actions could include reducing the operating pressure of such pipeline so that
they can still operate within their designed safety factors based on the estimated wall thickness
reduction. Pipeline loss of containment spills will therefore not occur if pipelines are continuously
de-rated based on measured or estimated thickness reduction due to corrosion or decommissioned
when the de-rated pressure are no longer enough for sustained crude evacuation.
As a result of the foregoing discussion, which is based on over five decades of oilfield practice in
the Niger delta, it could be said that the current use of preventive maintenance (PM) and corrective
maintenance (CM) actions are effective though not sufficient for pipeline integrity monitoring.
What would be needed therefore in this technology area is due diligence in data acquisition for
continuous corrosion monitoring update. The results from such model update could be used to
Page 70
70
generate heat maps for planning of CM actions which can include pipe cladding, pipeline sectional
replacement, or for the determination of abandonment conditions for the entire pipeline. One other
option for the use of corrosion monitoring could be in the design of some early warning systems
prior to leak. Such an early warning system could be based on the model generated heat map or
could involve the use of probes, as shown in figure 13. The probe in figure 13 (ALABAMA
SPECIALTY PRODUCTS, 2020) will be made with the same material as the pipeline and properly
sized to the pipe material thickness such that they would give signals when some pre-set material
thickness, say 50%, is lost. This technology is what is currently used for measuring sand erosion
in oil and gas transport pipelines and could be used to monitor pipeline material deterioration of
any type. This approach could be used as a guide for pipeline de-rating prior to its replacement.
Figure 13. Corrosion monitoring probe schematics (Alabama Specialty Products, 2020)
Figure 13 shows how the use of probes can be installed as part of the pipeline system. The probe
is in the form of a tube and made with the same material but sized to measure a thickness reduction
that is critical to the operation of the given pipeline. During the crude evacuation process, the
installed probe would corrode with the pipeline but since it has a smaller thickness it would wear
out faster than the enclosing pipeline. Once a wear threshold is attained a wear creates a hole in
Page 71
71
the probe and this will be sensed and measured on the attached pressure gauge and this would
signal a designed thickness reduction due to internal erosion or corrosion.
This combined use of PM and CM for corrosion monitoring was an effective process for pipeline
integrity monitoring until the onset of pipeline vandalism for crude oil theft. The PM and CM
process approach still supports a statistical approach for reliability prediction but could be
upgraded to some level of smartness using heat maps or sacrificial probes, but these would come
with additional capital and operating costs. The use of probes needs further research to see how it
could be accommodated in the trunkline design changes. The use of corrosion monitoring can be
used to create a Pre-leak data prognostic method as discussed on page 118 but a major disadvantage
for corrosion monitoring is that, since it is based on statistics, it would not be able to detect the
exact point of leak and it is also not designed to measure the leak rate.
Hydraulic flow simulation
Hydraulic flow simulation is an attempt at replicating actual hydraulic flow process from one point
to the other in a closed system. The hydrocarbons flow from the subsurface reservoir to the
wellbore and then from the wellbore to the wellhead. Then from the wellhead to the gathering
stations where the hydrocarbons are stabilized after separation into gas and liquid or sometimes
into gas, oil, and water. The stabilized crude from the flowstation is then pumped to the export
terminal where further stabilization is executed at holding tanks to meet export quality prior to
sales. The wells in onshore operations could be spread over acres of land and the crude are required
to flow naturally or artificially assisted to some considerable distances to the gathering station
where some separation is done, and stabilized crude pumped to the export terminal that could be
several tens of kilometres away. Figure 14 (Corken, n.d.) show a schematic cartoon of a typical
Page 72
72
onshore network from reservoirs up to the gathering stations that could be simulated to get
solutions that can be continuously monitored for production optimization and remedial activity
planning. It should be noted that some wells are free flowing and so are described as natural
producers while others that produce from depleted reservoirs are incapable of sustaining natural
production and hence are assisted manually or electrically. These later categories are classified as
assisted production or artificially lifted wells. Bean pumped wells as shown in figure 14 and jet
pumps are non-naturally producing wells. Other form of vertical lift assistance includes gas lifting
and several forms of electrical pumping (electrical submersible pumps, screw pumps etc.).
Page 73
73
Figure 14. A typical onshore network from reservoirs up to the gathering stations (Corken, n.d.)
The PETEX IPM3 suite is one of the readily available hydraulic flow simulators and is widely used
for hydraulic simulation in the oil and gas industry. Petroleum engineers use this workflow as part
of their routine operations. Some of the results from this workflow using IPM suite in the industry
to demonstrate the software capability in several operating units around the world have been
published (Layer et al. 2011; Montero & Nwankwo. 2010; Omole et al. 2011; Pothapragada et al.
3 PETEX IPM is a flow modelling software from Petroleum Experts. https://www.petex.com/products/ipm-
suite/
Page 74
74
2012). These reviews show that the IPM tool can be used to accurately model hydraulic flow from
reservoir to the flow stations and can be used to forecast oil and gas productions from such
hydraulic systems. Figure 15, which is typical of a Niger delta Operations, shows a modelled
network generated for twenty-six reservoirs, sixty-nine wells, and two flow stations. This model
is presented to show how the research objective of monitoring oil leak or pipeline vandalism could
be realized through technology extension of the IPM proven capability for modelling fluid flow
from wells up to the flow station. If we can model flow from wells to flow stations, then we could
also model fluid flow from flow stations to export terminals at the same level of accuracy.
Figure 15. Simulated hydrocarbon flow network
Page 75
75
Figure 16. Matched performance and forecast from simulated flow network.
Figure 15 is a simulated hydrocarbon flow schematic from reservoirs through wells up to two
gathering stations. It should be noted that the flow described here is a natural flow through a 4-
inch flowline, but the concept is applicable to stabilized fluid pumping through trunklines. Figure
16 shows the matched performance from December 2014 to September 2016 from the created
IPSM model as well as forecast production from October 2016 to December 2020. The simulated
result compares reasonably well with actual production. The observed gap between the simulation
result and the actual production is noted but still acceptable because the production data used in
this analysis is already reconciled and hence has already been affected by some production losses,
described in section 3.4.1, through the larger production network for the operating unit. The use
of hydrocarbon flow simulator to forecast production could be designed and used to monitor
Page 76
76
conformance to predicted performance and hence determine leak points and rate of crude that are
either leaking or being siphoned by oil thieves.
What is required in support of this leak detection and quantification research process (Hypothesis
– Data observation – Confirmation of Hypothesis) as documented in Research process page 50
therefore is flow simulation and forecasting of the volumes, pressures and temperatures that would
be flowing through the respective sections of any evacuation pipeline for comparison with actual
performance. The downside to this modelling approach, based on current practice, is that measured
data are only recorded at only three distinct points: at well test points, the flow station export
points, and the export terminal. This therefore means that if there are leaks, we would know that
leaks have occurred due to fiscal reconciliation, but the exact point of the leak may not be known
except with increased monitoring points. A lot of monitoring points would therefore be needed if
we must reduce the uncertainty associated with the actual leak or theft point prediction using this
technology.
Smart fields operation
Smart fields operation is an artificial intelligence workflow that uses instrument sensing, computer
modelling or simulation, and SCADA to partially perform human tasks aimed at reducing the
decision cycle time for data-based decisions as well as managing production data uncertainties.
The most common data needed for smart field operations are pressures, temperatures, and volume
flow rates. These data are needed for complete description of hydrocarbon recovery and
throughput from the reservoir to the export terminal. Starting from the wells, through the
flowstation, up to the export terminals, sensing devices could be installed as part of smart
operations to monitor pressures, temperatures, and flow rates. Figure 17 shows a typical smart well
Page 77
77
concept for producing and commingling three reservoirs within a well. Specifically, the Smart
completion components include control lines for sending open and close signals to interval control
valves (ICVs), electric lines for recording pressures and temperatures from installed gauges in
addition to all the other safety critical equipment like production packers for hydrocarbon process
containment. In this case, which was a project undertaken for an operator in the Niger delta, the
pressure gauges were designed to measure both the internal pressure of the fluid being produced
as well as the external pressure of the surrounding production annulus as part of the well integrity
monitoring process. Readings from these sensors are remotely monitored and signals could also
be sent to this well which is about 11000 ftss for production system optimization. Such
optimization could involve closure of watered out or gassed out intervals for increased production
of valuable crude oil. It could also include opening the chokes from each contributing reservoir for
production optimization. An inbuilt advantage of such smart well, for which a digital twin can be
created based on Hydraulic flow simulation, would eliminate expensive rig operation for well
repairs for accessing new zones.
Page 78
78
Figure 17. Smart well design and components
The smart field operations for data acquisition, transfer, monitoring, simulation and interpretation
from the reservoirs, wells, flowstations, pipeline manifolds up to the export terminals have been
studied and documented (Goel et al. 2013; Cullick & Sukkestad 2010; Montero & Nwankwo 2010;
Omole et al. 2011). An improved process for the allocation of hydrocarbon throughput from
different flow units within the reservoir using the smart workflow based on Hydraulic flow
simulation have also been studied and documented (Edih, M., Nnanna, E., Nwankwo, C. 2016 )
and (Mabel Pei Chuen et al., 2017). A similar process improvement could be crafted for trunklines
and used to address the research hypothesis which has been crafted as:
Page 79
79
If we have a way of continuously measuring the steady state conditions at
regular intervals (say 5km or 10km) on a given pipeline during operation, then
we could, through deviations trending from the steady state operation,
determine the point of leak or crude oil theft and quantify leak rate or theft.
If Edih et al (2016) and Mable et al ( 2017) have demonstrated that, through the use of smart
operations modelling, the flow contributions from the different sections of a well could be
determined accurately, then through the same workflow we could determine the leak points and
leak rate from the respective sections of any given trunkline through deductive reasoning as
documented on Research process page 50. The smart field flow configuration could be broken into
convenient nodes like the reservoir node, the wellhead node, the flowstation node etc. such that
real-time data from these nodes could be matched with modelled data to determine if there is a
deviation between the model prediction and actual performance. Using a properly calibrated model
there would be little deviation between the model prediction and actual measurements from the
installed gauges. This therefore means that any major deviation between a properly calibrated
model prediction and actual measurements will be attributable to leak or theft. As a result of the
foregoing, the smart field operation concept could be used to install more measurement devices on
trunklines such that we can record data that can be used to compare the flow through various
sections of the trunk line to determine if some of the crude being pumped are leaking or stolen.
This use of smart operations capability could be a particularly good fit to the research objective of
leak or theft points determination and leak rate (or theft rate) estimation. Smart operations
technology could be used as a standalone technology or could be combined with Hydraulic flow
simulation to accurately determine the rate of leak using digital twinning as documented in section
9.6.2 on Digital Twining in pipeline fluid evacuation process page 199. The downside to this
Page 80
80
technology is that due to operations design limitations wet flow measurements for volume flow
rate is still a challenge in oil trunklines. There are also challenges on how to deploy suggested
additional pressure measurement points without compromising the installed pipeline integrity as
every pressure monitoring point is a potential leak point.
Fibre optic sensing
A fiber optic sensor uses optical fiber either as the sensing element, or as a means of relaying
signals from a remote sensor to the electronics that process the signals. Depending on the
application, fiber optics may be used because of its small size, or because no electrical power is
needed at the remote location, or because many sensors can be multiplexed along the length of a
fiber by using light wavelength shift for each sensor, or by sensing the time delay as light passes
along the fiber through each sensor (Wikipedia, 2017). Some of the several applications of fibre
optic sensing technologies include the use of fibre gratings, fibre optic cables and distributed
temperature sensing technologies. The use of fibre Brag grating (FBG) and fibre optic sensors for
monitoring, diagnosis and control in civil structures as well as in pipeline leak detection has been
studied and documented (Ahadi & Bakhtiar, 2010; Davis & Brockhurst, 2015; Ko & Ni, 2005; H.-
N. Li et al., 2004; Majumder et al., 2008; Murvay & Silea, 2012; Tanimola & Hill, 2009; Yan &
Chyan, 2010). In particular the application of fibre optic leak detection and third party intruder
detection methods have been successfully demonstrated to provide non-intrusive digital pipeline
monitoring by acting as an early warning system, allowing operators to act swiftly in the event of
a pipeline leakage or intrusion into a plant area or leakage into the environment (Davis &
Brockhurst, 2015; Murvay & Silea, 2012; Tanimola & Hill, 2009).
Page 81
81
The use of fibre optic for pipeline leak detection involves running and strapping the fibre optic
cable along the full length of the pipeline for sensing the external temperature of the pipeline being
investigated. The principle for leak detection using distributed temperature sensors (DTS), external
to the pipe being investigated is that the thermal signature of the product that is being carried in
the pipeline (gas, LNG, oil, water, ethylene, ammonia) will be significantly different from that of
the environment surrounding the pipeline (Kim & Lee, 2009). Therefore, any breach in the pipe
work will cause a release of fluid from the pipeline into the atmosphere which will be noticed by
the sensors because of temperature difference. This technology could also be applied in subsea
pipelines as the distributed temperature sensor is able to record subtle temperature changes due to
fluid release because of its sensitivity. Unfortunately, because this technology is installed external
to the pipeline it is not possible to estimate the rate of leak even if the leak point is accurately
identified.
Fibre optics also has a very wide internal usage for pipeline investigation, especially in oil and gas
well completion. They are installed as part of the well completion, especially in horizontal wells
and used to show the sections of the horizontal wells that contribute to inflow. They could also be
used, for horizontal wells to show which sections of the horizontal wells that are contributing to
water production instead of oil and this knowledge are useful in remedial water shut off operations
planning. The sections of the well flowing oil will display a higher temperature while the sections
flowing water would be cooled down due to the contrasting specific heat capacities between oil
and water. Within the Well, fibre optics has also been used to monitor wellbore integrity through
continuous temperature logging to determine temperature difference between the flow conduit and
its annulus.
Page 82
82
Notwithstanding these huge potentials, a limiting weakness to this technology is that it is not
tamperproof when used outside a confined space like the pipeline. Even though a severed fibre
optic line could trigger an alarm, when severed, it is usually difficult for the operators to know the
exact point of discontinuity especially if deployed in the monitoring of a long pipeline. Some of
the pipeline vandals in the Niger delta are technically experienced professionals or employ the
services of such professionals as documented in Research motivation. This means that the vandals
could disable fibres if installed exterior to the trunklines. Another downside to this technology is
that it is expensive, difficult to diagnose problems, and sometime exceedingly difficult to repair.
Even within a secure subsurface environment, attempts to re-light these fibres when they fail in
the past have proved abortive and these could lead to huge cost and value erosion. All these
disadvantages make the use of this technology impractical at monitoring leak point in an open
environment.
Frequency response function modelling
One property of steel pipes and rigid structures especially those made with high carbon steel is
that, within their elastic limit, they are capable of springing back to their original state after
perturbation. The frequency response function (FRF) or dynamic response function (DRF) which
is a measure of the ratio of the output to the input signal for a given system has been used for the
identification of system characteristics in engineering. The DRF of a system response, at any load,
can be described by the ratio of amplitude of output to input function (F. Haghighat and D.M.
Sander, 1987).
Any continuously varying force (tension, compression, and torsion) on any steel material will
generate responses that could be used to calculate a DRF. Internal pressure on pipes could also be
Page 83
83
monitored and used to generate a DRF. A DRF example based on sea wave force effects on a
shallow offshore platform was studied and modelled in ABAQUS4 to demonstrate this concept
and how it could be used to predict structural failure (Nwankwo, 2013). The ABAQUS finite
element analysis (FEA) suite was used to design an offshore structure for a 30m water depth as
shown in figure 18. Using some designed wave parameters, the wave forces estimated using the
Morrison equation was used to model the effect of the wave forces on the designed structure. The
DRF for each structural member were calculated as a ratio the maximum dynamic stress to that of
the corresponding static load. Figure 19 shows the calculated DRF of on this designed structure
for various angular frequencies and time. To verify the effect of structural failure on calculated
DRF, a pair of the bottom braces of the designed structure was removed to simulate structural
damage. Figure 20 shows how the DRF would be if one of a pair of the bottom braces fails as
simulated.
4 ABAQUS is a software suite for finite element analysis and computer-aided engineering, originally released in
1978. Available at: https://www.3ds.com/products-services/simulia/
A B
Figure 18. ABAQUS simulated offshore structure and its response to water wave (Nwankwo, C., 2013).
Page 84
84
Figure 19. DRF of simulated offshore structure (Nwankwo, C., 2013)
Page 85
85
Figure 20. DRF of simulated structure with failed pair of bottom members (Nwankwo, C., 2013)
Page 86
86
As could be seen from figures 19 & 20, the DRF of the failed structure is significantly different
from that of the original structure prior to failure. This analysis demonstrates that DRF monitoring
could be used to analyse structural failure.
The trunk lines are made with steel and hence the use of DRF could be investigated for application
for failure monitoring if intelligently designed. In the example described above the DRF was based
on force and fracture failure and was evaluated for two bottom braces. The use of force and fracture
failure cannot be applied on fluid evacuation pipelines using DRF as described above. However
small leak holes which could be said to represent pipeline burst could be analysed in pipeline
evacuation systems using the DRF concept. Some of the measurable changes caused by pipeline
burst or continuous leak could be observed as vibration or sound. Hence vibration or noise signals
generated during crude evacuation process could be used to generate DRF and by similar
comparison used to possibly detect leak. The merits, demerits, and how the use of vibrations and
acoustics could be used to determine the point of leak using the frequency response function is
discussed below.
3.4.6.1 Acoustic emission modelling
Sound and temperature logging are proven technologies for detecting leaks within oil and gas
wells. The oil or gas well is made up of pressure vessels within pressure vessels and hence any
leak from an inside vessel (tubing) will be observed as a pressure increase on the outer vessel
(casing). The tubing is designed to convey oil and gas within a pressure envelope that is determined
by the reservoir pressure gradient. Where a leak occurs in the tubing due to erosion, corrosion,
mechanical connection failure etc., the tubing pressure is transferred to the production casing.
Since the production casing is of bigger diameter it may be unable to withstand the Well’s closed-
in tubing head pressure (CITHP), hence there is an urgent requirement for an investigation and a
Page 87
87
risk assessment. Such investigation is to determine the point of leak while the risk assessment is
to determine some necessary actions to mitigate against loss of containment, according to Hazard
and effect management process as documented on page 56, while planning for remedial actions to
fix the identified leak. Such investigation could involve sonic or temperature logging to record
minute changes in temperatures or sound while the well is flowing. Through this logging technique
the source of leak could be precisely determined with great accuracy. A major enabler to this
technology is the fact that most of the wells are vertical or slightly deviated such that wireline
logging devices can be delivered with the aid of self-weight or aided with some sinker rod. Figure
21 is an example of temperature and acoustic log acquisition for leak detection in a vertical gas
well in the Niger delta.
Figure 21. Temperature and acoustic logs acquired during leak investigation in a gas well.
Page 88
88
As can be seen from the well sketch, the A annulus is the space between the 7-inch production
tubing and the intermediate 95/8-inch casing while B annulus is the space between the intermediate
95/8- inch casing and the outer 133/4 -inch casing. The CBL on the log header is a log describing
the cement bond logs between the casings and their respective formations. GR is the gamma ray
log for the description of the sand and shale formations. TEMP is the temperature log at respective
depths in degrees Fahrenheit. The problem in this well is that there is a tubing leak that led to a
pressure in the A annulus which also led to an additional leak to the B annulus. To investigate the
source of leak, a leak investigation programme was executed through log data acquisition inside
the 7inch tubing. All logs are acquired while logging upwards. The first operation TEMP is a
record of well temperature while well was flowing. Thereafter the well was shut in and a sonic log
is recorded to listen to sound as shown in the different modes as described below:
• SNL SHUT-IN: Well shut in.
• SNL (BLEED-OFF B-ANN): Well shut in with B annulus pressure bled off.
• SNL BLEED-OFF A-ANN: Well shut in with A annulus pressure bled off.
The logs aSNL(BLEED-OFF B-SHUT-IN), and aSNL (BLEED-OFF A - SHUT-IN) are
derivative logs used for the analysis of potential leak paths. The leak investigation reveals two
large leaks between 2800 ftah and 3600 ftah and around 6300 ftah and two other minor leaks at
7900 ftah and 11050 ftah. This example documentation is to highlight that sonic logs is continually
used to accurately locate leaks in oil and gas wells and make a case that such technologies could
be applied to pipelines.
The advantage of gravity assisted logging opportunity does not exist in crude export pipelines as
most export pipelines are horizontal or near horizontal. This therefore implies that the logging
tools needs some form of conveyance system for internal trunkline acoustic or temperature log
Page 89
89
acquisition. These traction tools are available and used in oil and gas subsurface operations.
Experiments have demonstrated that some form of traction could be applied as a form of intelligent
pigging and used to drive noise or temperature logging tools for leak detection in horizontal
pipelines (D. Lee et al., 2012; Nee et al., 2015). There are indeed tractors for logging of horizontal
oil and gas wells. Unfortunately, the introduction of traction system to crude evacuation pipelines
introduces some other problems. Any form of traction equipment, for example, requires some form
of power and the development of intrinsically safe batteries for use inside highly inflammable
hydrocarbon and is still an evolving technology that is not yet recommended (Recommended
Practice for Occupational Safety for Onshore, Edition 2007). Also, such intrinsically safe battery
still needs to pass the test of having enough power to convey the logging tool through the entire
length of the pipeline which are usually in the range of tens of kilometres. Other considerations
for internal noise logging in pipeline would be the risk of getting stuck and the need for production
interruption for the launching and retrieval of these tractor conveyed logging tools. Even in
situations where there is no major shortcoming for the application of logging for leak investigation
on a pipeline, the fact that there is a loss of containment has already created a major emergency
and hence the luxury of allowing the loss of containment to go on while planning to design a
logging programme is unacceptable. This is in contrast to oil wells where the leak on the tubing is
contained by the outer casing such that we can keep monitoring the effect of such leak on the
casing while planning a logging programme to identify the leak source.
A similar effect of internal logging could be derived through noise sensing outside the
circumference of the trunkline. So, if there is a way of placing the noise logging tools at several
points external to the trunkline being investigated, then through these noise sensors leaks could be
detected. This use of acoustic technologies for external pipeline leak detection has been
Page 90
90
demonstrated to varying degrees by several researchers (Ahadi & Bakhtiar, 2010; Ben-Mansour
et al., 2012; da Silva et al., 2005; Davis & Brockhurst, 2015; Jin et al., 2014; Kam, 2010; Kim &
Lee, 2009; P. J. Lee et al., 2005; S. Li et al., 2014, 2016; Majumder et al., 2008; Murvay & Silea,
2012; Tanimola & Hill, 2009; Yang et al., 2008). The most recent studies focussing on acoustic
response function was documented by Ahadi & Bakhtiar 2010; Jin et al. 2014; Kim & Lee 2009;
Li et al. 2016; Li et al. 2014; Tanimola & Hill 2009. Most of these research works are based on
laboratory experiments and hence have not considered the background noise that could affect the
acoustic signal due to hydrocarbon leaks. Such noise could be from moving vehicles and trains,
tidal movements etc. There is also a need to consider noise attenuation in buried trunklines as well
as how to distinguish the noise due to leak and those due to hot tapping process. The strength of
this external acoustic technology could be harnessed and used to monitor hot tapping which is one
of the objectives of this research. A major downside however is that this technology, while it could
accurately determine the point of leak it would need a lot of auxiliary instrumentation to determine
the rate of leak or stolen crude.
3.4.6.2 Vibration modelling
Some of the measurable properties of steel structures subjected to axial load are strain and
deflection and these could manifest as vibration. Vibrations monitoring is one of the commonest
studied technology for monitoring of structural health (Abdelghani & Benveniste, 2000; Colombo
et al., 2009; Deraemaeker et al., 2008; Horizon & Group, 2011; Kopsaftopoulos & Fassois, 2010;
P. J. Lee et al., 2005; S. Li et al., 2014, 2016). Past deployments of this technology focused on
bridges, high rise buildings, and offshore platforms. This is primarily because such mega structures
display movements which could easily be measured and amplified. This therefore enhances the
use of DRF workflow for detection of deflection. However, the use of vibration monitoring
Page 91
91
technology for pipeline leak detection is still novel. This is primarily because vibration, as a
response to stimulation, is an oscillation about an equilibrium point and hence a significant force,
much more than the pressure pulses generated during crude evacuation on trunklines, is required
to create any easily measurable vibration on large pipelines with diameters ranging from 12 to 36
inches. The pumping of crude oil through pipelines does not create the same level of oscillation
on the pipeline as with vehicles travelling on long bridges for example as documented in research
works. Also, because trunklines are large in diameter (12 – 36 inches in diameter) there is a limit
to the evacuation pressure that could be applied to avoid pipeline burst hence there is a limit to the
level of vibration during trunkline crude evacuation. This very minimal vibration will therefore
demand extremely sensitive instruments for vibration monitoring. This is unlike the case during
subsurface reservoir stimulation treatments where large treatment pressure in the range of over
3000psi are used to pump stimulation chemicals through small 3-inch chiksan pipes. The level of
vibration in such stimulation operations are so large that steel ropes must be used to anchor the
chiksans together and lock them to permanent fixtures to restrain them from “flying off” during
such operations. Apart from the requirement for overly sensitive equipment, the measured
vibration signals during crude evacuation in large pipelines also need to be magnified in other to
reduce approximation errors. The major shortfall for the use of vibration technology however
would be the number of frequency monitoring sensors required and how to distinguish the
vibration signals where they meaningfully exist from the surrounding noise.
Floating micro robots
Robots are life mimicking mechatronic machines and could be autonomous or semi-autonomous.
Overall robotic assistive strategy for condition monitoring, inspection and control strategy of
Page 92
92
sensitive oil and gas industry can be broken down into human–machine interface, data-signal
transmission, resource allocation and task scheduling, navigation technologies, localization of the
mobile robots and workspace-objects, inspection technologies and teleoperation etc. (Amit Shukla
& Hamad Karki, 2016).
The use of pigs for cleaning and integrity monitoring has been discussed earlier while discussing
corrosion as a suitable technique worth consideration in leak detection. Pigging is a normal
operation in pipe transport technology where they are used to sweep service pipeline of sand and
sediments. Smart pigging is an improvement over the normal pigging operations by combining
some data acquisition capabilities for pipeline thickness monitoring. These surveillance operations
involve the use of multi-callipers and sometimes acoustic tools (Vuen et al. 2015; Lee et al. 2012).
It is suggested that the major disadvantage of production interruption requirement for intelligent
pigs could be overcome with the use of floating micro robots which will not require launching and
retrieval pads like pigs. Such micro robots, sometimes called free swimming leak detection system
(Henrie et al, 2017), could be designed to flow with the crude being pumped and could be designed
and operated to safely pass through the inlet valves of reciprocating pumps and gate valves before
being discharged with crude at receiving tanks for reuse. Two options could be conceived for the
use of this technology: 1) The robots mix with the crude and is retrieved at the terminal for data
download and continuous reuse; 2) Where the robots are self-propelling and are programmed to
travel as required for data acquisition either autonomously or for later download. This concept of
floating micro robots would require that such floating objects must be properly sized to float on
self-weight and properly mix with the fluid being pumped but this will create additional processing
requirement for the retrieval of such robots at the terminal. Even in cases where these floating
objects could easily mix and travel with the crude, the rate of travel could be non-uniform and
Page 93
93
hence difficult to predict surveillance location. The second option of using self-propelling micro
robots will involve the use of intrinsically safe batteries for propulsion, communication, and data
acquisition while the robots are in transit. The process of making an intrinsically safe, long lasting
batteries could lead to increased weight to ensure that any battery spark or explosion is contained
in a meticulously designed battery encasement. This additional weight may make the object unable
to float. On the other hand, without such heavy battery encasement any micro spark from the
battery during operation will ignite the pipeline which is always charged with hydrocarbon gases.
There is also some assumption that, in both robotic cases, the pipeline configuration is such that
GPS signals could be received throughout the pipeline length. Another major disadvantage of the
use of proposed floating micro robots is the fact that they could be lost during transit as they are
designed to flow with the fluid and hence could flow in the direction of fluid being stolen.
The use of floating micro robots could be very innovative as a concept but is currently being
limited based on reliance on its ability to flow with the fluid being evacuated and huge dependence
on battery for GPS auxiliaries, and sometimes propulsion, to locate the section of pipeline
corresponding to the respective surveillance data acquired. Another thing worth considering is
whether the data processing would be automatic or whether each returned floating micro robot will
need to be processed for data download and analysis before being recycled. Some consideration
should also be given for the time requirement in conveying one molecule of crude accompanying
such floating robot over a distance of some 100km before data download for processing as this
would also be a major disadvantage on the use of this technology.
Page 94
94
3.5 Chapter summary
An under reported one thousand people have been killed because of explosions from leaks and
vandalism on crude and refined product pipelines in Nigeria for the period 2004 to 2014. These
lost lives add to an estimated monthly revenue loss of about £1bln by both the EP operators and
the people of Nigeria. These human and financial losses have a double dipping effect to the people
of Nigeria as the operators have negotiated a way of paying taxes only on the actual hydrocarbon
exported. This therefore means that the government loses their own joint venture (JV) share of the
stolen crude as well as the tax revenue accruable from IOC’s tax payable on stolen hydrocarbons.
This appalling operating environment in the Niger Delta also leads to forest and farmland
devastation, air pollution as well as ozone gas releases during the process of refining the stolen
crude. This situation therefore calls for an urgent action on how to use all available resources to
stop pipeline vandalism and crude oil theft. The current surveillance technologies like ROW
monitoring by security agents on land and swamp operations have proven to be ineffective.
A detailed literature review of potentially new technologies for leak and crude oil theft
identification has been conducted and summarised. The fact that continuous hydrocarbon flow
occurs through major export lines limits some technology applications for leak detection to those
that do not demand production interruption. Crude oil theft detection could be achieved through
performance trend deviation monitoring but this approach, while being able to detect the point of
leak, may not be able to quantify the rate of leak or stolen crude. It is therefore immensely helpful
to have some expectation of what ought to be flowing as this knowledge will aid any selected
technology to determine both the location and rate of leak or stolen crude.
A major disadvantage of using fiscal reconciliation and surveillance technology is that they are
both post-mortem approaches and hence oil theft could have gone on for a long time before
Page 95
95
scheduled reconciliation time. Multistage reconciliation could be employed if we need to know
the area of leak position to some coarse accuracy, but this would require huge operational upgrade
as additional process instruments may have to be installed.
The use of corrosion monitoring technologies could, when combined with other technologies like
sacrificial corrosion probes, advise on the probability of leak but it is unable to detect pipeline
vandalism or the rate of crude oil stolen or leaking.
Hydraulic simulation results have been shown to compare reasonably well with actual production
if a properly calibrated model is used for event prediction. The most common data needed for
hydraulic simulation operations modelling are pressures, temperatures, and flow rates. The
question then is to find a way of measuring these key parameters during the crude evacuation
process, without interfering with the operating philosophy of the crude evacuation process, so that
the measured data can be compared with the model prediction result and hence determine the point
and rate of leak or stolen crude.
The use of smart operations capability, which incorporates all the gains of hydraulic flow
simulation, could be a particularly good fit to the research objective and could be used as a
standalone technology or combined with flow simulation using digital twin to accurately determine
leak point and rate of leak. The downside to this technology is that due to operations design
limitations wet flow measurements for volume flow rate is still a challenge in oil trunklines. There
are also challenges on how to deploy suggested pressure measurement points without
compromising the installed pipeline integrity as every pressure monitoring point is a potential leak
point.
Page 96
96
The use of fibre optic technology does not quite meet the objective of detecting crude theft as this
technology could easily be vandalised even when designed for leak detection and it is also
incapable of detecting the rate of leak in an open environment.
The use of FRF or DRF modelling has been demonstrated as highly effective for the determination
or prediction of potential failures for structures like bridges, steel structures and high-rise
buildings. The deflections and vibrations from such structures are just sufficient for the estimation
of FRFs that could be trended or trained to estimate the onset of failure. The vibration and acoustic
signals generated during pumping operations could be modelled as FRFs and used for pipeline
leak detection but the signal response from pumping operations may need to be over stretched to
be able to use these technologies to determine leak position as well as the rate of leak or stolen
crude.
The concept of using floating micro robots could be very innovative as a concept but is currently
being limited based on considerably basic operational issues of transportation, data acquisition and
several dependencies.
Having discussed the strengths and weaknesses of these selected feasible technologies that could
be applied for leak and theft detection on pipelines some further analyses were made on how to
rank them in other to determine which technologies, or group of technologies, that could be
progressed further to detailed design.
Page 97
97
4 TECHNOLOGY CONCEPT SELECTION
4.1 Introduction
The objective of this analysis is to synthesise the findings from literature review and progress a
concept, or some concepts that could be further researched and used in the framing of a new
process for pipeline integrity monitoring.
Crude theft occurs whenever vandals hot tap or illegally connect to the trunk lines so this exercise
is designed to select any technology that could detect illegal hot tapping prior to crude theft, and
also estimate leak point and the leak rate or theft.
Some evaluation criteria were therefore created to ensure the achievement of research objective of
predicting leak point and leak rate through hot tapping and crude siphoning.
4.2 Technology concept selection report
A technical evaluation of reviewed technologies for leak and theft detection on pipelines was
conducted to determine which technologies, or group of technologies, that could be progressed
further to detailed design.
This concept selection exercise was to ensure that:
• The conclusions of the literature review have, within the trunk line operational framework
and boundary conditions, scanned wide enough to identify all potential technologies for
the achievement of research objective for leak monitoring, crude oil theft detection, and
quantification of leak (or crude theft).
• All identified technologies are capable of being used to achieve the research hypothesis
which states that; If we have a way of continuously measuring the steady state conditions
Page 98
98
at regular intervals (say 5km or 10km) on a given pipeline during operation, then we
could, through deviations trending from the steady state operation, determine the point
of leak or crude oil theft and quantify leak rate or theft.
• The literature review has identified all potential risks, opportunities and mitigation plans
associated with each potential technology that could be progressed to concept selection
stage.
• Any selected technology is technically robust or would require minimal refinement to meet
the research objective.
• All non-technical risks (NTRs) like sabotage in the Niger Delta operating environment
were sufficiently considered during the technology selection process.
• Key uncertainties like varying crude flow rates, pressures and temperatures were
considered in the technology selection process.
Economic screening will, where necessary, be used as a discriminator where several technologies
demonstrate capability of meeting all the research objective. Some of the factors to be used to
evaluate the investment in this research, or the implementation of any useful finding therefrom,
would include the cost of crude oil stolen and the value of lives lost on one hand and the cost of
the deployment of the proposed smart process on the other hand. The cost of lives lost could be
quantified based on the age distribution of the recorded death statistics and the value the dead
would have added as GDP based on average remunerations and life expectancy in Nigeria. But is
economics really a limiting factor in the search of an utterly new solution as discussed in Pathway
to knowledge innovation? A research is purely a technical solution to a known problem so
somehow there are inbuilt economic indices in the fusion of ideation, inspiration, and
implementation to yield the required technical innovation where appropriate. Therefore, a
Page 99
99
standalone economic analysis may not be needed except where two equally probable technical
innovations exist.
In other to ensure that this research delivers a product that could address the documented research
hypothesis, all key issues highlighted in the research objective were assessed using the following
evaluation criteria:
• Ability to detect leak.
• Ability to detect pilferage.
• Ability to estimate rate of leak.
• Ability to detect hot tapping locations.
• Whether proposed technology could be data driven.
• Suitability to trunkline operating environment (OE).
• Technology maturity.
• Ease of repair and troubleshooting during failures.
Some weightings were assigned to these evaluation criteria based on criticality. The extent of
achievement for these respective evaluation criteria were graded using the traffic signage system
(green, yellow & red) as well as number grades. Ten (10) points are assigned where a criterion is
fully met (green), five (5) points are assigned to partially met criteria (orange), while zero (0) point
is assigned where evaluated criteria is not met (red). The results of the technical evaluation of the
reviewed technologies are as shown in table 1.
Page 100
100
Table 1. Technology screening table
Evaluation criteria
Weight
% Potential Technology
1 2 3 4 5 6 7 8 1. Fiscal
Reconciliation
2. Corrosion
Monitoring
3. Flow Simulation
4. Smart Field
Operation
5. Fibre Optic
Sensing
6. Acoustic
modelling
7. Vibration
Modelling
8. Floating Micro
Robots
1 Ability to detect leak 15
2 Ability to detect crude
theft
15
3 Leak rate estimation 15
4 Hot tap operation
detection
15
5 Data driven technology 10
6 Suitability to OE 10
7 Technology maturity 10
8 Ease of repair or
troubleshooting
10
Total weighted score 100 50. 25. 60. 80. 60. 75. 75. 52.5
It should be noted that the use of frequency response modelling could be achieved using either
acoustic or vibration modelling. However, these two technologies (FRF using acoustic modelling
and FRF using vibration modelling) were independently assessed in table 1 which shows the
evaluation result of reviewed feasible technologies. The highest-ranking technology is the use of
smart field operation.
The use of smart operations could therefore be considered as a key technology for the proposed
technology solution for leak and crude oil theft detection. But crude oil theft only happens when
vandals attach conduits through hot tapping. The smart fields operations, as was discussed in Smart
fields operation section may be unable to detect hot tapping. Acoustic emission modelling and
vibration modelling are the only two technologies capable of detecting the drilling process
involved in hot tapping operations. These two technologies are equally ranked in this technology
concept selection report. This decision point needs some trade off on the requirement for detection
of hot tapping operation as a basic requirement. If detection of hot tapping operation is critical then
some further research will be conducted on the use of FRF technology based on acoustics or
Page 101
101
vibration. On the other hand, we could downplay the requirement for hot tapping detection and
progress further research on smart field operations. Smart fields operation was chosen based on
ranking, so some further research was designed to close observed knowledge gap on smart
operations for the development of a new smart process for pipeline integrity monitoring.
4.3 Smart fields operations synopsis
This smart fields operation synoptical documentation is necessary to explain the smart fields
operations nomenclature as used in this thesis. Smart field operation builds on simulation as
explained in section 3.4.4 on Smart fields operation literature review page 76. The basis for smart
fields operations and digital twin is simulation and there are several levels of smartness or smart
operations capability. Digital twinning, as documented in section 9.6.2 on Digital Twining in
pipeline fluid evacuation process page 199, is the highest level of smart operations where the
operational process or product is coupled with the digital simulator for receipt of both forward and
backward signal information for data transmission, analysis and control for process or product
performance optimisation.
If you have a subsurface hydraulic model which you update on yearly basis, as a minimum
requirement, with BHP surveys from wells such a model can be described as a dynamic reservoir
model. This is because you can update such model with time dependent data changes like annual
production, current reservoir pressure and current fluid contact information. If the wells
represented in such a model have sensors that can send real time data that are coupled with such a
model for continuous update of such a model with regular production, contact and pressure
information then we can say that we have a smart fields operation. Depending on the level of
sophistication between the dynamic model and the real subsurface structure, we can use the created
Page 102
102
model which is now called virtual reality as a digital twin of the subsurface reservoir (actual object)
which exists several kilometres below the see level.
The details of explored options for the development of a solution for leak detection are contained
in Chapter 5 where the pre-leak data prognostic method and post leak data diagnostic methods
were discussed. The post leak diagnostic method was eventually deployed using vector algebra as
developed in section 9.3 on Pressure gradient vector analysis page 176 and selected for the
development of the new smart process for pipeline integrity monitoring.
So, in summary the technology solution for the crude oil theft monitoring in the Niger delta was
delivered based on vector analysis of real-time, online pressure measurements based on post-leak
data diagnostic smart operations as represented in figure 22 below.
Figure 22. Smart fields operations technology progression path.
Page 103
103
4.4 Chapter summary
The preferred technology for progressing this research is the smart operations technology which
is an artificial intelligence workflow that uses instrument sensing, computer modelling, SCADA
to partially perform human tasks aimed at reducing the decision cycle time for data-based decisions
as well as managing production data uncertainties.
The artificial intelligence operation domain is huge, and the remit of smart operations is also wide.
Some further study was therefore undertaken to find which aspects of smart operations that are
more suitable for this research on leak detection or if there would be a need to combine more than
one technology process in other to meet this research objective.
Page 104
104
5 SMART PIPELINE INTEGRITY MONITORING REQUIREMENT
5.1 Introduction
Business organisations are made of knowledgeable persons appointed to execute specific roles
regularly for the purpose of achieving an organisational goal. Operating procedures and standards
are developed by such organisations to, among other things, help staff deliver quality and cost-
effective products or processes. Where some of the organisational goals are designed to be
continuously repetitive, such jobs could be outsourced where applicable, or designed to be
executed by less experienced persons with the support of a few subject matter experts (SMEs).
Such repetitive jobs could also be operated with numerically controlled (NC) machines or robots
which are best suited for such repetitive, sometimes risky, and sometimes complicated jobs as
could be seen in many industries. Some robots could be found in manufacturing plants, the
automotive industry and in military service. Unexploded munitions for examples are retrieved and
exploded by robots; unmanned aircrafts are extensively used for military data gathering and
sometimes in delivery of bombs in high-risk war zones. Subsea remote operated vehicles (ROVs)
are also used at seabed to carry out wellhead surveillance operations and some other oil and gas
exploration jobs offshore as well as marine life exploration. Robots were also used in the delivery
of food and medicines at some hospitals and remote locations during the fight of COVID19
pandemic in some countries. The development of robots is continuously evolving and even when
business operations are fully operated by people, some of those operations are coded such that the
use of AI is available as alternative guide to operators especially during potential process or system
upset.
The result of this research literature review suggests that some benefits could be derived in terms
of cost efficiency and HSE management if smart operations are applied to pipeline integrity
Page 105
105
monitoring. The expensive and current risky practice of using helicopter overflies to attempt to
locate crude theft points over pipeline ROW of some 100 km could be eliminated for example.
Although low level helicopter overflies yield good results in good weather, the downside is that
the practice is expensive and the lives of the helicopter team are at risk as such helicopters could
be shot down as have happened in Tanzania where a low-level helicopter chasing elephant
poachers was shut down by the poachers in 2016 (The Telegraph, 2016). Another disadvantage to
this current helicopter surveillance practice, which could be eliminated with a smart process, is the
reduction in response time between suspected crude theft and the actual location of the crude oil
theft point. A smart process has the capability for rapid and instantaneous location of the crude oil
leak or theft point in pipeline as has been demonstrated in oil and gas wells which are basically
vertical pipelines. It is anticipated that a new technology process could be crafted for leak point
location and estimation of rate of leak without compromising the pipeline integrity nor increasing
the cost of new pipeline installation.
It is believed that some of the possible reasons why smart operation are not already applied to
pipeline crude transport process in the Niger delta could be endemic or economic. The world oil
boom of the 1970s gave Nigeria a good developmental start-up as several oilfield projects and
major civil facilities like ports and bridges were executed from proceeds from such oil boom. Over
15000 wells were drilled, completed, and produced in deltaic environment of about 75,000 square
kilometres through pipelines to five oil and gas export terminals in Bonny, Brass, Eket, Escravos
and Forcados. The subsurface hydrocarbon accumulation is considered the main asset being
exploited and are usually developed once the projected revenue from recoverable accumulations
can pay for all associated facilities like wells, processing facilities and pipelines in addition to
operating costs. These Nigerian oilfield developments somehow happened without imagining that
Page 106
106
a country with such huge potential in the 1970s will degenerate to such a poverty level where crime
and corruption will get to a level where pipeline vandals will brazenly be destroying oil and gas
infrastructure. Even the IOCs operating in Nigeria never anticipated such and hence did not quite
consider the security of their pipeline networks when they were initially built. Crude evacuation
pipelines, other than major trunklines, which were originally not buried below earth surface, were
hurriedly buried with the onset of pipeline vandalism but this action was already late. The pipeline
vandalism which initially started as a way of showing dissatisfaction to government for lack of
civil structures and past environmental degradation later developed into a huge industry for illegal
crude theft for use in illegal refineries. The vandals upon realising how lucrative the illegal refining
industry was, became sophisticated to the level of either paying corrupt government security agents
for protection or having their own armed security agents. Several deaths have been recorded each
time there is a confrontation between the government security agencies on one side who attempts
to stop pipeline vandalism or illegal crude refining and these pipeline vandals on the other side
who are defending their illegal enterprise.
Smart operations only gained momentum around the year 2000 in the Niger Delta, but the early
efforts then were limited to only processing facilities and later to wells. The pipeline, within the
E&P sector is considered a dispensable consumable hence not much emphasis was placed on
making it smart or creating a smart process around it. However, with economic volatility, and
several improvements in cost efficiency, any innovation that could lead to savings in any part of
the EP value chain is welcome. This is another potential contribution to this work which
emphasises the efficiency and cost effectiveness in the crude transport process. One approach to
designing a data based smart process in pipeline transport process, based on use of deductive
reasoning on pragmatist epistemology, would be to start with a hypothesis and then test such
Page 107
107
hypothesis using observed data to see if observed data follow some trends as proposed in the
hypothesis. Another smart operations approach based on the same pragmatist epistemology would
be to concentrate on observable data and use some axioms to form an explanatory model of the
observed data. This later approach is based on inductive reasoning. The part for deductive
reasoning and inductive reasoning are documented in section 2.4 on Research process page 50.
These two smart operations approaches could be used to create a model of pipeline crude transport
process which could be used to describe both normal and abnormal situations in the form of failure
realisations. The realizations of foreseeable leak situations could be modelled, such that any future
crude transport data could be matched to any of such model realization and used to detect anomaly
arising from crude oil theft. The pragmatist epistemology, which can be used to support a suitable
hypothesis, has been used to postulate that if we have a way of continuously measuring the steady
state conditions of any pipeline at some suitable interval like 5km or 10km, or its immediate
environment during crude transport operation, then we could determine the point of leak or crude
oil theft at any section of the given pipeline as well as quantify leak rate or theft. On the other
hand, the use of axioms which is also based on pragmatist epistemology could be used to postulate
the relationship between cause and effect during pipeline crude evacuation such that deviations
from known data trends, based on cause-and-effect relationship, could be used for the
determination of anomaly in the form of leak or crude oil theft.
Any of these data driven smart operations methods could be used to frame a solution for the
determination of leak or crude oil theft point in any pipeline system. The deductive reasoning
approach to knowledge assumes that for any measurement to be useful we must have an idea of
what we ought to be measuring. On the other hand, this fore knowledge is not particularly
applicable if axioms are used as deviation monitoring from any given steady state data could give
Page 108
108
a qualitative indication of anomaly based on inductive reasoning. The creation of a system
descriptive model (SDM) is needed in both methods such that any data from any future pipeline
being investigated could be processed through such a model. A system descriptive model can be
thought of as a mathematical attribute for describing the relationship of key variables responsible
for system parameters such that the SDM can be used in future for prediction of desired parameters.
A well system descriptive model for example could be used to determine well flow rate as currently
flowing and how the flowrate would be impacted due to loss or gain in productivity index. It is
imagined that a pipeline SDM could be created and used to monitor the performance of a pipeline
without leak as well as for the prediction of how such pipeline would behave at different leak rates
at different positions along the pipeline.
The main difference between the two pragmatic epistemological knowledge systems described
above is that one is based on immediately acquired data (post-leak data based on deductive logic)
from the pipeline being investigated while the other is based on past (pre-leak data based on
inductive reasoning) environmental data from the pipeline being investigated or a similar pipeline
in the past. In pre-leak processed methodology (inductive logic) the analysis focuses on events that
could be assessed to have happened before a particular result is achieved. For example, you need
to excite an electric conductor coil with some electric current before you energise a magnetic field,
or you need to have punctured a pipeline before a leak can be established. In post leak processed
methodology (deductive logic) we focus on current results to determine the preceding events.
Applying post leak processing methodology on the same set of examples above, we could say that
if an electric conductor coil is able to energise a magnetic field it means that there is current flow
in the coil. We could also say that if there is a leak on a pipeline it means that the pipeline must
have been punctured. In both cases you could process any newly acquired data through an SDM
Page 109
109
model that was created from either a pre-leak or post leak data in other to analyse such data. The
ability to create an SDM with the available Niger delta production operations data using a pre- or
post-leak data was therefore investigated.
5.2 Digital Twining concept
The pre leak and post leak approaches described above are technology corollaries using the same
concept of SDM and can be represented using technology digital twin (DT) respectively at
different levels of sophistication. A technology digital twin is a digital representation of a physical
product, or process, in all its aspects:– from conception to detailed design on one hand and from
construction through actual operations up to decommissioning on the other hand as depicted in
figure 23 (Russell, 2019). Digital twining is used to continuously close the gap or optimise
performance, using feedback and feedforward loops, between ideation (concept, design, or model)
and a physical product or process (as built, as modified, operated, or as decommissioned). How do
you use the data from your product to modify your idea or how do you use the data from your
modified idea to create a better product or process? DT allows us to do things faster in the form of
simulation instead of prototyping and could allow simulation of many models based on AI during
the conception stage and the use of real data during operations or maintenance stage to create a
more representative model (Grieves, 2015).
The complete innovation cycle for any product or process is made up of value creation (VC) phase
and value realisation (VR) phase. The phases of value creation are: IDENTIFY; ASSESS;
SELECT; DEFINE; and EXECUTE while the phases of VR are: OPERATE; MAINTAIN;
ABANDON and DECOMISSION. The model (virtual space) and the actual products (physical
space) can be continuously linked through data sensors for the purpose of performance
Page 110
110
optimisation in digital twinning during all phases (VC and VR) of product and process
development.
Figure 23. Technology virtual twin during operate phase. (Grieves, 2015).
Any created product could be equipped with several sensors for critical data monitoring and
transmission of such data to the virtual models for continuous analysis and feedback to the product
which can be in service at different locations anywhere in space. As a result of virtual twining,
quality control (QC) engineering does not have to depend on failure analysis after a product has
failed. With the modelled DT, operators can know ahead of time, through monitoring sensor data
streams, when a particular component is about to fail, and designs can be improved such that
through some inboard controls a failing component can be isolated if there are spares within the
product during operation.
Both the pre leak and post leak methods are artificial intelligence methods for leak detection based
on causal reasoning and a respective VR digital twin, and any of these approaches can be created
Page 111
111
using the defined SDM. Artificial intelligence (AI) will take digital twins to the next level with the
ability to assimilate, analyse, simulate, predict, prescribe, and act with minimal human
involvement – from digital twins that integrate data from various sources to one capable of acting
autonomously as shown in fig 24 below (Russell, 2019).
Figure 24. Digital twin sophistication levels (Russell, 2019).
One can say, from figure 24, that the pre-leak data SDM can be used to model an informative
digital twin while the post leak data SDM can, if properly used to train a neural network or similar
technologies, could be used in leak detection using a predictive digital twin.
A research mind map that highlighted all the issues that needs to be addressed has been presented
in Reflexivity, positionality and research mind map. These issues were used for technology
Page 112
112
scouting through literature review which eventually yielded smart operations as a potential
technology lead that can be used in meeting this research objective of helping to stop the menace
created by crude theft environment in the Niger Delta. As with most research efforts we have an
idea of what a technology solution could be but the pathway to this solution, if eventually
achievable, is only attained through some doggedness. This dissertation, which eventually
delivered a new smart process for pipeline integrity monitoring, followed a rigorous but sometimes
flip-flopping map on technology leads of either using the pre-leak or post-leak smart operations
process as documented in the solution pathfinder mind map.
5.3 Solution pathfinder mind map
This research involves a systematic study of issues relating to crude oil theft during pipeline crude
evacuation in Nigeria: how the theft is achieved through hot tapping; how to analyse available
data; how intrusion prevention or detection processes can be engineered; how similar problems are
solved in similar and unrelated industries, and how conclusions can be made on how to contribute
to some form of solution.
This research is made up of two parts. The first part, as described in Reflexivity, positionality and
research mind map, dealt with problem definition, selection of research process and review of
available literature that could provide leads for investigation for solutions to the menace created
by crude oil theft in the Niger Delta. The second part, described in figure 25 by a more
comprehensive solution pathfinder mind map, builds on selected concept of smart operations
technology solution and involves progression of leads until such leads are no longer feasible or a
solution to the new smart process on pipeline integrity monitoring was achieved.
Page 113
113
Two approaches to smart operations technology workflow for the achievement of documented
research objective were investigated. Both approaches are, as documented in section 2.4 on
Research process , page 50 are based on:
• Hypothesis
• Data observation
• Confirmation of hypothesis
One approach would be to start with a hypothesis and then test such hypothesis using observed
data to see if observed data can be used to support the hypothesis. The other approach would be to
theorize on observable patterns, then test available data for conformance and where appropriate
create a theory or hypothesis. The main difference between these two methods is that one is based
on post-leak processed data while the other is based on pre-leak processed data. Pre-leak data
process is prognostic or prescriptive and can be investigated using causal reasoning or artificial
neural network modelling to highlight probable area of leak and estimate leak rate. Post-leak data
analysis on the other hand is diagnostic and uses pipeline characteristic attribute like transmission
pressures during crude evacuation to highlight leak point and estimate leak rate. The post leak data
diagnostic method, if used to train a neural network or similar technologies, could yield a higher
level of data twining sophistication than the pre-leak data prognostic process as shown in figure
24.
Page 114
114
2004 -2014
Figure 25. Solution pathfinder mind map
Page 115
115
Both the pre-leak prognostic and post-leak diagnostic processes build on some form of system
descriptive model hence some attempts were made to test the usability of some data already
collected before the commencement of this research. This initial data synthesis revealed that
the initially collected data are not useable for pre-leak data processing using artificial neural
network. The collected data is usable for post-leak-data processing but has very limited output
data. E.g., evacuation pressure values are only measured at very few intermediate points
between the inlet and outlet. This therefore necessitated some simulation to reprocess the
available data and regenerate transmission pressure profile to the required intensity. These
simulation experiments were based on the initially acquired data but were used to generate data
sampling points for the monitoring of transmission pressure which was the only data needed
for progression of this research question of trying to locate point and quantify leak rate through
pressure monitoring only.
The research hypothesis, which states that “If we have a way of continuously measuring the
steady state conditions of any pipeline at regular intervals (say 5km or 10km) during operation,
then we could, through deviations trending from the steady state operation, determine the point
of leak or crude oil theft and quantify leak rate or theft”, was therefore verified through pressure
measurements using the post-leak data diagnostic process.
Through some pressure gradient experiments, it was demonstrated that leak points can be
identified through pressure gradient relaxation while the leak rate at the respective leak point
can be determined through pressure gradient vector method. The details of how the above
research solution pathfinder mind map was used to arrive at the proposed new process for
pipeline integrity monitoring are presented in the remaining part of this dissertation which is
based on the selected smart operations technology workflow as documented in section 4.3 on
Smart fields operations synopsis page 101.
Page 116
116
5.4 Post leak data diagnostic method
Post leak data diagnostic method, as defined in this thesis, focuses on system result, and tries
to investigate why any observed result corresponds or deviates from anticipated system
conformance or anomaly, respectively. The pragmatic approach assumes that we know what
ought to be flowing and hence relies heavily on measurements for the comparison of what is
flowing against what ought to be flowing. Hydraulic Simulation provides an accurate account
of crude throughput and could be used for the estimation of what ought to be flowing through
any closed system used for crude evacuation. This approach is cheap if we have measurement
at regular intervals along the pipeline length. It should be noted here that the frequency of such
measurement is tied to our desired level of accuracy. A near perfect (100%) accuracy in leak
point determination was achieved but a 93.44% average leak rate prediction accuracy was
demonstrated based on the proposed smart process for pipeline integrity monitoring. The
spacing between monitoring points (5km or 10km) would therefore have some effect on the
leak rate prediction accuracy. Direct fluid measurement uses known techniques for measuring
flow rates, temperatures and pressures through sensor’s mechanical contact with the fluid
stream while indirect fluid measurement relies on some effect of the fluid flow like heat
transfer, eddy current effects, vibration and acoustics on their environment. Indirect
measurements have been discussed as novel in large pipelines as measurement sensitivity and
repeatability are not yet well established. Other issues hindering the application of indirect
measurements would be how to distinguish flow induced signals from those due to background
noise or how to prevent ground or underwater attenuation from masking measurement signals.
Direct fluid flow measurements are well advanced but is not permissible within the trunkline
crude evacuation systems because such measurements create obstructions to the flow conduit
area. Current oilfield measurement practices in the Niger delta require that flow measurements
be made at two or three points along major pipeline: flowstations; major manifolds and export
Page 117
117
terminals. These measurements are used for estimation of reconciliation factors which are
thereafter used in the estimation of production losses due to leak or crude oil theft. The shortfall
of this limited data reconciliation approach would be that, even though we could estimate some
losses, we are not able to estimate the exact location of alleged leak or hydrocarbon theft. This
huge uncertainty associated with monitoring a long trunkline, for example, using only three
measurement points could be reduced with increased measurement points. But any attempt to
increase the data acquisition points also leads to increased risk due to additional flanging as
these additional flanges are potential leak points. Non-routine, non-intrusive measurement
systems using clamp-on equipment on the pipeline being investigated could be used to
overcome these direct measurement challenges, but indirect measurement technology maturity
is still at its infancy for several reasons. The primary reason being the validity of the signal
correlation upon which such measurement is based and sometimes the need for continuous
calibration of such signals. Also, any indirect measurement assumes that the pumping process
will continuously generate strong signals which could be amplified and used to derive some
form of measurement. The most commonly used non-intrusive, non-obstructive measurement
systems in pipelines are based on sound sensing; vibration sensing; temperature sensing; and
electro-resistive sensing tools which are designed to be clamped onto a pipeline being
investigated for data acquisition.
The use of vibration and acoustic sensing technologies seemed promising from literature
review. However, these technologies still need further investigative work to address the
following:
1. How to use indirect measurement sensors to measure what is flowing through any
given section of any given trunkline with minimal management change control.
2. The use of signal amplification technologies to magnify weak signals.
Page 118
118
3. How to distinguish between pump signals from environmental signals.
4. How to design a reliable calibration algorithm for the prediction of what is flowing
with suitable certainty.
5.5 Pre-leak data prognostic method
Prognostic or prescriptive data analysis process involves the use of advanced analytics and
machine learning to identify patterns and provide early warning of potential risk surrounding
the subject being investigated. Pre-leak data prognostic workflow refers to a process of using
some past data analysis of pipeline systems and its environment under operations to prescribe
the outcome of a similar system under investigation. This environmental data analysis
methodology focuses on all potential external incidents that must have happened as a
precondition for any expected outcome to occur. In the case of crude oil theft or leak, this will
focus on activities external to the pipeline being investigated that needs to have happened to
create a variance between the total crude being received at the terminal and the total crude
being pumped from the respective flowstations. Potential activities that will lead to crude oil
theft or leak include operational leaks and pipeline vandalism for the purpose of creating leak
or crude tapping point. Operational leaks due to corrosion or pressure mismatch has been
discussed earlier so the focus now are leaks due to pipeline vandalism. This, notwithstanding,
any solution that could detect leak due to pipeline vandalism would also be used to detect leak
due to corrosion or system upset due to pressure mismatch. This pre-leak data prognostic
workflow feasibility was evaluated using causal reasoning and artificial neural network (ANN)
both of which are artificial intelligence workflows.
Page 119
119
Causal reasoning
Causal reasoning definitions, limitations, and applications have been documented (Bowers,
2017). According to Bowers, causal reasoning is a post-learning cognitive process concerning
cause and effect. Theories of causal reasoning may concern the structure of associations, how
agents use such structures, or how that structure affects action. Applying this definition to leaks
during pipeline crude evacuation the question them would be what (past) post-leak cognitive
processing we can assess and model for future pre-leak data processing. The method advocated
here built on analogues. E.g., can we use the past post-learning result of a pipeline that was hot
tapped for crude theft to create a model, now called pre-leak data prognostic model so that the
pre-leak data model can be used to predict location of future leaks at any particular location. It
must be stated (Bowers) that causal reasoning (reasoning about cause-effect relations) is
appropriately dissociated from causal learning (learning about cause-effect relations):
“learning is concerned with a bottom-up analysis; reasoning, top-down. Although knowledge
about how causal learning occurs bears on the study of the ultimate structure, and knowledge
about this structure bears on study of the way it is acquired, an integrative research that
combines analyses of causal reasoning with learning carry potential worth, their distinction
should be born in mind. A theory of causal reasoning may be silent on learning, or vice versa,
and so caution is warranted in drawing conclusions about one in the context of theory about
the other”.
One of the puzzles to be solved in the pre-leak data prognostic method would therefore be how
to generate scenarios based on external environment that could be used to explain causes of
crude theft such that through some form of modelling we could use such scenarios to analyse
future systems and locate leak or crude oil theft point.
Some typical external cause and effect relationship for crude oil theft could be written as:
Page 120
120
• Pipeline vandalism leads to hydrocarbon leaks.
• Pipeline vandalism leads to low reconciliation factor (RF).
• Illegal hot tapping leads to low RF.
• Loss of containment during crude oil theft leads to environmental pollution.
• Crude oil theft provides feedstock to illegal refineries.
• Crude oil theft leads to increased OPEX due to pipeline repairs.
The above relationships and other relevant ones could be represented as cause-and-effect
diagram in figure 26 below:
Figure 26. Pipeline leak cause and effect diagram
A simple attempt to resolve crude oil leak or theft in each pipeline can be demonstrated
through some systemic approach using figure 27 which represents a section of a typical
pipeline network.
Page 121
121
Figure 27. Pipeline sectional schematics for cause-and-effect demonstration
From figure 27 above the following flowrate equations and corollary statements can be made:
q𝑎 + q𝑏 + 𝑞𝑐 = 𝑄1
so, if 𝑄1 < (q𝑎 + q𝑏 + 𝑞𝑐) then there should be a leak or crude oil theft upstream of 𝑄1 .
Also
Q1 + 𝑄2 = 𝑄3
and similarly, if 𝑄3 < (Q1 + 𝑄2) then there should be a leak or crude oil theft somewhere
either between 𝑄2 and 𝑄3 OR between 𝑄1 and 𝑄3.
Similarly, if 𝑄4 < Q3 then there should be a leak or crude oil theft somewhere between 𝑄3 and
𝑄4. This illustration was based on a simple evacuation system involving a section of a pipeline
and explains how causal reasoning could be used to generate step by step deductions using IF,
OR, AND combination statements.
Figure 27 represents a simple flow configuration example because it assumes that we
accurately know the intermediate flow rates Q1 and Q3. Unfortunately, this is not the case in
real flow situations. Any operational measurements recorded at Q1 and 𝑄3 for example, may
already have been influenced by some form of leak or crude oil theft upstream of those
Page 122
122
measurement points. Also, because there could have been leaks or crude oil theft downstream
of these points, we cannot back propagate the intermediate flow values from 𝑄4 . So, in effect
we have several potential leak points with just a few known input and output variables. The
above discussion has highlighted a major disadvantage of causal learning (or reasoning), which
is the fact that the interrelationship of multiple factors, especially with several unknowns are
difficult to show or mathematically connect.
Also, the causal reasoning approach assumes that the solution provider knows all the causes of
the problem being solved. This therefore limits the use of causal reasoning to qualitative
analysis of thematic issues identification and hence may not be especially useful in the
identification of leak or crude oil leak location and quantification using the pre-leak data
prognostic method for leak prediction.
Neural Network
Unlike in causal reasoning, you do not need to have a detailed understanding of all the external
environmental factors effecting any process being modelled in artificial neural network. It is
just sufficient to demonstrate, based on the given pipeline environmental data approach, that a
particular outcome is usually preceded by some events. With this knowledge, one could create
a model that links a set of outcomes to some respective specific preceding events. Neural
network therefore has some potential for this research objective and hence was also
investigated. A typical neural network would have an input layer, some hidden layers, and an
output layer. The hidden layer, for a pipeline crude evacuation process, will comprise all the
factors that could affect the quantity and quality of crude being received at the export terminal.
Such factors could be systemic or external to the pipeline being investigated. Systemic factors
would include flowstation pump accuracies, shrinkage losses as gas comes out of the crude
being transported, shrinkage losses due to temperature variations, small leaks at flanged or
Page 123
123
instrument connections. External factors include hot tapping for rogue conduit connection. A
necessary condition for leak or crude theft would be that some intruders would have: 1.) gone
to the pipeline; 2.) tapped onto the pipeline; 3.) connected rogue conduits to trucks or barges
for illegal crude siphoning and 4.) sold or refined the stolen crude. Geographical coordinates
are needed as a basic requirement to describe any pipeline under investigation. Such geographic
pipeline boundaries could be sub divided into sections for more accurate prediction of output
signal, especially when the pipeline is exceedingly long. The shorter the length of each
subdivision, the higher the accuracy of the prediction result. The downside of having shorter
sections and hence higher prediction accuracy would be the demand for more granular data
input and demand for more computational processing power due to fine gridding.
5.5.2.1 Input Layers
The input data is a summation of all the crude pumped through the pipeline being investigated
while the output data is the volume of crude received at the terminal. If the total volume of
crude pumped are received at the terminal, then we could say that there is no effect of the
hidden layers on the crude transport process. Otherwise, we could say that there is a leak hence
the reconciliation factor could be assumed as a measure of the input layers. This is because the
RF is a measure of the quality of all the crude pumped through the pipeline. The terminal RF
is therefore an input data and a trigger point for the investigation of the hidden layers that
causes the suspected leak or crude oil theft. Ideally, the RF should be equal to 1.0 as this implies
that all the molecules of crude pumped from the respective flowstations are received at the
export terminal. An RF of 0.95 is also acceptable, as the five (5) percent apparent production
shortfall is generally within measurement errors and could be attributable to systemic losses
like production shrinkage due to gas liberation and temperature variation. Indeed, this level of
shortfall is not usually due to leak or crude theft. However, any other lower RF is investigated
as due to leak. There is an oil industry regulatory requirement, as part of most jurisdiction’s
Page 124
124
hydrocarbon resource volume management (HRVM) process, for throughput RFs to be
computed on monthly basis. These monthly historical RF data are therefore readily available.
However, there may be need to increase the RF data sampling frequency to weekly or daily as
a way of reducing the response time to crude leaks and hence cut down on the amount of crude
being stolen before the source of theft is identified and stopped. This same objective could
additionally be achieved through intermediate reconciliation factor estimation between the
flow stations and the export terminal. For example, you could have manifold reconciliation
factors. These sectional RFs are also part of input layer because they provide information as to
which section of the pipeline that is causing throughput shortage.
5.5.2.2 Hidden Layers
Any observed variance between what is pumped and what is received could only have been
influenced by some hidden layers. The hidden layers are those factors, which could be
estimated or measured at the environment surrounding the given pipeline or sections of the
pipeline that could affect the output from such pipeline or pipeline section.
The following, based on the forgoing discussions, logic, and inferences, could influence, or
could be studied to see if they correlate with data influencing crude theft:
• Loitering along pipeline ROW.
• Employment indices.
• Growth of illegal refineries.
• Automotive activities close to pipeline ROW.
• Periodic petroleum product shortages.
It should be noted, as discussed earlier, that the above influencing factors should be taken as
philosophical postulations, based on cause-and-effect logic that could be tested. Why would
Page 125
125
someone, for example, be seen loitering along the pipeline ROW? A few of such trespassers
could be harmless. But there are signs that reads “high pressure pipeline: please keep off” so
this signage would discourage loiterers without evil intentions. There could also be hunters but
the vegetation along the pipeline ROW is always kept low so could not really be a game
neighborhood, except for a few hunters crossing from one thick vegetation to the other on each
sides of the pipeline ROW. And of course, there would be vandals who are really interested in
assessing the pipeline for hot tapping and crude theft and on the average, it is being postulated
that these group would represent the bulk of the population of loiterers along the pipeline ROW.
A. LOITERING ALONG PIPELINE ROW
Some safe boundary distances of no permitted development are usually created on each side of
any approved pipeline ROW to minimize human exposure during any loss of containment
incident. As a result, oil and gas pipeline ROW are clearly marked as hazardous areas
containing highly inflammable hydrocarbons under pressure. It has been shown that crude oil
theft is undertaken by people through hot tapping. This therefore implies that if we have some
form of data about people movement along the various sections of the pipeline being
investigated, we could analyze such external data and use them in designing a pre-leak data
prognostic model that can be used to see if there are correlations between people movement
around any given pipeline ROW and crude oil theft on that given pipeline. One method of
monitoring people movement is via satellite imaging, but this could be precarious in dense
vegetation as well as expensive. Indirect measurements using phone signals could also provide
some form of data. Access to people’s phone data is normally seen as compromising privacy
laws but when compared against the £1bn being lost monthly to crude oil theft the Nigerian
government could find a way of allowing security operative to use such data to monitor people
that are loitering close to pipeline ROW. It should be noted that when closed circuit television
(CCTV) was introduced it was initially challenged as invasive to people’s privacies but with
Page 126
126
time and consideration to public interests, especially in more developed nations, CCTV are
now regular installations at public places and transportation systems like buses, trains, trains
stations, roads and bus stations as a way of monitoring and controlling crime.
B. EMPLOYMENT INDICES
Crude pipeline vandalism initially started as a way of protesting lack of development initiatives
by host communities but later grew into a lucrative business of crude oil theft. This lack of
development led to gross youth unemployment in Nigeria and hence continual upsurge in
crime. So, if we have data to show improvement in employment indices in the Niger Delta,
such data could be used to corroborate any reduction in crude oil theft or vice versa.
Unfortunately, reliable local employment indices are difficult to gather in the Niger Delta,
especially at specific locations along the pipeline ROW. A plausible way of monitoring
employment indices could be via access to mobile phone data, as data from a mobile phone
user could be processed to create a model of respective user’s personality. Most mobile phones
have GPS monitoring tool and with such tool every movement of the user of such phone could
be monitored and tracked. Some philosophical postulations that phone location stagnation
could be used as an indirect way of measuring owner’s productivity could be made. Any mobile
phone that has not changed coordinates during the morning rush hours of 6:00 – 9:00am on a
normal working day, for example, could possibly be said to belong to an unemployed person,
a retired person, or to someone on some form of vacation. Registered telephone data also
contains the age and sex of its owners and hence when such phone data are filtered on owners
age, sex, hours of inactivity, the phones belonging to young unemployed youths could be
further monitored to determine those whose nearness to any particular section of the pipeline
always precedes crude theft from such pipeline. Also, with identity requirement for the
registration of all phones in Nigeria, the exact identity of a particular individual whose nearness
Page 127
127
to a pipeline always precedes some form of crude theft on that pipeline can be precisely known
through the activity log of mobile phones nearness to pipeline ROW.
C. ILLEGAL REFINERIES
Stolen crude oil are mainly used as feedstock for illegal refineries so if there is a way of
monitoring the number of illegal refineries in the creeks, we could use some aerial
environmental data to infer if there are trends between the growth of illegal refineries and crude
oil theft in that area of the Niger Delta or vice versa. Since 2017 there has been some persistent
smog in most parts of Port Harcourt city and one of the suspected causes of these smog are
smokes from illegal refineries or smokes arising from fires created by air bombardments by
government forces during the destruction of these illegal refineries. The black particulate
matter in the atmosphere are giving some concerns to Niger delta residents, especially Port
Harcourt, as most household furniture now turns black if left without cleaning within a day.
The air composition is currently monitored regularly by government and the IOCs and the
conclusions so far is not pointing to any source of pollutants. This air composition data could
provide useful indicators on the level of illegal refining activities which is generally believed
to be the main source of air pollution from public opinion. Unfortunately, only global data
deductions could be made from these air particulate data about the level of crude theft if indeed
it is proven that illegal refining is the source of most of the particulate matter. Even with this
deduced indicator on illegal refineries, it is still difficult to synthesize these data to a level
where they could be used to create a model for predicting crude oil theft.
D. AUTOMOTIVE ACTIVITIES NEAR PIPELINE ROW
Stolen crude is usually siphoned into trucks and barges from where they are transported to
illegal refining sites or exported through ocean going vessels. Therefore, having some data on
truck and boat movements would be a good input for pre-leak data prognostic model creation.
Page 128
128
One option for monitoring truck movements in Nigeria could be via satellite imaging. Image
recognition is a well-developed ANN process, and a process could be designed and trained to
recognize and record trucks movement within a defined distance from the pipeline ROW under
investigation. This approach will also be expensive and difficult to operate if it must be a
dependable process data input to a new process for monitoring pipeline integrity.
E. PERIOD OF PETROLEUM PRODUCT SHORTAGE
There are three crude oil refineries with a combined installed capacity of about 450,000 bopd
in Nigeria. These refineries produce at much reduced capacities due to breakdown or lack of
proper maintenance planning and as a result refined petroleum products imports are regularly
needed to augment supply even when the refineries are on production. This is partially because
of gross lack of knowledge as to the exact data on daily petroleum product consumption in
Nigeria. This lack of knowledge is partly because, based on Economic Community of West
African States (ECOWAS) treaty of free passage of goods and services, petroleum products
could easily be smuggled to neighboring countries. The federal government also claims that it
subsidizes petroleum product distribution, and this also leads to corrupt inflation of petroleum
import and distribution data so as to get money for distribution of products that were never
imported nor bridged between regions in Nigeria. As a result of the foregoing there is constant
fuel scarcity in Nigeria, especially during festive periods like Christmas seasons as a result of
hoarding, or whenever any of the poorly maintained refineries is off production, or whenever
the importation is interrupted due to exchange rate depreciation of the Naira, or sometimes
industrial actions due to lack of government subsidies, or government refusal to pay import
fuel subsidy which is an alleged channel for corruption.
An illegal refinery can be set up within days, so any prolonged period of petroleum product
shortage automatically leads to increase in illegal refinery and hence increase in crude oil theft.
Page 129
129
These Illegal refining are undertaken in jungles, so the current means of identification and
combat is via helicopter overflies. The Nigerian military overflies seeks out smokes in jungles
and combat them as appropriate. As a result of the foregoing, it is difficult to get any reliable
data on the number and locations of these illegal refineries hence any form of modelling based
on pre-leak data prognostic processing that relies on illegal refining data will be difficult to
implement.
5.5.2.3 Output Data
Let us consider crude evacuation process where crude from six flowstations are pumped to an
export terminal via two major manifolds as shown in figure 28. We could analyze a two-stage
flow reconciliation process as shown, where measurements are made at the six flowstations
(F1, F2…F6), two trunkline manifolds (M1 & M2) and an export terminal (T1). Using the
ANN workflow, we could have hidden layers between the flowstations and the manifolds and
additional hidden layers between the manifolds and the export terminal.
Page 130
130
Figure 28. Pipeline network for reconciliation factor estimation
The ratio of the crude received at T1 to the sum of the crude being pumped from F1, F2, F3,
F4, F5 and F6 is called flow reconciliation factor. This reconciliation could also be in two
backward stages since there are measurements at M1 and M2. The first backward reconciliation
would be the ratio of the crude receipt at T1 to the sum of the measured crude flowing through
M1 and M2. We could also have reconciliation factors between M1, and the sum of the crude
pumped from F1, F2 and F3. Similarly, we could have reconciliation factors between M2, and
the sum of the crude being pumped from F4, F5 and F6. The distance between these
flowstations and the terminal could be several tens of kilometers. This distance, its surrounding
environment and activities therein would determine the integrity of the pipeline and hence what
quantity and quality of crude that is received at the terminal T1. These activities that could
affect the crude transmission could be represented as hidden layer(s).
Page 131
131
As explained in literature review, the respective reconciliation factors RFs are created to
account for losses which could be due to the hidden layers. Using ANN workflow, we can
focus on the effect of the hidden layers to estimate the rate of leak or stolen crude at the
respective sections of the pipe that will give rise to the respective R𝐹𝑖.
As a result,
𝐿𝐹1𝑀1 - Leak on pipeline between 𝐹1 and 𝑀1
𝐿𝐹2𝑀1 - Leak on pipeline between 𝐹2 and 𝑀1
𝐿𝐹3𝑀1 - Leak on pipeline between 𝐹3 and 𝑀1
𝐿𝐹4𝑀2 - Leak on pipeline between 𝐹4 and 𝑀2
𝐿𝐹5𝑀2 - Leak on pipeline between 𝐹5 and 𝑀2
𝐿𝐹6𝑀2 - Leak on pipeline between 𝐹6 and 𝑀2
𝐿𝑀1𝑇1 - Leak on pipeline between 𝑀1 and 𝑇1
𝐿𝑀2𝑇1 - Leak on pipeline between 𝑀2 and 𝑇1
The leak matrix would therefore be represented a 1 X 8 array of output leaks.
𝐿𝑒𝑎𝑘 =
[ 𝐿𝐹1𝑀1
𝐿𝐹2𝑀1
𝐿𝐹3𝑀1
𝐿𝐹4𝑀2
𝐿𝐹5𝑀2
𝐿𝐹6𝑀2
𝐿𝑀1𝑇1
𝐿𝑀2𝑇1]
Depending on the distance or desired accuracy of leak detection system we may subdivide each
section of the pipeline into three parts and have a 1 x 24 array of leak or stolen crude position
outcome.
The hidden layers would then represent the interaction of the six input layers with some hidden
layers to give some twenty-four output that could be used to predict the probability of leak or
Page 132
132
crude theft point with some coarse accuracy at any subdivision of the pipeline being
investigated as shown in figure 29. The result from this approach is statistical and in a one leak
situation could be useful.
Figure 29. Pre-leak data prognostic ANN workflow for crude theft detection
5.6 Machine Learning
Machine learning (ML) is the study of computer algorithms that improve automatically through
experience (BakIr, et al., 2007). Applications range from data mining programs that discover
general rules in large data sets, to information filtering systems that automatically learn users'
interests (Mitchel, 1997). If for example, we consider a set of data from some function which
relates an attribute (y) to a variable (x). With two pairs of points (x, y) we can plot a straight
line. If a newly acquired third set of points plot on the same straight line, then we could say
that the dependency is a straight line. If unfortunately, it is clearly shown that such dependency
is not a straight line, then we can continue with ML workflow to describe the relationship which
Page 133
133
can now be assumed as a polynomial. The actual curve (whether quadratic, hyperbolic, or
exponential) will be perfected as more data become available until one gets to a stage where
our guessed or assumed model will be able to perfectly predict future outcomes. This is the ML
workflow which is seen as a subset of artificial intelligence where machine learning algorithms
therefore build a mathematical model based on sample data, known as "training data", in order
to make predictions or decisions without being explicitly programmed to do so (Koza, et al.,
1996). Machine learning is therefore focused on two inter-related questions: “How can one
construct computer systems that automatically improve through experience?” and “What are
the fundamental theoretical laws that govern every learning system, regardless of whether it is
implemented in computers, humans or organizations?” (Mitchel, 1997)
While it is not impossible to develop machine learning algorithm for leak point detection, the
generation of required training data will take a long time and the luxury of such
experimentation is unsustainable and unacceptable considering the loss of containment
consequences. To achieve human level intelligence, learning machines therefore would need
the guidance of a model of reality, similar to the ones used in causal inference tasks (Pearl,
2018). It must be stated that ML is an evolving discipline with extensive application in statistics
and engineering. Some of the areas of ML applications relevant to this research include
artificial neural network, causal reasoning, and testing hypothesis. It therefore implies that one
can improve results of leak prediction and quantification as documented in post leak data
diagnostic and pre-leak data prognostic methods for leak detection and quantification using the
ML workflow. Such post-leak data diagnostic application of ML could be in testing hypothesis
while pre-leak data prognostic data processing could be applied through improving SDM
developed for causal reasoning or artificial neural network. As discussed in section 9.6.2 on
Digital Twining in pipeline fluid evacuation process, page 199, ML can be used for
transformative digital twining using either the diagnostic or the prescriptive analytics, hence
Page 134
134
the ML workflow is most suitable for the improvement of results based on pre-leak data
prognostic (or prescriptive) method or the post-leak data diagnostic method.
The pre-leak data prognostic method currently has been assessed as difficult based on lack of
data for SDM data twin creation. Also, the available post-leak data diagnostic SDM processing
would limit the accuracy of leak point and rate prediction hence some further studies were
undertaken on how to overcome the data gap for pipeline integrity monitoring through post
leak data diagnostic method.
5.7 Chapter summary
The need for a data-based system descriptive model (SDM) and the potential use of such model
for processing any new data for the determination of leak or crude oil theft in any pipeline
system has been documented using some VR created data twins. Such model could be created
based on pre-leak data prognostic or based on post leak data diagnostic method. Post-leak data
diagnostic processing refers to the use of data generated by the pipeline system being
investigated while pre-leak data prognostic processing refers to the use of external
environmental data to the pipeline being investigated or a past environmental data from a
similar pipeline. Post leak data diagnostic processing is instrument based and requires that we
have some knowledge of what is flowing while pre-leak data prognostic processing is based
on events surrounding the pipeline being investigated. The events which influence pipeline
leak, based on pre-leak data prognostic processing has been documented as: terminal
reconciliation factors; loitering along pipeline ROW; employment indices; growth of illegal
refineries; automotive activities close to pipeline ROW; periodic petroleum product shortages.
These data are difficult to generate in the Niger delta and hence makes the use of pre-leak data
prognostic processing methodology difficult.
Page 135
135
The pre-leak prognostic and the post-leak diagnostic processing methods are AI methods based
on causal reasoning and can also be processed using data twins based on AI data feeds. Machine
learning was introduced as a third AI method for leak position and rate estimation during fluid
evacuation. However, ML algorithm for leak point detection was assessed as potentially
luxurious as such experimentation would take an unsustainable long time to train but rather
such ML workflow could be used to improve any SDM developed using pre-leak or post-leak
data.
Post leak data diagnostic methodology seems promising since it is based on measurements.
However, the current data acquisition practice in Niger delta, where only three-point data
acquisition is applied, limits the level of accuracy achievable with post-leak data diagnostic
processing. This inherent problem of post-leak data processing data paucity led to some further
study.
Page 136
136
6 DATA ACQUISITION STRATEGY
6.1 Introduction
The input variables suitable for Pre-leak data prognostic method workflow has been
documented as reconciliation factors, local unemployment data, fuel scarcity, illegal refining
data, loitering, and automotive movements. Unfortunately, the only measurable and readily
available data in Niger delta, out of these six, is the historical monthly terminal reconciliation
factor (RF). Local unemployment and fuel availability data are difficult to use in this analysis
due to data paucity. Illegal refining data is also difficult as illegal refining occur in very thick
jungles and mangrove creeks and any attempt at accessing these sites for data acquisition are
usually met with armed conflicts. The conclusion therefore is that it is difficult to use the pre-
leak data prognostic model for leak detection with only one reliably measurable data. This
necessitated a revisit of Post leak data diagnostic method in other to devise means of
overcoming its major short coming of data sampling inadequacy. This shortcoming arises
because the trunkline conduit area is not designed to be obstructed with intrusive volume
measurement devises. Unfortunately, external indirect volume measurement alternative
solution using sound and vibration sensing devices on large pipes are still at their
developmental infancy.
Our current knowledge of mass flow in a confined space requires the knowledge of pressure,
volume, and temperature at any given position and time to describe any flow domain. If we
assume isothermal conditions, we could ignore temperature variations and so the knowledge
of just pressure and volume are sufficient to describe the propagation of the continuity equation.
The pressure and volume dependencies during crude transportation were therefore simulated
to generate the required data in support of an AI workflow for pipeline leak prediction using
an SDM generated from the post-leak data diagnostic methodology as earlier defined.
Page 137
137
6.2 Design of Experiments
The Niger delta oil patches cover a total area of some 75,000 square kilometres as shown in
figure 30 (Erhimona, 2020; Whiteman, 1982) and with only five Hydrocarbon export terminals
the respective hydrocarbons from these oilfields will travel a distance of between 50 and 200
kilometres through major trunklines, whose diameters range between 12 and 36 inches, to their
respective oil and gas export terminals. Crude stealing through hot tapping occurs throughout
the length of these trunklines as well as through delivery lines and some high-volume rate
flowlines. A Niger delta trunkline and a delivery line were simulated as case studies with the
belief that any finding therefrom will be universally applicable to any pipeline used for fluid
evacuation. The simulation design objective was to find how to generate additional data
through reprocessing of existing field data for leak identification, as well as quantification
through pressure measurements only.
Figure 30. Niger delta oilfield acreage map
Page 138
138
Basis for design
A narrative of fluid evacuation through a given pipe length is presented here as a basis for
design of experiments and how pressure response from simulated leaks from such
conceptualised experiments will be used. Let us consider an imaginary 10km, 6-inch pipeline
with an inlet pump pressure of 300 psi and a 0.02psi pressure loss per meter. The 10km pipeline
could be divided into ten (10) equal parts for pressure monitoring during the fluid evacuation
process. A plot of the pressure profile during the pumping process will represent a straight line
from an inlet of 300 psi to an outlet of 100psi and all anticipated pressures at any of the pressure
monitoring points will align with the inlet-outlet pressure profile. Any leak simulation
experiment at any of the section will create a deviation from the developed trend. It can be
demonstrated that the degree of deviation is directly proportional to rate of leak or pressure
loss. This pressure trend alignment and deviations formed the basis for the design of
experiments for data generation in support of this study.
Simulation setup and strategy
One way of generating the required post-leak diagnostic data could be through fluid evacuation
experiments using a mechanical test rig. This would be expensive and time consuming. The
use of such rigs has been researched and quite useful (Abdulshaheed et al., 2017; Covas & Ramos,
2020; Gong et al., 2014; Lossouarn et al., 2016; Ostapkowicz, 2016). The methods used by these
researchers includes acoustic sensor data modelling. Unfortunately, the use of acoustic sensors
has been discounted as unusable for data gathering in operational pipeline systems (page 86).
A cheaper alternative to the use of mechanical test rigs involving the use of computer
simulation was selected as this approach has the required capability to adequately model the
exact dimensions, configuration, and pressure settings of any required pipeline case study.
Page 139
139
A conceptual simulation setup is as shown in Figure 31 with the pipeline being investigated
having boundary sections at Pinlet and Poutlet. In other to simulate leaks or crude oil theft, ten
(10) leak points were attached with suction pumps on the pipeline under investigation.
Intermediate pressure measurement points (not shown on diagram) were attached to record
downstream pressure after each leak point. These pressure gauges monitor the pressure
response to simulated leak rates during continuous pumping process from the reservoir through
Mvalve and T valve. This model setup would have the capability to simulate single leaks at selected
sections as well as multiple leaks at several combination of sections of any pipeline being
studied.
Figure 31. Simulation experimental setup
Simulation software
Several hydraulic simulation software, ranging from simple and freely downloadable ones to
overly complex and awfully expensive software, are available for several industries involved
in pipeline fluid transportation. Two of the very robust pipeline transport software, OLGA and
PIPESIM, used by hydrocarbon exploration and production industry around the world were
Page 140
140
developed by Schlumberger5. A research version of PIPESIM was donated upon request,
through Schlumberger UK to DMU in support of this research. PIPESIM was chosen for this
research based on personal knowledge and because it is the software used by an international
oil company where I gained three decades of petroleum engineering experience. Alternative
fluid simulations software in a ranked order are: Surfer, Aspen HYSYS, myQuorum,
CHEMCAD, PIPEPHASE, Petro-SIM, ATMOS Simulation Suite, Studio 5000 (Anon., n.d.).
Pipesim solver software
The PIPESIM software is a multiphase flow simulator designed to accurately replicate and
digitally connect oil field facilities (subsurface reservoirs, wells, flowlines, flowstations, and
export terminals). It can be used as a design tool for the sizing of transport processes like
flowlines, pipelines and processing facilities like flowstation and central processing facilities
(CPF) during field development, or redevelopment design process. PIPESIM models can also
be used to design and overcome fluid flow challenges and optimize production. The details of
the governing basic fluid flow equations are discussed in detail in section 8.4 on Volume, pipe
diameter, leak rate effect on pressure gradient method which yields:
𝑉 =π𝑟4
8𝜇
∆𝑃
𝐿
which is a form of Darcy law for single phase fluid in a pipe of radius r which states that
𝑞 = −𝑘𝐴
𝜇
𝑑𝑝
𝑑𝑥
where V and q are rate of flow in the direction x and A is flow area.
5 Schlumberger is an EP services company and specialises in the provision of technologies for reservoir
characterization, drilling, production, and processing. Available at https://www.slb.com/
Page 141
141
The Darcy law is the basic equation in hydrocarbon exploitation and transportation which was
derived from a combination of mass conservation and momentum conservation equations.
Several proprietary software have been designed and used in finite element analysis to solve
the Darcy equation for multiphase flows using well documented two-phase correlations.
Multiphase correlations depend on flow regimes and gas phases of the composition flown and
are used to generate most representative conditions for the systems being solved. PIPESIM is
designed for production optimization from reservoir up to the well head and from the well head
through to production terminal. The main use of multiphase correlations is in the estimation of
pressure drop within the tubing. Some of the well-established multiphase flow correlations
used in the oil industry and their respective publication dates (El-Moniem Aly, 2016) include
Poettmann & Carpenter (1952), Gilbert (1954), Duns & Ros (1961), Fancher & Brown (1963),
Hagedorn & Brown (1963), Orkiszewski (1967), Aziz & Govier (1972), Beggs & Brill (1973),
Cornish (1973), Gray (1978), Minami & Brill (1987), Ansari et al (1994) and Chikshi et al
(1996). The applicable multiphase correlation depends on flow regime which can be wavy,
annular, dispersed, froth, bubbly, slug, plug or stratified and these regimes on their own depend
on crude flow rate, pressure and PVT properties of the crude.
Crude transport, as discussed in this thesis, involves the pumping of stabilised crude from
flowstations to the terminal hence the constraints for stabilized fluid evacuation includes the
injection rates and pressures at several flowstations. Other constraints would be the rate of flow
to ensure that fluid segregation do not occur at low rates and pipeline erosion due not occur at
high pump rates. But these are design parameters of any existing pipeline and hence not subject
for this research which is focussed on crude evacuation during the operate phase. Also, fluid
transport from flowstations to the export terminal involves the transport of stabilised crude
which is a single fluid transport process. Notwithstanding that PIPESIM is equipped with the
several multiphase correlations available in the EP industry, the use of any of these correlations
Page 142
142
is not applied in this study because crude evacuation involves the transport of single-phase
stabilised crude. Only characteristic pump curves at respective injection points are applied.
Schlumberger supplies the hydrocarbon EP industry’s most comprehensive range of products
and services, from exploration through production, and integrated pore-to-pipeline solutions
that optimize hydrocarbon recovery to deliver reservoir performance sustainably. The closest
competitor to Schlumberger in the supply of similar range of oil services products is
Halliburton. Halliburton6 company is an American multinational corporation, employs
approximately 55,000 (Schlumberger employs about 110,000 people) and had a revenue of 24
billion USD in 2018 ( Schlumberger had a revenue of 32.82 billion USD in 2018). In terms of
size7 and return on investment Schlumberger, with a 2020 income of $10.5b for 2020 is
comparable to ExxonMobil with net income of $14.3b for 2019.
Some of the optimisation success stories of Pipesim as documented by Schlumbeger include:
• PIPESIM Simulator Increases Incremental Gas Production in Mature field by 10% in
Ukraine (Schlumberger, 2020).
• Staatsolie Optimizes Pipeline Network Management with PIPESIM Software,
Suriname (Schlumberger, 2013b).
• AMAPETCO Optimizes Subsea Flow Assurance with PIPESIM Modelling, Egypt
(Schlumberger, 2013a).
• Severneftegaz prom Reduces Operating Expenses by Using PIPESIM Software,
Russia (Schlumberger, 2011).
6 https://en.wikipedia.org/wiki/Halliburton 7 https://craft.co/schlumberger/competitors
Page 143
143
PIPESIM, according to Schlumberger, is based on Basic Open-source Mixed INteger
(BONMIN) framework and applied on Mixed Integer Non-Linear Program (MINLM)8
MINLPs, which arise in many real-world applications, are optimisation problems where some
of the variables are constrained to take integer values and the objective function and feasible
region of the problem are described by non-linear functions. (Shammari, 2019)
This research involves the modelling of the pumping of stabilised crude and so only verified
the validity of results from PIPESIM through an operational workflow used in subsurface
engineering modelling. This involves the regeneration of some input data or some midpoint
data from software output result. E.g., if a geological model of a reservoir is created, from any
given software, based on logs from some wells, we can test the model calibration by generating
some pseudo logs from the created geological model near some well location and compare such
pseudo logs with actual log input. A good match between the pseudo log and the actual log is
a validation of the modelling software whose modelling proprietary routines are not usually
openly available nor evaluated on case-by-case basis. This process was used in the testing of
the models created in PIPESIM through the recalculation of the live crude viscosity of
evacuated wells from the PIPESIM output results from figure 46. This result was used as a
confirmation of the PIPESIM software whose detailed coding architecture is proprietary but
with industry wide acknowledged capability. Major organisations in the EP industry have a
highly rated and proprietary routine for certification of software and PIPESIM is used by these
EP companies around the world who have certified the use of PIPESIM in their organisations.
8 PIPESIM network optimizer, webinair, Jun 24 2019 https://www.software.slb.com/products/pipesim
Page 144
144
6.3 Chapter summary
The originally recommended concept of using pre-leak data prognostic model for smart
operations analysis method was argued as unworkable due to data paucity hence this
necessitated a revisit of post-leak diagnostic data model for smart operations analysis method.
Even this post-leak diagnostic data processing methodology requires some data which currently
are not available to the required intensity hence necessitating some further research for the
generation of the required data. The use of computer simulation, instead of rig-based laboratory
experiments, was chosen based on cost, time requirement, and ability to replicate actual
pipeline.
PIPESIM flow simulation software from Schlumberger was chosen based on personal
knowledge and peer reviews. Request was made to Schlumberger UK and a research version
of the software was donated to DMU. Pipesim is widely used around the world. It is a
proprietary software based on Basic Open-source Mixed INteger (BONMIN) framework and
applied on Mixed Integer Non-Linear Program (MINLM), but the robustness of the software
was evaluated based on recalculation of input variable from basic flow equation based on
output results from the software. This result was used as a confirmation of the PIPESIM
software whose detailed coding architecture is proprietary but with industry wide
acknowledged capability.
Page 145
145
7 PIPELINE SECTIONAL LEAK EXPERIMENTS
7.1 Introduction
Crude oil transport involves the pumping of stabilised crude from flowstations through delivery
lines to trunklines, or directly from flowstations to trunklines for delivery to their respective
export terminals or inland crude refineries. At export terminals, crude is processed to export
quality and sold to ocean tankers for export while processed crude at inland refineries are
redistributed through refined product lines. Both the delivery lines and trunklines are major
live arteries in the EP process as crude are continuously transported through them with very
minimal interruptions.
The literature review has highlighted the usefulness of Hydraulic flow simulation for accurate
well flow modelling and performance prediction. It has also been conceptually advocated on
section 3.4.4 on Smart fields operation page 76 that, if we could model the production
performance of a pipeline then we could also use such a model to determine leak or crude theft
points and possibly estimate the rate of leak or theft. Two study base models, of a major
trunkline and a commingling well delivery line, were therefore created and used together with
other conceptual experiments, to test this concept. The trunkline experiments are for
reprocessing of collected data for the generation of intermediate trunkline pressure
measurements for the testing of the research hypothesis. The delivery line evacuation
experiments were simulated to generate data for testing the relationship between flowrate and
leak rate on one hand and pipeline transmission pressure on the other hand. Some of the
delivery line experiment involves variation of the base model data for evaluating sensitivities
of key flow parameters.
7.2 Basis for simulation setup
An initial review of some installed trunklines in the Niger delta shows that:
Page 146
146
• A major evacuation trunkline could be as long as 160km and acts as a trunk, or
backbone, unto which several flowlines and delivery lines spike fluids at intervals for
transmission to the export terminal. The diameter of these trunklines could, based on
volume of crude being evacuated, vary from 12 inches up to 36 inches as more crude
are injected.
• The crude evacuation energy is provided by the respective flowstation pumps that are
sized such that preceding upstream pumps at each spiking point operate at slightly
higher pressures needed to overcome gravity and viscous forces upstream of
downstream pumps while subsequent downstream pumps act as booster pumps at each
injection point. As a result of this configuration, the pipeline evacuation network is a
constrained open system with pressures decreasing from upstream towards the terminal
where crude is discharged at a pre-set pressure that is higher than atmospheric pressure.
• The crude discharge pressure at the export terminal is maintained at some pre-set point
in other to maintain some form of flow regime throughout the length of the trunkline.
The evacuation or crude transport process therefore involves filling the trunkline with
crude and pressuring the pipe to the pre-set terminal discharge pressure before the first
crude is received at the terminal. As a result of this, the discharge point pressure at the
terminal may not be suitable for use as a pressure monitoring point. A suitable set of
pressure points, upstream of the terminal discharge point, should therefore be chosen
for monitoring the effect of crude theft on transmission pressures.
Available pipeline configuration and production data from one major Niger Delta trunkline
were used to construct a pipeline evacuation model in PIPESIM. The created model is a 75km
pipeline with three sections: 18.96km, 20-inch diameter line between FS1 and BC_MF;
9.44km, 24-inch diameter line between BC_MF and FS4_MF and 45.87km, 24-inch line
between FS4_MF and Terminal. This Trunkline was also configured to receive additional crude
Page 147
147
oil from two other sources at BC MF as shown in Figure 32 below. The first flowstation
supplies its crude via a delivery line to the modelled trunkline case which delivers some
105,000 bpd to an export terminal.
Figure 32. Trunkline case simulation experiment
For ease of analysis, one node is added respectively to each trunkline section. Three flow
conduits with check valves are attached at these additional nodes for use in simulating hot
tapping and crude theft operations as shown in figure 33.
Page 148
148
Figure 33. Trunkline case simulation experiment with crude theft tapping points.
All the attached crude tapping points were isolated using installed check valves after which
crude evacuation exercises were simulated to generate pressure responses as required. Figure
34 shows the pressure response without leak and this result will be used as a baseline for all
simulation exercise on this trunkline for the evaluation of pressure responses due to leak.
Figure 34. Trunkline case pressure profile without a leak
Page 149
149
7.3 Single sectional leak experiment
This sectional leak investigation aims at trying to distinguish leaks from any of the three
sections of the case pipeline being investigated. The experimental setup is as shown in figure
33. Single leaks of 5,000 bpd, 10,000 bpd, 15,000 bpd, and 20,000 bpd were respectively
simulated at TP1, TP2 and TP3 and the effects of these simulated leak on nodal pressures at
TP1, BC_MF, TP2, FS4_MF, and TP3 were recorded. TP1, TP2 and TP3 represent simulated
theft (or tap) point 1, 2 and 3 respectively. FS4_MF is the manifold for the injection of fluid
from flowstation 4 while BC_MF is a central major manifold.
The required leak simulation is achieved by activating the desired leak point (TP1, TP2, or
TP3) and opening the check valve such that the desired leak or theft volume flowrate can flow.
This leak effect could also be achieved by creating a pressure differential at the desired leak
points or by installing chokes at each tapping point and opening such chokes as desired to get
the required crude rate to flow in the required leak direction.
The pressure responses at all monitoring nodes during the simulated crude evacuation operation
were downloaded and documented after each simulation. These respective records were then
used to generate pressure differential plots as shown in figures 35, 36 and 37 respectively for
leaks at TP1, TP2 and TP3, respectively. The pressure differential for the respective leak
simulation is the difference between the operating pressure at any given point when there is no
leak and the respective pressures during a corresponding leak.
Page 150
150
Figure 35. Pressure loss (psi) due to leak at TP1
Figure 36. Pressure loss (psi) due to leak at TP2
0
5
10
15
20
25
30
5000 10000 15000 20000
Pre
ssu
re lo
ss (
psi
)
Leak rate (bpd)
BC_MF TP2 FS4_MF TP3
0
5
10
15
20
25
30
5000 10000 15000 20000
Pre
ssu
re lo
ss (
psi
)
Leak rate (bpd)BC_MF TP1 FS4_MF TP3
Page 151
151
Figure 37. Pressure loss (psi) due to leak at TP3
7.4 Simulation result discussion
One of the easily discernible findings from these experiments is that the farther upstream the
leak point is the wider the pressure differential is between a no-leak situation and a situation
where crude oil is leaking or stolen. This pressure differential narrows as leaks point gets closer
to the export terminal point. Another finding is that the pressure differential is sensitive to the
position of monitoring point with respect to the point of leak. As can be seen from figure 35
and 36 any set of pressure monitoring point upstream to the point of leak would yield the same
pressure differential. Figure 37 for example shows that the pressure differential for all the four
monitoring points plot exactly on the same line. This could be explained based on the leak
position which is downstream of the four monitoring points. So long as the system is concerned
all monitoring points are in steady state until the leak at TP3 and so respond in the same way.
This is a shortcoming for using pressure differentials and would be addressed during future
experiments.
0
5
10
15
20
25
5000 10000 15000 20000
Pre
ssu
re lo
ss (
psi
)
leak rate (bpd)
BC_MF FS4_MF TP1 TP2
Page 152
152
These experiments have therefore demonstrated that crude oil theft could be monitored from
pressure measurements only. These experiments have also proven that you really do not need
to know the pressure values at every position on the trunk line in other to define flow or monitor
leak. Having measurements at just a few evenly spaced positions in each trunkline could just
be enough to monitor leak on that trunkline. This supports the argument that the use of external
Fibre optic sensing, page 80 which is prone to vandalism is not really needed throughout the
length of the pipeline as a way of monitoring leak. However not having enough monitoring
points could also be a handicap because even though we could observe that a leak may have
occurred we may not be able to exactly estimate where the leak is. This same situation exists
if the leak is downstream of the last pressure monitoring point based on current experimental
findings. The question then is what is the recommended spacing between data acquisition
points. Three measurements over a length of 100km is not acceptable and as explained the
spacing between data acquisition point determines the accuracy of measurements and the time
to response. A near perfect (100%) accuracy in leak point determination was achieved in this
thesis but a 93.44% average leak rate prediction accuracy was demonstrated based on the
proposed smart process for pipeline integrity monitoring. The spacing between monitoring
points (5km or 10km) would therefore have some effect on the leak rate prediction accuracy.
But as explained in section 9.6.3 on Pipeline digital information data acquisition system page
201, there is a security risk of vandalism of some of these data acquisition infrastructure, so
there must be a trade-off between the required accuracy and the increase in operating
expenditure due to manning of additional data acquisition infrastructure points. Based on the
forgoing, considering that 24-hour manning of at least two persons per shift everyday it seems
that such data acquisition infrastructure should be recommended every 10 or 15km to avoid
some creep in operating cost for such pipelines.
Page 153
153
The next finding relates to the minimum leak that one can detect from the proposed smart
process from this research. As shown in figure 35, 36 and 37 a leak rate of 5000 bpd from a
105,000-bpd evacuation system would, depending on the position of the sensor give rise to a
pressure differential of 5 – 7 psi. This implies that for this operating Niger delta pipeline a
5000-bpd leak at the far end pressure sensor would lead to a 5psi pressure differential. These
results tend to suggest that 1000bpd constant leak rate could yield 1psi pressure differential,
but can we really measure 1 psi in a Kerotex analogue pressure gauge? Is it possible that a
crude oil thief would invest in a tapping operation just to steal 1000 barrels per day which
translates to 30 gallons per minute? In section 3.4.1 on Fiscal reconciliation page 66 it was
stated that 95% RF (5% leak) for a major truckline is not investigated as this could be due to
different meter accuracies, shrinkage losses due to temperature variations, liberation of
dissolved gasses, or due to leaks. The research hypothesis is focussed on steady state so in
effect we are monitoring trends rather than instantaneous values. The question therefore is what
differential pressure change is worth investigating as a theft point? Every differential pressure
above 5psi is worth investigating for crude theft while pressures less than 5 psi can be
acknowledged as an acceptable reconciliation due to the reasons provided above for this
particular pipeline.
The pressure differential due to leak is proportional to the rate of leak, hence with a few
representative experiments one can create several relationships between leak rate and pressure
differentials which could be monitored at chosen points and used to predict leak point and rate.
A new set of experiments were therefore conducted to confirm this finding.
7.5 Predicting leak using pressure differential
Differential pressure readings at critical pipelines can be designed and used to monitor the
given pipeline integrity as a dashboard. Every automotive, for example, has dashboard that is
Page 154
154
equipped with instruments for measuring parameters like temperature and pressure sensors of
critical safety automotive components and depending on such readings warn drivers of
abnormal vehicle situations which needs investigation. Similarly, since it is proven that leak
during pipeline evacuation could be detected through pressure measurements alone and just an
evenly spaced pressure monitoring points is sufficient for leak detection, one could design a
new process for leak or crude theft detection through pressure monitoring for accurate
prediction of leak point and rate. A new set of experiments were therefore designed to predict
leak based on pressure measurements alone.
Figure 38 was created based on figure 36 data for the purpose of predicting single point leak
around TP2 through the monitoring of differential pressures from a pair of points on either side
of the leak.
Figure 38. TP2 leak monitoring chart from two pressure monitoring points
0
5
10
15
20
25
30
5000 10000 15000 20000
Pre
ssu
re lo
ss (
psi
)
Leak (bpd)
BC_MF TP3
Page 155
155
Frome Figure 38 we can deduce that:
• If a pressure differential of 10psi (139.45 psi actual reading) and 7.5 psi (117.52 psi
actual reading) are recorded at BC_MF and TP3 nodes respectively, it means that 7500
bpd is leaking or stolen around TP2.
• If a pressure differential of approximately16 psi (133.45 psi actual reading) and 12.5
psi (112.52 psi actual reading) are recorded at BC_MF and TP3 nodes respectively, it
means that 12500 bpd is leaking or stolen around TP2.
• If pressure differential of 22 psi (127.45 psi actual reading) and 17.5 psi (107.52 psi
actual reading) are recorded at BC_MF and TP3 nodes respectively, it means that 17500
bpd is leaking or stolen around TP2.
Three experiments were executed to verify these predictions and the results which are in perfect
agreement are as shown in table 2 below.
Table 2. Simulation pressure results for TP2 leaks predicted from figure 38.
Monitoring point Pressure due to 7500 bpd leak
Pressure due to 12500 bpd leak
Pressure due to 17500 bpd leak
(psi) (psi) (psi)
BC_MF 139.56 133.34 127.43
TP3 117.10 112.12 107.39
7.6 Discussion
Table 2 results are conclusive and shows that with only a few sets of experimental results using
representative monitoring points in this pipeline one could generate infinite realisation of leak
failures in the same pipeline that could be used to determine leak in any of the three sections
of the given pipeline through interpolation and extrapolation. The above experiment also
demonstrates that leaks can be detected through pressure monitoring alone. Without any leak
the evacuation pressure plot in any pipeline will be a straight line which obeys the fluid flow
Page 156
156
equations, hence any deviation from the expected normal situation could be used to detect leak.
In a complex network therefore, one could use pressure trending to self-calibrate any pipeline
system for use in the determination of potential leak sources. Once calibrated a knowledge-
based system could be developed such that future leak data can be used to train the knowledge
system to recognise leak. This set of experiments have shown that the leak being investigated
must be bound by one pressure monitoring point on each side and where such condition is met,
we can use the pressure differential alone to determine leak point and leak rate in a single leak
situation. Our capability to extend this finding to a universal pipeline integrity monitoring
process and the possibility of removing the conditional clause, for use of pressure differentials,
was studied further.
7.7 Chapter summary
The engineering basis for using crude oil evacuation modelling for predicting leaks has been
introduced and verified using PIPESIM. A set of experiments have been simulated and the
output data corresponding to several input data has been investigated and recorded. The output
data were analysed to see if through the knowledge of pressure variations at control points
alone we could determine at what point the crude oil leak happened as well as the leak rate.
Observed results were conditionally encouraging and shows that with only a few sets of
experimental results in any pipeline one can generate infinite realisation of leak failures in the
same pipeline that could be used to determine leak point and leak rate in a single leak situation.
The optimum spacing between data acquisition points depends on the likelihood of the
vandalism of these data acquisition infrastructure. This implies that there must be a trade-off
between the required leak rate prediction accuracy and the increase in operating expenditure
due to manning of these additional data acquisition infrastructure. Based on the forgoing,
considering that 24-hour manning of at least two persons per shift every day at these data
Page 157
157
acquisition points it seems that such data acquisition infrastructure should be recommended
every 10 or 15km to avoid some creep in operating cost for such pipelines.
Also, the minimum pressure detection that one could target with the proposed smart process
was discussed and coincidentally could be taken as that which translates to 5% leak. It is
therefore recommended that for a pipeline evacuating 100,000 bpd crude, every differential
pressure above 5psi is worth investigating for crude theft while pressures less than 5 psi can be
acknowledged as an acceptable reconciliation due to operational reasons rather than leak. Just
like appropriate pressure gauges are mounted on pipelines depending on the pressure regime
of such pipelines, the limit of pressure monitoring during fluid evacuation would depend on
the volume evacuated, and pressure regime of such pipeline. It is recommended that the
minimum pressure differential worth monitoring would be that relating to 0.95 RF.
This case study was conducted on a particular pipeline so the results therefrom typically should
apply to this pipeline. It demonstrates that for a given pipeline with evenly spaced pressure
measurement opportunities, we could use the pressure variations from these pressure
measurement points to determine the point of crude leak or theft from any section of the
trunkline. This results conditionally support this thesis hypothesis and would be further studied
for universal application.
Page 158
158
8 BASIS FOR USE OF PRESSURE GRADIENTS IN LEAK EXPERIMENTS
8.1 Introduction
It has been shown that monitoring of pipeline pressures at a few evenly spaced pressure nodes
in a pipeline is just sufficient for leak detection. This chapter attempts to validate the use of
pressure gradient, which is based on pressure differential, for leak detection. Some additional
experiments were therefore executed to fully quantify the relationship between known
influencing parameters like flow rate and conduit size on pressure gradient during crude
evacuation process.
The purpose of this chapter is to highlight the basic theory for fluid evacuation using Navier
stokes equation and simulate some experiments for the generation of intermediate transmission
pressure output results to the required intensity for the testing of research hypothesis.
8.2 Pressure gradient method for leak detection
The crude evacuation pipeline configuration is determined by the location of discharge terminal
in relation to the flowstations being evacuated, and the terrain in between. The properties of
the crude being transported also vary and influence pump energy selection. As documented in
Reflexivity, positionality and research mind map this research is approached from the
perspective of introducing subsurface engineering best practices to pipeline transport systems.
Why should an operator attach cameras to specialised helicopters for daily flights over facilities
as a way of improving pipeline asset surveillance operations as is done in Niger delta (Shell
Nigeria, 2020). This daily helicopter overflies are risky, expensive, damaging to the
environment through continuous emission of greenhouse gases, and unacceptable as cost
discipline through reduction in cost logistics should be championed as done in other
jurisdictions (Oil & Gas Authority, 2017).
Page 159
159
The crude evacuation process from the subsurface reservoir to the export terminal involves
reservoir inflow from the reservoir to the well bore, thereafter there is a vertical fluid flow from
the wellbore to the well head and thereafter we have a horizontal fluid flow from flow station
to the terminal. As a result, and as discussed in Subsurface Hydraulic flow simulation, some of
the PWR in petroleum engineering would be investigated in this pipeline transport research.
Pressure gradients have been used in subsurface reservoir engineering studies to show
transition planes between reservoir immiscible fluids of gas, oil, and water. This is especially
true in newly discovered hydrocarbon accumulations where the luxury of using electric logs,
for fear of being stuck in uncased holes, is not considered as a safe data gathering option. As
part of exploration drilling into these reservoirs, pressure samples therefore are recorded at
prognosticated gas, oil and water sections of the reservoir being explored. The pressures
corresponding to these pressure samples are then used in generating gradient plots at respective
reservoir sections for the estimation of gas-oil contacts and oil-water contacts as shown in
figure 39 .
Figure 39. Pressure gradient plot for reservoir fluid contact determination
Page 160
160
Virgin reservoirs found during hydrocarbon exploration are good examples of a closed
hydraulic system where gas, oil and water are in equilibrium, hence the use of pressure gradient
plot to determine fluid interface planes. Also, in reservoir engineering, having known the
original pressure gradient and size of reservoir we could use the current reservoir pressure to
estimate how much of crude must have been produced. This is a practice worth replication in
this research, where having known the original evacuation pipeline pressure gradient without
a leak, one could use the new pressure gradient to estimate how much fluid is leaking or being
stolen. This is a similar process being followed in resolving trade disputes involving a
subsurface hydrocarbon reservoir straddling two acreages being produced by different
operators, sometimes with independent jurisdictions, where there is an over reliance on the
reservoir pressure trends to determine the total volume of hydrocarbon produced by the
combined operators.
Even though the pipeline crude evacuation process is not a fully closed system, one could
ignore some energy losses and assume that the pressure gradient is constant as conceptualised
in the Basis for design, page 138 such that any deviation from the anticipated pressures could
be used to determine the leak rate. For any crude evacuation to take place there must be a
pressure gradient from the hydraulic source to the hydraulic sink and experiments so far has
shown that in a non-leaking system the pressure gradient is constant. However, the onset of
leak at any point divides the original constant gradient into two sections with different slopes.
For a single leak system this change in slope is sufficient for use in leak point determination.
8.3 Single leak investigation at single point using pressure gradient method.
Additional experiments using a two well commingling study simulation was used for the study
of pressure gradient changes during leaks. Model setup is as shown in Figure 40 while figure
41 and figure 42 show the evacuation pressure response without a leak and with midpoint leak,
Page 161
161
respectively. The data for the respective PIPESIM experiments are shown in Table 3 and table
4, respectively.
Figure 40. Single leak experimental setup
Table 3. PIPESIM output data without a leak
NAME TYPE Pressure Temperature ST
Liquid
Rate
ST Oil
Rate
ST
Water
Rate
ST Gas
Rate
ST GOR ST
WCUT
FL GR FL
WC
psia degF STB/d STB/d STB/d mmscf/d SCF/STB % mmcf/d %
J Junction 211.3647 76.99914 1074 1074 0 0.2829172 263.4236 0 0.01737375 0
J_2 Junction 347.4148 85.69438 1074 1074 0 0.2829172 263.4236 0 0.009588858 0
DL
Sink_1 Sink 50.955 76.99997 1074 1074 0 0.2829172 263.4236 0 0.08220815 0
Well
01L Source 351.6244 86 481 481 0 0.1423761 296 0 0.004904695 0
Well
01S Source 347.5213 86 593 593 0 0.1405411 237 0 0.004613217 0
Page 162
162
Table 4. PIPESIM output data with midpoint leak
NAME TYPE Pressure Temperature
ST Liquid Rate
ST Oil Rate
ST Water Rate ST Gas Rate ST GOR
ST WCUT FL GR
FL WC
psia degF STB/d STB/d STB/d mmscf/d SCF/STB % mmcf/d %
J Junction 162.0959 77.00023 1074 1074 0 0.2829172 263.4236 0 0.0236158 0
J_2 Junction 304.8467 85.6942 1074 1074 0 0.2829172 263.4236 0 0.01134773 0
DL
Sink_1 Sink 50.955 76.99865 724 724 0 0.1907188 263.4236 0 0.05541764 0
TP Sk Sink 19.42701 76.44487 350 350 0 0.09219834 263.4236 0 0.07186557 0
Well 01L Source 309.1536 86 481 481 0 0.1423761 296 0 0.005765545 0
Well 01S Source 304.9595 86 593 593 0 0.1405411 237 0 0.005486531 0
Figure 41. Evacuation pressure profile without a leak
Page 163
163
Figure 42. Evacuation pressure profile with midpoint leak
A general observation from figure 41 experimental result is that the pipeline system is not really
a fully closed system where the pressure gradient is a perfect straight line. This is primarily
because the pressure at both inlet and outlet are constrained, as highlighted in section 7.2on
Basis for simulation setup page 145, to ensure that the pipeline is always filled with crude at
every section. This therefore yields some pressure dissipation in the form of pipeline ballooning
in other to achieve a fully filled pipeline before the discharge of first crude at the terminal. This
ballooning or slightly pressured system causes the pressure gradient slope to deviate from a
perfect straight line. The pressure performance plot from Figure 41 and Figure 42 shows that
this pressure gradient slope deviation could be used to determine the point of leak.
From Figure 41, without a leak
𝜕𝑝
𝜕𝑥 lim𝐽_2→𝐽
=211 − 347
8530= −0.015943 𝑝𝑠𝑖/𝑓𝑡
𝜕𝑝
𝜕𝑥 lim𝐽→𝐷𝐿𝑆𝑖𝑛𝑘_1
=51 − 211
8530= −0.018757 𝑝𝑠𝑖/𝑓𝑡
Page 164
164
The above calculation on the same curve demonstrates some energy dissipation due to
ballooning. This error margin of -17% is a demonstration that some energy is lost by executing
fluid transport in this experimental model. It is possible that in meticulously designed system
such energy loss could not be as much.
From figure 42 with a midpoint leak
𝜕𝑝
𝜕𝑥 lim𝐽_2→𝐽
=162 − 347
8530= −0.02169 𝑝𝑠𝑖/𝑓𝑡
𝜕𝑝
𝜕𝑥 lim𝐽→𝐷𝐿𝑆𝑖𝑛𝑘_1
=51 − 162
8530= −0.01301 𝑝𝑠𝑖/𝑓𝑡
Unlike in Figure 41 where a -17% change in slope was explained as due to pipe ballooning, the
67% slope change in opposite direction recorded in figure 42 is due to leak which modified the
steady flow at the point of leak. This intersection of two gradient lines in figure 42, as
demonstrated in Pressure gradient method for leak detection page 158, is a confirmation of leak
which manifests as a change in resultant pressure gradient. Many researchers have used this
fact for proposing leak detection solutions, but those attempts were also based on auxiliary
instrumentation using experimental rigs and some form of online sensors. This research has
argued, on Frequency response function modelling page 82, that the use of intrusive volume
measurement instrument is not admissible on oilfield trunklines and so will not build on such
literatures that focussed on instrument-based auxiliaries. Rather some experiments were further
studied for the relationship between volume flow rate and pressure gradient relationship.
Page 165
165
8.4 Volume, pipe diameter, leak rate effect on pressure gradient method
Experimental setup and results
This leak simulation experiment is modelled on a 13km delivery line used for the evacuation
of hydrocarbon flow from two wells as shown in figure 43.
Figure 43. Pressure gradient dependency experimental setup
Four equally spaced leak points which divides the pipeline into five sections with distances of
0.2L, 0.4L, 0.6L and 0.8L respectively were attached on a 13 km delivery line for the
evacuation of live crude from well01S and well01L. Leaks representing 0.95, 0.90, 0.85, 0.80,
0.75 RFs were simulated during the evacuation of 6000bpd crude oil through 6-inch pipe
diameters. The respective check valves (Cv1, Cv2, Cv3 and Cv4) were installed to ensure that
links to the corresponding sinks (Sk1, Sk2, Sk3 and Sk4) or theft points could be simulated.
Page 166
166
Pressure gradient response to volume
Table 5 shows the pressure gradients in psi/ft due to simulated single leaks with their resultant
RFs at the respective leak positions (TP1, TP2, TP3 and TP4) during the transportation of 6000
bpd crude while figure 44 shows a plot of table 5.
Table 5. Pressure gradient (psi/ft) response due to leak
RF TP1 TP2 TP3 TP4
0.95 -0.01123 -0.01174 -0.01226 -0.01287
0.9 -0.01142 -0.01191 -0.0124 -0.01297
0.85 -0.01162 -0.01208 -0.01254 -0.01306
0.8 -0.01184 -0.01226 -0.01268 -0.01315
0.75 -0.01206 -0.01245 -0.01282 -0.01325
Figure 44. Leak simulation at different positions on 6-inch flowline evacuating 6000bpd.
-0.01350
-0.01300
-0.01250
-0.01200
-0.01150
-0.01100
0.95 0.9 0.85 0.8 0.75
Pre
ssu
re g
rad
ien
t (p
si/f
t)
flow reconciliation factor
TP1 TP2 TP3 TP4
Page 167
167
Discussions
The use of pressure gradients has eliminated the main shortcoming of using pressure
differential for leak monitoring which is the dependency of the pressure monitoring point to
the leak point being investigated. As can be seen from figure 44 if we know the reconciliation
factor and the respective pressure gradients at various sections of the pipeline, then we can
detect the position of leak. Example, if the RF is 0.9 and the recorded pressure gradient is -
0.01150psi/ft then we can say that the leak occurred between TP1 (but nearer to TP1) and TP2.
Through interpolation, we could say that the leak is at 0.22L from the same datum where TP1
was assessed as 0.2L. The use of pressure gradient has therefore been demonstrated as a capable
technology for use in the estimation of leak point on pipelines especially in single leak
situations. The next set of experiments following on this finding would be used to verify the
relationship between the pressure gradients for varying pipe diameters with flow rate for a
given pipe length.
8.5 Pressure gradient relationship to volume flow rate
The objective of this study was to find a way of estimating leak points without the necessity
for simulation or reading graphs or nomograms already generated for the given pipeline. This
study is basically a test of an AI workflow of trying to analyse a given pipeline with the data
generated from itself through the monitoring of pressure gradient relationship to volume flow
rate in each pipeline section. The different dimensions used for the evacuation of different
parameters for this analysis is as shown in figure 45 below.
Page 168
168
Figure 45. Volume flow rate and pressure gradient relationship
In figure 45 :
V = Volume flow rate in bpd
L is pipe length.
d is pipe dimeter.
r is pipe radius.
�⃗� = (𝑢𝑟 , 𝑢𝜃, 𝑢𝑧) is flow velocity in the r, θ and z direction.
𝜇 is the viscosity of the evacuated fluid.
P is pressure.
The complete description and derivation of the Navier Stokes equation for an incompressible,
isothermal, Newtonian (constant density and constant viscosity) fluid flow with
Velocity �⃗� = (𝑢𝑟 , 𝑢𝜃 , 𝑢𝑧) in cylindrical coordinates could be found on most fluid mechanics
books and particularly as documented (KTH Royal Institute of Technology Stockhom, 2020)
could be written as
Page 169
169
Continuity equation
1
𝑟
𝜕(𝑟𝑢𝑟)
𝜕𝑟+
1
𝑟
𝜕(𝑢𝜃)
𝜕𝜃+
𝜕𝑢𝑧
𝜕𝑧= 0
r component
𝜌 (𝜕𝑢𝑟
𝜕𝑡+ 𝑢𝑟
𝜕𝑢𝑟
𝜕𝑟+
𝑢𝜃
𝑟
𝜕𝑢𝑟
𝜕𝜃+
𝑢𝜃2
𝑟+ 𝑢𝑧
𝜕𝑢𝑟
𝜕𝑧)
=−𝜕𝑃
𝜕𝑟+ 𝜌𝑔𝑟 + 𝜇 [
1
𝑟
𝜕
𝜕𝑟(𝑟
𝜕𝑢𝑟
𝜕𝑟) −
𝑢𝑟
𝑟2+
1
𝑟2
𝜕2𝑢𝑟
𝜕𝜃2−
2
𝑟2
𝜕𝑢𝜃
𝜕𝜃+
𝜕2𝑢𝑟
𝜕𝑧2]
θ component
𝜌 (𝜕𝑢𝜃
𝜕𝑡+ 𝑢𝑟
𝜕𝑢𝜃
𝜕𝑟+
𝑢𝜃
𝑟
𝜕𝑢𝜃
𝜕𝜃+
𝑢𝑟𝑢𝜃
𝑟+ 𝑢𝑧
𝜕𝑢𝜃
𝜕𝑧)
=−1
𝑟
𝜕𝑃
𝜕𝜃+ 𝜌𝑔𝜃 + 𝜇 [
1
𝑟
𝜕
𝜕𝑟(𝑟
𝜕𝑢𝜃
𝜕𝑟) −
𝑢𝜃
𝑟2+
1
𝑟2
𝜕2𝑢𝜃
𝜕𝜃2+
2
𝑟2
𝜕𝑢𝑟
𝜕𝜃+
𝜕2𝑢𝜃
𝜕𝑧2]
Z component
𝜌 (𝜕𝑢𝑧
𝜕𝑡+ 𝑢𝑟
𝜕𝑢𝑧
𝜕𝑟+
𝑢𝜃
𝑟
𝜕𝑢𝑧
𝜕𝜃+ 𝑢𝑧
𝜕𝑢𝑧
𝜕𝑧) =
−𝜕𝑃
𝜕𝑧+ 𝜌𝑔𝑧 + 𝜇 [
1
𝑟
𝜕
𝜕𝑟(𝑟
𝜕𝑢𝑧
𝜕𝑟) +
1
𝑟2
𝜕2𝑢𝑧
𝜕𝜃2+
𝜕2𝑢𝑧
𝜕𝑧2]
A particular solution of the Navier Stokes equation in cylindrical coordinates as depicted in
figure 45 has been solved (Ugaz, 2020) as reproduced in Appendix I to present the relationship
between the flow rate and rate of change of pressure gradient in any flow evacuation system as
𝑉 =π𝑟4
8𝜇
∆𝑃
𝐿………………………………… Equation 8.1
Some experiments were designed to verify this result and thereafter used to design another set
of experiments for leak verification. The pressure gradient variation with flowrate for the 6-
inch pipe is shown in figure 46 while the pressure gradient variation with pipeline diameters
evacuating 2000bpd and 6000bpd are shown as figure 47 and 48, respectively.
Page 170
170
Figure 46. Variation of flowrate V with pressure gradient
The flow rate – pressure gradient relationship in figure 46 is a straight line whose slope could
be used to determine the effective viscosity of the fluid that generated the pump characteristics
using the relationship:
𝑆𝑙𝑜𝑝𝑒 =π𝑟4
8𝜇
The slope in Figure 46 was used to estimate the live crude viscosity as 0.3cp for the crude from
the two wells simulated in PIPESIM. This process of using the output from PIPESIM to re
calculate a property of the crude (viscosity) whose evacuation was simulated in PIPESIM is a
software calibration process. Since the re calculated viscosity is exactly the live crude viscosity
from the evacuated two wells we can confirm the validity of PIPESIM model created for this
delivery pipeline.
Equation 8.1 could also be written as `
𝑉 − 𝑣𝑙 =π𝑟4
8𝜇
∆𝑃
𝐿 …………………………… Equation 8.2
0
1000
2000
3000
4000
5000
6000
7000
-0.012-0.01-0.008-0.006-0.004-0.0020
Flo
w r
ate
(Bp
d)
Pressure Gradient (Psi/ft)
Page 171
171
where the LHS and RHS of equation 8.1 do not balance initially, the leak or stolen volume rate
𝑣𝑙 could be added on the LHS to represent leak such that the two sides of the equation could
balance. This concept was verified as a way of leak quantification as part of the new process
in this research.
Figure 47. Pressure gradient variation with diameter at 2000bpd without leak
Figure 48. Pressure gradient variation with diameter at 6000 bpd without leak
-0.016
-0.014
-0.012
-0.01
-0.008
-0.006
-0.004
-0.002
0
0 1 2 3 4 5 6 7
Pre
ssu
re g
rad
ien
t (p
si/f
t)
Pipe diameter (inches)
-0.025
-0.02
-0.015
-0.01
-0.005
0
0 1 2 3 4 5 6 7
Pre
ssu
re g
rad
ien
t (p
si/f
t)
Pipe diameter (inches)
Page 172
172
Figure 46, 47 and 48 could be said to represent a robustness check of the PIPESIM software
models created.
8.6 Chapter summary
The theoretical basis for the use of pressure gradient for leak detection has been presented
based on analogous comparison to subsurface reservoir engineering practices. One of such
practice is using fluid gradients to determine fluid contact planes. Another practice is using
reservoir pressure depletion to determine cumulative volume produced from well-defined
reservoirs. The relationship between pressure gradient and volume flow rate in pipes for steady
state incompressible fluid using Navier Stokes equation was also studied. Input variables to a
simulated experiment was accurately back calculated using output results of the PIPESIM
simulation experiment. This agreement was taken as a validation of the robustness of PIPESIM
simulation software as well as a calibration of the PIPESIM flow simulation models created as
part of this study.
Having demonstrated that pressure gradients could be used to determine the precise point of
leak in a single leak situation, there is need now to evaluate the possibility of multiple leak
detection.
Page 173
173
9 MULTIPLE LEAK INVESTIGATION & NEW PROCESS IMPLEMENTATION
9.1 Introduction
We have demonstrated that pressure differentials, as well as pressure gradients could be used
to precisely determine point of leak during fluid evacuation process. This approach still
requires some manual computation and sometimes the development of nomograms to augment
this finding with the quantification of leak rate at predicted leak points, hence this focussed
further study on the use of analytical methods or any other improved methods for complete
leak detection and leak rate estimation.
It can be argued as highlighted in Pressure gradient method for leak detection, that if the rate
of reservoir pressure decline can be used to estimate cumulative production in a well-defined
hydrocarbon reservoir, we could investigate the use of rate of trunkline pressure decline from
steady state during crude evacuation for the estimation of leak rate or stolen crude. The solution
to Navier stokes equation presented the relationship of volume flow rate as directly
proportional to pressure gradient as documented in Pressure gradient relationship to volume
flow rate. This therefore means that if the volume flow rate is reduced due to leak, then the
pressure gradient is also expected to reduce so some studies were conducted to verify this
assertion for the quantification of leak rate at predicted leak points. Also, since pressure
gradient is a vector, some additional experimental studies were undertaken for the assessment
of leak rate estimation using vector manipulations. This smart vector analysis is in support of
the chosen post leak data diagnostic smart operations technology. As documented in Smart
fields operations synopsis page 101 the technology solution for the crude oil theft monitoring
in the Niger delta was delivered based on vector analysis of real-time, online pressure
measurements based on post-leak data diagnostic smart operation.
Having demonstrated that the knowledge sought in this dissertation is achievable, some
minimum requirement for the practical implementation of this new process, detailing the
Page 174
174
strategy for pipeline digital information acquisition system and how such data is to be used for
the proposed new smart process for pipeline integrity monitoring, is introduced.
9.2 Gradient intersection method for leak point detection
The results of the pressure profile due to midway leak from the experimental setup in page 160,
is represented below:
From the above pressure plot we could derive two equations for the two straight lines passing
through points (1000, 305), (9530, 162), (18060, 51) and find the point of intersection which
would represent the point of leak.
The straight line between (1000, 305) and (9530, 162) which passes through any set of points
(𝑥1, 𝑦1) could be represented as
𝑦1 = −0.0167𝑥1 + 321.76
Page 175
175
Similarly, the straight line between (9530, 162) and (18060, 51) that passes through any point
(𝑥2, 𝑦2) could be represented as
𝑦2 = −0.0130𝑥2 + 285.89
The x and y in the above equations represent trunkline distance and pressures respectively from
a given locus which could be from the far upstream trunkline evacuation point. By solving the
intersection of these two lines we will get the point (9694, 160) as the point of intersection of
both lines, and this would represent the point of leak as simulated. Similarly, if we have more
than one leak, we could use the same analytical method to determine the points of leak. The
only requirement here is that we must plot all the pressure points first, then generate the
equation for each line, before solving the equations for points of intersection which would
represent leak points.
This use of intersecting straight lines is similar to the process for GOC and OWC estimation in
reservoir engineering as shown in figure 49.
Figure 49. Estimation of GOC and OWC using fluid pressure gradient plots.
Page 176
176
Figure 49 shows the estimated equations for the three pressure gradient lines used in reservoir
engineering fluid contact estimation process. Graphically or by solving a pair of the intersecting
equations gives the point of intersection and by so doing we could get two points which will
represent the GOC and OWC and their respective pressures at the respective contact planes. A
similar method could be applied in pipeline crude multiple leak investigation through pressure
monitoring at several points.
Feng and Zhang (2004) also demonstrated the use of double sensor pressure gradient method
together for leak point detection. Their leak point locating experiment involved using four
pressure sensors (two on each side of simulated leak) to locate simulated leak point on their
experimental pipeline.
9.3 Pressure gradient vector analysis
This study is to investigate the use of pressure gradient changes during crude evacuation for
the estimation of rate of leak or stolen crude. A conservative vector field is a vector field that
is the gradient of some function whose line integral is path independent (Marsden & Tromba,
2003). This makes pressure gradient a vector, suggesting utility for leak prediction and
monitoring. The other properties of the vector are that it should have magnitude and direction,
additive, and remains a vector after multiplication (or division) with a scalar.
If
𝐴𝐶 = 𝐴𝐵 + 𝐵𝐶 ……………………………………………………….………Equation 9.1
We can consider equation 9.1 as a vector equation to represent the result of pipeline gradient
changes during crude transportation. In this case as demonstrated earlier:
AC represents the pressure gradient after a leak.
Page 177
177
AB represents the pressure gradient before a leak.
BC represents the pressure gradient effect due to leak.
Figure 50. (a) Leaking system vector addition. (b) Scalar vector multiplication at constant leak
situation
Figure 50a is a graphical representation of equation 9.1 and shows that without a leak AB
would be equal to AC and the difference between AB and AC continually increases with
increasing leak rate. This means that with continuous increasing leak rate, the enclosed angle
between AB and AC increases. This concept was investigated for leak rate prediction. Figure
50b shows how resultant vector magnitude and direction is influenced when a component
vector is manipulated with a scaler. It should be noted that the vector component BC is
maintained constant in figure 50b. If we multiply AB with a scaler, say 1.8 a new vector A'B
will result, having a different size but same direction. The resultant vector A'C as a result of
addition of this new vector A'B to a known vector BC will result to A'C which will have
different magnitude and direction as shown in figure 50b. Through the multiplication of one
vector component with a scalar in figure 50b, the enclosed angle in the resultant vector from
this manipulation has changed from 21° to 8° such that
A'C=A'B+BC …………………………………………………………………. Equation 9.2
Page 178
178
It should be noted that the vector AB was enlarged by multiplication with a positive number
greater than 1.0. This enlargement could be assumed to represent additional inflow during fluid
evacuation. If so, one can assume that we can decrease the vector AB by multiplying with a
number <1.0 to emulate inflow reduction. This also raises the question of what happens when
AB is multiplied with a negative number. Initial investigations suggest this could represent a
reversal of the energy system for the fluid evacuation.
Some experimental pressure gradient vector studies were therefore undertaken to see if through
any form of pressure gradient vector analysis during crude evacuation one could monitor
pipeline integrity using pressure measurements only. The study tests an AI workflow of trying
to analyze a given pipeline with the data generated from itself during crude evacuation using
the Post leak data diagnostic method AI workflow described in section 5.4. This analytical
method could be used to determine an infinite number of leaks but is unable to quantify the
respective leak rates at each leak point without additional data processing. Equation 8.1 and
other methods involving vectors were further studied on how they could be used to determine
the leak rate at each respective leak point.
9.4 Pressure gradient relaxation method for leak rate estimation
Setup and data generation methodology
A fluid evacuation pipeline without a leak could be represented more mechanistically as a
uniformly loaded elastic beam that is fixed at one end but free to slide at the other end as shown
in figure 51A. A leak at any point will introduce an additional piezometric force, supposedly
in opposite direction as depicted in Figure 51B.
Page 179
179
Figure 51. (A) Non leaking fluid evacuation structural analogue (B) Midpoint leak fluid
evacuation structural analogue
If ω represents a uniformly distributed weight in a structural member, then the same ω is
analogous to the average pump pressure used in a pipeline fluid evacuation system. Also, if
𝐹𝐿 is considered a point load in an elastic structural loading, we could say that the same 𝐹𝐿 in
the structural member is analogous to piezometric force due to fluid leak in a pipeline fluid
evacuation system. If α represent the pressure gradient without a leak, or the deflection due to
uniform load, respectively for the two systems and β represents the pressure gradient in a
leaking system for a pipeline evacuation system or the deflection due to both the point load and
uniformly distributed load in the structural system. Let δ and ε represents the max deflections
due to fluid evacuation without a leak and with a point leak for the hydraulic system or their
respective equivalents in the structural systems as depicted in figure 51A and 51B, respectively.
The relationship between the forces on both systems on one hand and δ and ε on the other hand
were not evaluated here but could be an area of further research.
Page 180
180
It has been demonstrated that pressure gradients calculated from a pipeline evacuation pressure
profile could be used to determine the point of leak. Also, experiments have shown that the
pressure decline, from established trend, due to leak is directly proportional to the rate of leak.
This angular displacement method based on figure 51 was investigated in a leak simulation
experiment as depicted in figure 52.
Figure 52. Pipeline fluid vector diagram during fluid evacuation
Using pressure gradient as a vector, then we could use results of table 5, which had earlier been
used for verification of Pressure gradient response to volume, to estimate the pressure
depression (or relaxation) angle due to a leaking system as a vector as illustrated in figure 52.
If α represent the slope without a leak, and β represent the slope in a leaking system.
Then the depression angle θ due to leak can be estimated as β - α and used to determine the
leak rate and the point of leak using the trigonometrical equation
Tan(θ) =tan(β − α) =tan (β)−tan (α)
1+tan (β)tan (α)
Page 181
181
The same data used in figure 44 was reprocessed using the angular depression method and table
6 shows RF, leak rate and pressure gradients from a model evacuating 6000 bpd crude through
a 6inch pipeline system. The calculated depression angles (θ) due to leaks are as shown in table
6.
Table 6. Calculated depression angles (θ) due to simulated leaks
These results are plotted in figure 53 below:
Zone RF Leak rate
Slope due
to leak tanβ-tanα 1+tanβtanα tanθ θ
TP1 1.00 0 -0.011044 0.000000 0.000000 0.000000
TP1 0.95 400 -0.011229 -0.000185 1.000002 -0.000185 -0.010623
TP1 0.90 800 -0.011423 -0.000379 1.000004 -0.000379 -0.021712
TP1 0.85 1200 -0.011625 -0.000581 1.000006 -0.000581 -0.033288
TP1 0.80 1600 -0.011836 -0.000792 1.000009 -0.000792 -0.045351
TP1 0.75 2000 -0.012055 -0.001011 1.000011 -0.001011 -0.057927
TP2 1.00 0 -0.011044 0.000000 0.000000 0.000000
TP2 0.95 400 -0.011740 -0.000696 1.000008 -0.000696 -0.039867
TP2 0.90 800 -0.011909 -0.000865 1.000010 -0.000865 -0.049546
TP2 0.85 1200 -0.012083 -0.001039 1.000011 -0.001039 -0.059542
TP2 0.80 1600 -0.012263 -0.001219 1.000013 -0.001219 -0.069852
TP2 0.75 2000 -0.012449 -0.001405 1.000016 -0.001405 -0.080495
TP3 1.00 0 -0.011044 0.000000 0.000000 0.000000
TP3 0.95 400 -0.012262 -0.001218 1.000013 -0.001218 -0.069775
TP3 0.90 800 -0.012398 -0.001354 1.000015 -0.001354 -0.077560
TP3 0.85 1200 -0.012537 -0.001493 1.000016 -0.001493 -0.085516
TP3 0.80 1600 -0.012678 -0.001634 1.000018 -0.001634 -0.093624
TP3 0.75 2000 -0.012823 -0.001778 1.000020 -0.001778 -0.101898
TP4 1.00 0 -0.011044 0.000000 0.000000 0.000000
TP4 0.95 400 -0.012873 -0.001829 1.000020 -0.001829 -0.103132
TP4 0.90 800 -0.012965 -0.001921 1.000021 -0.001921 -0.108862
TP4 0.85 1200 -0.013058 -0.002014 1.000022 -0.002014 -0.114591
TP4 0.80 1600 -0.013152 -0.002108 1.000023 -0.002108 -0.120321
TP4 0.75 2000 -0.013247 -0.002203 1.000024 -0.002203 -0.126051
Table 9.1 Calculated Depression angle due to leak
Page 182
182
Figure 53. Depression or relaxation angle θ due to leak
Discussion
Figure 44 and Figure 53 were generated using the same leak simulation results. Figure 44 was
based on pressure gradient analysis while figure 53 was based on the depression or relaxation
angle enclosed by the pressure gradient, so in effect the depression angle analysis is an
improvement upon the pressure gradient analysis method. The results from using the enclosed
angle plot is a set of equally spaced lines representing leaks from equally spaced points at equal
fractional pipeline lengths. This is in line with the particular solution of the Navier Stokes
equation generated earlier (Ugaz, 2020). There is little overlap of the pipeline characteristic
leak lines generated based on depression angle due to leak as shown in figure 53 and these
curves are usable nomogram for pipeline leak detection. The pressure depression plot from
figure 53, like figure 44, is a straight line which further demonstrates that the angle of
depression is proportional to the rate of leak. It is known from trigonometry that the absolute
value of the tangent of a number is equal to the absolute value of the tangent of the negative
number, hence the negative sign on the depression angle calculated in table 5 is based on the
-0.14
-0.12
-0.1
-0.08
-0.06
-0.04
-0.02
0
0.95 0.9 0.85 0.8 0.75D
epre
ssio
n A
ngl
e θ
Reconciliation factor
TP1 TP2 TP3 TP4
Page 183
183
sign convention adopted in figure 52. In reality, and as can be seen from the table of results, a
leaking system represents a pressure relaxation or depressurization on the pipe walls hence the
gradient vector is in the opposite direction and hence of positive signage. This analytical
method is therefore renamed pressure gradient relaxation (instead of depression) method as
any leak in a pipeline will lead to depressurization or relaxation.
Figure 53 can be used as a nomogram that is based on dimensionless parameters of RF,
fractional lengths, and enclosed angle and could be used to determine the leak rate as well as
point of leak anywhere on the modelled 6-inch pipeline. Once there is pressure variation from
expectation, we could use this generated nomogram (figure 53) and the knowledge of operating
RF at the terminal to determine the exact point of leak and leak rate. This nomogram has thus
demonstrated the revised research question on leak rate and point of leak determination through
pressure measurements using the post leak data diagnostic smart operations process.
This new finding could be used as a concluding confirmation, for single leak situation, to this
dissertation that: If we have a way of continuously measuring the steady state conditions of
a pipeline at regular intervals (say 5 or 10km) during operation, then we could, through
deviations trending from the steady state operation from monitoring sensors, determine the
point of leak or crude oil theft and quantify leak rate or theft. The deviation being monitored
here could be the pressure gradient relaxation angle due to leak. It should be noted that the
accuracy of this post leak data diagnostic method depends on the spacing between the data
acquisition points. E.g., if the pressure sensor data are received at 5km interval we could say
that the accuracy of the applied post-leak data diagnostic process, especially with respect to
leak rate estimation, would be better than those estimated from a situation where the pressure
sensor data are received at 10km interval or above.
Page 184
184
9.5 Leak rate determination in multi-leak situation
We have demonstrated that the pressure gradient relaxation angle on a pipeline used for crude
evacuation is directly proportional to the rate of leak. We have also shown that the point of leak
on such a pipeline could be determined by Pressure gradient method for leak detection as
documented in page 158. Also, from a particular solution to the Navier Stokes equation during
the discussion on Pressure gradient relationship to volume flow rate we have also proven that
volume flow rate relationship with the pressure gradient is governed by:
𝑉 =π𝑟4
8𝜇
∆𝑃
𝐿
An attempt at quantification of leak rate during crude oil theft using the above relationship was
investigated using two methods proven in this research.
Leak rate determination in multi-leak situation using PGR method.
The pressure gradient relaxation (PGR) approach involves using the volume flow rate and
pressure gradient relationship to monitor the leak rate in a pipeline fluid evacuation system.
The objective of this experiment as sketched in figure 54 was to simulate multiple leaks and
evaluate the pressure gradients relaxation angles corresponding to the various sectional leaks
such that equation 8.1 could be used to back calculate the respective leak rates that yielded the
recorded pressure gradient relaxations (PGRs).
Page 185
185
Figure 54. Leak rate estimation experimental set up
The volume flowing through a section of the pipeline after a leak 𝑣𝑙𝑖would be represented by
𝑉 = (𝑉 − 𝑣𝑙𝑖) where 𝑣𝑙𝑖
𝑖𝑠 𝑡ℎ𝑒 𝑙𝑒𝑎𝑘𝑖𝑛𝑔 𝑣𝑜𝑙𝑢𝑚𝑒 𝑎𝑡 𝑡ℎ𝑒 𝑖𝑡ℎ 𝑠𝑒𝑐𝑡𝑜𝑛 𝑜𝑓 𝑡ℎ𝑒 𝑝𝑖𝑝𝑒𝑙𝑖𝑛𝑒 and
∆𝑃𝑖+1
𝐿𝑖+1 𝑤𝑜𝑢𝑙𝑑 𝑟𝑒𝑝𝑟𝑒𝑠𝑒𝑛𝑡 𝑡ℎ𝑒 𝑝𝑟𝑒𝑠𝑢𝑟𝑒 𝑔𝑟𝑎𝑑𝑖𝑒𝑛𝑡 𝑎𝑡 𝑡ℎ𝑒 𝑖
+ 1 𝑠𝑒𝑐𝑡𝑖𝑜𝑛 𝑜𝑓 𝑡ℎ𝑒 𝑝𝑖𝑝𝑒𝑙𝑖𝑛𝑒 𝑎𝑓𝑡𝑒𝑟 𝑡ℎ𝑒 𝑣𝑙𝑖 𝑙𝑒𝑎𝑘
Therefore, by substituting for V and pressure gradient at the 𝑖 + 1 section of the pipeline in
equation 8.1 we could calculate the leak 𝑣𝑙𝑖 in the 𝑖𝑡ℎ section of the pipeline. The process here
would involve working from “knowns to the unknowns” by working from source to sink and
step wisely estimating respective leaks in multiple leak situation.
Some experiments were therefore simulated in PIPESIM to test this PGR method for multiple
leak detection as shown in figure 55.
Page 186
186
Figure 55. PIPESIM multiple leak simulation experiment
The first experiment involves two leaks of 1000bpd and 1500 bpd at tapping points 1 and 3
designated as TP1 and TP3, respectively. Figure 56 shows the pressure plots from where we
could identify the two leak points as simulated.
Figure 56. Delivery line transmission pressure profile with two leaks
Page 187
187
Having identified that there are two leaks at 5250ft and 22310ft as modelled, the respective
leak rates were evaluated using equation 8.1 through the calculation of the pressure gradient
slopes on the above plot. To achieve this, we would evaluate the pressure gradients at three
points: before TP1 leak; after TP1 leak to demonstrate the effect of TP1 leak and after TP3 leak
to demonstrate the effect of both TP1 and TP3 leaks. The principle used here were
demonstrated in Pressure gradient relaxation method for leak rate estimation page 178.
Pipeline slope before the first leak at TP1
𝜕𝑝
𝜕𝑥lim
𝐽1→𝑗2=
448.3121 − 503.4499
5249.612 − 984.2992= −0.0129270238 𝑝𝑠𝑖/𝑓𝑡
Pipeline slope after the first leak at TP1
𝜕𝑝
𝜕𝑥lim
𝐽4→𝑗6=
234.1172 − 348.2906
2310.87 − 13780.24= −0.0133849903 𝑝𝑠𝑖/𝑓𝑡
Pipeline slope after the second leak at TP3
𝜕𝑝
𝜕𝑥lim
𝐽6→𝑗8=
147.5197 − 219.4181
30841.49 − 22310.87= −0.0084282737 𝑝𝑠𝑖/𝑓𝑡
The above pressure gradient calculations would lead to three respective equations derived from
equation 8.1 below.
𝑉 =π𝑟4
8𝜇
∆𝑃
𝐿
Where 𝐾𝑖 =π𝑟4
8𝜇
6000𝑏𝑝𝑑 = 𝐾0 ∗ (−0.0129270238) 𝑝𝑠𝑖/𝑓𝑡 …….…………………………….Equation .9.1
Similarly
6000 − 𝑣𝑇𝑃1 = 𝐾1 ∗ (−0.0133849903) ……… .. ………………………………Equation 9.2
Page 188
188
6000 − 𝑣𝑇𝑃1 − 𝑣𝑇𝑃3 = 𝐾2 ∗ (−0.0084282737)…… . .. ………………………...Equation 9.3
𝑣𝑇𝑃1 + 𝑣𝑇𝑃3 = 2500………………………………………………………………Equation 9.4
𝑣𝑇𝑃1 and 𝑣𝑇𝑃3 represent the simulated leak rates at tapping points TP1 and TP3 respectively.
To estimate 𝐾𝑜 from equation 9.1 both the LHS and the RHS should be on the same unit of gf,
cm, s.
Equations 9.1, 9.2, 9.3 and 9.4 has more unknowns than available equations so could not be
solved without some assumptions. Any assumption unfortunately would lead to some errors,
but we can still make some assumptions and test whether the errors emanating therefrom are
acceptable.
If we assume that
𝐾0 = 𝐾1 = 𝐾2 ……………………………………………………………………Equation 9.5
then using this value of K and solving equation 9.1 in corresponding units yields
𝐾0
=6000(𝑏𝑏𝑙/𝑑) ∗ 158987.295(cm3/𝑏𝑏𝑙)
(24 ∗ 60 ∗ 60𝑠/𝑑)
30.48𝑐𝑚/𝑓𝑡
−0.0129270238 (𝑝𝑠𝑖/𝑓𝑡) ∗ 70.303(𝑔𝑓/cm2)
𝐾0= -370,290.427 cm2/gfs
Using the assumption 𝐾0 = 𝐾1 = 𝐾2 and solving equation 9.2 would yield.
𝑣𝑇𝑃1 = 1,043 𝑏𝑏𝑙/𝑑𝑎𝑦
Similarly using equation 9.3 and the value of the first leak rate 𝑣𝑇𝑃1
𝑣𝑇𝑃3 = 1,835 𝑏𝑏𝑙/𝑑𝑎𝑦
The estimated total leak rate from the use of the PGR method above is 2878bpd but the total
simulated leak was 2500bpd. If we use this knowledge which is what was received at the
terminal during the leak simulation, then some adjustment must be made using equation 9.4 so
that our revised leak rate at simulated tap point 3
Page 189
189
𝑣𝑇𝑃3𝑟 = 1,457 𝑏𝑏𝑙/𝑑𝑎𝑦
Similar evaluations were made for a second experiment which involved 1000bpd and 2000bpd
leaks at TP1 and TP3, respectively. The results of both experiments are summarised as shown
in table 7 below with the respective error margins. Equation 9.4 is not part of the proposed
PGR process but an additional information arising from the knowledge of RF which was
especially useful. Without the use of this information the errors in estimating the second leak
rate would be unacceptable. This unacceptable error is due to the assumptions made on the
value of K which ideally varies with varying remaining flow after each new leak. Table 7
summarises the results of this PGR evaluation.
Table 7. Leak rate prediction results using solution of PGR method.
Evacuated Volume in bpd
Leak
point
Simulated
leak rate
(bpd)
leak rate from
PGR process
alone (bpd)
Error due to
PGR alone
(%)
leak rate from
PGR Process
and RF (bbl/d)
Error due
to PGR
and RF
(%)
1 6000 TP1 1000 1043 4.3 1043 4.3
TP3 1500 1835 22.3 1457 -2.8
2 6000 TP1 1000 973 -2.7 973 -2.7
TP3 2000 1702 -14.9 2027 1.4
The first leak rate estimation using this PGR method is quite accurate but unfortunately the
second leak rate prediction error is unacceptably high. However, the RF information was used
to control the estimate of the second leak in a two-leak situation. This luxury of using the RF
to control the prediction result after the first leak therefore means that this PGR process could
not be used beyond two leak situations as this would lead to unacceptable errors beyond the
second leak. This error beyond the second leak estimation is due to the assumption made in
equation 9.5 about K in all pipe section irrespective of remaining flow after leak in those
sections. Transmission flow constant K is a system characteristic which is related to volume
flow so equation 9.5 is invalid and this makes the use of this method for multi-leak estimation
beyond the second leak erroneous. As stated in the Solution pathfinder mind map (page 112)
Page 190
190
the assumption that K is constant throughout the length of the pipe, irrespective of the leaks at
respective section was a convenient (but progressively wrong assumption with increasing leak)
assumption needed in a blind guess for some semblance of the truth in simple leak experiments.
We now know that K is not constant so the usability of this PGR process for multi leak
prediction beyond the second leak will depend on further study for evaluation of the
dependency of K, for respective sections, on the flow volumes through such pipeline sections.
Otherwise, this PGR process would be valid in the evaluation of a two-leak situation only.
Leak rate determination in multi-leak situation using EAVR method.
A second attempt at quantifying the leak rate at each leak point in multi leak situation involved
the use of enclosed angle vector relaxation (EAVR) method which is based on Pressure
gradient relaxation method for leak rate estimation discussed in page 178. Some additional four
(4) experiments were conducted to test the option of using the EAVR methods for the
estimation of two or more leak situations. These leak experiments were based on 6000bpd
delivery line fluid evacuation through a 6in pipe some 12km in length. The four leak simulation
results were compared with the result of the no-leak situation. The comparison of transmission
pressures with no leak situation were first used to generate pressure gradients as shown in table
8. This comparison is described as pipeline leak characteristic data. The pipeline characteristic
curve is the pressure response of any pipeline without a leak and some documentation of
anticipated deviation for some given leak position and corresponding leak rate. The pressure
gradients from this pipeline data were then used to estimate the enclosed angle vector relaxation
EAVR as shown in table 8. This EAVR method is for quantification of leak whose locations
has been identified through other means. The shaded areas in the table 8 represent the areas
where the leaks have been simulated and confirmed from PIPESIM pressure gradient plots.
Page 191
191
Table 8. Pressure gradient in psi/ft calculated during leak simulation.
Experiment No leak 0.8TP1_1.6TP2 0.5TP2_1.5TP3 1.0TP2_1.0TP3 1.2TP2_1.2TP3
Slope before TP1 -0.01116718 -0.01228414 -0.01205337 -0.01215404 -0.01236821
Slope after TP1 -0.01209651 -0.01340670 -0.01313498 -0.01325283 -0.01350557
Slope after TP2 -0.01339797 -0.01015110 -0.01349876 -0.01238196 -0.01214624
Slope after TP3 -0.01508198 -0.01063918 -0.01105711 -0.01105711 -0.01015110
Slope after TP4 -0.01742151 -0.01120598 -0.01231157 -0.01231157 -0.01120598
The EAVR uses the Pressure gradient relaxation method for leak rate estimation page 178 and
the result of the analysis is presented in table 9. The angles α and β in this experiment represent
the pipeline pressure gradient without leak and pipeline pressure gradient with leak
respectively. The enclosed angle θ represents the pipeline EAVR due to leak and can be
expressed as
Tan(θ) =tan(α − β) =tan (α)−tan (β)
1+tan (α)tan (β)
Page 192
192
Table 9. Estimation of pipeline EAVR due to leak.
Simulation 𝒕𝒂𝒏(𝛂) 𝒕𝒂𝒏(𝛃) 𝒕𝒂𝒏(𝛂)− 𝒕𝒂𝒏(𝛃)
1- 𝒕𝒂𝒏(𝛂) −𝒕𝒂𝒏(𝛃) Tan(𝛉) 𝛉
0.8TP1_1.6TP2 -0.01209651 -0.0134067 0.001310197 1.000162174 0.001309984 0.007506
0.8TP1_1.6TP2 -0.01339797 -0.0101511
-0.003246868 1.000136004 -0.00324643 0.186006
0.5TP2_1.5TP3 -0.01339797
-0.01349876 0.00010079 1.000180856 0.000100772 0.005774
0.5TP2_1.5TP3 -0.01508198
-0.01105711
-0.004024866 1.000166763 -0.00402419 0.230568
1.0TP2_1.0TP3 -0.01339797
-0.01238196
-0.001016011 1.000165893 -0.00101584 0.058203
1.0TP2_1.0TP3 -0.01508198
-0.01105711
-0.004024866 1.000166763 -0.00402419 0.230561
1.2TP2_1.2TP3 -0.01339797
-0.01214624
-0.001251726 1.000162735 -0.00125152 0.071707
1.2TP2_1.2TP3 -0.01508198 -0.0101511
-0.004930873 1.000153099 -0.00493012 0.282473
As already discussed, the EAVR due to leak is proportional to the leak rate. This means that
EAVR can be plotted for any given pipeline and used to back calculate what leak that may have
created the EAVR at any point. The simulated leak rate is plotted against EAVR (θ) and as
expected it is a straight line as shown in figure 57. This line is called the evacuation pipeline
system descriptive model (SDM) and could be used to determine leak anywhere on this given
pipeline as propounded by this dissertation. This SDM can be used to estimate the leak rate at
any point on this pipeline once a leak point is identified and we are able to calculate the EAVR
at that leak point. Seven out of the eight experiments are in very close agreements with the
predictions of pipeline SDM.
Page 193
193
Figure 57. Delivery line system curve for leak detection based on leak relaxation angle.
As shown in figure 57, R2 of 0.8997 means that the leak rate prediction accuracy based on the
newly developed EAVR concept is 89.97% of the actual leak rate prediction and this is very
good. R2 for Microsoft excel, or a statistical mean squared error as it is generally known is a
measure of event prediction quality of an estimator. The maximum error from using this new
process to simulate two leak situations during eight leak experiments is about 10% as can be
seen in figure 57, hence the use of the EAVR method was adopted for the recommended smart
process for pipeline integrity monitoring using the pre-leak data diagnostic AI workflow.
A forecast can be made from the generated SDM for quantification of leak rates once the leak
position is known as shown in figure 58.
y = 6439.1x + 674.02R² = 0.8997
0
500
1000
1500
2000
2500
3000
0 0.05 0.1 0.15 0.2 0.25 0.3
Leak
rat
e (b
pd
)
Relaxation angle (deg)
Page 194
194
Figure 58. SDM for modelled 6inch trunkline
9.6 Implementation of proposed post-leak data diagnostic leak detection method.
Having achieved an acceptable prediction accuracy in leak point and leak rate estimation based
on post leak data diagnostic smart operations process it is now a good point to discuss the
practical implementation of the proposed smart process for pipeline integrity monitoring.
The concept of plan-do-check cyclic process introduced in section 1.1, Introduction, page 14
is aimed at continuous improvement. This plan-do-check continuous improvement operations
can be considered analogous to a conical spring where the planer axis represents the projected
plan-do-check loop while the vertical axis represents the continuous improvement after each
cycle as conceptually represented in the conical helix in figure 59. Using this example, it should
be noted that the planner diameter of the conical spring continuously reduces as it pitches
upwards. This represents a convergence in solution that follows any completed plan-do-check
loop.
0
2000
4000
6000
8000
10000
12000
14000
16000
18000
0 0.5 1 1.5 2 2.5
Leak
rat
e b
pd
EAVR (deg)
Page 195
195
Figure 59. Conceptualisation of plan-do-check continuous loop as a conical spring.
It was discussed that one of the reasons why some level of smartness has not been applied to
pipelines could be because it is considered a consumable in the oilfield development equation
but that seems to be changing. Digital twins which offer detailed representation of real-world
products will be the innovation backbone of the future, enabling a conceived system to be
simulated and tested before a physical prototype is built (Gaus, 2019). So how do we contribute
to this desired change in pipeline transportation process?
Uncertainty management and reduction of leak signal variability
Uncertainty represents a state of limited knowledge where it is impossible to exactly describe
the existing state, a future outcome, or more than one possible outcome. Uncertainty arises in
partially observable and/or stochastic environments, as well as due to ignorance, indolence, or
Page 196
196
both (Norvig & Thrun, n.d.). According to Norvig9 and Thrun10 in their definitions relating to
uncertainty management.
• An environment is called fully observable if what your agent can sense at any point in
time is completely sufficient to make the optimal decision i.e., its sensors can see the
entire state of the environment. That is in contrast to some other environments where
agents need memory to make the best decision.
• Deterministic environment is one where your agent's actions uniquely determine the
outcome. In stochastic environment, there is certain amount of randomness.
• A discrete environment is one where you have finitely many action choices, and
finitely many things you can sense. For example, in chess there is finitely many board
positions, and finitely many things you can do.
• In benign environments, the environment might be random. It might be stochastic, but
it has no objective on its own that would contradict your own objective. For example,
weather is benign. Contrast this with adversarial environments, such as many games,
like chess, where your opponent is really out there to get you.
Some discussions on how the spacing for each pressure monitoring point (5km or 10km) will
affect the accuracy of leak detection has been documented in section 9.6.4 on Smart process
for pipeline integrity monitoring, page 203. We can say that the errors associated with leak
estimation using the new process recommended by this research depends, among other things,
on the frequency of pressure sampling points. There are also some errors that could arise due
to input measurement and sampling techniques that are not able to capture pressure differentials
due to leaks. The input parameters are limited to only pump pressures and volumes at respective
spiking points and the pipeline pressures at pressure monitoring points on the pipelines.
As documented in section 3.4.6.2 on Vibration modelling page 90, one of the reasons why the
use of external vibration sensors for this research was not progressed is that the level of
vibration generated during crude evacuation in large pipes are small and could be masked by
background noise. Having chosen to progress the post leak data diagnostic method using
9 Peter Norvig (born December 14, 1956) is an American computer scientist. He is a director of research at Google, LLC, and used to be its
director of search quality. 10 Sebastian Thrun (born May 14, 1967) is CEO of Kitty Hawk Corporation, and chairman and co-founder of Udacity. Before that, he was a Google VP and Fellow, a Professor of Computer Science at Stanford University. At Google, he founded Google X and Google's self-driving
car team. He is also an Adjunct Professor at Stanford University and at Georgia Tech.
Page 197
197
pressure gauges, how do we ensure that measurement variability and background noise does
not mask the pressure changes due to leak which the transducers and the new process are
supposed to detect? Figure 60 shows a recorded pressure variability of over 100psi during a
high-rate gas well test. A typical pipeline operates at about 500 psi far upstream and at about
100psi at terminal discharge. If the employed pressure transducers have up to 50psi variability
at any point, then it means that we are unable without some data processing to detect leaks that
are caused by pressures around 50 psi leak.
The use of averages as a method to reduce leak signal variability, which is based on the
principle that as sample size grows its mean will get closer to the average of the whole
population, can be applied to reduce variability in the leak signal and in input data for this
recommended new process (Henrie, Morgan; Carpenter, Philip; Nicholas, 2016). We can use
the gas-well clean-up in figure 60 to demonstrate data smoothening for reduction of
measurement variability.
Page 198
198
Figure 60. Gas-well clean-up test data
We can isolate the FTHP from figure 60 and see how the FTHP variability can be reduced. In
this approach, we could use a simple three-day moving average, or we can use a time-weighted
three-day average (0.5, 0.3 & 0.2) to reduce the FTHP data variability as shown in figure 61
below.
Figure 61. FTHP data averaging methods
6,900
6,920
6,940
6,960
6,980
7,000
7,020
7,040
7,060
7,080
7,100
1 2 3 4 5 6 7 8 9 10 11 12 13
FTH
P (
psi
)
Day
FTHP (psi) FTHP (3 days average) FTHP (3 days weighted average)
Page 199
199
Using the time weighted average, we can reduce the maximum measured pressure variability
in this example from 100 psi to 10 psi. The weighted average curve is also a much smoother
curve and shows the transition between a transient clean up mode and a steady state gas flow
operation. We can see from this gas well data that any additional inflow (or leak) due to
pressure of about 20psi could be masked by signal noise during the transient region (before the
7th day) using the raw data and the weighted average data but with a properly smoothened
curve from the 10th day the same inflow or leak leading to 20psi or below would be detectable.
Pipeline transmission data could be continuous as in most digital gauges and could be averaged
over the day, over and hour or over quarter of an hour. We have shown through experimentation
in section 7.7 that 5% crude loss over a 100,000-bpd trunkline would lead to a 5psi pressure
differential in a particular Niger delta trunkline. This therefore means that the continuous
pressure data from such fluid evacuation must be smoothened with enough data to detect 5psi
pressure drop if we plan to use the new process recommended in this research to detect such a
leak through pressure monitoring.
In summary, depending on what pressure differential being targeted, we must smoothen the
transmitted pressure curves to a level where such level of target pressure can be detected.
Digital Twining in pipeline fluid evacuation process
The concept of digital twinning was first introduced in Smart fields operations synopsis page
101. The digital twin (DT) was also described as a process that could be used for health usage
and monitoring system (HUMS) for pipeline fluid evacuation process using the selected
research concept of post-leak data diagnostic process. It involves detailed modelling of the
transmission pipeline, inclusion of pressure monitoring sensors as part of the pipeline, design
of data acquisition architecture for capture and transmission of required data from the pipeline
Page 200
200
to processing centre for analysis. The analysis involves processing the pump volume and
pressure measurements and the pipeline transmission pressure through the pipeline SDM for
the prediction of leak points and corresponding leak rates. A potential architectural diagram for
smart pipeline data acquisition system can be conceived as shown in figure 62 below.
Figure 62. Smart pipeline data acquisition system architecture.
Smart pipelines are now seeing a new generation of sensors that are seamlessly integrated into
the pipeline itself. New pipelines will come alive with big data flowing as quickly as the fuel
pumped through it. This next generation Micro-Electro-Mechanical Systems, or MEMS may
be the future, but existing pipelines can be retrofit with sensors too (Martin, 2018). This retrofit
ability is in line with this research proposal that whatever product that arises from this research
is retrofittable on existing flowline not minding that these concepts are still futuristic and
needed for different needs in different jurisdictions. E.g., the need for this solution is as a result
of desperation in Nigeria but the reason for such application in the USA/Canada could be due
to regulatory requirements. According to Martin (2018) oil pipelines typically transport liquid
at pressures between 600 and 1000 psi, while natural gas pipelines go up to 1500 psi. “These
Page 201
201
high pressures are why ruptures can be so serious, and why monitoring and detecting flaws in
advance is so important, particularly given the age of some of these pipes. According to the US
DOT, more than half are at least 50 years old.”.
The pipeline data acquisition system architecture, as recommended in this research is a
coupling, using data transmission and control systems, between the required foundation data
for fluid evacuation monitoring and the recommended smart process for pipeline integrity
monitoring which is driven by the specific pipeline system descriptive model. The data
transmission and control, depending on the level of smart operations sophistication, could
involve information transmission, feed forward and feedback loops between the actual pipeline
and the virtual pipeline that is represented by the model.
Pipeline digital information data acquisition system
Irrespective of the project driver (regulatory or desperation) for the required infrastructure for
pipeline integrity monitoring, there is a general agreement that future pipelines will be smart
with some form of data acquisition system.
The original basic requirement for pressure measurements at well heads and manifolds is the
requirement for installing a Kerotest valve receptor for data acquisition when needed. The
Kerotest valve is a spring-loaded one-way needle valve, just like the spring-loaded valve of
any automotive tyre, and pressures are recorded by installing a Kerotest valve that can depress
the spring so that the system pressure can be recorded as part of surveillance operation. In
modern facilities especially where some level of smartness becomes mandatory due to remote
locations, the use of these type of valves were replaced with pressure transducers which are
wired directly to operations control centre or to an TCP/IP to LAN from where they are
transmitted to the operations centre via some SCADA system.
Page 202
202
The next generation Micro-Electro-Mechanical Systems, or MEMS may be the future as
conceptually depicted in figure 63, but existing pipelines can be retrofit with sensors too, both
external and internal to the pipe.
Figure 63. Future MEMS pipeline data acquisition concept (Martin M.J, 2018)
As discussed, the most important data for this concept is the monitored transmission pressures
which can be measured with an appropriately sized transducers and transmitted through any
suitable internet of things (IoT) system to the data digital processing centre for use in leak
prediction. The IoT is the interconnection via the internet of computing devices embedded in
everyday objects, enabling them to send and receive data11. The simplest IoT example being
our smart phones which are widely used and wired to their paired devices like watches such
that some important critical activities like level of activity (or inactivity), hours of sleep, quality
of sleep, body temperature, humidity, stress, and heart rate can continuously be monitored
using the watch and recorded on our respective phones. Some remote cameras are also paired
with our smart phones such that we can detect visitors to our facilities and even remotely talk
11 Oxford Languages and Google: https://languages.oup.com/google-dictionary-en/
Page 203
203
to such visitors. So why can’t this level of monitoring be installed on trunklines and used to
monitor crude theft? It should be noted however that the concept presented above can only be
operated in a secure area where there are no security challenges so the protection of such IoT
facilities is fundamental to the achievement of the suggested new smart process. If vandals can
unearth buried pipelines for hot tapping and crude theft it will be very easy to vandalise the
installed solar panels and some of the IoT equipment even when there is no visible second-
hand value market for the stolen items. One easy way of addressing this is to build manned
infrastructure around each nodal IoT installation. Such manned infrastructure could be in the
form of the construction of security huts around such IoT infrastructure or building such
infrastructure around suitable landmarks like major structures like road or railway crossings
etc. The other data needed for the implementation of this new process are the injected volumes
and pressures at the respective flowstations such that these data can be transmitted to the
operations centre where they can be used to predict leak or anomaly using the new smart
process for pipeline integrity monitoring.
Smart process for pipeline integrity monitoring
Although, originally conceived as a purely technical solution which is now supported by post-
leak data diagnostic method, the technology recommended need some surveillance support to
forestall the theft of the infrastructure supporting the recommended technology solution.
Cluster IoT centres some 10 or 15 km away from each other, depending on operating cost
incremental, are therefore recommended along the pipeline ROW such that continuous data
acquisition from these IoT clusters are recorded, transmitted, and used for leak point (and leak
rate) determination.
Page 204
204
The basis for this new process is the particular pipelines system descriptive model SDM which
will be used to continuously generate conformance data using all the data receipt from IoT.
The basis for this conformance data is pressure gradient and EAVR and where there is an
EAVR, the EAVR will be used to predict the point of leak and estimate the leak rate. It should
be noted that where the IoT is powered with renewable energy as shown in figure 63 and
depending on the ownership or cost of data transmission we can have a full real-time data
acquisition and analysis all the time. But do we really need a twenty-four-hour day online, real
time IoT data transmission and usage even when there has been no leak in the past few days.
This is where the desirability for optimized pressure data sampling frequency combined
feedback and feed forward loop between the pipeline and the IoT is needed such that the
pressure sampling frequency could be reduced to once or twice a day as necessary. Such
pressure measurements could be instantaneous, or hourly average or daily average data
transmission through the IoT. The detailed steps for the implementation of the smart process
for pipeline integrity monitoring is discussed in chapter 11 of this dissertation.
9.7 Chapter summary
Having achieved a prediction accuracy of 89.97% in leak rate estimation based on four pairs
of data in a simulated leak experiment, we can conclude that we have verified two
complementary approaches for estimating leak point and leak rate during fluid evacuation
through pipelines. A 100% accuracy in leak point determination had earlier been demonstrated
in Gradient intersection method for leak point detection (page 174). The first approach in this
new process is the detection of leak points through pressure gradient relaxation method while
the second approach is the estimation of leak rates for the respective leak points using enclosed
angle vector relaxation.
Page 205
205
These analytical methods built on the use of pressure measurements which were derived from
experiments in support of post-leak data diagnostic smart fields operations. A detailed
technology screening of literature review results had supported the use of smart fields operation
for the testing of documented research hypothesis which is based on use of pressure
measurements for leak monitoring using the post-leak data diagnostic AI method.
One option for the deployment of this new process would be to develop a fully automated
system that reads the required pressures from available monitoring points, processing such data
for the generation of the required leak points and thereafter evaluating the corresponding leak
rates. Another alternative would be to develop some smart process that requires some human
intervention either during data gathering or during parts of the data processing before use in
leak detection or leak rate estimation. In both data strategy the objective is to apply the data to
a new smart process for pipeline integrity monitoring which is now supported with data. The
concept of digital twinning for HUMS for pipeline fluid evacuation process was recommended
as part of this new process. It involves detailed modelling of the transmission pipeline,
inclusion of pressure monitoring sensors as part of the pipeline, design of data acquisition
architecture for capture and transmission of required data from the pipeline to processing center
for analysis. The analysis involves filtering and processing the pump volume and pressure
measurements and the pipeline transmission pressures through the pipeline SDM for the
prediction of leak points and corresponding leak rates.
Data filtering involves strategies to ensure that measurement variability and background noise
does not mask the pressure changes due to leak which the transducers and the new process are
supposed to detect. The use of weighted averages as a method for reducing leak signal
variability, which is based on the principle that as sample size grows its mean will get closer
to the average of the whole population was recommended for data filtering.
Page 206
206
The relaxation angle due to leak is proportional to the leak rate so a prerequisite for this new
process for pipeline Integrity monitoring would be the construction of pipeline system
descriptive model (SDM) prior to leak investigation. This research has therefore recommended
the documentation of SDM as a standard procedure during pipeline commissioning.
In summary, the research process for this dissertation is based on deductive reasoning and
hinged on using available data to support the research hypothesis as a way of demonstrating a
new knowledge that crude oil leaks can be identified through pressure measurements has been
demonstrated. The research hypothesis which says that “If we have a way of continuously
measuring the steady state conditions of a pipeline at regular intervals (say 5 or 10km) during
operation, then we could, through deviations trending from the steady state operation,
determine the point of leak or crude oil theft and quantify leak rate or theft” was reduced to
ability to monitor leaks through pressure measurements only. Some experiments were
conducted, and the results of those experiments not only shows that leaks can be monitored
through pressure measurements only but yielded the EAVR concept which additionally can be
used to quantify leak rate. Having used available data to support our hypothesis we can say that
the new knowledge sought has been demonstrated.
Having demonstrated the documented research objective, as well as recommended some
additional recovery barriers for the management of loss of containment in the crude oil
evacuation HEMP process, marks the end of this dissertation but some further research for
reprocessing of fluid flow processes were undertaken for this new knowledge extension of the
recommended EAVR process into inflow analysis. The difference between leak and inflow
within any space or domain is sign convention. Leaks represent some fluid outflow from a
defined domain while inflow represents some fluid movement into the given domain. As a
result of this, it is believed that any technology that can be used to detect leak can also be used
Page 207
207
to detect inflow: hence some further experiments to test the applicability of the demonstrated
EAVR into inflow prediction.
Page 208
208
10 ADDITIONAL TESTING OF EAVR METHOD FOR LEAK OR INFLOW RATE
ESTIMATION
10.1 Introduction
This research objective of establishing a new process for estimating leak points and leak rate
during crude evacuation process has been achieved through a combination of experimental
results, some fluid mechanical propositions, and some vector manipulation and arguments for
confirmation of some physical principles. Central to the support of this new concept was
pressure measurements for estimation of transmission pressure gradients for the determination
of leak points. Once the leak points are identified, the same pressure gradients used in the
identification of leak points can also be used in the estimation of leak rates by comparing pre-
leak pressure gradient vector and post leak gradient vector and the angle between them which
has been defined as enclosed angle vector relaxation (EAVR).
In the graphical proof of concept documented at Pressure gradient vector analysis it was felt
that this EAVR can be used to estimate fluid inflow in addition to leaks. This also sounds
logical since the difference between inflow and leak is that one is opposite of the other in sign
convention within the domain space being studied. This corollary was tested through two case
studies in subsurface engineering.
10.2 Well inflow and choke performance prediction using EAVR.
As part of well delivery process, subsurface engineers predict well potential based on reservoir
properties like reservoir pressure, thickness, porosity, permeability, and hydrocarbon
saturation. The underlying reservoir influencing sweep parameters are mainly dominated by
reservoir development, reservoir compartmentalization and access to reservoir drive energy.
Other issues that determine well potential include oil and water contact, gas and oil contact,
degree of sand consolidation (for sandstone reservoirs) and size of completion conduit.
Although the well production is governed by its deliverability through the inflow equation,
Page 209
209
there is no reason why the wells inflow, within the wellbore, could not be determined using the
EAVR propounded here as conceptually demonstrated.
Table 10 which shows the results of well performance model at different flowing tubing head
pressures (FTHPs) in 2016 in a Niger delta field for well performance prediction will be used
to test the capability of propounded EAVR method for predicting well inflow.
Table 10. Niger delta well performance prediction table.
Model 1 Model 2 Model 3
Flowrate (bpd) 800 1100 1350
FTHP (psi) 2480 2100 1850
Reservoir Pressure (psi) 2530 2530 2530
Reservoir Dept (ftss) 8785 8785 8785
The inflow SDM for the given well can be estimated using its performance at two different
chokes. Once the SDM is established, the inflow performance at the third choke or indeed any
future choke can be estimated using the established SDM. The choke sizes are not shown in
table 10 but their effects are reflected in the varying FTHPs. The only condition here is that the
reservoir must be undersaturated or such prediction should not be on a very low FTHP, or
choke, where a lot of gas will come out of solution within the well. This condition is necessary
as increasing errors would arise as more gases a liberated from the hydrocarbon as the bubble
point pressure are attained during transport process from reservoir to the well head.
To apply the EAVR theory we must note that some baseline data is needed. This baseline,
which will now be called inflow characteristic curve is based on the well’s vertical lift
characteristics within the tubing which will now be used to predict additional inflow as
expected using the well’s SDM. As a result of this, especially in a well’s vertical lift estimate,
we can use any performance point to represent a point of no-additional inflow. With this point
Page 210
210
and just another point on a different choke we can plot the well’s SDM and use it to estimate
future performance of such wells under varying flowing tubing head pressures (FTHP).
The 2016 model showed three predictions of well performance at different FTHPs. We had
earlier stated that some baseline is needed to create an SDM for the well. We can use the results
of Model 1 (in red fonts) as baseline. Model 1 and model 2 can then be used for the creation of
the well’s SDM using the EAVR method and see if we can predict the flowrate for model 3
using its FTHP and created SDM. The pressure gradient vector is calculated in the direction of
flow between the reservoir pressure, the FTHP and the distance between the reservoir and the
wellhead. The well head is assumed to be at 0 feet subsea (ftss). Using vectors, we can
determine the EAVR between model 1 and model 2 pressure vectors and use it to calculate an
inflow SDM for the prediction of model 3 performance.
The pressure gradient flow vector in model 1 is -0.0056915196 psi/ft.
The pressure gradient flow vector in model 2 is -0.0489470689 psi/ft.
We could, based on table 10, say that the pressure relaxation between model 1 and model 2
yielded additional 300 bpd inflow so that this information can be used to create the required
SDM for the well.
Table 11. Baseline and additional inflow data for Well Inflow SDM estimation.
Experiment tan(α) tan(β) tan(α)-tan(β)
1+tan(α)tan(β) (tan(α)-
tan(β))/(1+tan(α)tan(β)) θ
Baseline -0.005692 -0.005692 0.000000 1.000000 0.000000 0.000000
Additional 300 bpd inflow
-0.005692 -0.048947 0.043256 1.000279 0.043244 2.476124
Table 11 documents the EAVR component computation and can be used to plot an inflow SDM
for the well as shown in figure 64. The well bean up is the controlled or gradual open up of a
well after completion (construction) or repairs until the designed well production potential is
attained, and the process of open up or bean up increases well production while reducing its
Page 211
211
FTHP. It should be noted that, as documented in Pressure gradient vector analysis, that without
a leak or inflow the pressure gradient vector remains constant hence there is no pressure
gradient relaxation or EAVR.
As can be seen from the well’s inflow SDM shown in figure 64, the production rate at any
given FTHP is governed by
𝑃𝑟𝑜𝑑𝑢𝑐𝑡𝑖𝑜𝑛 𝑟𝑎𝑡𝑒 𝑄 = 121.16 ∗ 𝐸𝐴𝑉𝑅 + 800 …………………………Equation 10.1
So, for model 3 we can estimate its EAVR using the FBHP, FTHP and Reservoir depth as 4.1°.
Using equation 10.1 which is the inflow system SDM and the calculated EAVR we can
estimate that the flowrate for model 3 bean up case as 1300 bpd and this is very close to the
1350bpd prediction in 2016.
y = 121.16x + 800R² = 1
0
200
400
600
800
1000
1200
1400
1600
0 1 2 3 4 5 6
Pro
du
ctio
n r
ate
(bp
d)
EAVR (deg)
Figure 64. EAVR based on FTHP during Well Bean up
Page 212
212
10.3 Reservoir pressure effect on well production using EAVR.
One of the principal objectives of production surveillance engineering is continuous
monitoring of production assets: data acquisition; performance modelling; issues identification
and remedial activity planning for production gains. Some of the well specific production
issues include water production, preferential gas production for oil wells, sand production from
sandstone reservoirs. There are also facilities related production issues like understanding
changes to the well’s production envelope and realigning affected wells to more suitable
facilities.
Well tests and flowing bottom hole pressure (FBHP) surveys are therefore regularly obtained
for continuous production optimization. Some tests from a well with declining performance
due to reducing reservoir pressure and increasing water cut are shown in table 12 and an attempt
is made to test this actual well performance with the proposed EAVR method.
Table 12. Production well test data.
Test 1 Test 2 Test 3 Test 4 Test Date Feb 2019 Nov 2019 Jan 2020 Mar 2020 Flowrate (bpd) 1288 903 701 687 FTHP (psi) 690 551 512 490 FBHP (psi) 3310 3022 2883 2856 Reservoir Dept (ftss) 8520 8520 8520 8520
Using the February 2019 data (in red fonts) as a baseline we can compute the respective EAVRs
for the various test dates as shown in table 13.
Table 13. EAVR calculation from well test data.
Test data tan(α) tan(β) tan(α)-tan(β) 1+tan(α)tan(β) (tan(α)-
tan(β))/(1+tan(α)tan(β)) θ
Test 1 -0.307512 -0.307512 0.000000 1.000000 0.000000 0.000000
Test 2 -0.307512 -0.290023 -0.017488 1.005072 -0.017400 -0.996847
Test 3 -0.307512 -0.278286 -0.029225 1.008133 -0.028990 -1.660516
Test 4 -0.307512 -0.277700 -0.029812 1.008279 -0.029567 -1.693595
Page 213
213
Test 1 is used as a baseline and all EAVR were calculated with respect to it and the relationship
between the flowrates and the EAVR is as shown in figure 65.
The flow equation for this example can be written as
𝑃𝑟𝑜𝑑𝑢𝑐𝑡𝑖𝑜𝑛 𝑟𝑎𝑡𝑒 𝑄 = 352.67 ∗ 𝐸𝐴𝑉𝑅 + 1278.4
This case analysis shows that the reservoir energy loss effect on well productivity can also be
analyzed using the EAVR method. One should however note that that at bubble point pressure
gas liberation starts and this could affect the application of this concept. The four test points
are almost perfectly matched as shown in figure 65 with R2 of 0.997.
Table 14 compares the actual flow rates with the predictions using the EAVR method. The
maximum error from this post-leak data diagnostic method using the EAVR method was less
than 3 %.
y = 352.67x + 1278.4R² = 0.9968
0
200
400
600
800
1000
1200
1400
-1.800 -1.600 -1.400 -1.200 -1.000 -0.800 -0.600 -0.400 -0.200 0.000
Gro
ss P
rod
uct
ion
(b
pd
)
FBHP-FTHP Pressure Gradient EAVR (Deg)
Figure 65. Well test system descriptive model.
Page 214
214
Table 14. EAVR prediction vs actual flow data.
Test 1 Test 2 Test 3 Test 4
Test Date Feb-19 Nov-19 Jan-20 Mar-20
Flowrate (bpd) 1288 903 701 687
EAVR predicted Flowrate (bpd) 1278 927 693 681
Percentage error (%) -0.75 2.64 -1.17 -0.86
10.4 Chapter summary
The concept of EAVR was introduced graphically at Pressure gradient vector analysis section
and demonstrated on Leak rate determination in multi-leak situation using EAVR section.
These additional tests on the capability to extend the use of EAVR process as a universal
concept for predicting leak and inflow during fluid evacuation in conduits is now proven and
therefore recommended as part of the smart process for pipeline integrity monitoring.
Page 215
215
11 CONCLUSIONS AND RECOMENDATIONS
11.1 Proposed smart process for pipeline integrity monitoring.
The objective of this research was to recommend an improved process for detecting pipeline
leak or crude oil theft as well as the quantification of such leak rates. The current reactive use
of helicopter overflies which usually kicks off once an unacceptable reconciliation factor is
recorded is risky, inefficient, and lagging in response. Technologies capable of addressing
research objective like fiscal reconciliation; corrosion monitoring; flow simulation; smart field
operation; fiber optic sensing; frequency response function modelling using acoustics or
vibration and floating micro robots were reviewed for possible leads for the design of an
improved process for leak detection. Smart operations technology based on strengths and
weakness analysis exercise came out as the preferred technology for the proposed new process.
Smart fields operation uses artificial intelligence workflow to partially perform human tasks
aimed at reducing the decision cycle time for data-based decisions as well as managing
production data uncertainties. The artificial intelligence operation domain is huge and varied
hence some further study was undertaken to find which aspects of smart operations would be
found more suitable for the achievement of this research objective of leak detection and leak
rate quantification.
A hypothesis or an axiom are basically like two sides of the same coin in the Pragmativists
philosophy and were evaluated for the conceptualisation of suitable approaches to smart
operation process for analysing production data trends for leak detection and quantification.
The production data analysis would be in the form of trend monitoring such that any deviation
from anticipated or established trends could be used to detect leak or crude oil theft. A
pragmativist philosophy was applied to test the hypothesis that “If we have a way of
continuously measuring the steady state conditions at regular intervals (say 5 or 10km) of a
Page 216
216
given pipeline during operation, then we could, through deviations trending from the steady
state operation, determine the point of leak or crude oil theft and quantify leak rate or theft”.
The use of axioms was also tested, for the realisation of documented research objective, using
cause and effect relationship or artificial neural network during pipeline crude evacuation such
that deviations from known data trends could be used for the determination of leak or crude oil
theft. These two data driven smart operations workflows were evaluated for framing a new
process for pipeline integrity monitoring. Machine Learning workflow was introduced as an
optimisation process that could be applied to improve results from these two data driven smart
operation workflows.
One approach to designing a data based smart process in pipeline transport process, based on
use of deductive reasoning on pragmatist epistemology, would be to start with a hypothesis and
then test such hypothesis using observed data to see if observed data follow some trends as
proposed in the hypothesis. Another smart operations approach based on the same pragmatist
epistemology would be to concentrate on observable data and use some axioms to form an
explanatory model of the observed data. This later approach is based on inductive reasoning.
The main difference between these two knowledge systems is that one is based on immediately
acquired (post-leak data diagnostic process) data from the pipeline being investigated while the
other is based on past (pre-leak data prognostic process) environmental data from the pipeline
being investigated or similar pipeline in the past.
In pre-leak data prognostic process methodology, the analysis focuses on events that could be
assessed to have happened before a particular outcome or result is achieved. For example, you
need to have punctured a pipeline before a leak could be established. In post-leak data
diagnostic process (immediately acquired data) methodology we focus on current results to
determine the preceding events. Applying post-leak data diagnostic process methodology, on
Page 217
217
the same example above, we could say that if there is a leak on a pipeline it means that the
pipeline must have been punctured. An attempt was made to process available data through an
SDM model for testing both the conceptualised pre-leak data prognostic process and post-leak
data diagnostic process. Post-leak diagnostic processing is instantaneous, instrument based,
and requires that we have some knowledge of what is flowing while pre-leak prognostic
processing is based on past data events surrounding the pipeline being investigated or a similar
pipeline that have been subjected to the same situation being investigated. The data-based
events which influence pipeline leak, based on pre-leak processing are difficult to generate in
the Niger Delta and hence makes the use of pre-leak prognostic processing methodology
difficult. Post-leak diagnostic process analysis methodology seemed promising since it is based
on measurements. However, the current process of data acquisition practice in Niger delta,
where only three-point data acquisition system is used, limits the level of accuracy achievable
with available post-leak diagnostic processed data methodology. This therefore necessitated a
further study to reprocess the available data to the required intensity for the application of post-
leak data diagnostic processing.
Computer simulation, instead of rig-based laboratory experiments, was chosen for this data
reprocessing exercise based on cost and time resource requirement. Some of the applicable
robust software for such simulation based on reviews include: PIPESIM; Surfer; Aspen
HYSYS; myQuorum; CHEMCAD; PIPEPHASE; Petro-SIM and ATMOS. These software are
expensive but research versions of most of them could be received in support of academic
research. PIPESIM which ranks among the best was chosen based on personal knowledge. A
donation request was made to Schlumberger UK and a research version of the PIPESIM
software was donated to DMU in support of this research. Several sets of experiments were
simulated in PIPESIM and the output data corresponding to respective input data has been
collected, investigated, and analysed. The conclusions of preceding experiments most times
Page 218
218
were used to frame the next set of experiments and this cycle continued until the end of this
research. The actual leak or crude oil theft rate is determined by the difference between the
sum of what is pumped through the system and that which is received at the terminal. This
difference is monitored regularly as terminal reconciliation factors. The PIPESIM simulation
results were analysed for pressure variations at selected pressure monitoring points. The first
investigation was based on transmission pressure differential at such monitoring points.
Observed results turned out to be encouraging and showed that one could generate infinite
realisation of leak failures for the same pipeline that could be used in single leak prediction
evaluation.
The theoretical basis for the use of pressure gradient for leak detection was also discussed as a
practice worth replication from subsurface reservoir engineering workflow. This study was
based on two analogous comparison to subsurface reservoir engineering practice of using fluid
pressure gradients to determine fluid contact planes as well as the use of pressure decline to
determine the total fluid produced from a well-defined subsurface hydrocarbon reservoir. This
leak monitoring results from the use of fluid pressure gradient yielded an improvement over
those from the use of pressure differential for pipeline leak detection. A further study on the
relationship between volume flow rate and pressure gradient in pipes for steady state
incompressible fluid was conducted. PIPESIM simulation results agree with the volume flow
rate and pressure gradient relationship derived from a solution of the Navier stokes equation.
This agreement was taken as a validation of the robustness of PIPESIM simulation software as
well as a calibration to the simulation models created in this study.
Having verified the robustness of the PIPESIM models, the use of two analytical methods for
estimating multiple leaks in any pipeline evacuation system were further studied. These
analytical methods built on the use of pressure gradient which has already been proven. The
Page 219
219
results demonstrated that the use of gradient method is effective in multiple leaks detection in
any pipeline system but would need additional work to be able to assign the leak rates to the
respective leak points. The concept of pressure gradient relaxation (PGR) was introduced and
demonstrated through some vector manipulation which showed that the transmission pressure
gradient vector remains a constant until the onset of leak or theft which leads to a relaxation of
the transmission pressure gradient. This PGR concept was used to progress another set of
experiments for leak rate estimation. The results from this set of experiments reveals that the
leak rate in a single leak situation could be precisely estimated using the PGR method. This
successful result led to the postulation that it is possible to combine the gradient line
intersection method and the PGR method to identify and quantify multiple leaks in any given
pipeline system. This PGR approach was also investigated for estimating the leak position and
leak rate in multi-leak situation. This involved step by step estimation of leak rate by comparing
the volume flow rate and their respective PGRs. Starting from the inlet where we know what
is flowing and what pressure gradient it could generate, the leak rate at each section of the
pipeline could be step wisely calculated from inlet to discharge point. This option did not yield
reliable results beyond a two-leak situation and hence could not be progressed further. Some
further research was therefore needed to progress the use of PGR method beyond a two-leak
system as the assumption of uniform flow constant K becomes unsustainable after the second
leak.
The enclosed angular vector relaxation (EAVR) method was used for multiple leak rate
estimation and the results from this approach were impressive. Every pipeline used for fluid
evacuation has a pipeline leak characteristic curve which is the anticipated transmission
pressure without a leak and how such curve changes with leak. The computation of pipeline
leak characteristic curve is therefore recommended as a standard procedure during pipeline
commissioning so that the recommended smart process for pipeline integrity monitoring from
Page 220
220
this research can be applied for integrity monitoring of such pipeline. This curve can be used
to document the pipeline system descriptive model when plotted against some simulated
EAVRs due to leak. This SDM, once developed can be used to predict leak rate for the given
pipeline. This new process was tested using three case studies and the results from this approach
were outstanding for multiple leak investigation, hence the use of EAVR process was adopted
for leak rate and inflow rate quantification in the recommended smart process for pipeline
integrity monitoring.
11.2 Discussion
Two analytical methods, which uses the pipeline pressure gradient as a basis, were
independently verified in leak point and leak rate estimation. While the use of graphical
gradient line intersection method has the capability for multiple leak identification, the results
from such prediction could be used to respectively calculate the corresponding leak rate for the
identified leak points using the enclosed angle vector relaxation.
The system descriptive model (SDM) earlier introduced in chapter 5 page 104 is now
recommended as a necessity for the implementation of the propose new smart process for
pipeline integrity monitoring. This pipeline SDM was developed as a graph or an equation that
describes the pipeline pressure response relaxation angle as a function of the leak that could
create it. The pipeline pressure relaxation angle itself is based on pipeline leak characteristic
curve which is now recommended to be acquired for any pipeline operating system as a
prerequisite for leak monitoring in any pipeline using this recommended smart process for
pipeline integrity monitoring. The pipeline leak characteristic curve is a plot of pipeline during
normal operation without a leak and how such pipeline would behave through its pressure
response with some simulated leak.
Page 221
221
The results from this approach were outstanding for multiple leak investigation and hence the
use of EAVR process was adopted for the recommended post-leak data diagnostic smart
process for pipeline integrity monitoring. This EAVR approach is unique, very simple, and has
not been applied before nor documented in any fluid transport literature for leak identification
and estimation.
It has become important to distinguish between the technologies reviewed in chapter 3 on
LITERATURE REVIEW page 55 and the mathematical process involved in the solution
suggested by the several authors involved in technology solution relating to leak monitoring
and how they contrast to the EAVR solution recommended in this dissertation. This research
process involved deductive reasoning which starts with a hypothesis then the analysis of
hypothesis for confirmation. The leak detection taxonomy discussed in section 3.3 on
Technology preselection review page 60 addressed all the technologies already applied or have
the capacity for application in leak detection. Most of these technologies were reviewed for
potential application. The technology application in this research is pressure monitoring and
the process for the use of this pressure monitoring using vectors is part of the novelty of this
work. The use of pressure monitoring has been researched by several authors (Ben-Mansour et
al., 2012; da Silva et al., 2005; Feng & Zhang, 2004; Gong et al., 2014; Jin et al., 2014; Kim
& Lee, 2009; P. J. Lee et al., 2005; S. Li et al., 2014, 2016; Liu et al., 2019; Murvay & Silea,
2012; Mysorewala et al., 2015; Omodanisi et al., 2009; Ostapkowicz, 2016; Rojas & Verde,
2020; Verde, 2005; Zhang et al., 2009)
The basis for the leak detection in most of these studies are either pressure and volume direct
measurements or based on indirect measurement of the effect of these parameters. These
indirect effects are either based on pressure pulses, waves, or vibration due to leak. Some of
Page 222
222
these researchers also used pressure gradient monitoring but the process for locating leak points
is different from the outcome of this research.
Feng and Zhang (2004) concluded that double sensor pressure gradient method together with
a flow difference and pressure detection method, for detecting and locating leak in oil pipeline
using only measurements at the ends of the duct. Their work is very simplistic and involved a
set of experiments using four pressure sensors (two on each side of simulated leak) to locate
simulated leak point on the pipeline. This work should be considered as another way of
evaluating the results of sections 9.2 on Gradient intersection method for leak point detection
as documented on page 174 of this thesis. One shortcoming from their work is that it did not
go beyond locating a single leak and neither was it framed to quantify leak rate.
Jin et al., (2014) describes an integrated model implementation of leak detection and location
that can be used for background leakages in liquid pipelines. Their approach includes a
dynamic monitoring module (DMM) and static testing module (STM). The DMM can detect
larger leakages of background ones using the amplitude propagation and attenuation model of
pressure waves. This experimental work is based on a large water distribution rig and uses the
STM, based on the pressure loss model, can detect micro-leakages, which is an effective
compensation for the DMM. Their results show that the integrated model can detect nearly all
leakages but was not designed to quantify the leak rate.
Ben-Mansour et al., (2012) studied some computational fluid dynamic (CFD) simulation of
small leaks in a pipe having 0.1 m diameter using a 3D turbulent flow model in a CFD
simulation and tested their results experimentally. Their steady state simulations showed clear
leak signatures in the pressure and pressure gradient variations along the pipe. Their work
showed that the presence of a leak causes measurable differences in the magnitude and
frequency of the pressure signal spectrum and also in the averaged power spectral density
Page 223
223
(PSD) for the range of 220–500 Hz frequency. Their simulations showed clear influence of the
leak on the pressure gradient along the different paths of the flow inside the pipe. For very
small leaks (below 1 liter/min), this influence is not very strong in the pressure signal, but very
clear in the pressure gradient. The results also indicate much influence of the line pressure and
leak size on the leak flow rate. The results show that the leak causes clear increase in the
magnitude and frequency of the pressure signal spectrum and also in the averaged PSD for the
range of 220–500 Hz frequency. Based on these results, an experimental setup has been
designed and built to verify the above findings using dynamic pressure transducers. Both the
numerical and experimental findings were part of a research project aimed at designing reliable
and robust methods for detecting leaks in water pipeline networks in city underground. It
should be noted that the objective of this research is about monitoring crude theft. Crude theft
is a redirection of some flow to the theft conduit and so the use of frequency monitoring due to
leak, as recommended by Ben-Mansour et al., (2012) does not arise. However, the finding that
there is a very clear signature in the pressure gradient even for very small leaks is germane.
The most current related leak detection research was documented by Rojas & Verde (2020)
These researchers relied heavily on instruments, most of which have been discounted as
inapplicable in oilfield pipeline systems. J. Rojas, & C. Verde (2020) concluded, as
documented here, that a precise knowledge of the hydraulic gradient is required if leaks must
be located. A comprehensive review of pipeline leak research from 2003 to 2017 was
undertaken by Rojas & Verde (2020) as a justification of their 2020 work on the design of an
accurate location scheme for sequential leaks. According to them: “One adaptive observer,
according to Besançon (2007), is applied only for identifying the parameters of the hydraulic
gradient during the detection stage, and the second observer estimates the equivalent leak
position and its piezometric head by assuming that the parameter of the hydraulic gradient is
constant during the leak location time. An extended Kalman filter (EKF) or a Sliding Mode
Page 224
224
Observer (SMO) are suggested for the second observer. Thus, one observer calculates the slow
deviations of the hydraulic gradient when the residual is off, and the other observer precisely
locates the equivalent leak position by using the loss function previously estimated.” Verde
and Rojas considered transient flow model and their real-time experiment is carried out with a
constant upstream pressure and the downstream atmospheric discharged pressure. Their
assumed downstream atmospheric discharge pressure conditions could be said to be not quite
representative of crude oil pipeline evacuation conditions as described in page 145. Their work
is based on wavelets and pressure pulses and were conducted on small pipes in laboratories.
The technology employed is similar to acoustics and vibrations which were earlier discounted
as inapplicable in very large, buried pipelines as documented in page 82.
There are similarities to the two conclusions from this research and that from Rojas & Verde
(2020) even though the two research are based on two different methodologies. The first
similarity which is also in agreement with Feng and Zhang (2004) and Ben-Mansour et al.,
(2012) and others, is that the use of pressure gradient is very vital for leak detection. This
research arrived at this conclusion in two stages. First by testing the research hypothesis that
leaks can be evaluated through monitoring of pressure trends. Thereafter the practice worth
replicating in subsurface reservoir engineering was used to test the usefulness of using pressure
gradients in leak detection and that was found to be invaluable. This research did not just prove
the necessity for using pressure gradient for leak detection, it demonstrated that through some
pressure gradient vector manipulation the effect of leaks on transmission pressure gradient
could be evaluated. In principle the onset of leak modifies the original transmission pressure
gradient vector, and this modification leads to a resultant vector whose magnitude and direction
is different from the original pressure gradient vector. The change in direction of this resultant
vector, due to leak, has been defined as enclosed angle vector relaxation and was proven to be
invaluable for the quantification of leak rates. This approach, especially the use of EAVR, has
Page 225
225
not been documented and used for leak detection and leak rate quantification before now. One
of the spin offs from this research is a promising lead to further research area for the estimation
of the relationship between the flow constants (K) and leak rates causing the modification of
the pipeline flow constant. The second similarity between this research and conclusions from
Rojas & Verde (2020) is that you need two different processes for the evaluation of leak point
and the leak rate estimation. Most researchers used additional instrumentation to evaluate the
leak rate, but this research has actually used the same pressure gradient method to calculate the
pressure gradient relaxation angle for the determination of leak rate at any identified leak point
in any pipeline.
This smart process for pipeline integrity monitoring is unique and capable of predicting leak
and quantifying leak rate under suitable conditions as documented below.
11.3 Conditions for the application of proposed new smart process
The following two conditions are necessary and sufficient for the deployment of the proposed
new process for pipeline integrity monitoring:
1. That the fluid is single phase, incompressible and irrotational.
2. There are sufficient pressure measurement points at regular intervals along the pipeline
length.
The conditions for the particular solution to the Navier stokes equation used in this research,
as discussed in Pressure gradient relationship to volume flow rate, are incompressible and
irrotational fluids and these are generally the conditions under which the application of the
recommended new post-leak data diagnostic smart process will be valid. The validation of
these conditions has been proven by experiments but could also be demonstrated using equation
8.1 or explained using the graphic vector manipulation as documented in section on Pressure
Page 226
226
gradient vector analysis. It should be noted that the fluid pumping operation involve energy
transfer from pump energy to kinetic energy of the evacuated fluid and the objective of the
crude evacuation is near perfect transfer of all the pump energy for fluid transportation without
packing or compression. This therefore means that some energy would be lost if the fluid
transported is compressible, hence this recommended approach should not be applicable in gas
transportation. Special attention should also be made while applying the EAVR process during
the transportation of two-phase fluids, especially at saturated conditions. An example of an
equilibrium two phase fluid would be a saturated crude oil where the crude already has the
maximum gas in solution at the prevailing condition. A saturated reservoir is one which
operates at pressure greater than the bubble-point pressure of the crude oil. This therefore
means than care should be taken in the application of this recommended approach in fluid
transportation within the well as each molecule of crude that moves from the liquid to the
gaseous phase is a source of packing error in the EAVR application of the recommended new
process for leak and inflow detection and quantification. Every attempt should also be made to
ensure that evacuated fluid is irrotational to ensure validity of the propounded EAVR process.
This is achieved as part of the crude evacuation pipeline design as the discharge pressure is
preset above atmospheric such that the pipeline is completely filled and pressured before the
first discharge is received at the terminal.
Another potential limitation to the application of this proposed new process for pipeline
integrity monitoring would be the available number of pressure monitoring points as they are
critical for accurate prediction of leak point and rate. With this process dependency, it would
be advisable to always use any repair opportunity on any pipeline during operational
maintenance to install new pressure monitoring points on existing lines. The monitoring of a
100km trunkline, for example, through pressure measurements at three manifold points is
suboptimal. This recommended new way of working could also be used to revise pipeline
Page 227
227
installation standards, especially in Nigeria or similar jurisdictions where vandals would
attempt to hot tap and steal crude or any fluid being transported through pipelines. Such
improvements in standards would include recommendation for pressure monitoring point
installation at suitably agreed regular intervals during any new pipeline installation and the
implementation of pipeline IoT architecture as highlighted in Pipeline digital information data
acquisition system.
11.4 New process for pipeline integrity monitoring
A key word in process engineering is the organization of particular steps, or procedures, for
the achievement of a given objective. Using our common example of electromagnetism, we
could demonstrate that having a conductor coil, an iron core and an electric source does not
produce an electromagnet until the iron core is enclosed by the coil which is energized with
some current. So, the new process for pipeline integrity monitoring involves some new way of
executing some existing activities while incorporating the newly proven concept of EAVR for
leak rate estimation.
A new two staged process for leak monitoring during crude evacuation process has been
conceptualized through a hypothesis, tested using pipeline transmission pressure data, and
verified using the EAVR to prove that the pipeline pressure gradient vector changes according
to leak rate. The testing and demonstration process involve a philosophical vector manipulation
of how the pre-leak vector gradient will change to a new vector once there is a leak. The
direction of this new vector is different form the direction of the pre-leak vector and this gives
rise to the enclosed angle vector relaxation. This research process, as documented in Research
method which gave rise to a research hypothesis states that: If we have a way of continuously
measuring the steady state conditions at regular intervals ( say 5km or 10km) of a given pipeline
Page 228
228
during operation, then we could through deviations trending from the steady state operation
determine the point of leak or crude oil theft and quantify leak rate or theft, has been verified.
The search for this new concept was driven by literature review which suggested the use of
some smart operation ideas in the new process design. As documented in the section Smart
fields operations synopsis the basis for smart fields operations and digital twin is simulation
and there are several levels of smartness or smart operations capability. The first step in this
new process uses a graphical gradient line intersection method for multiple leak identification,
while pressure gradient relaxation angle is applied at the identified leak points to determine the
precise leak rate at each identified leak point. The concept of pipeline system descriptive model
was created to represent the performance of a pipeline without leak as well as for the prediction
of how such pipeline would behave at different leak rates. The results from this approach were
outstanding for multiple leak investigation. This approach is very precise on leak location
prediction and leak rate estimation at the respective leak positions. Some of the value adds for
this new process includes simplicity, ease of operations, retrofit ability to existing pipeline, and
basic knowledge skill requirement for operational staff.
The new process is based purely on pressure measurements and some knowledge of basic
pipeline design data like lengths and diameters. The pipeline basic design data are always
readily available as part of operational emergency response preparedness data requirement.
Pressure monitoring is part of normal operations during crude evacuation process so this
proposed new process would not demand changes to operational requirements nor some form
of skills reassessment for operators prior to deployment. The number of measurement points at
any given pipeline would however need to be increased if the desired level of accuracy
achievable by this process would be realized in the given pipeline. Most operations already use
some form of SCADA systems that allows the transmission of pressure reading directly through
global IT system to the point of need. This is necessary as simultaneous reading of all installed
Page 229
229
pressure monitors are necessary for this new process, and indeed for all processes that are
capable of multiple leak detection. There is no need for expertise training on simulation, nor
differential equation evaluation expertise capability for the application of this new process. An
apparent difficult problem of hydraulic simulation has been studied and reduced to a simple
solution requiring the measurement of pressures and some basic pipeline configuration
background knowledge. What is required for the application of this new process is ability to
update a workbook, manually or automatically, with readings of the installed pressure gauges,
the plotting of such data (manually or automatically) to determine the points of leak. And
thereafter using the leak points to determine, manually or automatically, leak rate at each leak
point. This new process met the desired Research objectives and the documented criteria in the
concept selection report.
In summary, a SMART PROCESS FOR PIPELINE INTEGRITY MONITORING involving:
data acquisition; data baselining; leak point determination and leak rate determination has been
developed and proven as capable of detecting multiple leaks (and inflows) and quantification
of the respective leak (and inflow) rates at the identified leak points.
Data acquisition strategy
This enabling step involves background check on the pipeline being investigated for ability to
acquire the required pressure data from available pressure monitoring points and validation of
the adequacy of the number of pressure monitoring points for planned use of proposed new
process for leak detection. It should be noted that results from the new process are precise so
long as the identified leak is in between two monitoring points. The available number of
pressure monitoring points therefore determine the accuracy of multiple leak detection points
as discussed in Conditions for the application of proposed new smart process page 225. As part
Page 230
230
of new process implementation, this recommended new way of working could therefore be
used to revise pipeline installation standards, especially in Nigeria such that the applicable
construction standards could be updated to recommend pressure monitoring point installation
at suitably agreed regular intervals during any new pipeline installation. It is also hoped that as
part of the future way of working, new pipelines would be equipped with real time data
acquisition infrastructure.
Data baselining
This involves pressure gradient estimation without leak and the determination of the pipeline
leak characteristics and documentation of the pipelines system descriptive model (SDM). This
SDM could be considered and evaluated as part of the commissioning data during any new
pipeline installation or during any repair opportunity for existing pipeline. The SDM process
testing involves the documentation of pipeline pressure response without a leak and some
response under simulated leak situation. The pressure gradient estimation without leak should
be evaluated at rates around the designed operating rate for the given pipeline being
investigated. A good knowledge of the pressure gradient for any two volumes around the
normal pipeline operating volume would be advisable as the relationship between pressure
gradient and flow rate has been proven to be a straight line. This means that any SDM created
for a given pipeline could be used to cover all operating domains through interpolation or
extrapolation to any unexplored volume. This SDM is the required nomogram to estimate the
leak rate (or inflow) at any section of the pipeline during any operational leak.
Leak point(s) determination
This involves plotting of pressure readings for the determination of leak points. For pipelines
with installed SCADA systems, an algorithm could be created for sampling and filtering of the
Page 231
231
pressure data stream at regular intervals and use same to plot the pressure trend, track deviation
from straightness and use that to show points of leak. Where such SCADA systems do not exist
then some manual intervention would be used to plot and determine points of leaks.
Leak rate determination
This involves the use of the evaluated points of leak to estimate the leak rate at each identified
leak section using the pipeline leak characteristic curve or the SDM already computed as part
of the pipeline commissioning data as described in Data baselining. The pipeline leak SDM is
a plot of leak rate versus pipeline anticipated enclosed angle vector relaxation (EAVR) due to
leak. The respective pressure gradients during leak monitoring would be used to estimate their
corresponding EAVR which will then be used on the SDM to evaluate the respective leak rates
at identified leak points.
11.5 New process novelty
Discovery, which is the process of being discovered must be distinguished from invention
which is the act of inventing a product or a process. So, in effect we discover something that
exists without general latent knowledge, but we invent a product or a process that is new and
sometimes novel. The documentation of Hydrogen as part of naturally occurring elements in
the periodic table is a discovery, but the use of the same Hydrogen under certain condition to
create a hydrogen bomb is a product invention. This implies that knowledge from discoveries
can be used for inventions as shown in the above example of Hydrogen as one of the naturally
occurring elements in the periodic table and the use of such hydrogen in the invention of a
hydrogen (or thermonuclear) bomb. Also, electricity is an invention which is a product of the
discovery of static electric charges. Electromagnetism has been used severally in this thesis as
Page 232
232
a process invention example. Surgical operating procedures is also another example of process
invention which is continuously being updated with new data in medical sciences to
continuously improve on Medicare.
The EAVR delivered as part of this research is a process invention: It is novel, a product of this
dissertation and not conceptually documented in any literature.
The details of this new smart process for pipeline integrity monitoring knowledge contribution
based on this dissertation are:
1. The thought of using vectors to analyze pressure gradient changes during fluid
evacuation for leak identification is novel and a process invention.
2. The use of structural analogues to describe fluid evacuation and hence help in the post-
leak data pressure gradient vector analysis during fluid evacuation process is also a
novel discovery.
3. The combination of 1 and 2 above gave rise to the EAVR concept for leak rate (or
inflow) estimation in any pipeline fluid evacuation system is the main product of this
research and is germanely a novel invention.
The EAVR concept, which is one of the main contributions of this research is a new knowledge
addition to physis and fluid mechanics. The EAVR is also a discovery, just the same way as
Sir Isaac Newton discovered the gravitational force which has always been with man.
In conclusion therefore, the EAVR process which is a new discovery uses the vector analysis
discovery to develop an EAVR process invention.
Page 233
233
11.6 Chapter summary
The main conclusions from this research are:
1. Demonstration of research hypothesis using pipeline pressure transmission data.
2. Demonstration of leak prediction accuracy dependency on the number of pressure
monitoring points.
3. Demonstration of a novel vector analysis approach for monitoring of leaks.
4. Demonstration that the research product, which was developed for leak monitoring
can also be extended for inflow monitoring.
The thesis hypothesis, which propounded that “if we have a way of continuously measuring
the steady state conditions at regular intervals (say 5km or 10km) on a pipeline during
operation, then we could, through deviations trending from the steady state operation,
determine the point of leak or crude oil theft and quantify leak rate or theft,” was supported
and indeed leak rates can be detected and quantified through pressure measurements only. The
confirmatory use of this process yielded exceptional average prediction accuracy of 93.44% as
can be calculated from table 15.
Table 15. Predictions from proposed new smart process for pipeline integrity monitoring.
Case Description Number of
predictions
Average
prediction
accuracy
1 PIPESIM multi-leak simulation 8 89.97%
2 Well inflow and choke performance prediction 1 96.29%
3 Reservoir pressure effect on well production 4 99.68%
Page 234
234
The use of the recommended new process builds on pressure gradient calculations hence it was
also concluded that the accuracy of this new process for pipeline integrity monitoring would
largely depend on the available number of pressure monitoring points. With this process
dependency, it was therefore recommended that one way of retrofitting this new process on
existing pipelines would be to always use any repair opportunity on any pipeline during
operational maintenance to install new pressure monitoring points.
Another conclusion from this research was the successful outcome of using vectors to analyze
pressure gradient changes (caused by leak or crude theft) during fluid evacuation for leak
identification. This approach is novel and a process invention and yielded good results that led
to the achievement of the research objective of leak and crude oil theft detection during pipeline
crude evacuation using the post-leak data diagnostic smart operations process.
A combination of this novel pressure gradient vector analysis and another, out of the box
thought, on using structural analogues to describe fluid evacuation helped in the post-leak data
diagnostic smart process for pipeline integrity monitoring. The pressure gradient vector
analysis during fluid evacuation process and the construction of the enclosed angle vector
relaxation for the delivery of a new smart process for pipeline integrity monitoring has been
demonstrated and recommended. This recommended smart process for pipeline integrity
monitoring is based on PGR for leak point determination and EAVR for leak rate estimation.
Although some researchers have recommended the use of pressure gradient monitoring for leak
point determination, the approach presented here that led to the same conclusion is different.
The concept of enclosed angle vector relaxation method for leak rate estimation which is
recommended in this research is new and has not been published in any leak prediction
literature. Some of the advantages of this new process is simplicity, retrofit ability and no
demand for skills reassessment for operators as it fits into normal operations. This finding
Page 235
235
would be particularly useful to pipeline operators in Nigeria or similar jurisdictions where
vandals would attempt to hot tap and steal crude or any fluid being transported through
pipelines. The EAVR concept, which is one of the main contributions of this research is a new
knowledge addition to physis and fluid mechanics.
In the graphical proof of concept documented at Pressure gradient vector analysis it was felt
that this EAVR can also be used to estimate fluid inflow in addition to leaks. This is because
the difference between inflow and leak is that one is opposite of the other in sign convention
within the domain space being studied. This corollary was tested through two case studies in
subsurface engineering. The results of the two tests, as shown in table 15 (case 2 & 3) can be
compounded to yield an average of 99% prediction accuracy.
In conclusion therefore, the EAVR process which is a new discovery in science (physics and
fluid mechanics) uses the vector analysis discovery to develop an EAVR process invention.
11.7 Further research
This new process for pipeline Integrity monitoring could be implemented manually, semi
automatically, or completely automatic, based on artificial intelligent workflow depending on
the available IoT infrastructure. A computer program for the development of this concept could
be subject for further research. Also, further advancement of the recommended new process
using machine learning operations could also be another enhancement area for further research.
Another possible spin off from this research would be a further research on the relationship
between the flow parameters of a leaking pipeline system. It is believed that the same PGR
method could be used to constrain the Navier Stokes solution for the determination of the
respective sectional pressure gradient after a leak and the corresponding remaining fluid
Page 236
236
quantity after the leak. This relationship was tested as part of PGR method for leak rate
evaluation in multi leak situation but the error in the leak rate estimation beyond the second
leak was unacceptable, based on computing assumptions as documented in Leak rate
determination in multi-leak situation using PGR .
A third potential further research area would be the design of methods for data generation and
modeling of Hidden Layers, page 124, for the creation of an SDM for use of pre-leak data
prognostic artificial neural network methodology for trunkline leak detection.
Page 237
237
11.8 APPENDIX I. Particular solution to Navier Stokes equation (Ugaz, 2020)
Re. Figure 45.
Since the flow is in the z direction 𝑢𝑟 = 𝑢𝜃 = 0
Therefore, all the r and 𝜃 𝑑𝑒𝑟𝑖𝑣𝑎𝑡𝑖𝑣𝑒𝑠 𝑜𝑓 𝑡ℎ𝑒 Navier Stokes equation are therefore zeros.
The LHS of the Z component is also zero because of steady state assumption so the z
component of the Navier Stokes equation yields
0 = −𝜕𝑃
𝜕𝑧+ 𝜇 [
1
𝑟
𝜕
𝜕𝑟(𝑟
𝜕𝑢𝑧
𝜕𝑟)]
𝜕𝑃
𝜕𝑧=
𝜇
𝑟
𝜕
𝜕𝑟(𝑟
𝜕𝑢𝑧
𝜕𝑟)
But 𝜕𝑃
𝜕𝑧=-
∆𝑃
𝐿
𝜕𝑃
𝜕𝑧=
𝜇
𝑟
𝜕
𝜕𝑟(𝑟
𝜕𝑢𝑧
𝜕𝑟)
The above is a second order differential equation and with its boundary conditions could be
solved by integration.
−𝑟
𝜇
∆𝑃
𝐿=
𝜕
𝜕𝑟(𝑟
𝜕𝑢𝑧
𝜕𝑟)
∫𝜕
𝜕𝑟(𝑟
𝜕𝑢𝑧
𝜕𝑟) = −∫
𝑟
𝜇
∆𝑃
𝐿
𝑟𝜕𝑢𝑧
𝜕𝑟= −
𝑟2
2𝜇
∆𝑃
𝐿+ 𝐶1
Page 238
238
∫𝜕𝑢𝑧
𝜕𝑟= −∫(
𝑟
2𝜇
∆𝑃
𝐿+
𝐶1
𝑟)
𝑢𝑧 = −𝑟2
4𝜇
∆𝑃
𝐿+ 𝐶1𝑙𝑛(𝑟) + 𝐶2
Applying the boundary condition @ r=a 𝑢𝑧 = 0 and at r=0 𝑢𝑧 𝑖𝑠 𝑎 𝑝𝑜𝑠𝑖𝑡𝑖𝑣𝑒 𝑛𝑢𝑚𝑏𝑒𝑟
Yields
𝐶2 =𝑎2
4𝜇
∆𝑃
𝐿 and 𝐶1 = 0
This implies
𝑢𝑧 = −𝑟2
4𝜇
∆𝑃
𝐿+
𝑎2
4𝜇
∆𝑃
𝐿
𝑢𝑧 =𝑎2
4𝜇
∆𝑃
𝐿(1 −
𝑟2
𝑎2)
Therefore, Volume flow rate
𝑉 = ∫𝑢𝑧 𝑑𝐴
But dA=2πr𝑑r, so
𝑉 = ∫𝑎2
4𝜇
𝑎
0
∆𝑃
𝐿(1 −
𝑟2
𝑎2)2πr𝑑𝑟
=π𝑎2
2𝜇
∆𝑃
𝐿∫
𝑎
0
(𝑟 −𝑟3
𝑎2)𝑑𝑟
=π𝑎2
2𝜇
∆𝑃
𝐿[𝑟2
2−
𝑟4
4𝑎2]
𝑎
Page 239
239
If a=r, then the volume flow through the pipe cross section If a=r, then the volume flow
through the pipe cross section
𝑉 =π𝑎4
8𝜇
∆𝑃
𝐿………………………………………………….8.1
Page 240
240
12 REFERENCES
Abdelghani, M., & Benveniste, A. (2000). Subspace-based fault detection algorithms for
vibration monitoring ଝ. 36, 101–109.
Ahadi, M., & Bakhtiar, M. S. (2010). Leak detection in water-filled plastic pipes through the
application of tuned wavelet transforms to Acoustic Emission signals. Applied
Acoustics, 71(7), 634–639. https://doi.org/10.1016/j.apacoust.2010.02.006
Anifowose, B., Lawler, D. M., van der Horst, D., & Chapman, L. (2012). Attacks on oil
transport pipelines in Nigeria: A quantitative exploration and possible explanation of
observed patterns. Applied Geography, 32(2), 636–651.
https://doi.org/10.1016/j.apgeog.2011.07.012
Ben-Mansour, R., Habib, M. A., Khalifa, A., Youcef-Toumi, K., & Chatzigeorgiou, D.
(2012). Computational fluid dynamic simulation of small leaks in water pipelines for
direct leak pressure transduction. Computers and Fluids.
https://doi.org/10.1016/j.compfluid.2011.12.016
Carlson, L. C., Rogers, T. T., Kamara, T. B., Rybarczyk, M. M., Leow, J. J., Kirsch, T. D., &
Kushner, A. L. (2015). Petroleum pipeline explosions in sub-Saharan Africa: A
comprehensive systematic review of the academic and lay literature. Burns, 41(3), 497–
501. https://doi.org/10.1016/j.burns.2014.08.013
Carneades.org. (2015). #Pragmatism#Truth : Pragmatism (William James and Charles
Sanders Peirce). https://www.youtube.com/watch?v=u0EOF56roHI
Chebiyyam, C. (2010). SPE 127486 Reconciliation — An Inevitable Challenge in Upstream
Oil Industry. January, 20–22.
Colombo, A. F., Lee, P., & Karney, B. W. (2009). A selective literature review of transient-
based leak detection methods. Journal of Hydro-Environment Research, 2(4), 212–227.
https://doi.org/10.1016/j.jher.2009.02.003
Cullick, A. S., & Sukkestad, T. (2010). SPE 126246 Smart Operations With Intelligent Well
Systems. March, 23–25.
da Silva, H. V., Morooka, C. K., Guilherme, I. R., da Fonseca, T. C., & Mendes, J. R. P.
(2005). Leak detection in petroleum pipelines using a fuzzy system. Journal of
Petroleum Science and Engineering. https://doi.org/10.1016/j.petrol.2005.05.004
Davis, P., & Brockhurst, J. (2015). Subsea pipeline infrastructure monitoring : A framework
for technology review and selection. Ocean Engineering, 104, 540–548.
https://doi.org/10.1016/j.oceaneng.2015.04.025
Deraemaeker, A., Reynders, E., Roeck, G. De, & Kullaa, J. (2008). Vibration-based
structural health monitoring using output-only measurements under changing
environment. 22, 34–56. https://doi.org/10.1016/j.ymssp.2007.07.004
Edih, M., Nnanna, E., & Nwankwo, C. (2016). SPE-184328-MS A Systematic Approach to
Intelligent Well Performance Modelling Using IPM Suite.
Edition, F. (2007). Recommended Practice for Occupational Safety for Onshore. March.
El-Moniem Aly, M. A. (2016). EVALUATION AND PROPER SELECTION OF
MULTIPHASE FLOW CORRELATIONS [Cairo University]. https://doi.org/DOI:
10.13140/RG.2.2.10905.24168
Feng, J., & Zhang, H. (2004). Oil pipeline leak detection and location using double sensors
pressure gradient method. Proceedings of the World Congress on Intelligent Control and
Automation (WCICA), 4, 3134–3137. https://doi.org/10.1109/wcica.2004.1343098
Gaus, N. (2019). Siemens. https://www.youtube.com/watch?v=2XAXKNcsb1M
Goel, H. K., Nasr, H., Carvajal, G. A., Johnson, D. W., Cullick, A. S., Moricca, G.,
Velasquez, G., Villamizar, M., & Querales, M. (2013). SPE 163697 A Surveillance "
Smart Flow " for Intelligent Digital Production Operations. 1–10.
Page 241
241
Gong, J., Zecchin, A. C., Simpson, A. R., & Lambert, M. F. (2014). Frequency response
diagram for pipeline leak detection: Comparing the odd and even harmonics. Journal of
Water Resources Planning and Management, 140(1), 65–74.
https://doi.org/10.1061/(ASCE)WR.1943-5452.0000298
Grieves, M. (2015). Florida Institute of Technology. (235) Digital Twin Manufacturing
Excellence Through Virtual Factory Replication - YouTube
Henrie, Morgan; Carpenter, Philip; Nicholas, R. E. (2016). Pipeline Leak Detection
Handbook. Elsevier Science & Technology.
http://ebookcentral.proquest.com/lib/dmu/detail.action?docID=4586470
Horizon, D., & Group, S. (2011). Final Report on the Investigation of the Macondo Well
Blowout Deepwater Horizon Study Group. May 2010.
Ismail Iqbal, M., Isaac, O., Al Rajawy, I., Khuthbuddin, S., & Ameen, A. (2021). Hazard
identification and risk assessment with controls (Hirac) in oil industry – A proposed
approach. In Materials Today: Proceedings. https://doi.org/10.1016/j.matpr.2020.11.800
Jin, H., Zhang, L., Liang, W., & Ding, Q. (2014). Integrated leakage detection and
localization model for gas pipelines based on the acoustic wave method. Journal of Loss
Prevention in the Process Industries, 27(1), 74–88.
https://doi.org/10.1016/j.jlp.2013.11.006
Kam, S. I. (2010). Journal of Petroleum Science and Engineering Mechanistic modeling of
pipeline leak detection at fi xed inlet rate. Journal of Petroleum Science and
Engineering, 70(3–4), 145–156. https://doi.org/10.1016/j.petrol.2009.09.008
Kim, M. S., & Lee, S. K. (2009). Detection of leak acoustic signal in buried gas pipe based
on the time-frequency analysis. Journal of Loss Prevention in the Process Industries,
22(6), 990–994. https://doi.org/10.1016/j.jlp.2008.08.009
Ko, J. M., & Ni, Y. Q. (2005). Technology developments in structural health monitoring of
large-scale bridges. 27, 1715–1725. https://doi.org/10.1016/j.engstruct.2005.02.021
Kopsaftopoulos, F. P., & Fassois, S. D. Ã. (2010). Vibration based health monitoring for a
lightweight truss structure : Experimental assessment of several statistical time series
methods. Mechanical Systems and Signal Processing, 24(7), 1977–1997.
https://doi.org/10.1016/j.ymssp.2010.05.013
Layer, M., Automation, B., Layer, S., Ontology, P., Layer, C., Access, I., Adaptors, S., &
Services, W. (2011). Automating the Oilfield Asset — Artificial-Intelligence-Based
Integrated-Production-Management Architecture Extreme To CT Operations in
Extreme Wellpaths. October, 91–93.
Lee, D., Park, J., Hyun, D., Yook, G., & Yang, H. (2012). Novel mechanisms and simple
locomotion strategies for an in-pipe robot that can inspect various pipe types. MAMT,
56, 52–68. https://doi.org/10.1016/j.mechmachtheory.2012.05.004
Lee, P. J., V??tkovsk??, J. P., Lambert, M. F., Simpson, A. R., & Liggett, J. A. (2005). Leak
location using the pattern of the frequency response diagram in pipelines: A numerical
study. Journal of Sound and Vibration, 284(3–5), 1051–1073.
https://doi.org/10.1016/j.jsv.2004.07.023
Li, H.-N., Li, D.-S., & Song, G.-B. (2004). Recent applications of fiber optic sensors to
health monitoring in civil engineering. Engineering Structures, 26, 1647–1657.
https://doi.org/10.1016/j.engstruct.2004.05.018
Li, S., Cheng, N., Wang, P., Yan, D., Wang, P., Li, Y., Zhao, X., & Wang, P. (2016).
Extraction of single non-dispersive mode in leakage acoustic vibrations for improving
leak detection in gas pipelines. Journal of Loss Prevention in the Process Industries, 41,
77–86. https://doi.org/10.1016/j.jlp.2016.03.016
Li, S., Wen, Y., Li, P., Yang, J., Dong, X., & Mu, Y. (2014). Leak location in gas pipelines
using cross-time-frequency spectrum of leakage-induced acoustic vibrations. Journal of
Page 242
242
Sound and Vibration, 333(17), 3889–3903. https://doi.org/10.1016/j.jsv.2014.04.018
Liu, C., Li, Y., & Xu, M. (2019). An integrated detection and location model for leakages in
liquid pipelines. Journal of Petroleum Science and Engineering, 175(June 2018), 852–
867. https://doi.org/10.1016/j.petrol.2018.12.078
Mabel Pei Chuen, C., Agus Nukman, M., Mandal, D., Ahmad Salim, A. S. H., Sepulveda,
W., Vaca, J. C., & Goh, K. (2017). Application of allocation algorithm for surveillance
and optimization of intelligent wells. Society of Petroleum Engineers - SPE/IATMI Asia
Pacific Oil and Gas Conference and Exhibition 2017, 2017-Janua.
https://doi.org/10.2118/186421-ms
Majumder, M., Gangopadhyay, T. K., Chakraborty, A. K., Dasgupta, K., & Bhattacharya, D.
K. (2008). Sensors and Actuators A : Physical Fibre Bragg gratings in structural health
monitoring — Present status and applications. 147, 150–164.
https://doi.org/10.1016/j.sna.2008.04.008
Martin, M. . (2018). IoT Connected Pipelines: Sensors. VIVIDCOMM.
https://vividcomm.com/2018/11/25/iot-connected-pipelines-sensors/
Montero, J., & Nwankwo, C. (2010). SPE 132860 Simulation Of Dragon Wells In Thin Oil
Rim Reservoirs Using A Segmented Inflow Approach.
Murvay, P. S., & Silea, I. (2012). A survey on gas leak detection and localization techniques.
Journal of Loss Prevention in the Process Industries, 25(6), 966–973.
https://doi.org/10.1016/j.jlp.2012.05.010
Mysorewala, M., Sabih, M., Cheded, L., Nasir, M. T., & Ismail, M. (2015). A Novel Energy-
Aware Approach for Locating Leaks in Water Pipeline Using a Wireless Sensor
Network and Noisy Pressure Sensor Data. International Journal of Distributed Sensor
Networks, 2015. https://doi.org/10.1155/2015/675454
Nee, L. V., Elamvazuthi, I., Ganesan, T., Khan, M. K. A. A., & Parasuraman, S. (2015).
Development of a Laboratory-scale Pipeline Inspection Robot. Procedia Computer
Science, 76, 9–14. https://doi.org/10.1016/j.procs.2015.12.268
Norvig, P. ;, & Thrun, S. (n.d.). Introduction to Artificial Intelligence. Udacity. Retrieved
February 24, 2021, from https://www.udacity.com/wiki/cs271/unit1-notes
Nwankwo, C. C. (Cranfield U. (2013). Smart offshore structure for reliability prediction
process.
Omodanisi, E. O., Eludoyin, A. O., & Salami, A. T. (2014). International Journal of Disaster
Risk Reduction A multi-perspective view of the effects of a pipeline explosion in
Nigeria. International Journal of Disaster Risk Reduction, 7, 68–77.
https://doi.org/10.1016/j.ijdrr.2013.11.002
Omodanisi, E. O., Eludoyin, A. O., Salami, A. T., Rojas, J., Verde, C., Ball, L. J.,
Christensen, B. T., Gao, Y., Liu, Y., Ma, Y., Cheng, X., Yang, J., Anifowose, B.,
Lawler, D. M., van der Horst, D., Chapman, L., Kettinger, W. J., Teng, J. T. C., Guha,
S., … Ghavamian, A. (2009). Application of the differentiation process into the
correlation-based leak detection in urban pipeline networks. Journal of Petroleum
Science and Engineering, 30(1), 145–156. https://doi.org/10.1016/S0920-
4105(01)00098-5
Omole, W., Saputelli, L., Lissanon, J., Nnaji, O., Gonzalez, F., Wachel, G., Boles, K., Leon,
E., Parekh, B., Nguema, N., Corporation, H., Borges, J., & Hadjipieris, P. (2011). SPE
144195 Real-time Production Optimization in the Okume Complex Field , Offshore
Equatorial Guinea.
Ossai, C. I., Boswell, B., & Davies, I. J. (2015). Pipeline failures in corrosive environments -
A conceptual analysis of trends and effects. Engineering Failure Analysis, 53, 36–58.
https://doi.org/10.1016/j.engfailanal.2015.03.004
Ostapkowicz, P. (2016). Leak detection in liquid transmission pipelines using simplified
Page 243
243
pressure analysis techniques employing a minimum of standard and non-standard
measuring devices. Engineering Structures, 113, 194–205.
https://doi.org/10.1016/j.engstruct.2016.01.040
OutRespectiveWritting2019. (2019). Inductive and Deductive Reasoning.
https://medium.com/@honeysuckleseaweed/inductive-and-deductive-reasoning-
913bcf9bb598
Pothapragada, V., Kooheji, H. Al, Petroleum, T., Hajri, S. Al, & Siyabi, I. (2012). SPE
155596 Integrated Production System Modeling of the Bahrain Field. 1–11.
Rojas, J., & Verde, C. (2020). Adaptive estimation of the hydraulic gradient for the location
of multiple leaks in pipelines. Control Engineering Practice, 95(February 2019),
104226. https://doi.org/10.1016/j.conengprac.2019.104226
Russell, O. (2019). Verdantix. https://www.verdantix.com/newsroom/press-
releases/verdantix-says-that-digital-twins-operate-at-five-different-levels-of-
sophistication
Schlumberger. (2011). Severneftegazprom Reduces Operating Expenses by Using PIPESIM
Software Gas production network model used to identify hydrate-forming wells. 10-IS-
0701.
Schlumberger. (2013a). CASE STUDY AMAPETCO Optimizes Subsea Flow Assurance with
PIPESIM Modeling Multiphase flow simulations drive new network design and
increased. 13-IS-0466.
Schlumberger. (2013b). Staatsolie Optimizes Pipeline Network Management with PIPESIM
Software Accurate simulations drive better decisions and improve efficiency. 12-IS-
0625.
Schlumberger, S. C. (2020). CASE STUDY PIPESIM Simulator Increases Incremental Gas
Production in Mature Fields by 10 %, Ukraine UkrGasVydobuvannya replaces manual
workflows with a multiphase flow simulator to efficiently identify wells with liquid
loading issues and improve flow ass. 18-IS-4573.
Shabarchin, O., & Tesfamariam, S. (2016). Internal corrosion hazard assessment of oil & gas
pipelines using Bayesian belief network model. Journal of Loss Prevention in the
Process Industries, 40, 479–495. https://doi.org/10.1016/j.jlp.2016.02.001
Shammari, A. (2019). PIPESIM network optimizer.
https://www.software.slb.com/products/pipesim
Tanimola, F., & Hill, D. (2009). Journal of Natural Gas Science and Engineering Distributed
fibre optic sensors for pipeline protection. Journal of Natural Gas Science and
Engineering, 1(4–5), 134–143. https://doi.org/10.1016/j.jngse.2009.08.002
The Guardian. (2005). Curse of the Black Gold: 50 Years of Oil in the Niger Delta.
The Guardian. (2013). £1bn a month: the spiralling cost of oil theft in Nigeria.
Valdez Banda, O. A., Kannos, S., Goerlandt, F., van Gelder, P. H. A. J. M., Bergström, M., &
Kujala, P. (2019). A systemic hazard analysis and management process for the concept
design phase of an autonomous vessel. In Reliability Engineering and System Safety
(Vol. 191). https://doi.org/10.1016/j.ress.2019.106584
Verde, $ C. (2005). Accommodation of multi-leak location in a pipeline. Control Engineering
Practice, 13, 1071–1078. https://doi.org/10.1016/j.conengprac.2004.09.010
Waterloo, U. of. (2017). Mechanical and Mechatronics engineering.
Yan, S. Z., & Chyan, L. S. (2010). Performance enhancement of BOTDR fiber optic sensor
for oil and gas pipeline monitoring. Optical Fiber Technology, 16(2), 100–109.
https://doi.org/10.1016/j.yofte.2010.01.001
Yang, J., Ã, Y. W., & Li, P. (2008). ARTICLE IN PRESS Leak location using blind system
identification in water distribution pipelines. 310, 134–148.
https://doi.org/10.1016/j.jsv.2007.07.067
Page 244
244
Zhang, L. bin, Qin, X. Y., Wang, Z. hui, & Liang, W. (2009). Designing a reliable leak
detection system for West Products Pipeline. Journal of Loss Prevention in the Process
Industries. https://doi.org/10.1016/j.jlp.2008.09.012