Page 1
ORIGINAL ARTICLE
A novel approach for efficient extrication of overlappingchromosomes in automated karyotyping
Mousami V. Munot • Jayanta Mukherjee •
Madhuri Joshi
Received: 30 January 2013 / Accepted: 26 July 2013 / Published online: 20 August 2013
� International Federation for Medical and Biological Engineering 2013
Abstract Since the introduction of the automated karyo-
typing systems, segmentation and classification of touching
and overlapping chromosomes in the metaphase images are
major challenges. The earlier reported techniques for dis-
entangling the chromosome overlaps have limited success
and use only color information in case of multispectral
imaging. Most of them are restricted to separation of single
overlap of two chromosomes. This paper introduces a novel
algorithm to extricate overlapping chromosomes in a
metaphase image. The proposed technique uses Delaunay
triangulation to automatically identify the number of
overlaps in a cluster followed by the detection of the
appropriate cut-points. The banding information on the
overlapped region further resolves the set of overlapping
chromosomes with the identified cut-points. The proposed
algorithm has been tested with four data sets of 60 over-
lapping cases, obtained from publically available databases
and private genetic labs. The experimental results provide
an overall accuracy of 75–100 % for resolving the cluster of
1–6 overlaps.
Keywords Karyotyping � Metaphase �Chromosome
1 Introduction
The importance of detecting chromosome abnormalities in
human genetic disease is widely recognized. It makes the
chromosome analysis a specialized discipline with wide-
spread applications both in research and clinical practice. A
normal human cell has 22 pairs of chromosomes, auto-
somes of classes 1–22, and 2 sex chromosomes, in the form
of XX or XY [3]. In the four stages of the cell cycle
(prophase, metaphase, anaphase, and telophase), only in
late prophase or metaphase, the chromosomal structures are
visible under a light microscope after Giemsa staining [6].
One of the objectives of the chromosome analysis is the
creation of karyotype, which is a layout of chromosome
images organized by decreasing size in pairs. Figure 1
shows a sample of the metaphase image and its ordered
karyotype from a publically available database [21, 22].
The manual process of karyotype, performed by the cyto-
geneticist in the genetic labs, involves the cutting of
chromosome image from a photograph of a cell, taken from
a microscope. The chromosomes are arranged into their
appropriate places on the layout according to their visual
classification by the cytogeneticist. The overall process is
highly tedious and time-consuming [15].
Automated Karyotyping Systems (AKS) allow countless
clinical advantages such as interactive and graphical envi-
ronment, faster examination of the samples, allowing quality
printing, being self-explanatory, better interpretation of the
image, and archival of data for future analysis [19]. For past
three decades, substantial research has been carried out to
develop the AKS. However building a completely
M. V. Munot (&)
Department of Electronics and Telecommunication, Pune
Institute of Computer Technology, Pune 411043, India
e-mail: [email protected]
J. Mukherjee
Department of Computer Science and Engineering, Indian
Institute of Technology, Kharagpur 721302, India
e-mail: [email protected]
M. Joshi
Department of Electronics and Telecommunication,
College of Engineering, Pune 411005, India
e-mail: [email protected]
123
Med Biol Eng Comput (2013) 51:1325–1338
DOI 10.1007/s11517-013-1105-y
Page 2
automated system with no human interference is still a
challenging problem. One of the major hindrances in auto-
mation is the difficulty in segmentation and classification of
the clusters of touching and overlapping chromosomes [10].
Chromosomes are nonrigid in nature, and their shape vari-
ability is a natural phenomenon. They can take any form by
bending in different directions and angles, and thus forming
numerous touching and overlapping clusters in a metaphase
cell. The separation and classification of such clusters
require human interference and expert knowledge of the
cytogeneticist.
The segmentation step in the AKS fails to identify each
chromosome as a single object and instead presents a
number of clusters, thus requiring special efforts to separate
touching and overlapping chromosomes [1]. Automatic
separation of overlapping and touching chromosome is
important for analysis of metaphase images [6]. Agam and
Dinstein [1] and Lerner et al. [16] have used shape and
banding evidence for resolving clusters, but both are
restricted to ‘‘touching or slightly overlapping’’ configura-
tions. Popescu et al. [23] proposed a method of analyzing
the boundary and axis. Charters and Grahman [4] demon-
strated combined use of trainable shape models and clas-
sification evidence on synthesized overlaps of X- and
T-shape. Shunren et al. [25] proposed two intelligent
chromosome incision algorithms based on the counter
characteristics and the Fourier transform for resolving
overlaps, whereas Grisan et al. [8] used a space variant
threshold scheme to address the problem. However, in the
latter scheme, the chromosomes involved in the overlap
must bisect each other. Jahani et al. [10] presented an
approach based on morphological operators for identifica-
tion of any cluster of the overlapping and touching chro-
mosomes. It fails when two chromosomes touch end to end.
A computational geometry-based approach, proposed by
Srisang et al. [26], has limited success due to the inability of
the algorithm to find the center of overlapping areas.
In mid 1990s, multicolor fluorescence in situ hybrid-
ization (MFISH), a multispectral combinatorial labeling
technique, was developed. It is used to stain each chro-
mosome and is proved to be extremely useful in cytoge-
netics. Karvelis et al. [12], Choi et al. [5], and
Schwartzkopf et al. [24] have used maximum likelihood-
based methods. Though MFISH technology is a boon for
the AKS, it has inherent limitations as reported by Lee
et al. [14], producing erroneous interpretations. The huge
cost involved in the hybridization process restricts its
routine usage in genetics laboratories. A wide variety of
MFISH databases is therefore not publically available for
analysis and experimentation. Moreover, processing five
images corresponding to each dye increase the computa-
tional complexity by five times as compared to gray-scale
imaging.
There exist a few studies [16, 23] which are limited to
testing on clusters of two overlapping chromosomes,
whereas clusters of multiple overlapping chromosomes are
more frequent in metaphase images. Though the same
evidences could possibly be used for larger clusters, the
complexity, the number of trainable shape models, the
training process, the hypothesis of combining shape and
banding evidences, analysis and the optimization strategies
increase drastically and are not yet fully explored. Thus,
resolving the touches and overlaps in a metaphase image is
still an open issue and a major hindrance to the develop-
ment of the AKS.
This paper proposes a novel approach to automatically
extricate the overlapping chromosomes in a cluster of
single and multiple overlaps from gray-scale images. Fig-
ure 2 presents the overview of the proposed approach.
Figure 2a shows an overlapping chromosome cluster. A
desired cut-point is the one which lies on the boundary of
the chromosome cluster and connects the overlapped
region with the non-overlapping segments of the chromo-
somes. Every overlap in a cluster has four cut-points as
Fig. 1 a A metaphase cell spread, b a karyotype of the metaphase cell chromosome
1326 Med Biol Eng Comput (2013) 51:1325–1338
123
Page 3
highlighted with dark circles in Fig. 2b. The lines per-
pendicular to the medial axis of the chromosome as seen in
Fig. 2c depicts the presence of the bands (intensity varia-
tions) along the chromosomes. The overlapped region
formed by joining the identified cut-points is adhered to the
respective non-overlapping segments of the chromosomes
using the banding information on the overlapped region.
The overlapping chromosomes are thus disconnected at the
cut-points lying on the boundary of the cluster to accom-
plish its extrication. Figure 2d details the block diagram of
the proposed approach.
The proposed algorithm applies heuristics to extricate
the overlapping chromosomes and is envisioned in two
parts as follows:
• Identification of the number of overlaps and detection of
the cut-points on the overlapped region: The number of
overlaps and the respective cut-points are detected by
computing Delaunay Triangulation (DT) and restricting
it to the boundary pixels using Constrained Delaunay
Triangulation (CDT) [2]. The computation leads to the
formation of triangles on the cluster. The vertices of the
triangles, with relatively larger areas, facilitate the
identification of the cut-points.
• Separation of the overlapping chromosomes: The
chromosome segments and the overlapped region are
disentangled using the detected cut-points. Respective
segments of chromosomes are adhered using the
banding information.
Most of the earlier reported algorithms are limited to the
separation of single overlaps. The issue of resolving mul-
tiple overlaps has comparatively received less attention.
The proposed algorithm is able to efficiently disentangle
the clusters with single and multiple overlaps and thus
overcomes the limitations of earlier methods.
2 Methods
The focus of this study is to propose a reliable method for
the automated separation of the chromosomes in a cluster.
It is assumed that the segmentation of the cluster was
already carried out, e.g., by the algorithm reported in [17].
The various steps in the proposed algorithm include
detection of pixels on the boundary of the cluster, finding
the exact cut-points using DT, and utilizing them along
with the banding information to separate the overlapping
Fig. 2 a A cluster of two
overlapping chromosomes
indicating the overlapped region
and the non-overlapping
segments of the chromosomes,
b the desired cut-points
connecting the overlapped
region of the cluster with the
non-overlapping segments, c the
overlapped region recovered by
joining the identified cut-points
using the banding information
in that region, and d block
diagram of the proposed
algorithm
Med Biol Eng Comput (2013) 51:1325–1338 1327
123
Page 4
chromosomes. DT is used to automatically detect the cut-
points on the boundary of the cluster.
DT for a set of points P in a plane is a triangulation
DT(P) such that no point in P is inside the circumcircle of
any triangle in DT(P) [2, 20]. The DT is not unique, but all
solutions satisfy the Delaunay property. DT always results
in a plane graph. No two edges in the embedding cross each
other [2]. Moreover, the triangulation always connects
points to their nearest neighbor [20, 27]. DT is computed on
the boundary pixels making them the vertices of the trian-
gles, which are formed along the entire region of the cluster.
It is observed that the edges of a few triangles cut across the
boundary of the cluster, which is undesirable. The aim of
the proposed approach is to detect the cut-points, which are
present on the boundary of the overlapped region. It is thus
necessary to restrict the triangulation within the boundary of
the cluster. This is achieved using CDT by the removal of
vertex connections that are not fully enclosed within the
prefecture of the chromosome cluster. The resulting DT is
constrained by the boundary and enables to form triangu-
lations within the non-convex polygon in this case is the
chromosome cluster. Figure 3a shows the formation of the
DT for one of the test samples in the database. The DT is
further constrained within the boundary of the cluster using
CDT. The triangles formed outside the boundary of the
cluster are eliminated as depicted in Fig. 3b. Figure 3b also
demonstrates the possibility of formation of a cavity or a
hole in the clusters owing to the non-rigid nature of the
chromosomes. A few samples from the database are
depicted in Fig. 3c. The results of computation of CDT on
some clusters in the data set generated for the experimen-
tation of the proposed work are demonstrated in Fig. 3d.
The traingles formed on the overlapped region and the cut-
points [Please refer Fig. 3(e)] are highlighted in red color.
The proposed heuristic approach is based on the obser-
vations made on the overlapping region of the cluster after
the computation of the DT. These observations are made
by studying the database prepared for this experimentation
and are expected to be applicable mostly for other images
too. The observations are as follows:
• The DT of the pixels on the boundary of the cluster
generates two triangles on every overlapped region.
• The areas of the two triangles, formed on the
overlapped region, with cut-points as the vertices are
relatively larger than the areas of other triangles formed
by non-cut-points.
• The two triangles formed on an overlapped region
either have a common edge or they are located very
close to each other.
• The vertices of the two triangles formed on the
overlapped region are the required cut-points for the
separation of chromosome cluster.
The properties of the DT justify these observations. The
cut-points are actually the non-collinear boundary points
on the overlapped region. They therefore become the ver-
tices of the triangles formed at the overlap. The cut-points
are also the nearest boundary pixels on the overlapped
region. As the DT always connects a point with its nearest
neighbor, the triangles formed by the cut-points do not
enclose any other boundary pixel. Moreover, since the
overlapped region of the cluster is the one with relatively
large area than other regions on the chromosome segments,
the triangles formed on this area have more area than other
triangles. The triangles at overlapped regions shown in
Fig. 3d conform and validate the observations stated
above. In this figure, they are highlighted in red color. The
proposed algorithm aims to detect these triangles of rela-
tively larger area and finds their vertices to automatically
locate the cut-points (refer to Fig. 3e). The identified cut-
points further aid the separation of the chromosomes in the
cluster.
2.1 Identification of the number of overlaps
and detection of the cut-points on the overlapped
region
A cluster of chromosomes may have multiple overlaps. To
locate the appropriate cut-points on every overlapped
region, it is essential to initially identify the total number of
overlaps in the cluster. The first part of the algorithm
computes the number of the overlaps in the cluster and
further detects the exact cut-points on the overlapped
region. It involves pre-processing of the image, detection
of pixels on the boundary of the cluster, generation of the
CDT, and then detecting the cut-points. Pre-processing
involves conversion of image from RGB to gray level (L)
using standard luminosity method. The weighted sum of R,
G, and B components is computed using the following
equation [9]:
L ¼ 0:2989Rþ 0:5870Gþ 0:1140B: ð1Þ
The threshold value was computed using standard Otsu’s
algorithm [18]. The boundary of the segmented cluster is
identified and followed by smoothing operation in order to
reduce the sensitivity of the local variation occurring in the
boundary of the cluster. Smoothing is implemented using a
standard Moore–Neighbor tracing algorithm modified by
Jacob’s criteria [7].
2.1.1 Identification of number of overlaps
The DT of the pixels on the boundary is generated using
the randomized incremental approach [2]. The constraints
under which the DT has to be formed must be defined for
the generation of CDT. The defined constraints depend on
1328 Med Biol Eng Comput (2013) 51:1325–1338
123
Page 5
the nature of the overlap. A cluster is comprised of chro-
mosomes, overlapping in various unpredictable styles,
sometimes leading to the formation of a cavity as shown in
Fig. 3b. In case of defining constraints for such clusters,
both outer and inner profiles of the cluster are computed.
Outer profile contains the pixel coordinates on the
Fig. 3 a DT of the pixels on the
boundary of the overlapping
chromosome cluster,
b corresponding CDT of the
cluster indicating the formation
of a cavity, c various samples
from the database,
d computation of CDT on the
various samples, and e the
identified cut-points on the
overlapped region using the
proposed algorithm. The
triangles formed on the
overlapped region and the cut-
points are highlighted in red
color
Med Biol Eng Comput (2013) 51:1325–1338 1329
123
Page 6
boundary of the overlapped chromosomes, and inner pro-
file contains the pixel coordinates on the boundary of the
cavity. The constraints for the computation of the CDT are
defined using the outer and inner profile, whereas only the
outer profile information suffices to define the constraints
in the rest of the clusters, where a cavity is not formed.
Let B be the set of pixels on the boundary of the cluster.
B ¼ b1; b2; b3. . .bxf g
Every cut-point belongs to this set. Let P be the set of
possible cut-points.
P ¼ p1; p2; p3. . .py
� �P � B
The computation of the CDT on B leads to the formation of
triangles restricted to the boundary of the cluster. Let T be
the set of triangles generated after the computation of the
CDT, where all the vertices of any triangle in T are the
elements of B.
T ¼ t1; t2; t3. . .tzf g
Let A(ti) represent the area of the corresponding triangle tiin T, where i = 1, 2, 3…z. The pairs of the triangles in
close proximity and with relatively larger areas are possible
candidates, which lie on the overlapped region of the
cluster. Thus, to compute the exact number of overlaps in a
cluster, it is initially essential to identify the potential tri-
angles in T which have the corresponding area above a
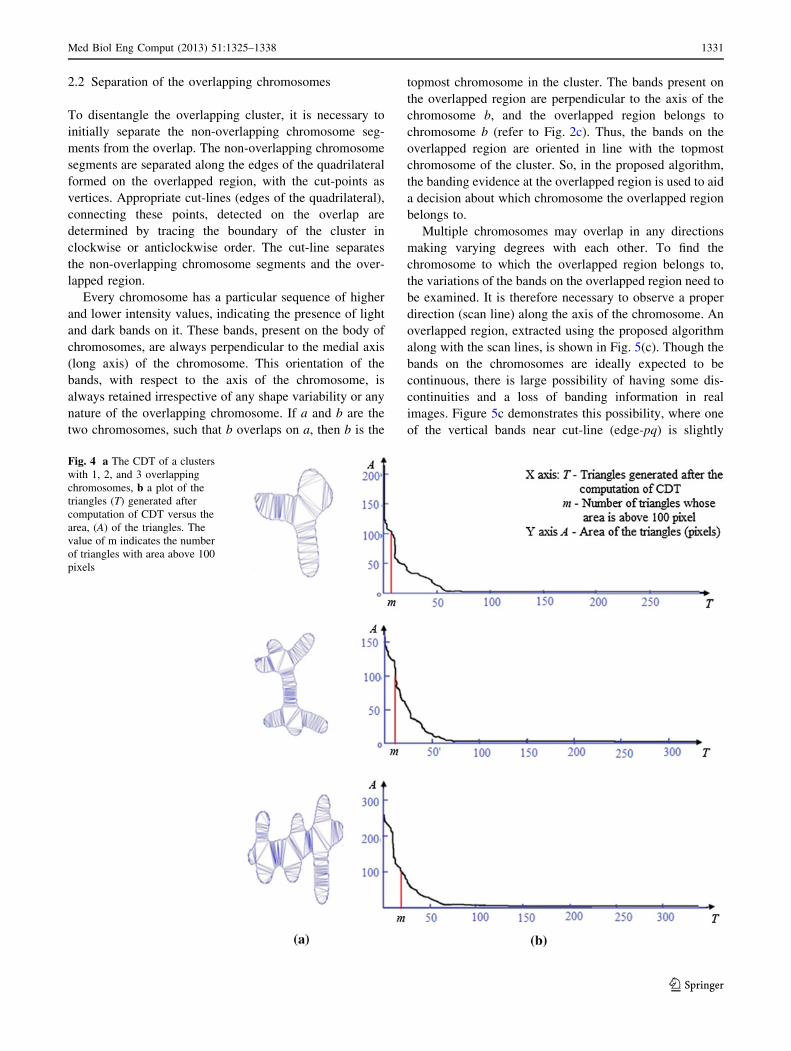
certain threshold value. Figure 4a shows the CDT com-
puted on clusters of overlapping chromosomes with 1, 2,
and 3 overlaps. The plot of the triangles versus their
respective areas is shown in Fig. 4b, where the triangles are
arranged in descending order of their areas. Irrespective of
the number of the overlaps a cluster has, a threshold value
of 100 pixels is empirically computed to extract Ts, a set of
m triangles with areas containing more than 100 pixels.
The number of triangles to be extracted is directly pro-
portional to the number of overlaps a cluster has.
As expected, Fig. 4b illustrates the increase in the value
of m as the number of overlaps in the cluster increases from
1 to 3 (m signifies the number of triangles whose area is
above 100). These triangles in Ts have a greater likelihood
of lying on the overlapped region of the cluster.
Ts ¼ t1; t2. . .tmf g Ts � T and m\z
A tið Þ[ 100 and i ¼ 1; 2. . .m
Every overlap has a pair of triangles from Ts lying on it.
These triangles are either very closely placed or share a
common edge. Thus, to identify the number of overlaps, it
is necessary to pair the closely located triangles in Ts. Let
di,j represents the Euclidean distance between the centroid
ci and cj of the triangles Ts. The distance di,j is used to
derive the pairs of nearest triangles in Ts. A pair of triangles
with relatively larger area characterizes an overlap. The
two triangles formed in an overlapped region either have a
common edge or they are located very close to each other.
This may also be observed in Fig. 3. The minimum among
all distances of pairs of centroids identifies a pair of tri-
angle which is very closely located. It, however, does not
always verify if the paired triangles form a quadrilateral as
a result. So, an additional constraint on checking the
proximity of these edges, based on calculating the vicinity
of the edges, is also applied. Once a pair is found, it is
declared as an overlapping candidate and excluded from
the set of candidates. The process is repeated till the set is
exhausted. The triangle which does not satisfy above two
criteria is also excluded from the set. The number of pairs,
satisfying above criteria, necessarily represents the exact
number of overlaps in a cluster.
2.1.2 Detection of the cut-points on the overlapped region
Having identified the number of overlaps in a cluster, it is
further required to find the exact cut-points on every
overlap. The vertices of the corresponding pair of triangles,
identified on every overlapped region, are used to detect
the cut-points. The vertices of the closest triangles are the
required cut-points. If the triangles share a common edge
and thus have two common vertices, four cut-points are
accordingly identified. In some cases, two triangles may
not have a common edge but would instead be very closely
located on the overlap. Figure 5a demonstrates such a
cluster wherein six vertices of the paired triangles, tv and
tw, are obtained. In such cases, the midpoint of the line
segment joining the vertices that are lying on the proximal
edges of two paired triangles represents a single vertex.
Even though the separation of the overlapped region in the
cluster can be accomplished using the six vertices, only
four vertices are derived out of these six. This is because a
quadrilateral formed by four vertices eases the task of
finding the axis of the chromosome, as will be discussed in
the next section. Figure 5b shows the formation of the
quadrilateral, pqrs, where the pairs v2–w3 and v1–w2 are
replaced by s and q, respectively. Vertices s and q are the
midpoints of the line segments joining v2–w3 and v1–w2.
Thus, four cut-points are derived from six vertices.
Figure 3e demonstrates the results of the proposed
algorithm to identify the cut-points in a variety of sample
images, which are comprised of clusters with single and
multiple overlaps. The algorithm identifies the cut-points
efficiently even in the clusters, where the overlaps are very
close to each other, and even when one of the chromo-
somes involved in the overlap does not have its sizeable
parts lying on the either side of the other chromosome in
the cluster.
1330 Med Biol Eng Comput (2013) 51:1325–1338
123
Page 7
2.2 Separation of the overlapping chromosomes
To disentangle the overlapping cluster, it is necessary to
initially separate the non-overlapping chromosome seg-
ments from the overlap. The non-overlapping chromosome
segments are separated along the edges of the quadrilateral
formed on the overlapped region, with the cut-points as
vertices. Appropriate cut-lines (edges of the quadrilateral),
connecting these points, detected on the overlap are
determined by tracing the boundary of the cluster in
clockwise or anticlockwise order. The cut-line separates
the non-overlapping chromosome segments and the over-
lapped region.
Every chromosome has a particular sequence of higher
and lower intensity values, indicating the presence of light
and dark bands on it. These bands, present on the body of
chromosomes, are always perpendicular to the medial axis
(long axis) of the chromosome. This orientation of the
bands, with respect to the axis of the chromosome, is
always retained irrespective of any shape variability or any
nature of the overlapping chromosome. If a and b are the
two chromosomes, such that b overlaps on a, then b is the
topmost chromosome in the cluster. The bands present on
the overlapped region are perpendicular to the axis of the
chromosome b, and the overlapped region belongs to
chromosome b (refer to Fig. 2c). Thus, the bands on the
overlapped region are oriented in line with the topmost
chromosome of the cluster. So, in the proposed algorithm,
the banding evidence at the overlapped region is used to aid
a decision about which chromosome the overlapped region
belongs to.
Multiple chromosomes may overlap in any directions
making varying degrees with each other. To find the
chromosome to which the overlapped region belongs to,
the variations of the bands on the overlapped region need to
be examined. It is therefore necessary to observe a proper
direction (scan line) along the axis of the chromosome. An
overlapped region, extracted using the proposed algorithm
along with the scan lines, is shown in Fig. 5(c). Though the
bands on the chromosomes are ideally expected to be
continuous, there is large possibility of having some dis-
continuities and a loss of banding information in real
images. Figure 5c demonstrates this possibility, where one
of the vertical bands near cut-line (edge-pq) is slightly
Fig. 4 a The CDT of a clusters
with 1, 2, and 3 overlapping
chromosomes, b a plot of the
triangles (T) generated after
computation of CDT versus the
area, (A) of the triangles. The
value of m indicates the number
of triangles with area above 100
pixels
Med Biol Eng Comput (2013) 51:1325–1338 1331
123
Page 8
discontinuous. Only one scan line passing through this
discontinuity would fail to identify the presence of a dark
band. So, to accommodate the inherent limitations of the
microscopic imaging and staining in real metaphase sam-
ples, the change in the intensities on the overlapped region
is examined along three scan lines in every direction.
Figure 5d and e describes a simple midpoint algorithm
used to identify the direction of the scan line. Two sets of
non-incident edges of the quadrilateral are considered
independently. For each set, multiple segments parallel to
one of the opposite edges, (sp and pq), of the quadrilateral
are considered. Finally, the line joining the midpoints of
the multiple segments defines the scan line. To compute the
band pattern on the overlapped region, subsequent scan
lines parallel to the computed scan line are also considered.
The variations in intensity values along the first scan line in
the horizontal and vertical directions are shown in Fig. 5f,
g, respectively. The plot in Fig. 5f has significant peaks and
valleys (variations in intensity values) indicating the exis-
tence of band in the horizontal direction. A vector, storing
the intensity values along every scan line in each direction,
is formed. The covariance matrix between two populations
of vectors resulting from the set of scan lines in each
direction is computed. The overlapped region belongs to
the chromosome lying along the direction with the maxi-
mum variance. Finally, using the geometrical and mor-
phological characteristics, all the overlapping areas in the
cluster are adhered with respective non-overlapping chro-
mosome segments.
2.3 The proposed algorithm
The algorithm to extricate the cluster of overlapping
chromosomes involves pre-processing of the image fol-
lowed by detection of the cut-points by computation of DT
and CDT. It finally assigns the overlapped region to the
appropriate chromosome segments, leading to successful
disentanglement of the chromosomes.
Fig. 5 a Triangles, tv and tw,
located close to each other on
the overlapped region, b the
closer vertices, v2–w3, and v1–
w3, are replaced by s and q,
respectively, to form a
quadrilateral pqrs on the
overlap, c disentangled
overlapped region pqrs, d scan
line along edges sp, rq, e scan
line along edges sr, pq, f plot of
intensity variation (I) versus the
scan line (S) along sp and rq,
and g plot of intensity variation
(I) versus the scan line (S) along
sr and pq
1332 Med Biol Eng Comput (2013) 51:1325–1338
123
Page 9
Algorithm 1: Extrication of overlapping chromosomes
Input: C = Cluster of overlapped chromosomes
Output: Disentangled chromosomes of C
begin
1. Pre-processing:
C is binarized based on the threshold value computed using Otsu’s
algorithm. Compute the pixels (P = p1, p2…pn) in the boundary
of C. Smooth the boundary of C using Moor’s algorithm.
2. Detect cut-points:
• Compute the DT of P.
• Based on boundary constraint, the CDT of P is calculated.
• Determine m triangles (Ri, i = 0, 1,…m) obtained by the CDT
whose area satisfy the threshold (Tu) condition.
• Compute the centroid (CRi) of each triangle in Ri and measure
the distance (DC) between CRi and CRj for all i, j = 1,…t and
i = j. Determine the distance (DE) between edge ei and edge ej
for all i, j = 1,…m such that ei and ej belong to different
triangles.
• Form different groups (Gk) of two triangles based on the
minimum DC and DE. Choose the pair one after another in order
of their proximities.
• Total number g denote the number of overlaps in the cluster.
• For each group Gk (l B k B g), check whether corresponding
triangles Tt^{Gk} and Tt^{Gk} share a common edge. If they do
not, merge two nearest edges of Tt^{Gk} and Tt^{Gk} by
averaging respective vertex coordinates.
• Trace the edges of quadrilateral (Q) formed by Tt^{Gk} and
Tt^{Gk} in clockwise or anti-clockwise order.
• The four vertices of Q represent the cut-points and the area of
Q determines the overlapped chromosome region (R).
3. Extricate Chromosomes:
• For each Gk, compute the similarity of the band pattern between
the overlapped region and the chromosomes using the coherence
relation.
• Reconstruct a chromosome by assigning R to an appropriate
chromosome, and the overlapped regions in other chromosomes
remain empty.
End
The proposed algorithm extricates the cluster of over-
lapping chromosomes by identifying the cut-points and
further assigning the overlapped region to the appropriate
chromosome. The topmost chromosome of every overlap is
thus completely extricated, and the overlapped part of the
lower chromosomes is permanently lost, which usually is
the case even in manual process of separation of the
chromosome cluster.
3 Results
The proposed algorithm has been tested on a standard PC
(Intel core 2 quad CPU, 3.0 GHz, 4 Gb RAM) in windows
environment using Matlab 7.12.0 (R2011a). Performance
of the algorithm is examined using variety of synthesized
and actual clusters from publically available databases and
private genetic labs. The data set used for the validation of
the proposed algorithm includes altogether 60 cases
exhibiting varying degrees and complexities of overlaps. It
includes images from LK1 data set [13], which has chro-
mosomes of lower quality than other classic database. They
were simulated (manually) to generate 40 overlaps. For
creating synthetic images graphics editing software, Adobe
Photoshop CS4 was used to randomly overlap the chro-
mosomes and form clusters of single and multiple chro-
mosome overlaps. The image editing features of the
software enable the creation of overlaps with varying
styles. Simulated images generated from LK1 database
reflect high degrees of overlaps (up to 6) and contain
variation in the nature of overlap. As the overlapping is
generated synthetically from LK1 database of real chro-
mosomes, it is expected that background noise on the
chromosome section should have similar behavior.
Ten images numbered: 2, 10, 12, 22, 44, 53, 60, 72, 74, and
114 in the folder originals from the data set described in
[17, 18] were selected. These metaphase images have clus-
ters with single, two, and three overlaps with varying degrees
and shapes. Many images in the database have repeated
occurrences of similar types and nature of overlaps. A few
representative cases were therefore selected. A few images
also have brightness saturation at the overlapped region
thereby leading to complete loss in the banding information.
Such images were excluded from experimentation. In prac-
tice, these types of images are also not considered in the
process of manual karyotyping. Manual karyotyping
involves a process of finding best metaphase images. Ten
real images obtained from Denanath Mangeshkar Genetic
Lab (Denanth Mangeshkar Hospital and Research Center,
Erandawne, Pune 411 004, India) are also included in the
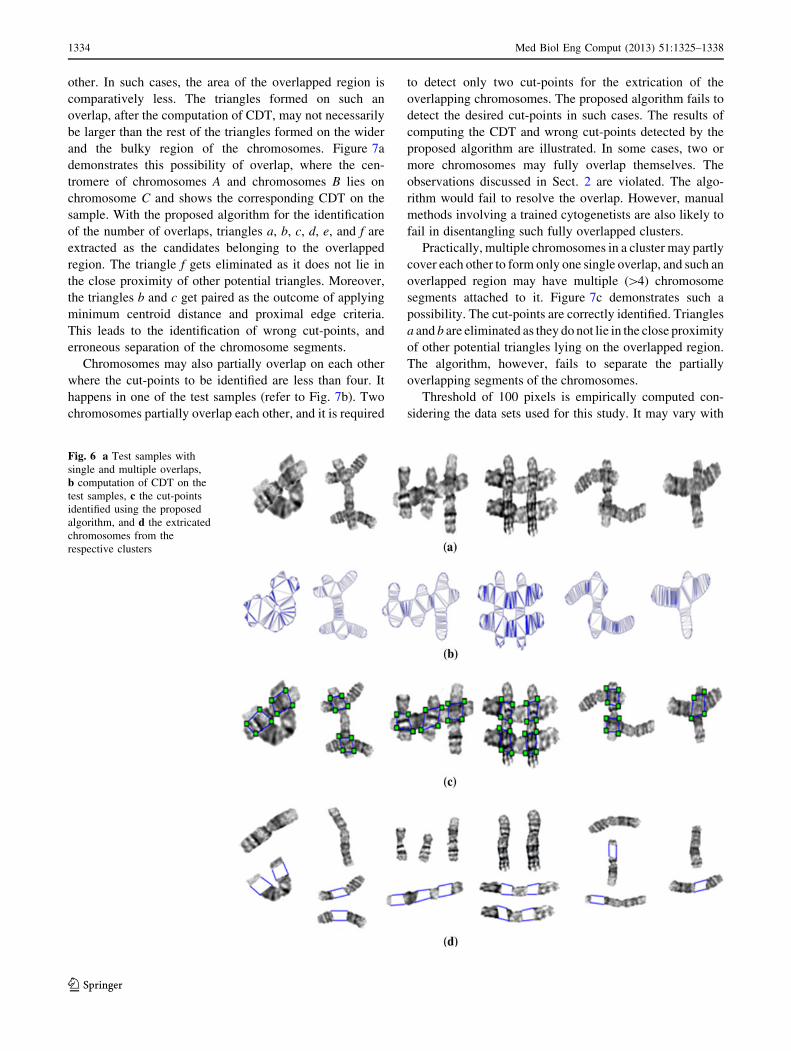
database. Figure 6 demonstrates the intermediate results
obtained during the testing of the proposed algorithm using
the clusters with single and multiple overlaps. The results
were validated using the ordered karyotype of LK1 database
as the ground truth and also by the expert in the genetic lab.
Figure 6a showcases some of the samples from the database.
Figure 6b depicts the results of CDT computation on the
samples to identify the cut-points illustrated in Fig. 6c.
Figure 6d finally presents the results of disentangling the
chromosome cluster and assigning the overlapped region to
the appropriate chromosomes.
Figure 7 demonstrates a few cases wherein the obser-
vations made for characterizing the overlaps in Sect. 2
were violated, and the proposed algorithm fails to extricate
the overlapping chromosomes. The centromere is the nar-
rowest part of the chromosomes. The overlapping chro-
mosomes may have their centromere lying above each
Med Biol Eng Comput (2013) 51:1325–1338 1333
123
Page 10
other. In such cases, the area of the overlapped region is
comparatively less. The triangles formed on such an
overlap, after the computation of CDT, may not necessarily
be larger than the rest of the triangles formed on the wider
and the bulky region of the chromosomes. Figure 7a
demonstrates this possibility of overlap, where the cen-
tromere of chromosomes A and chromosomes B lies on
chromosome C and shows the corresponding CDT on the
sample. With the proposed algorithm for the identification
of the number of overlaps, triangles a, b, c, d, e, and f are
extracted as the candidates belonging to the overlapped
region. The triangle f gets eliminated as it does not lie in
the close proximity of other potential triangles. Moreover,
the triangles b and c get paired as the outcome of applying
minimum centroid distance and proximal edge criteria.
This leads to the identification of wrong cut-points, and
erroneous separation of the chromosome segments.
Chromosomes may also partially overlap on each other
where the cut-points to be identified are less than four. It
happens in one of the test samples (refer to Fig. 7b). Two
chromosomes partially overlap each other, and it is required
to detect only two cut-points for the extrication of the
overlapping chromosomes. The proposed algorithm fails to
detect the desired cut-points in such cases. The results of
computing the CDT and wrong cut-points detected by the
proposed algorithm are illustrated. In some cases, two or
more chromosomes may fully overlap themselves. The
observations discussed in Sect. 2 are violated. The algo-
rithm would fail to resolve the overlap. However, manual
methods involving a trained cytogenetists are also likely to
fail in disentangling such fully overlapped clusters.
Practically, multiple chromosomes in a cluster may partly
cover each other to form only one single overlap, and such an
overlapped region may have multiple ([4) chromosome
segments attached to it. Figure 7c demonstrates such a
possibility. The cut-points are correctly identified. Triangles
a and b are eliminated as they do not lie in the close proximity
of other potential triangles lying on the overlapped region.
The algorithm, however, fails to separate the partially
overlapping segments of the chromosomes.
Threshold of 100 pixels is empirically computed con-
sidering the data sets used for this study. It may vary with
Fig. 6 a Test samples with
single and multiple overlaps,
b computation of CDT on the
test samples, c the cut-points
identified using the proposed
algorithm, and d the extricated
chromosomes from the
respective clusters
1334 Med Biol Eng Comput (2013) 51:1325–1338
123
Page 11
other data sets. The method of identifying the number of
overlaps depends on the resolution of the image. Despite
the correct detection of the cut-point in some clusters, the
algorithm leads to inaccurate separation of the chromo-
some segments. In those cases, pattern of the bands on the
overlap was not prominent enough to aid the decision-
making about which chromosome the overlapped region
belongs to. The proposed algorithm has successfully
identified the exact number of overlaps, cut-points, and
extricates the overlapping chromosome cluster in rest of
the samples from the data set used in experimentation.
The results of the proposed algorithm applied on a set of
clusters with single and multiple overlaps of varying
degrees of complexities are summarized in Table 1, where
each row describes the success rate for the clusters with
specific composition. The accuracy of the proposed algo-
rithm for resolving 1, 2, 3, and C4 overlaps is computed
considering the total number of images in the respective
category. Accuracy of detecting correct cut-points for each
group is defined as the ratio of the number of images with
the correctly identified cut-points to the total number of
images in the respective group (Acc = Ncc/Nimg). Similarly,
accuracy of correctly extricating the chromosomes is
expressed as the ratio of the number of images with the
correct separation of the chromosomes to the total number
of images in the respective group (Acs = Ncs/Nimg).
The algorithm has successfully detected the cut-points
with an average accuracy of 93.33 %. Moreover, the
algorithm can disentangle the chromosomes in the clusters
having 1–6 overlaps with an accuracy of 88.33 %. The
extrication of the chromosomes by assigning the over-
lapped region to the appropriate chromosome segment
becomes challenging in the samples with 5 and 6 overlaps
because of the multiple cavities formed and number of
chromosomes involved. Correct identification of the cut-
points in the overlapping cluster does not ensure its suc-
cessful disentanglement. Erroneous identification of the
cut-points, however, guarantees the wrong separation of the
chromosome cluster, thus restricting Acs below Acc. The
results achieved using the proposed approach were
Fig. 7 Erroneous cut-points
detected by the proposed
algorithm in few test samples
with a overlapping centromeres
(chromosomes A and
B overlapping on chromosome
C), b partially overlapping
chromosome, and c three
chromosomes forming a single
overlap
Med Biol Eng Comput (2013) 51:1325–1338 1335
123
Page 12
presented to an expert in a genetic Lab (Denanth Mang-
eshkar Hospital and Research Center, Erandawne, Pune
411004, India; Birth Right Clinic, Yashokamal, Nr Ay-
urved Rasashala, Karve Rd, Deccan Gymkhana, Pune
411004) for its validation and found to alleviate the cy-
togeneticists’ manual process of chromosome separation.
4 Discussion
The proposed technique addresses one of the most chal-
lenging predicaments in automated karyotyping, the extri-
cation of overlapping chromosomes from the metaphase
image. It applies heuristics and exploits the properties of the
DT to automatically identify the cut-points and uses the
banding information to extricate the overlapping cluster.
The efficiency and the robustness of the algorithm are tested
using a variety of clusters with varying number of over-
lapping chromosomes. The proposed DT-based algorithm
outperforms in identifying the correct cut-points in most of
the critical cases of the overlapping chromosomes and
efficiently decomposes the cluster.
Table 2 compares the results of the proposed approach
with the ones reported in the literature. It must be
emphasized that the reported methods are all tested on
independent data sets. Moreover, some of the studies report
the overall accuracy of their method computed on the
entire database [8, 23, 25, 26], whereas others represent the
accuracy for clusters of varying number or types of over-
laps [1, 4]. Not all the studies explicitly mention their index
to calculate accuracy. The reported accuracy in [8] is the
fraction of overlaps correctly resolved with respect to
manually identified overlaps, whereas studies reported in
[1, 4] present the success rate for the clusters of same types
and sizes. A direct comparison may not necessarily justify
their effectiveness and efficiency. It may be noted that
performances of these algorithms as shown in Table 2 are
merely indicative.
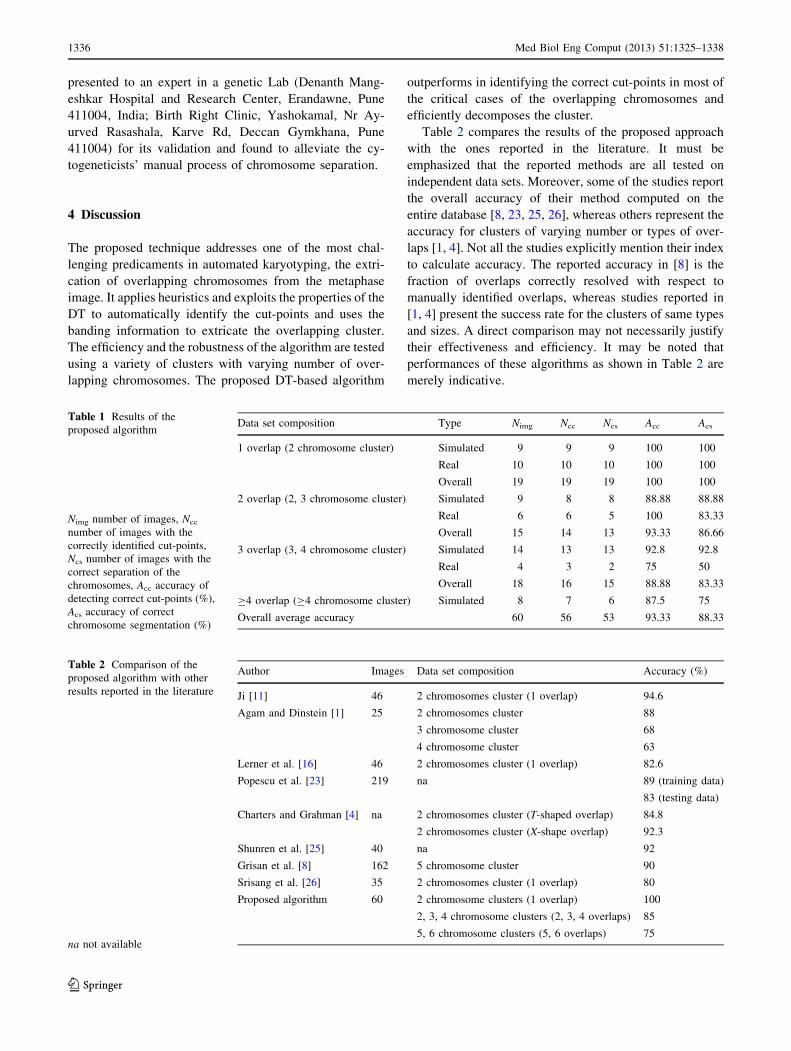
Table 1 Results of the
proposed algorithm
Nimg number of images, Ncc
number of images with the
correctly identified cut-points,
Ncs number of images with the
correct separation of the
chromosomes, Acc accuracy of
detecting correct cut-points (%),
Acs accuracy of correct
chromosome segmentation (%)
Data set composition Type Nimg Ncc Ncs Acc Acs
1 overlap (2 chromosome cluster) Simulated 9 9 9 100 100
Real 10 10 10 100 100
Overall 19 19 19 100 100
2 overlap (2, 3 chromosome cluster) Simulated 9 8 8 88.88 88.88
Real 6 6 5 100 83.33
Overall 15 14 13 93.33 86.66
3 overlap (3, 4 chromosome cluster) Simulated 14 13 13 92.8 92.8
Real 4 3 2 75 50
Overall 18 16 15 88.88 83.33
C4 overlap (C4 chromosome cluster) Simulated 8 7 6 87.5 75
Overall average accuracy 60 56 53 93.33 88.33
Table 2 Comparison of the
proposed algorithm with other
results reported in the literature
na not available
Author Images Data set composition Accuracy (%)
Ji [11] 46 2 chromosomes cluster (1 overlap) 94.6
Agam and Dinstein [1] 25 2 chromosomes cluster 88
3 chromosome cluster 68
4 chromosome cluster 63
Lerner et al. [16] 46 2 chromosomes cluster (1 overlap) 82.6
Popescu et al. [23] 219 na 89 (training data)
83 (testing data)
Charters and Grahman [4] na 2 chromosomes cluster (T-shaped overlap) 84.8
2 chromosomes cluster (X-shape overlap) 92.3
Shunren et al. [25] 40 na 92
Grisan et al. [8] 162 5 chromosome cluster 90
Srisang et al. [26] 35 2 chromosomes cluster (1 overlap) 80
Proposed algorithm 60 2 chromosome clusters (1 overlap) 100
2, 3, 4 chromosome clusters (2, 3, 4 overlaps) 85
5, 6 chromosome clusters (5, 6 overlaps) 75
1336 Med Biol Eng Comput (2013) 51:1325–1338
123
Page 13
It is worth noting that most of the algorithms [6, 12, 16]
previously reported are limited to the separation of two-
chromosome clusters, whereas the probability of having
multiple overlaps is higher in the real metaphase images
and is considered in the proposed approach. Grisan et al.
[8] achieves an accuracy of 90 % for disentangling the
cluster of 5 chromosomes. The algorithm, however, fails
when one of the chromosomes involved does not have a
sizeable part of itself on both sides of the overlap site.
Chromosomes being nonrigid bodies with high degree of
variability may overlap in any fashion. The requirement
that overlapping chromosomes should bisect each other
imposes a serious constraint on the algorithm. The pro-
posed algorithm identifies the cut-points efficiently in the
clusters with multiple overlaps, where the overlaps are very
close to each other and even when the chromosomes,
involved in the overlap, do not bisect each other. It thus
overcomes the limitation of the earlier reported approach in
[8].
The proposed algorithm has efficiently identified the
cut-points in most of the critical cases and successfully
extricated the cluster using the identified cut-points.
Moreover, the data set generated included manually sim-
ulated as well as real images of clusters in metaphase
images. The algorithm achieved good results even in the
cases of multiple overlaps and also when the chromosomes,
in the overlapping cluster, did not have its sizeable part
lying on the either sides of other chromosomes.
Acknowledgments This work was supported by Department of
Science and Technology, Government of India, under research Grant:
SR/TP/ETA-15/2009. First author is grateful to India National
Academy of Engineers (INAE) for facilitating the research schemes
and mentoring programs. The authors are also thankful to Dr.
A. Khmelinskii for providing the LK1 data set and to Ms. Kruti Shah
and Mr. Ketan Soni for their valuable assistance. The authors are
thankful to Dr. Moghe, Denanth Mangeshkar Hospital, and Dr.
Gambhir, Birth Right Clinic for their guidance. The authors gratefully
acknowledge the anonymous reviewers for their insightful comments
and suggestion which have improved the clarity and presentation of
this work to a great extent. The first author is thankful to Mr. Prasanjit
Mondal and Prof. V. K. Bairagi for their kind assistance in prepara-
tion of this manuscript.
References
1. Agam G, Dinstein I (1997) Geometric separation of partially over-
lapping non rigid objects applied to automatic chromosome classi-
fication. IEEE Trans Pattern Anal Mach Intell 19(11):1212–1222
2. Berg M, Cheong O, Kreveld M, Overmars M (2008) Computa-
tional geometry: algorithms and applications, 3rd edn. Springer,
Berlin, pp 191–215
3. Carothers A, Piper J (1994) Computer aided classification of
human chromosomes: a review. Stat Comput 4(3):161–171
4. Charters G, Grahman J (2002) Disentangling chromosome
overlaps by combining trainable shape models with classification
evidence. IEEE Trans Signal Process 50(8):2080–2085
5. Choi H, Bovik A, Castleman K (2006) Maximum likelihood
decomposition of overlapping and touching M-FISH chromo-
somes using geometry, size and color information. In: Proceedings
of the 28th Annual International Conference of IEEE Engineering
in Medicine and Biology Society, vol 1, pp 3130–3133
6. Feng X, Cong P, Zhu Z, Du X (2012) Automated pairing of
human chromosomes applying gradient profile and similarity
matching algorithm. Chemometr Intell Lab Syst 111(1):46–52
7. Gonzalez R, Woods R, Eddins S (2004) Digital image processing
using MATLAB, 2nd edn. Pearson Prentice Hall, New Jersey,
pp 552–557
8. Grisan E, Poletti E, Ruggeri A (2009) Automatic segmentation of
chromosomes in Q-band prometaphase images. IEEE Trans Inf
Technol Biomed 13(4):575–581
9. Image processing tool box documentation centre http://www.
mathworks.com/products/image. Accessed Jan 2012
10. Jahani S, Setarehdan SK, Fatemizadeh E (2011) Automatic identi-
fication of overlapping/touching chromosomes in microscopic
images using morphological operators. Proceedings of the 7th Ira-
nian Conference on Machine Vision and Image Processing, pp 1–4
11. Ji L (1989) Decomposition of overlapping chromosomes. Auto-
mation of cytogentics, New York: Springer, Berlin, pp 177–190
12. Karvelis P, Tzallas A, Fotiadis D, Georgiou I (2008) A multichannel
watershed based segmentation method for multispectral chromo-
some classification. IEEE Trans Med Imaging 27(5):697–708
13. Khmelinskii A, Ventura R, Sanches Joao (2008) Automatic
chromosome pairing using mutual information. Proceedings of
the 30th Annual International Conference IEEE–EMBS 2008,
Vancouver, BC 1918–1921. (http://dx.doi.org/10.1109/IEMBS.
2008.4649562 database received on 7 June 2011)
14. Lee C, Gisselsson D, Jin C, Nordgren A, Ferguson D, Blennow E,
Fletcher J, Morton C (2001) Limitation of chromosome classification
by multicolor karyotyping. Am J Hum Genet 68(4):1043–1047
15. Lerner B (1998) Toward a completely automatic neural network
based human chromosome analysis. IEEE Trans Syst Man Cy-
bern B Cybern 28(4):544–552
16. Lerner B, Guterman H, Dinstein I (1998) A classification driven
partially occluded object segmentation (CPOOS) method with
application to chromosome analysis. IEEE Trans Signal Process
46(10):2841–2847
17. Munot M, Joshi M, Sharma N (2011) Automated karyotyping of
metaphase cells with touching chromosomes. Int J Comput Appl
29(12):14–20
18. Otsu N (1979) A threshold selection method from gray level
histograms. IEEE Trans Syst Man Cybern 9(1):62–66
19. Pantaleao C, Azevedo F, Pereira E, Ribeiro M, Marques J (2002)
Development of a computerized system for cytogenetic analysis
and classification. Proceedings of the 24th Annual Conference
and the annual fall meeting of the Biomedical Engineering
Society EMBS/ BMES, vol 3, pp 2211–2212
20. Peter F (2000) Delaunay triangulation http://www.iue.tuwien.ac.
at/phd/fleischmann/node41.html. Accessed 20 Dec 2011
21. Poletti E Chromosome data set for classification available at
http://bioimlab.dei.unipd.it. Accessed 7 June 2011
22. Poletti E, Grisan E, Ruggeri A (2012) A modular framework for
the automatic classification of chromosomes in q band images.
Comput Methods Programs Biomed 105(2):120–130
23. Popescu M, Gader P, Keller J, Klein C, Stanley J, Caldweli C
(1999) Automatic karyotyping of metaphase cells with overlap-
ping chromosomes. Comput Biol Med 29(1):61–82
24. Schwartzkopf W, Bovik A, Evans B (2005) Maximum likelihood
techniques for joint segmentation-classification of multispectral
chromosome images. IEEE Trans Med Imaging 24(12):
1593–1610
25. Shunren X, Weidong X, Yutang S (2003) Two Intelligent algo-
rithms applied to automatic chromosomes incision. Proceedings
Med Biol Eng Comput (2013) 51:1325–1338 1337
123
Page 14
of the IEEE International Conference in Acoustics, Speech and
Signal Processing (ICASSP-03), vol 3, pp 697–700
26. Srisang W, Jaroensutasinee K, Jaroensutasinee M (2006) Seg-
mentation of overlapping chromosomes images using computa-
tional geometry. Walailak Journal of Science and Technology,
vol 3, No. 2, Walailak University, Thailand, pp 181–194
27. Yvinec M (2012) 2D triangulations, CGAL user and reference
manual, 4th edn, CGAL Editorial Board
1338 Med Biol Eng Comput (2013) 51:1325–1338
123