Page 1
A novel approach for modeling malaria incidence usingcomplex categorical household data: the minimum messagelength (MML) method applied to Indonesian data
Author
Visser, Gerhard, Dale, Patricia, Dowe, David, Ndoen, Ermi, Dale, Michael, Sipe, Neil
Published
2012
Journal Title
Computational Ecology and Software
Copyright Statement
© 2012 Visser et al, licensee International Academy of Ecology and Environmental Sciences.This is an Open Access article which permitsunrestricted use, distribution, and reproduction inany medium, provided the original work is properly cited. Please refer to the journal's website foraccess to the definitive, published version.
Downloaded from
http://hdl.handle.net/10072/49308
Link to published version
http://www.iaees.org/publications/journals/ces/articles/2012-2%283%29/1-Dale-Abstract.asp
Griffith Research Online
https://research-repository.griffith.edu.au
Page 2
Computational Ecology and Software, 2012, 2(3):140-159
IAEES www.iaees.org
Article
A novel approach for modeling malaria incidence using complex categorical
household data: The minimum message length (MML) method applied to
Indonesian data
Gerhard Visser1, Pat Dale2,3, David Dowe1, Ermi Ndoen2, Mike Dale2, Neil Sipe2,4
1Clayton School of I.T., Monash University, Clayton, Victoria, Australia
2Griffith School of Environment, Griffith University, Queensland, Australia
3Environmental Futures Centre
4Urban Research Program
E-mail: [email protected]
Received 24 July 2012; Accepted 30 July 2012; Published online 1 September 2012
IAEES
Abstract
We investigated the application of a Minimum Message Length (MML) modeling approach to identify the
simplest model that would explain two target malaria incidence variables: incidence in the short term and on
the average longer term, in two areas in Indonesia, based on a range of ecological variables including
environmental and socio-economic ones. The approach is suitable for dealing with a variety of problems such
as complexity and where there are missing values in the data. It can detect weak relations, is resistant to over-
fitting and can show the way in which many variables, working together, contribute to explaining malaria
incidence. This last point is a major strength of the method as it allows many variables to be analysed. Data
were obtained at household level by questionnaire for villages in West Timor and Central Java. Data were
collected on 26 variables in nine categories: stratum (a village-level variable based on the API/AMI categories),
ecology, occupation, preventative measures taken, health care facilities, the immediate environment, household
characteristics, socio-economic status and perception of malaria cause. Several models were used and the
simplest (best) model, that is the one with the minimum message length was selected for each area. The results
showed that consistent predictors of malaria included combinations of ecology (coastal), preventative (clean
backyard) and environment (mosquito breeding place, garden and rice cultivation). The models also showed
that most of the other variables were not good predictors and this is discussed in the paper. We conclude that
the method has potential for identifying simple predictors of malaria and that it could be used to focus malaria
management on combinations of variables rather than relying on single ones that may not be consistently
reliable.
Keywords malaria; Indonesia; model; Minimum Message Length (MML); classification.
1 Introduction
Similar to Chikungunya and Dengue (Radhika et al., 2011; Ramathilaga et al., 2012), malaria is a disease of
the tropics and subtropics. It is a global problem, endemic in 106 countries with an estimated 3.3 billion people
at risk of malaria in 2010. In 2010 there were 216 million cases of malaria world wide, with an estimated
Page 3
Computational Ecology and Software, 2012, 2(3):140-159
IAEES www.iaees.org
655,000 deaths (World Health Organisation, 2011). In Indonesia around half the population lives in malarious
areas SEARO (2010).
The pathogens, species of Plasmodium, are transmitted by mosquitoes of the genus Anopheles. Although
most research on malaria has been carried out in Sub-Saharan Africa, malaria is important in south-east Asia.
The ecology of malaria is complex. Research over several areas in Indonesia has shown that its relationship
with environmental variables (biophysical and socio-economic) is spatially and temporally heterogeneous
(Dale et al., 2005). Most other studies are area-specific within Indonesia (e.g., Anthony et al., 1992; Baird et
al., 1996; Barcus et al., 2002; Syafruddin et al., 2006; Syafruddin et al., 2007).
Control of malaria often focuses on control of mosquitoes either by excluding them from contact with
people using insecticide treated nets (ITNs) or by indoor residual spraying (IRS) of insecticide WHO (2009).
It is difficult to relate specific mosquito control activities to malaria incidence, although mosquito control in
parts of Australia has been shown to be related to the incidence of Ross River virus, also a mosquito-borne
disease (Tomerini et al., 2011). This paper is about a novel modeling method applied to the incidence of
malaria, an increasing field of research. McKenzie (2000) reviewed malaria modeling, noting that since 1928
there have been many modeling approaches focussing on malaria. More recently, a simple internet search
(March 2012) for ‘malaria’ and ‘model’ in the title found 358 references in the refereed literature dating from
1974. Of these there were 67 that related specifically to models of malaria incidence, as opposed to treatment
and other modeling approaches, and 60% were published since 2005 (Dale unpublished data). Smith and
Ruktanonchai (2010), in their review, note that the early mathematical models of malaria transmission remain
useful conceptually but have some important shortcomings. They need to be applied to real systems and
extended to find new ways explain malaria incidence. Malaria presents a complex problem, with a variety of
anopheline mosquito vectors in a wide range of habitats and transmitting the disease via several related
pathogens of which Plasmodium falciparum is the most serious. This is a complex area and models are
powerful tools to assist the understanding of complex issues, to integrate information from different areas. This
has been facilitated by advances in computer modeling that extend traditional analytic approaches (McKenzie,
2000). Modeling malaria can help identify the variables that are important to its incidence and has potential
application in disease management.
That modeling is important to understanding malaria is evidenced by the range of approaches in the
modeling literature. These include disease dynamics such as transmission, vector/disease relationships with
environment (especially with climate) as well as more detailed clinical studies, vaccine development,
entomologic modeling of vectors and genetic research.
Mathematical disease models for malaria may consider the dynamics (Tumwiine et al., 2007) or
transmission (Ishikawa et al., 2003) including entomological parameters (Vargas-De-Leon, 2012) or
transmission and resistance (Smith et al., 2007). Mathematical models may extend to a broader range of
variables. For example Gu et al., (2003) modelled Plasmodium falciparum transmission using both
epidemiological and entomological data. In a different ecological context, Ballesteros and Qiu (2012) have
used a machine learning technique to model change in (location of) land use. MML is a mathematical
technique from Bayesian information theory.”
There are several approaches that are used to model malaria. Recent examples include Bayesian methods
(Gosoniu et al., 2010; Riedel et al., 2010). Also there are more complex arrangements such as using Bayesian
modeling with Markov Chain Monte Carlo (MCMC) techniques and both generalized linear models (GLM)
and generalized additive mixed models (GAMM) (Nkurunziza et al., 2010). The interest here is in the very
complex area of environmental modeling, using a combination of biophysical and socio-economic and
behavioral variables. This complex area of malaria research needs to be explored, using powerful computers
141
Page 4
Computational Ecology and Software, 2012, 2(3):140-159
IAEES www.iaees.org
and innovative analytic tools. An early paper by Jones and O’Neill (1993) modelled malaria using land use and
population as independent variables in the Brazilian Amazon. Ngawa and Shu (2000) developed a
mathematical model of endemic malaria using human population and mosquitoes and deterministic differential
equations with variable human and mosquito populations. More recent research has shown how a range of
environmental factors can be used to model malaria at relatively high resolution (at sub district level in Malawi,
Africa) using regression analysis (Kazembe, 2007). The most comprehensive model is the conceptual one of
De Vries and Martens (2000) that includes both biophysical and socioeconomic variables, though, as far as the
authors are aware, it has not been fully implemented. Nevertheless it is a useful model.
An innovative approach that has been used in other areas is that of using a Minimum Message Length
(MML) criterion to select the best model (see for example (Dowe, 2008; Dowe et al., 2007)). It has never been
published in the malaria modeling literature and so we explore its use here. It is more fully described below.
Complex systems need innovative modeling techniques to discover the most appropriate (best fit) model.
Clustering can suggest groupings of like things and MML can evaluate the best fit, based on the shortest
message length needed to describe the model.
This paper develops a model using MML to discover the best model to explain malaria incidence. The
modeling is optimized using the Minimum Message Length (MML) principle of machine learning and
inductive inference (Wallace and Boulton, 1968; Boulton and Wallace 1973; Wallace and Dowe, 1999;
Wallace, 2005; Dowe, 2008, 2011). It is statistically invariant (meaning that transforming the co-ordinates
does not affect the answer) and it is resistant to noise, (a common problem with ecological data); it generates
simple models that predict well (Comley and Dowe, 2003; Comley and Dowe, 2005; Dowe et al., 2007) and it
is useful in several different tasks where model uncertainty is important (Dale and Dale 2004). MML is a
method which involves both model and fit. MML uses a two-part message, the first part of which encodes the
model (and whose length is the complexity of the model) and the second part of which encodes the data, given
the model (and whose length is the log-likelihood of the data given this model). A more complex model is
only acceptable if the extra ‘cost’ (measured by message length) of specifying the model gives an increase in
the fit to data sufficient to reduce the overall message length. It is thus an implementation of Ockham's Razor
(Needham and Dowe, 2001; Dowe, 2011, sec. 4).
2 Methods
2.1 Data collection
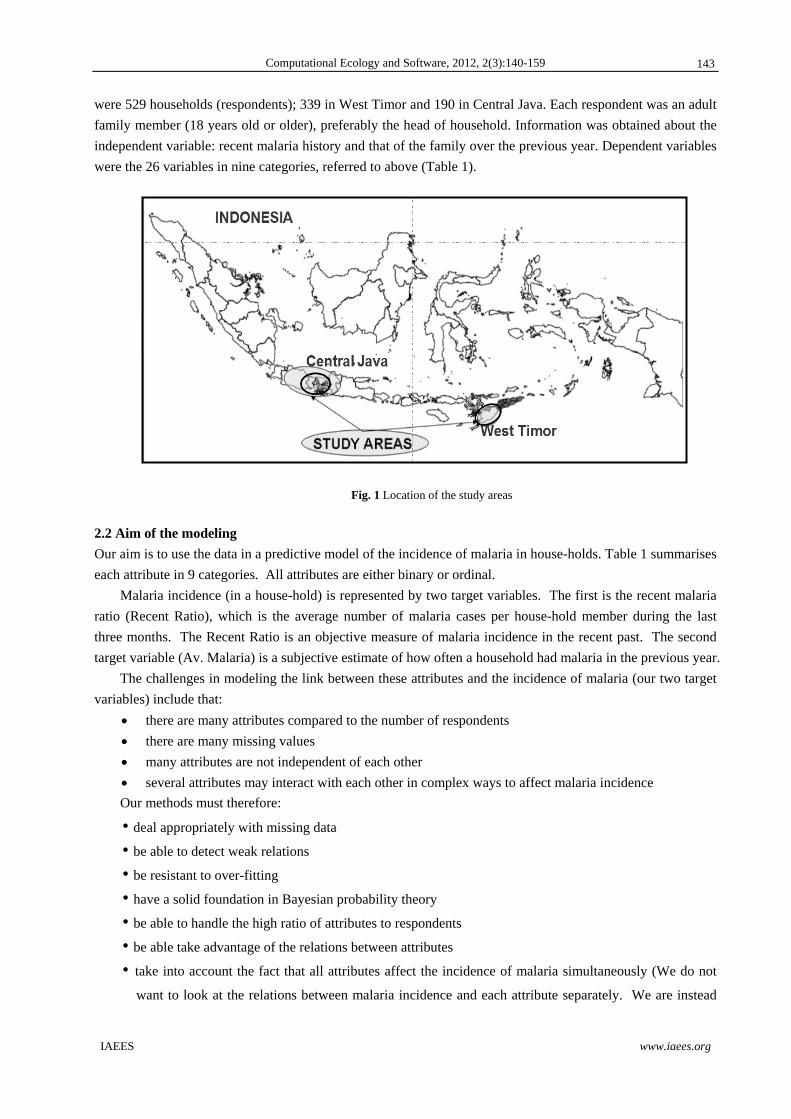
Data were collected by household in villages in two provinces which both had endemic malaria. These were
West Timor and Central Java (Fig. 1). The villages were selected by stratified random sampling, subject to an
access constraint. Stratification was based on malaria status (incidence of malaria – high or medium) and village
topographic character: coastal, hilly or highland topography, which is related to the distribution of various
mosquito vectors of malaria in the area (Ndoen, 2010).
Malaria incidence data were collected at the district health office, based on the monthly routine
surveillance data reports from health centres. These were assigned to two malaria status categories (High or
Medium) based on the Annual Malaria Incidence (AMI) or the Annual Parasite Incidence (API).
The main data used here were 26 attributes, in nine categories, as shown in Table 1. They were selected
from 67 attributes collected in a broader household survey (Ndoen, 2008). The selection was based on
variables identified as important in the literature and identified by Ndoen (2008). Data were collected by
interview, using a semi-structured questionnaire. Trained health centres staff conducted the interviews. One
day training was provided for the interviewers prior to data collection. The trainings were conducted in health
centres or in district health offices. The sampling unit was household or family, selected systematically. There
142
Page 5
Computational Ecology and Software, 2012, 2(3):140-159
IAEES www.iaees.org
were 529 households (respondents); 339 in West Timor and 190 in Central Java. Each respondent was an adult
family member (18 years old or older), preferably the head of household. Information was obtained about the
independent variable: recent malaria history and that of the family over the previous year. Dependent variables
were the 26 variables in nine categories, referred to above (Table 1).
Fig. 1 Location of the study areas
2.2 Aim of the modeling
Our aim is to use the data in a predictive model of the incidence of malaria in house-holds. Table 1 summarises
each attribute in 9 categories. All attributes are either binary or ordinal.
Malaria incidence (in a house-hold) is represented by two target variables. The first is the recent malaria
ratio (Recent Ratio), which is the average number of malaria cases per house-hold member during the last
three months. The Recent Ratio is an objective measure of malaria incidence in the recent past. The second
target variable (Av. Malaria) is a subjective estimate of how often a household had malaria in the previous year.
The challenges in modeling the link between these attributes and the incidence of malaria (our two target
variables) include that:
there are many attributes compared to the number of respondents
there are many missing values
many attributes are not independent of each other
several attributes may interact with each other in complex ways to affect malaria incidence
Our methods must therefore:
• deal appropriately with missing data
• be able to detect weak relations
• be resistant to over-fitting
• have a solid foundation in Bayesian probability theory
• be able to handle the high ratio of attributes to respondents
• be able take advantage of the relations between attributes
• take into account the fact that all attributes affect the incidence of malaria simultaneously (We do not
want to look at the relations between malaria incidence and each attribute separately. We are instead
143
Page 6
Computational Ecology and Software, 2012, 2(3):140-159
IAEES www.iaees.org
interested in complete models that show how all attributes work together to contribute to malaria
incidence.)
• produce results that are easy to interpret
• be able to select between models of different complexities
Table 1 Attributes selected for analysis
Category Attribute Name Description
Stratum Stratum malaria stratum of the respondents village
Ecology Highland .
Ecology Hilly .
Ecology Coastal .
Occupation Farmer .
Occupation Fisher .
Occupation Other true if not fisher or farmer
Preventative Measures Clean Backyard frequency of cleaning backyard
Preventative Measures IRS indoor residual spraying
Preventative Measures Long Sleeve Use wearing covering clothing
Preventative Measures Bed-net Ratio ratio of house-hold members using bed-nets
Health Care Facilities HF Access ease of access the health care facilities
Health Care Facilities Distance HF distance to the nearest health care facility
Immediate Environment Pond presence of a pond near the home
Immediate Environment Rice Field presence of a rice field near the home
Immediate Environment Breeding Place presence of a potential mosquito breeding place near the home
Immediate Environment Paddock presence of a paddock near the home
Immediate Environment Garden presence of a garden near the home
Immediate Environment Bushes presence of bushes near the home
House-Hold Toilet indoor or outdoor
House-Hold Lighting electric or non-electric
House-Hold Cooking Fuel cooking fuel
House-Hold Wall type of walls in home
House-Hold HH Members number of people in the house-hold
SES SES socio-economic status
Perception Perception Accuracy of respondent’s perception of malaria and its causes
2.3 Description of the model
2.3.1 Two Bayesian network models
We use customised Bayesian network models (also known as directed graphical models) for the analysis. The
idea of using MML for hybrid Bayesian network models with both discrete (categorical) and continuous-
144
Page 7
Computational Ecology and Software, 2012, 2(3):140-159
IAEES www.iaees.org
valued attributes was discussed in Dowe and Wallace (1998) before then being first implemented in Comley
and Dowe, (2003 and 2005), with discussions in Tan and Dowe (2004, sec. 5), Wallace (2005, sec. 7.4), Dowe
(2008, sec. 0.2.5) and Dowe (2011).
The minimum message length (MML) principle is used to encode the discrete structure of the Bayesian
network and point estimates of the weights of parameters on network arcs - all of which is encoded in the first
part of the two-part MML message, with the second part encoding the data given this Bayesian network
model. The total two-part message length gives a measure of goodness of the suitability of the model, trading
off the length of the first part of the message (model complexity) with the length of the second part of the
message (goodness of fit to the observed data).
The nodes of our Bayesian networks fall into three categories.
I. Target: These nodes each represent a vector of observed values for one attribute, which is to be
explained (Av. Malaria and Recent Ratio).
II. Input: These nodes each represent a vector of observed values for one attribute which is not to be
explained but is used to explain the target variables (e.g., causes of malaria).
III. Hidden: These nodes each represent a vector of unobserved values, which are inferred.
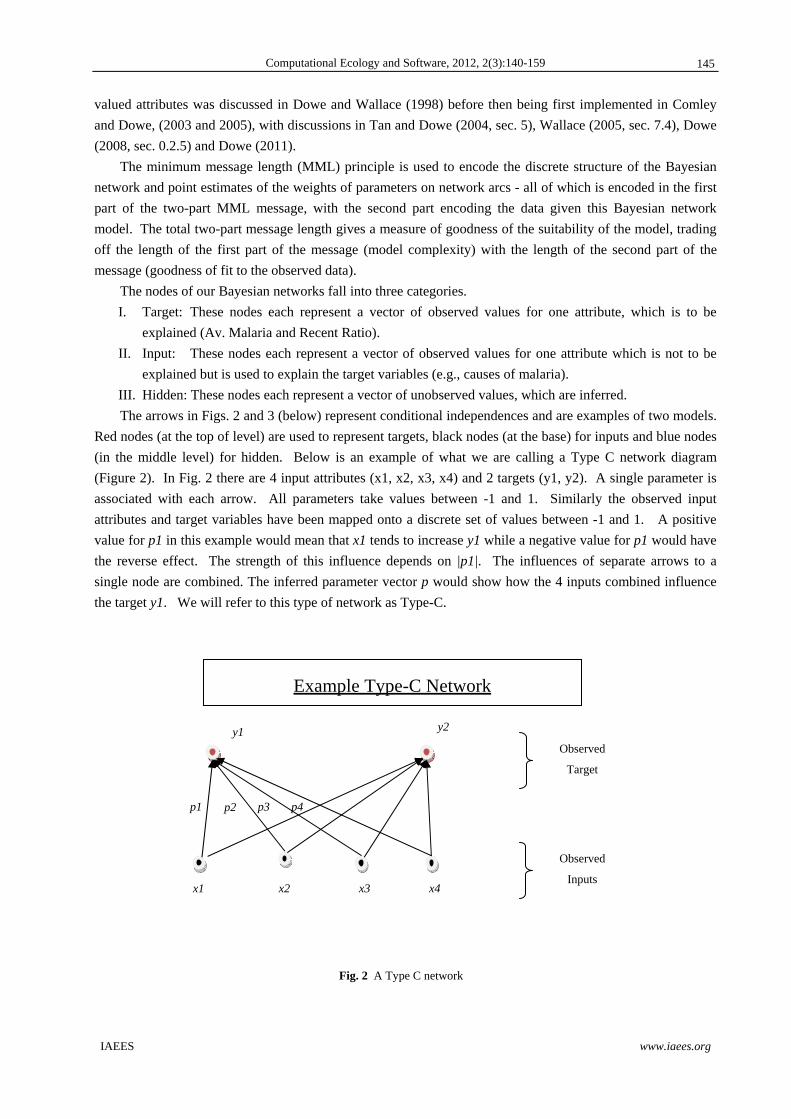
The arrows in Figs. 2 and 3 (below) represent conditional independences and are examples of two models.
Red nodes (at the top of level) are used to represent targets, black nodes (at the base) for inputs and blue nodes
(in the middle level) for hidden. Below is an example of what we are calling a Type C network diagram
(Figure 2). In Fig. 2 there are 4 input attributes (x1, x2, x3, x4) and 2 targets (y1, y2). A single parameter is
associated with each arrow. All parameters take values between -1 and 1. Similarly the observed input
attributes and target variables have been mapped onto a discrete set of values between -1 and 1. A positive
value for p1 in this example would mean that x1 tends to increase y1 while a negative value for p1 would have
the reverse effect. The strength of this influence depends on |p1|. The influences of separate arrows to a
single node are combined. The inferred parameter vector p would show how the 4 inputs combined influence
the target y1. We will refer to this type of network as Type-C.
Fig. 2 A Type C network
Observed
Inputs
Example Type-C Network
Observed
Target
y1
x1 x2 x3 x4
p4 p1 p2 p3
y2
145
Page 8
Computational Ecology and Software, 2012, 2(3):140-159
IAEES www.iaees.org
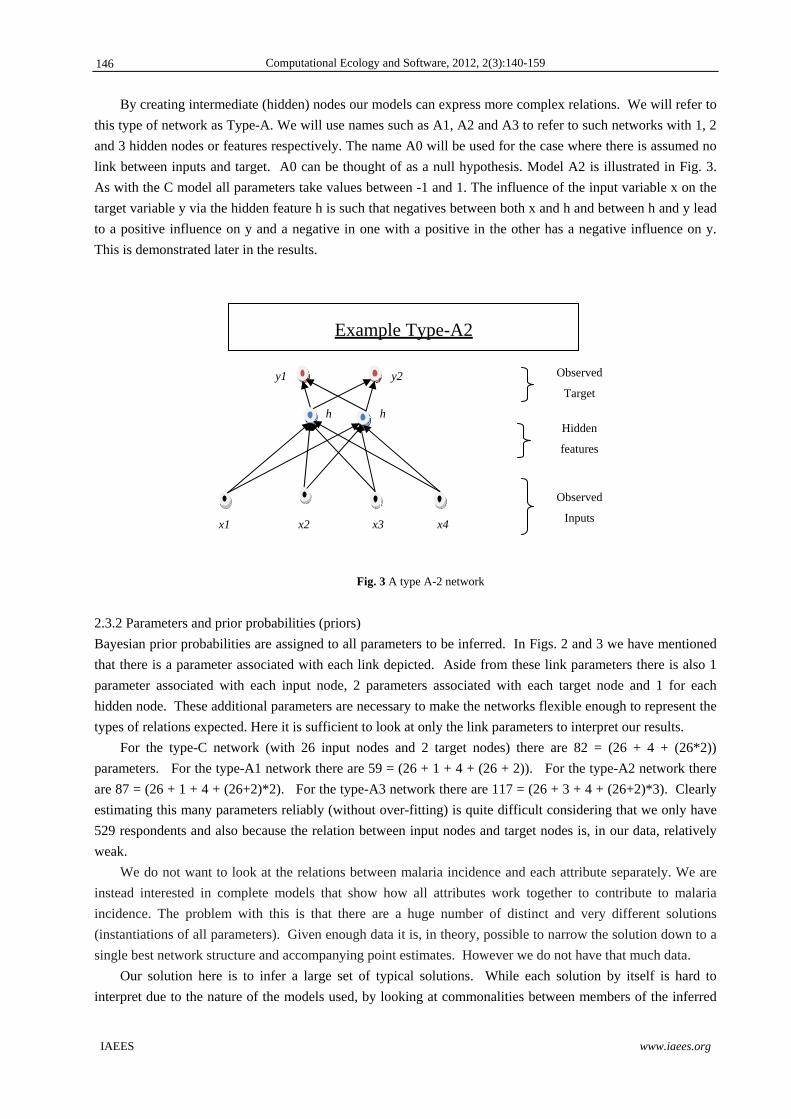
By creating intermediate (hidden) nodes our models can express more complex relations. We will refer to
this type of network as Type-A. We will use names such as A1, A2 and A3 to refer to such networks with 1, 2
and 3 hidden nodes or features respectively. The name A0 will be used for the case where there is assumed no
link between inputs and target. A0 can be thought of as a null hypothesis. Model A2 is illustrated in Fig. 3.
As with the C model all parameters take values between -1 and 1. The influence of the input variable x on the
target variable y via the hidden feature h is such that negatives between both x and h and between h and y lead
to a positive influence on y and a negative in one with a positive in the other has a negative influence on y.
This is demonstrated later in the results.
Fig. 3 A type A-2 network
2.3.2 Parameters and prior probabilities (priors)
Bayesian prior probabilities are assigned to all parameters to be inferred. In Figs. 2 and 3 we have mentioned
that there is a parameter associated with each link depicted. Aside from these link parameters there is also 1
parameter associated with each input node, 2 parameters associated with each target node and 1 for each
hidden node. These additional parameters are necessary to make the networks flexible enough to represent the
types of relations expected. Here it is sufficient to look at only the link parameters to interpret our results.
For the type-C network (with 26 input nodes and 2 target nodes) there are 82 = (26 + 4 + (26*2))
parameters. For the type-A1 network there are 59 = (26 + 1 + 4 + (26 + 2)). For the type-A2 network there
are 87 = (26 + 1 + 4 + (26+2)*2). For the type-A3 network there are 117 = (26 + 3 + 4 + (26+2)*3). Clearly
estimating this many parameters reliably (without over-fitting) is quite difficult considering that we only have
529 respondents and also because the relation between input nodes and target nodes is, in our data, relatively
weak.
We do not want to look at the relations between malaria incidence and each attribute separately. We are
instead interested in complete models that show how all attributes work together to contribute to malaria
incidence. The problem with this is that there are a huge number of distinct and very different solutions
(instantiations of all parameters). Given enough data it is, in theory, possible to narrow the solution down to a
single best network structure and accompanying point estimates. However we do not have that much data.
Our solution here is to infer a large set of typical solutions. While each solution by itself is hard to
interpret due to the nature of the models used, by looking at commonalities between members of the inferred
hhHidden
features
Example Type-A2
Observed
Target
y1
x1 x2 x3 x4
Observed
Inputs
y2
146
Page 9
Computational Ecology and Software, 2012, 2(3):140-159
IAEES www.iaees.org
set of solutions, one can come to some solid conclusions. For each link parameter we calculate a mean and
standard deviation over all the values it takes in the solution set. A high standard deviation indicates that the
value of a link parameter depends a lot on the values of other parameters. A low standard deviation means the
influence of that parameter depends little on the effects of other parameters. This allows us to isolate those
input attributes that have a consistent relation with malaria incidence even when the effects of all other
attributes are taken into account.
The problem of having many parameters can be further alleviated by assigning strong priors to all
parameters. Our prior over the parameters gives a strong preference to solutions which set most of the
parameters to zero (so that those links have no effect) and some preference to values with low magnitude (so
that those links have little effect). This prior reduces the uncertainty about the solution, allowing more to be
accomplished with less data. It also has the added bonus of giving preference to solutions that are simpler and
easier to interpret.
The reader may have noticed that these models have a lot in common with artificial neural-networks.
While they function in a similar way, our models are strictly Bayesian networks with complete priors defined.
This design is intended to be correct in terms of Bayesian modeling and to make solutions (point-estimates)
less sensitive to small changes in parameter values.
2.3.3 Analysis setup
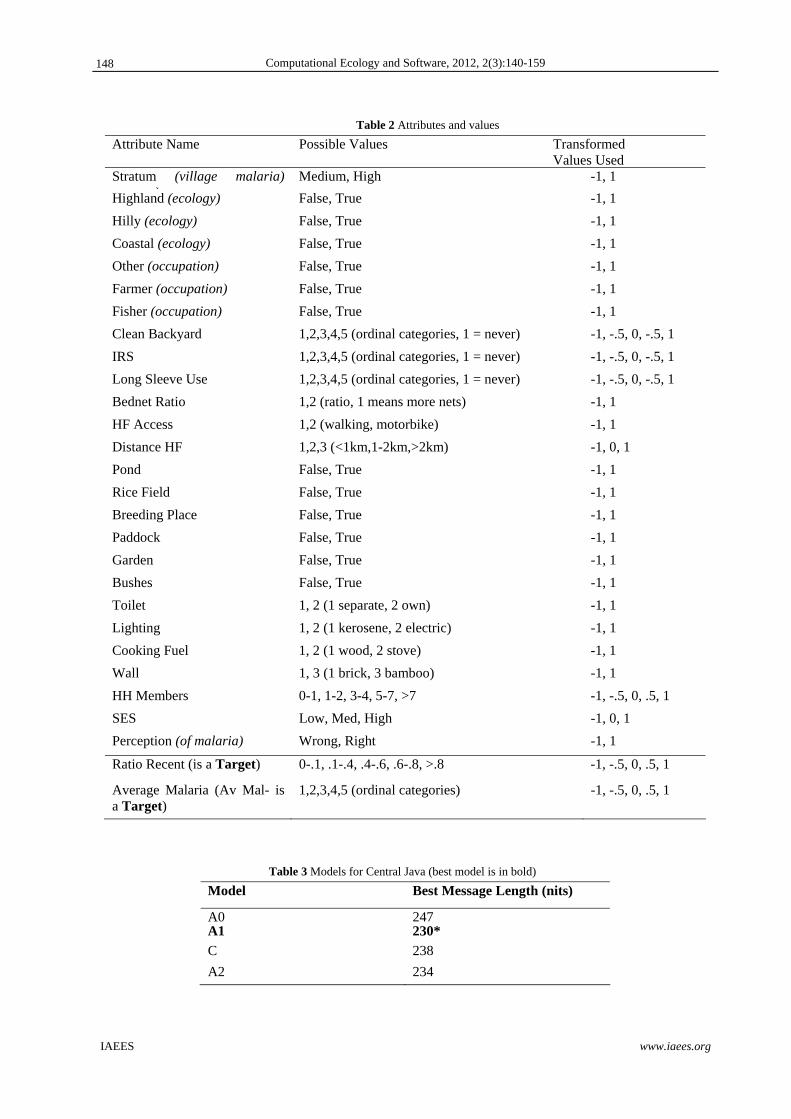
Table 2 shows the 26 input attributes and the values they take. The two target variables are shown at the end of
the table. All values have been mapped to real values between -1 and 1 to be used by the program.
We have used models A0, A1, C, A2 and A3 on the data for Central Java and West Timor to infer point
estimates of all parameters. Message lengths were used to select the best models: that is, those models with
the minimum lengths. This was applied to responses from both provinces (West Timor, Central Java)
separately. That was done because we expect each area to be distinct enough to have different characteristics
where cause of malaria is concerned. West Timor has a greater malaria problem, with year-long transmission,
whereas the problem is less in Central Java (Ndoen et al., 2011), although malaria is endemic in both areas.
3 Results
3.1 Results of modeling
The results generally found that an A type model had the shortest message length and hence is the preferred
one. The results presented below show both the A and C model only where there were useful predictors. That
is where connecting link parameters had means of absolute value greater than 0.10 and standard deviations less
than 0.3. The most consistent predictors were determined by having a small standard deviation compared to the
mean (a mean of absolute value greater than 0.10 and a standard deviation (SD) of less than half the mean).
The message length is measured in nits, where 1 nit (of information) = log2 (e) bits approx. 1.4427 bits.
3.2 Results for Central Java
The analysis of 190 respondents from Central Java found that model A1 provided the best explanation of the
target variables (Table 3). Model C provided no consistent predictors of malaria and will not be considered
further here.
147
Page 10
Computational Ecology and Software, 2012, 2(3):140-159
IAEES www.iaees.org
Table 2 Attributes and values
Attribute Name Possible Values Transformed Values Used
Stratum (village malaria) t t )
Medium, High -1, 1
Highland (ecology) False, True -1, 1
Hilly (ecology) False, True -1, 1
Coastal (ecology) False, True -1, 1
Other (occupation) False, True -1, 1
Farmer (occupation) False, True -1, 1
Fisher (occupation) False, True -1, 1
Clean Backyard 1,2,3,4,5 (ordinal categories, 1 = never) -1, -.5, 0, -.5, 1
IRS 1,2,3,4,5 (ordinal categories, 1 = never) -1, -.5, 0, -.5, 1
Long Sleeve Use 1,2,3,4,5 (ordinal categories, 1 = never) -1, -.5, 0, -.5, 1
Bednet Ratio 1,2 (ratio, 1 means more nets) -1, 1
HF Access 1,2 (walking, motorbike) -1, 1
Distance HF 1,2,3 (<1km,1-2km,>2km) -1, 0, 1
Pond False, True -1, 1
Rice Field False, True -1, 1
Breeding Place False, True -1, 1
Paddock False, True -1, 1
Garden False, True -1, 1
Bushes False, True -1, 1
Toilet 1, 2 (1 separate, 2 own) -1, 1
Lighting 1, 2 (1 kerosene, 2 electric) -1, 1
Cooking Fuel 1, 2 (1 wood, 2 stove) -1, 1
Wall 1, 3 (1 brick, 3 bamboo) -1, 1
HH Members 0-1, 1-2, 3-4, 5-7, >7 -1, -.5, 0, .5, 1
SES Low, Med, High -1, 0, 1
Perception (of malaria) Wrong, Right -1, 1
Ratio Recent (is a Target) 0-.1, .1-.4, .4-.6, .6-.8, >.8 -1, -.5, 0, .5, 1
Average Malaria (Av Mal- is a Target)
1,2,3,4,5 (ordinal categories) -1, -.5, 0, .5, 1
Table 3 Models for Central Java (best model is in bold)
Model Best Message Length (nits)
A0 247A1 230*
C 238
A2 234
148
Page 11
Computational Ecology and Software, 2012, 2(3):140-159
IAEES www.iaees.org
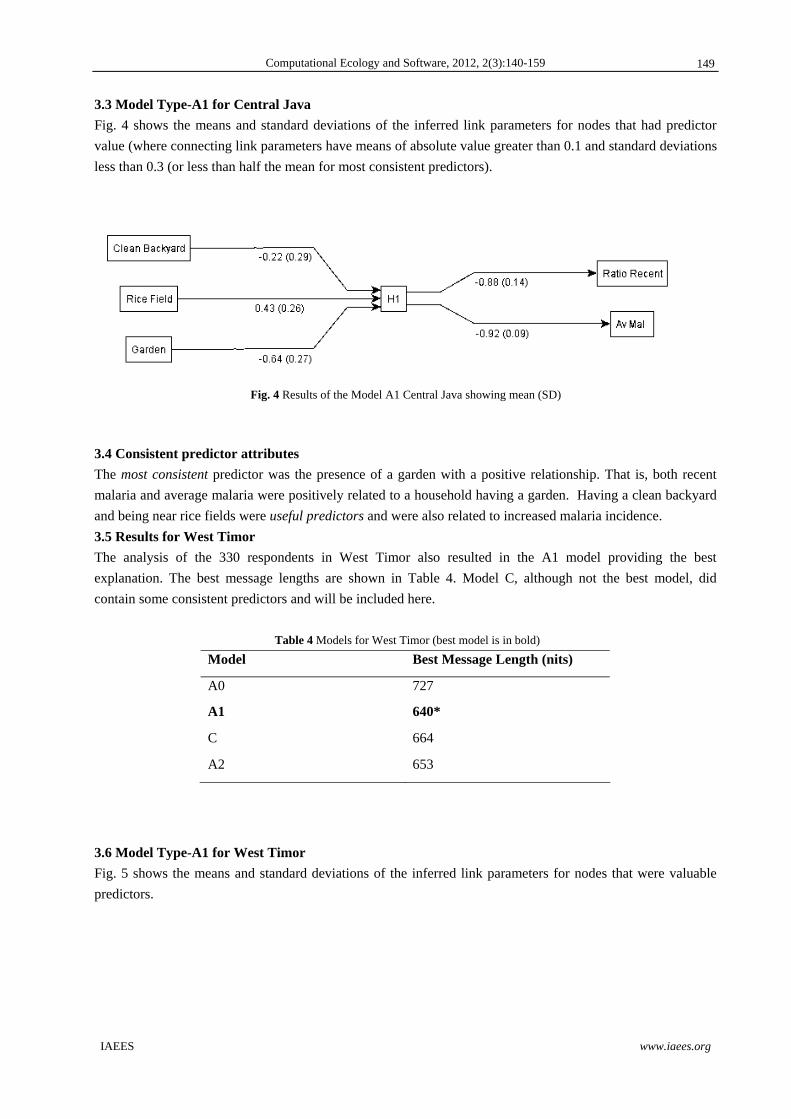
3.3 Model Type-A1 for Central Java
Fig. 4 shows the means and standard deviations of the inferred link parameters for nodes that had predictor
value (where connecting link parameters have means of absolute value greater than 0.1 and standard deviations
less than 0.3 (or less than half the mean for most consistent predictors).
Fig. 4 Results of the Model A1 Central Java showing mean (SD)
3.4 Consistent predictor attributes
The most consistent predictor was the presence of a garden with a positive relationship. That is, both recent
malaria and average malaria were positively related to a household having a garden. Having a clean backyard
and being near rice fields were useful predictors and were also related to increased malaria incidence.
3.5 Results for West Timor
The analysis of the 330 respondents in West Timor also resulted in the A1 model providing the best
explanation. The best message lengths are shown in Table 4. Model C, although not the best model, did
contain some consistent predictors and will be included here.
Table 4 Models for West Timor (best model is in bold)
Model Best Message Length (nits)
A0 727
A1 640*
C 664
A2 653
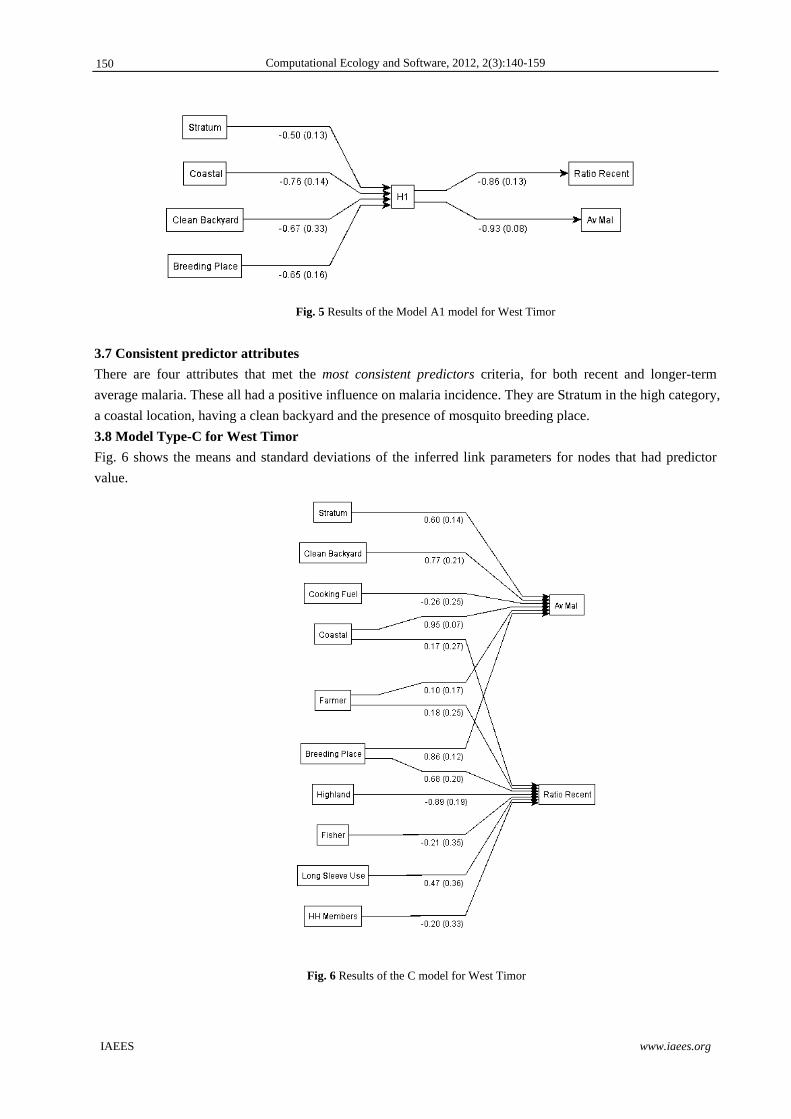
3.6 Model Type-A1 for West Timor
Fig. 5 shows the means and standard deviations of the inferred link parameters for nodes that were valuable
predictors.
149
Page 12
Computational Ecology and Software, 2012, 2(3):140-159
IAEES www.iaees.org
Fig. 5 Results of the Model A1 model for West Timor
3.7 Consistent predictor attributes
There are four attributes that met the most consistent predictors criteria, for both recent and longer-term
average malaria. These all had a positive influence on malaria incidence. They are Stratum in the high category,
a coastal location, having a clean backyard and the presence of mosquito breeding place.
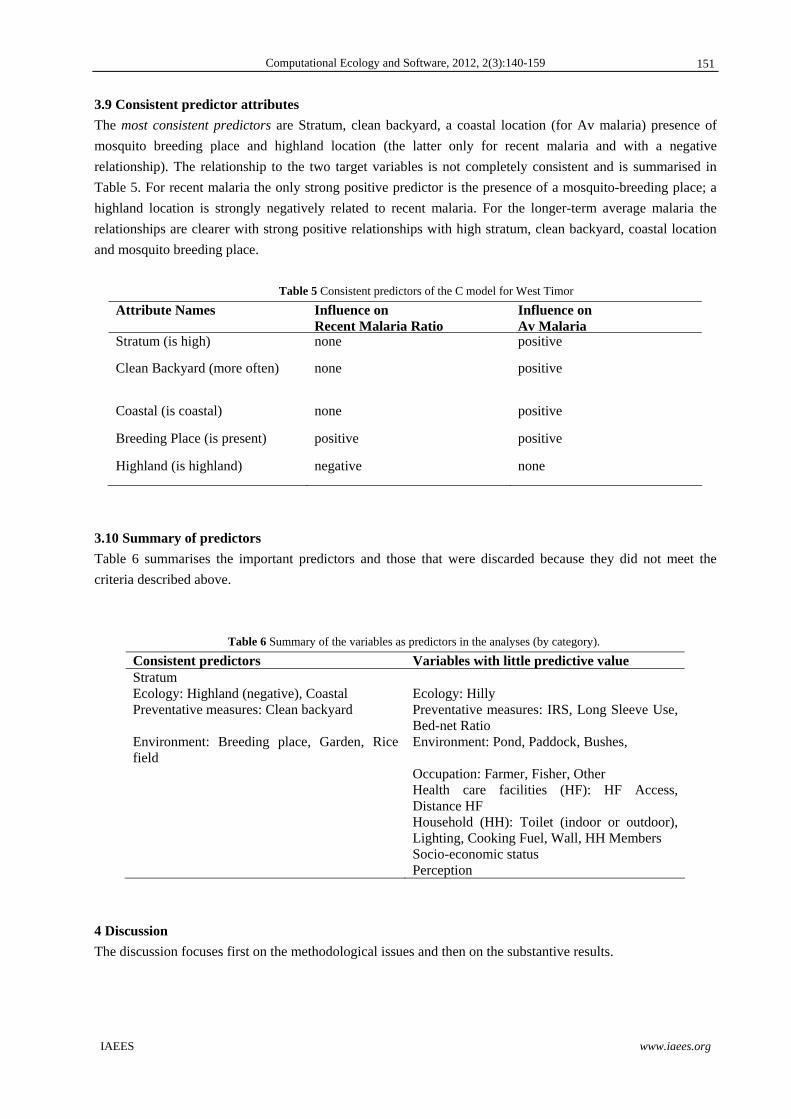
3.8 Model Type-C for West Timor
Fig. 6 shows the means and standard deviations of the inferred link parameters for nodes that had predictor
value.
Fig. 6 Results of the C model for West Timor
150
Page 13
Computational Ecology and Software, 2012, 2(3):140-159
IAEES www.iaees.org
3.9 Consistent predictor attributes
The most consistent predictors are Stratum, clean backyard, a coastal location (for Av malaria) presence of
mosquito breeding place and highland location (the latter only for recent malaria and with a negative
relationship). The relationship to the two target variables is not completely consistent and is summarised in
Table 5. For recent malaria the only strong positive predictor is the presence of a mosquito-breeding place; a
highland location is strongly negatively related to recent malaria. For the longer-term average malaria the
relationships are clearer with strong positive relationships with high stratum, clean backyard, coastal location
and mosquito breeding place.
Table 5 Consistent predictors of the C model for West Timor
Attribute Names Influence on Recent Malaria Ratio
Influence on Av Malaria
Stratum (is high) none positive
Clean Backyard (more often) none positive
Coastal (is coastal) none positive
Breeding Place (is present) positive positive
Highland (is highland) negative none
3.10 Summary of predictors
Table 6 summarises the important predictors and those that were discarded because they did not meet the
criteria described above.
Table 6 Summary of the variables as predictors in the analyses (by category).
Consistent predictors Variables with little predictive value Stratum Ecology: Highland (negative), Coastal Ecology: Hilly Preventative measures: Clean backyard Preventative measures: IRS, Long Sleeve Use,
Bed-net Ratio Environment: Breeding place, Garden, Rice field
Environment: Pond, Paddock, Bushes,
Occupation: Farmer, Fisher, Other Health care facilities (HF): HF Access,
Distance HF Household (HH): Toilet (indoor or outdoor),
Lighting, Cooking Fuel, Wall, HH Members Socio-economic status Perception
4 Discussion
The discussion focuses first on the methodological issues and then on the substantive results.
151
Page 14
Computational Ecology and Software, 2012, 2(3):140-159
IAEES www.iaees.org
4.1 Methodological
4.1.1 Strengths
The data, with the exception of Stratum, was all collected at the same level of resolution (household) and
hence there should be no discrepancies related to disparate scale.
The method has modeled malaria based on a wide range of variables, selected as important based on the
literature, and representing a diverse range of attribute categories. It used a modeling process that identifies the
best and simplest model to account for the data. This results in a relatively few variables being selected as
combined strong predictors and hence relatively simple to interpret.
In practice, MML's quantitative Ockham's razor trade-off between model complexity and goodness of fit
means that MML models tend to be less complicated than rival statistical and machine learning methods - with
MML models tending to involve less explanatory variables and attributing them slightly less influence than
rival methods, yet with MML tending to predict better (Dowe, 2008, sec. 0.2.5, p539, col. 1).
In cases where the amount of data is relatively limited compared to the number of parameters which have
to be estimated (as happens with, e.g., single and especially multiple latent factor analysis, the classical
Neyman-Scott problem and more recent panel data versions of Neyman-Scott), it appears that MML is the
only method known so far which will in general be statistically consistent - i.e., for which the parameter
estimates ultimately become correct as the amount of data increases (Dowe and Wallace, 1997; Wallace 2005,
chap. 4; Dowe, 2008, sec. 0.2.5; Dowe, 2011, secs. 5.2, 6.4 and 6.5).
4.1.2 Weaknesses
The data used may not be completely reliable. The reporting of recent malaria (last three months) is likely to
be more reliable than recollections over a longer period (average malaria). An even shorter period for
recollection (of two months) was used by Dye et al (2010) for their qualitative African study. That the Stratum
is not always a consistent predictor may also indicate that there may be discrepancies between local knowledge
and the official data.
4.2 Substantive results
The results of the predictor attributes were expected; however some of the ones that did not predict well were
surprising. At a general level this would mean that, although they may appear to be important when taken
singly, when included in a complex model the combined effects of others may have greater predictive value.
From a practical perspective dealing with several variables may be a better management option rather than
focussing on one, which may, or may not be reliable (see for example bednets and references to these below).
The following discusses both the expected predictors and the occasionally surprising evictions/omissions.
4.2.1 The expected predictors
Stratum: this was to be expected and, in a sense, acts to validate the data, though does not do so completely.
This may be explained by self-reported data (albeit based on professional diagnosis) with possibly some cases
of memory lapse.
Ecology: Highland (negative). It was not surprising that a highland location had a negative relationship
with malaria: highland areas may not contain wetlands and temperatures may be cool, thus slowing the
incubation and transmission times for the pathogen. However this may change as global temperatures increase.
With climate change anopheline malaria vectors may be able to move to higher elevations and increase
transmission, as has already been observed in east Africa (Pascual et al., 2006). Ndoen et al. (2010) also
showed that some malaria vectors were already common in the highlands in Indonesia (e.g., Anopheles
barbirostris) and thus might contribute to highland malaria increasing as climate changes (and land use also
may play a role).
152
Page 15
Computational Ecology and Software, 2012, 2(3):140-159
IAEES www.iaees.org
A coastal location had a positive relationship with malaria and this is likely because coastal areas include
wetlands and rice fields. This is likely to be related to the significant relationship between malaria vectors and
coastal locations in West Timor (Ndoen et al., 2010).
Preventative measures: Clean backyard. Clean backyard is not usually associated with mosquito risk as
backyard rubbish (i.e., not a clean backyard) can provide refuge for mosquitoes and hence be associated with a
higher incidence of malaria; it may be that maintaining a clean backyard exposes people to mosquito activity,
especially to day-biting mosquitoes, of which there are several species in Central Java and West Timor (Ndoen
et al., 2011). In the present study there are five categories of cleaning the backyard ranging from rarely to daily
and the latter behavior may be putting people at extra risk.
Environment: Breeding place, Garden, Rice field. Rice fields may be associated with temporary water
bodies. In the data set breeding place included a range of wetlands including brackish and fresh water wetlands.
In the case of garden (cultivated for food crops) and rice fields it is likely that some form of irrigation would
be used, creating ideal mosquito larval conditions with humans working in these environments providing a
local blood meal (Van den Berg and Knols, 2006; Afrane et al.,, 2004). Increased malaria may also be related
to sleeping outdoors as reported by (Mueller et al., 2006) for their research in Papua New Guinea.
4.2.2 Unexpected non-predictors /surprise evictions from the models
Ecology: A hilly topography may not have many wetland areas suitable for anopheline mosquito habitats.
However (Ndoen et al., 2010; Ndoen, 2008) found that hilly areas, if they also had rice fields, were associated
with increased malaria and this was related to the mosquito species associated with that topography and land
use. Here we found an association with rice fields, but only as part of the model (see above).
Occupation: Farming and fishing have been associated with increased risk of malaria in the larger study
(Ndoen, 2008) and in other studies with increased risk of malaria related to both occupations (Barcus et al.,
2002; Nalim et al., 2002; Worrall et al., 2003). However when included in a whole model as we have done
here the effect does not appear to be important. The association between fishing and malaria incidence is
variable, depending on the type of fishing. For example fish farms, if properly maintained, would not usually
support mosquito production but, if abandoned, then mosquito problems and malaria have been shown to
increase (Howard et al., 2007).
Preventative measures: these included Indoor Residual Spraying, wearing Long Sleeves and having Bed-
nets. In the models developed here bed nets, often cited as effective prevention tools, were never selected as
good predictors. Bednets (and IRS) can reduce the incidence of malaria (Clarke et al.,, 2001; Mnzava et al.,,
2001; Alten et al., 2003; Dye et al., 2010) but this is not always the case (Al-Taiar et al., 2008). Another factor
that may explain the lack of relationship in our models may be related to the distribution or usage practices:
distribution after an epidemic and misuse for fishing or other activities (Ndoen, 2008).
Indoor Residual Spraying (IRS) was never selected as a consistent predictor but is often cited as an
effective control measure (for example: Singh et al., 2006). In Indonesia research in a hilly area of Central Java
at District level showed an increase in malaria incidence as IRS was reduced between 1986 and 1995 (Barcus
et al., 2002). To ensure effective indoor residual spraying against malaria vectors, knowledge of factors such as
mosquitoes’ resting places is essential (Takken et al.,, 1990; Pates et al., 2002; Warrell and Gilles, 2002). It is
only effective against mosquitoes seeking hosts indoors and mostly at night. In the study areas there was no
clear pattern of mosquitoes preferring indoors and night biting, though for example An. barbirostris in West
Timor showed some preference for indoors, but not in Central Java (Ndoen et al., 2011). Mosquitoes were
generally more active outdoors and IRS would not be recommended, at least as a priority action or if resources
are scarce (Ndoen et al., 2010). Another study in Central Java also reported no relationship between IRS and
153
Page 16
Computational Ecology and Software, 2012, 2(3):140-159
IAEES www.iaees.org
malaria incidence (Dale et al., 2005). There appears to be a large variability and hence IRS may not be a
generally reliable predictor for all areas.
Health care facilities (HF): HF Access, Distance HF. Noor et al., (2003) showed that distance was an
important factor important in accessing health services for malaria in Kenya. However Ndoen (2008) showed
that living within 1 km of a health care facility was associated with increased malaria incidence. This may be
related to ease of diagnosis and subsequent reporting. The average distance to health care facilities from
villages in the Central Java and West Timor village study were 5.74 and 7.17 km respectively (Ndoen, 2008).
On the other hand there is some evidence in Indonesia that, as distance to health care facilities increases, so
does malaria incidence (Sipe et al., 2005, unpublished data). This is consistent with the findings of Al-Taiar et
al., (2008) who found increased incidence of severe malaria if distance to a health centre was > 2 km. Both
these points may account for the apparent lack of a clear relationship with reported malaria incidence. In other
research access to health care has been shown to be important. For example Unger et al., (2006) showed that
health service access resulted in increased malaria cure rates in Mali. Bell et al., (2005), in their Philippines
study, found that malaria parasite prevalence was significantly higher in villages without a resident village
health worker.
Environment: Pond, Paddock, Bushes. In theory these all provide resources for mosquitoes: the pond
provides larval habitats, paddocks may provide access to a blood meal (for zoophilic mosquitoes) and bushes
provide shelter for adult mosquitoes during the day, reducing the risk of dehydration and increasing survival
(mosquitoes need to survive at least 8 days for incubation of the pathogen (Bruce-Chwatt, 1980)). Paddock has
been shown to be especially important. It tends to include association with animals in barns etc. and some
mosquito species feed preferentially on animals (are zoophillic). Barodji et al., (1992) showed that, in Central
Java, moving cattle shelters from inside to the outside of the house, significantly reduced the number of An.
aconitus (a malaria vector) indoors. In China, animals are commonly kept at the boundaries of the villages
between mosquito breeding habitats and human dwellings, reducing the human-mosquito contact (Warrell and
Gilles, 2002). In Ethiopia, Seyoum et al., (2002) reported that separating animal sheds from human dwellings
reduced the human-mosquito contact. Van der Hoek et al., (1998) also noted that cattle near housing was related
to increased malaria incidence. What the modelling in our study has shown is that these environment variables,
although they individually may be important, when taken as a whole, other combinations of variables have
more predictive power.
Household (HH): Toilet (indoor or outdoor), Lighting, Cooking Fuel, Wall, HH Members. There is some
evidence that house characteristics are important for malaria incidence, but they are also related to SES (see
below). Thus Ghebreyesus et al., (2000), in their study in Ethiopia, found risk factors associated with malaria
including earth roof, windows, open eaves, no separate kitchen, having one sleeping room all of which would
facilitate entry and dispersal of mosquitoes. These variables were not important in our analyses, though they do
also reflect SES and the lack of importance here may reflect the discussion in the previous paragraph.
Household size was found to be important in an Indonesian study with lower malaria incidence in smaller
households (Roosihermiatie et al., 2000) but this was not the case here.
Socio-economic status. In our study SES was not identified as a predictor by the models. However there
is a relationship between housing standard, socioeconomic status and malaria. Generally lower SES and poorer
quality housing are related to higher incidences of malaria. For example, in Sri Lanka, poorly constructed
houses, and other factors have been shown to increase malaria incidence (Van der Hoek et al., 1998). Similarly in
The Gambia, Koram et al., (1995) found that malaria among children was associated with poor housing and low
socio-economic status. The general view is that SES is important, with lower SES people being less able to
access resources and information that would reduce malaria incidence (e.g., Macintyre et al., 2002). Keating et
154
Page 17
Computational Ecology and Software, 2012, 2(3):140-159
IAEES www.iaees.org
al., (2005) in a survey in Kenya with self-reported malaria (as we have here), reported that high SES was
associated with malaria prevention (mosquito control) and reduced incidence of malaria. A useful review by
Worrall et al., (2003) reported that, at an international level, poorer areas experience higher rates of malaria
than richer ones, but that this did not necessarily reflect relationships at local levels.
Perception: Dye et al., (2010) found, for their African study, that perceptions of malaria were generally
correct, as did Sanjana et al., (2006) for Central Java and also Ndoen (2008) who found in his broader
Indonesian study that it did not, as in our analyses, influence malaria incidence. This is consistent with other
research in the area (Dale et al., 2005). However some research has found that better knowledge appears to
lead to more informed protection measures and lower malaria incidence (e.g., Nkuo Akenji et al., 2005).
5 Conclusion
The modelling method has produced simple and relatively easy to interpret results that focus on combinations
of variables that contribute to explain malaria incidence. In the results we have unpacked these in order to
consider each, but it is important to remember that they work in consort. Despite possible inaccuracy in the
data from household survey, the research indicates that, there are consistent explanatory combinations of
variables. Although some variables have been shown to affect malaria incidence in individual research projects
as reported in the literature, they may not be consistently reliable. This would include the use of bed nets and
indoor residual spraying, especially in areas where malaria vector mosquitoes bite during the day and outdoors.
Caution should of course be exercised, as areas with malaria will have their own unique features, requiring
management solutions tailored to the circumstances, including resources. If we took the consistent predictors
from this research we would advocate personal care (repellents, covering clothing) when outdoors and
managing mosquito larval habitats by introducing predators to wetlands (breeding place) and possibly using
larvicides (if resources permit) in rice fields.
Acknowledgements
This research was supported by an Australian Research Council Discovery Grant (DP 0558908. In-kind
support was provided by Griffith University and Monash University.
References
Afrane YA, Klinkenberg E, Drechsel P, et al. 2004. Does irrigated urban agriculture influence the transmission
of malaria in the city of Kumasi, Ghana? Acta Tropica, 89(2): 125-134
Al-Taiar A, Jaffar S, Assabri A, et al. 2008. Who develops severe malaria? Impact of access to healthcare,
socio-economic and environmental factors on children in Yemen: a case-control study. Tropical Medicine
and International Health, 13(6): 762-770
Alten B, Caglar SS, Simsek FM, et al. 2003. Effect of insecticide-treated bednets for malaria control in
Southeast Anatolia-Turkey. Journal of Vector Ecology, 28(1): 97-107
Anthony RL, Bangs MJ, Hamzah N, et al. 1992. Heightened Transmission of stable malaria in an isolated
population in the highlands of Irian-Jaya, Indonesia. American Journal of Tropical Medicine and Hygiene,
47(3): 346-356
Baird JK, Sismadi P, Masbar S et al. 1996. A focus of endemic malaria in central Java. American Journal of
Tropical Medicine and Hygiene, 54(1): 98-104
155
Page 18
Computational Ecology and Software, 2012, 2(3):140-159
IAEES www.iaees.org
Ballestores Jr F, Qiu Z. 2012. An integrated parcel-based land use change model using cellular automata and
decision tree. Proceedings of the International Academy of Ecology and Environmental Sciences, 2(2): 53-
69
Barcus MJ, Laihad F, Sururi M, et al. 2002. Epidemic malaria in the Menoreh Hills of Central Java. American
Journal of Tropical Medicine and Hygiene, 66(3): 287-292
Barodji A, Boewono DT, Suwasono H. 1992. Fauna Anopheles di Daerah Endemis Malaria Kabupaten Jepara
Jawa Tengah. Buletin Penelitian Kesehatan, XX (3)
Bell D, Go R, Miguel C, Parks W, et al. 2005. Unequal treatment access and malaria risk in a community-
based intervention program in the Philippines. Southeast Asian Journal of Tropical Medicine and Public
Health, 36(3): 578-586
Boulton D, Wallace CS. 1973. An information measure for hierarchic classification. Computer Journal, 16:
254-261
Bruce-Chwatt LJ. 1980. Essential Malariology. William Heinnemann Medical Books Ltd, London, UK
Clarke SE, Bogh C, Brown RC, et al. 2001. Do untreated bednets protect against malaria? Transactions of the
Royal Society for Tropical Medicine and Hygiene, 95(5): 457-462
Comley J, Dowe DL. 2003. General Bayesian Networks and Assymetric Languages. 2nd Hawaii International
Conference on Statistics and Related Fields, 5-8 June 2003, Hawaii, USA
Comley J, Dowe DL. 2005. Minimum message length and generalized Bayesian networks with asymmetric
languages. In: Advances in Minimum Description Length: Theory and Applications (Grunwald P, Myung IJ,
MA Pitt, eds). 265-294, M.I.T. Press, Massachusetts, USA
Dale MB, Dale PER. 2004. Sources of uncertainty in ecological modelling: predicting vegetation types from
environmental attributes. Community Ecology, 5(2): 203-235
Dale P, Sipe N, Anto S, et al. 2005 Malaria in Indonesia: a synthesis of recent research into its environmental
relationships. Southeast Asian Journal of Tropical Medicine and Public Health, 36(1): 1-13
De Vries P, Martens P. 2000. A CAMERA focus on local eco-epidemiological malaria risk assessment. ICIS
Working Paper I00-E001. International Centre for Integrative Studies, Netherlands
Dowe DL. 2008. Foreword re C. S. Wallace Computer Journal (Christopher Stewart Wallace (1933-2004)
memorial special issue), 51(5): 523-560
Dowe DL. 2011. MML, hybrid Bayesian network graphical models, statistical consistency, invariance and
uniqueness. In: Handbook of the Philosophy of Science (Bandyopadhyay PS, Forster MR, eds) (HPS
Vol 7). 901-982, Philosophy of Statistics. Elsevier, North Holland, Netherlands
Dowe DL, Wallace CS. 1997. Resolving the Neyman-Scott problem by Minimum Message Length. Computer
Science and Statistics, 28: 614-618
Dowe DL, Wallace CS. 1998. Kolmogorov complexity, minimum message length and inverse learning.
14th Australian Statistical Conference. 6-10 July 1998, Broadbeach, Gold Coast, Queensland, Australia
Dowe DL, Gardner S, Oppy G. 2007. Bayes not bust! Why simplicity is no problem for Bayesians. The British
Journal for the Philosophy of Science, 58 (4):709-754
Dye T, Apondi R, Lugada ES, et al. 2010. “Before we used to get sick all the time”: perceptions of malaria and
use of long-lasting insecticide-treated bed nets (LLINs) in a rural Kenyan community. Malaria Journal,
9: 345
Ghebreyesus TA, Haile M, Witten KH, et al. 2000. Household risk factors for malaria among children in the
Ethiopian highlands. Transactions of the Royal Society for Tropical Medicine and Hygiene, 94 (1):17-21
Gosoniu L, Veta AM, Vounatsou P. 2010. Bayesian geostatistical modeling of malaria indicator survey data in
Angola. Plos ONE, 5(3):-e9322
156
Page 19
Computational Ecology and Software, 2012, 2(3):140-159
IAEES www.iaees.org
Gu WD, Killeen GF, Mbogo CM, et al. 2003. An individual-based model of Plasmodium falciparum malaria
transmission on the coast of Kenya. Transactions of the Royal Society for Tropical Medicine and Hygiene,
97(1): 43-50
Howard AFV, Zhou G, Omlin FX. 2007. Malaria mosquito control using edible fish in western Kenya:
preliminary findings of a controlled study. BMC Public Health, 7: 199
Ishikawa H, Ishii A, Nagai N, et al. 2003. A mathematical model for the transmission of Plasmodium vivax
malaria. Parasitology International, 52(1): 81-93
Jones DW, O’Neill RV. 1993. A model of neotropical land-use with endogenous malaria and preventive
ecological measures. Environmentan Planning A, 25(11): 1677-1687
Kazembe LN. 2007.Spatial modeling and risk factors of malaria incidence in northern Malawi. Acta Tropica,
102(2): 126-137
Keating J, Macintyre K, Mbogo CM, et al. 2005. Self-reported malaria and mosquito avoidance in relation to
household risk factors in a Kenyan coastal city. Journal of Biosocial Science, 37(6): 761-771
Koram KA, Bennett S, Adiamah JH, et al. 1995. Socio-economic risk factors for malaria in a peri-urban area
of The Gambia. Transactions of the Royal Society for Tropical Medicine and Hygiene, 89(2): 146-150
Macintyre K, Keating J, Sosler S, et al. 2002. Examining the determinants of mosquito-avoidance practices in
two Kenyan cities. Malaria Journal, 1:14
McKenzie FE. 2000. Why model malaria? Parasitology Today, 16(12): 511-516
Mnzava AE, Sharp BL, Mthembu DJ, et al. 2001. Malaria control--two years' use of insecticide-treated bednets
compared with insecticide house spraying in KwaZulu-Natal. South African Medical Journal, 91(11): 978-
983
Nalim S, Bogh C, Hartono S, et al. 2002. Rapid Assessment of Correlation Between Remotely Sensed Data
and Malaria Prevalence in the Manoreh Hills Area of Central Java, Indonesia - Final report. WHO, Geneva,
Switzerland
Ndoen E. 2008. Environmental Factors and An Eco-epidemiological Model of Malaria in Indonesia. PhD
thesis, Griffith University, Brisbane, Australia
Ndoen E, Wild C, Dale P, et al. 2010. Relationships between anopheline mosquitoes and topography in West
Timor and Java, Indonesia. Malaria Journal, 9: 242
Ndoen E, Wild C, Dale P, et al. 2011. Dusk to dawn activity patterns of anopheline mosquitoes in West Timor
and Java, Indonesia. Southeast Asian Journal of Tropical Medicine and Public Health, 42(3): 550-561
Needham S, Dowe DL. 2001. Message length as an effective Ockham's razor in decisin tree induction. Proc
8th International Workshop on Artificial Intelligence and Statiostics. 253-260, Key West, Florida, USA
Ngwa GA, Shu WS. 2000. A mathematical model for endemic malaria with variable human and mosquito
populations. Mathematical and Computer Modelling, 32(7-8): 747-763
Nkuo Akenji TK, Ntonifor NN, Ching JK, et al. 2005. Evaluating a malaria intervention strategy using
knowledge, practices and coverage surveys in rural Bolifamba, southwest Cameroon. Transactions of the
Royal Society for Tropical Medicine and Hygiene, 99(5): 325-332.
Nkurunziza H, Gebhardt A, Pilz J. 2010. Bayesian modeling of the effect of climate on malaria in Burundi.
Malaria Journal, 9: 114
Noor AM, Zurovac D, Hay SI, et al. 2003. Defining equity in physical access to clinical services using
geographical information systems as part of malaria planning and monitoring in Kenya. Tropical Medicine
and International Health, 8(10): 917-926
Pascual M, Ahumada JA, Chaves LF, et al. 2006. Malaria resurgence in the East African Highlands:
temperature trends revisited. Proceedings of the National Academy of Science of USA, 103: 5829-5834
157
Page 20
Computational Ecology and Software, 2012, 2(3):140-159
IAEES www.iaees.org
Pates HV, Line JD, Keto AJ, et al. 2002. Personal protection against mosquitoes in Dar es Salaam, Tanzania,
by using a kerosene oil lamp to vaporize transfluthrin. Medical and Veterinary Entomology, 16(3): 277-284
Radhika D, Ramathilaga A, Sathesh Prabu C, et al. 2011. Evaluation of larvicidal activity of soil microbial
isolates (Bacillus and Acinetobactor Sp.) against Aedes aegypti (Diptera: Culicidae) - the vector of
Chikungunya and Dengue. Proceedings of the International Academy of Ecology and Environmental
Sciences, 1(3-4): 169-178
Ramathilaga A, Murugesan AG, Sathesh Prabu C. 2012. Biolarvicidal activity of Peanibacillus macerans and
Bacillus subtilis isolated from the dead larvae against Aedes aegypti - Vector for Chikungunya. Proceedings
of the International Academy of Ecology and Environmental Sciences, 2(2): 90-95
Riedel N, Vounatsou P, Miller JM, et al. 2010. Geographical patterns and predictors of malaria risk in Zambia:
Bayesian geostatistical modeling of the 2006 Zambia national malaria indicator survey (ZMIS). Malaria
Journal, 9: 37
Roosihermiatie B, Nishiyama M, Nakae K. 2000. The human behavioral and socioeconomic determinants of
malaria in Bacan Island, North Maluku, Indonesia. Journal of Epidemiology, 10(4): 280-289
Sanjana P, Barcus MJ, Bangs MJ, et al. 2006. Survey of community knowledge, attitudes, and practices during
a malaria epidemic in Central Java, Indonesia. American Journal of Tropical Medicine and Hygiene, 75(5):
783-789
SEARO Malaria situation in SEARO countries: Indonesia. 2010.
http://www.searo.who.int/en/Section10/Section21/Section340_4022.htm
Seyoum A, Balcha F, Balkew M, et al. 2002. Impact of cattle keeping on human biting rate of anopheline
mosquitoes and malaria transmission around Ziway, Ethiopia. East African Medical Journal, 79(9): 485-490
Singh N, Shukla MM, Mishra AK, et al. 2006. Malaria control using indoor residual spraying and larvivorous
fish: a case study in Betul, central India. Tropical Medicine and International Health, 11(10): 1512-1520
Smith DL, Boni M, Klein E, et al. 2007. A two-stage model of malaria transmission and its impact on the
spread of resistance. American Journal of Tropical Medicine and Hygiene, 77(5): 153-153
Smith DL, Ruktanonchai N. 2010 Progress in modeling malaria transmission. Modelling Parasite Transmission
and Control, 673: 1-12
Syafruddin D, Asih PBS, Coutrier FN, et al. 2006. Malaria in Wanokaka and Loli sub-districts, West Sumba
District, East Nusa Tenggara Province, Indonesia. American Journal of Tropical Medicine and Hygiene, 74
(5):733-737
Syafruddin D, Asih PBS, Wahid I, et al. 2007. Malaria prevalence in Nias District, North Sumatra Province,
Indonesia. Malaria Journal, 6 (DOI 10.1186/1475-2875-6-116)
Takken W, Snellen WB, Verhave JP, et al. 1990. Environmental measures for malaria control in Indonesia. A
historical review on species sanitation. Wageningen, Netherlands: Wageningen Agricultural University,
Wageningen, Netherlands
Tan PJ, Dowe DL. 2004. MML inference of oblique decision trees. Lecture Notes in Artificial Intelligence,
3339: 1082-1088
Tomerini DM, Dale PE, Sipe N. 2011. Does mosquito control have an effect on mosquito-borne disease? The
case of Ross River virus disease and mosquito management in Queensland, Australia. Journal of the
American Mosquito Control Association, 27(1): 39-44
Tumwiine J, Mugisha JYT, Luboobi LS. 2007. A mathematical model for the dynamics of malaria in a human
host and mosquito vector with temporary immunity. Applied Mathematics and Computation, 189(2): 1953-
1965
Unger JP, d'Alessandro U, De Paepe P, et al. 2006. Can malaria be controlled where basic health services
158
Page 21
Computational Ecology and Software, 2012, 2(3):140-159
IAEES www.iaees.org
are not used? Tropical Medicine and International Health, 11(3): 314-322
Van den Berg H, Knols BG. 2006. The Farmer Field School: a method for enhancing the role of rural
communities in malaria control ? Malaria Journal, 5: 3
Van der Hoek W, Konradsen F, Dijkstra DS, et al. 1998. Risk factors for malaria: a microepidemiological
study in a village in Sri Lanka. Transactions of the Royal Society for Tropical Medicine and Hygiene, 92:
265-269
Vargas-De-Leon C. 2012. Global analysis of a delayed vector-bias model for malaria transmission with
incubation period in mosquitoes. Mathematical Biosciences and Engineering, 9(1): 165-174
Wallace CS. 2005. Statistical and Inductive Inference by Minimum Message Length. Information Science and
Statistics. Springer
Wallace CS, Boulton D. 1968. An information measure for classification. Computer Journal, 11: 185-194
Wallace CS, Dowe DL. 1999. Minimum Message Length and Kolmogorov complexity. Computer Journal,
42(4): 270-283
Warrell DA, Gilles HM. 2002. Essential Malariology (4th ed). Arnold, London, UK
WHO Malaria Fact sheet N°94. 2009. http://www.who.int/mediacentre/factsheets/fs094/en/print.html
WHO Malaria report. 2011. http://www.who.int/malaria/world_malaria_report_2011/en/
Worrall E, Basu S, Hanson K. 2003. The relationship between socio-economic status and malaria: A review of
the literature. Ensuring that Malaria Control Interventions Reach the Poor. London School of Hygiene and
Tropical Medicine, London, UK
159