*For correspondence: [email protected]Competing interest: See page 14 Funding: See page 15 Received: 09 June 2016 Accepted: 23 August 2016 Reviewing editor: Marianne E Bronner, California Institute of Technology, United States Copyright McConnell et al. This article is distributed under the terms of the Creative Commons Attribution License, which permits unrestricted use and redistribution provided that the original author and source are credited. A novel optical microscope for imaging large embryos and tissue volumes with sub-cellular resolution throughout Gail McConnell 1 *, Johanna Tra ¨ ga ˚ rdh 1 , Rumelo Amor 1 , John Dempster 1 , Es Reid 1 , William Bradshaw Amos 1,2 1 Centre for Biophotonics, Strathclyde Institute for Pharmacy and Biomedical Sciences, University of Strathclyde, Glasgow, United Kingdom; 2 MRC Laboratory of Molecular Biology, Cambridge, United Kingdom Abstract Current optical microscope objectives of low magnification have low numerical aperture and therefore have too little depth resolution and discrimination to perform well in confocal and nonlinear microscopy. This is a serious limitation in important areas, including the phenotypic screening of human genes in transgenic mice by study of embryos undergoing advanced organogenesis. We have built an optical lens system for 3D imaging of objects up to 6 mm wide and 3 mm thick with depth resolution of only a few microns instead of the tens of microns currently attained, allowing sub-cellular detail to be resolved throughout the volume. We present this lens, called the Mesolens, with performance data and images from biological specimens including confocal images of whole fixed and intact fluorescently-stained 12.5-day old mouse embryos. DOI: 10.7554/eLife.18659.001 Introduction During experiments with laser scanning confocal microscopes in the mid-1980s, it became obvious that the optical sectioning, which is the main advantage of the confocal method, did not work with the available low-magnification objectives, because of their low numerical aperture (N.A.) (White et al., 1987). In specimens such as mouse embryos at the 10–12.5 day stage, when the major organs are developing (Kaufman, 1992), it was impossible to see individual cells in the interior despite the lateral (XY) resolution being sufficient. Since then, stitching and tiling of large datasets has proved to be possible using computer-controlled specimen stages, but this results in a checker board pattern in the final image due to inhomogeneity of illumination and focus height errors which often cannot be corrected by software. Commercial and open source software algorithms are avail- able to perform stitching and tiling but inhomogeneities and problems with dataset registration are clearly visible (Legesse et al., 2015). Because of the continuous scanning laser spot that we use with the Mesolens, we do not observe differences in fluorescence signal from one region of the image to another unless it is present in the specimen. More recently, methods to expand the tissue volume using synthetic polymers have been demon- strated, increasing the size of the sub-micron sized structures until they can be imaged by an ordi- nary low-magnification, low-resolution lens, but this inevitably results in some tissue distortion (Chen et al., 2015). We decided that what was needed was a 4x magnification lens with an N.A. of approximately 0.5, rather than the 0.1 or 0.2 currently available, to support imaging with sub-cellular resolution through the entire specimen. Off-the-shelf lenses with the right characteristics, for exam- ple camera lenses, which could be adapted for microscopy by placing the specimen in the plane intended for the camera sensor and forming a x4 image in what would normally be the object space, McConnell et al. eLife 2016;5:e18659. DOI: 10.7554/eLife.18659 1 of 15 RESEARCH ARTICLE
A novel optical microscope for imaginglarge embryos and tissue volumes withsub-cellular resolution throughoutGail McConnell1*, Johanna Tragardh1, Rumelo Amor1, John Dempster1, Es Reid1,William Bradshaw Amos1,2
1Centre for Biophotonics, Strathclyde Institute for Pharmacy and BiomedicalSciences, University of Strathclyde, Glasgow, United Kingdom; 2MRC Laboratory ofMolecular Biology, Cambridge, United Kingdom
Abstract Current optical microscope objectives of low magnification have low numerical
aperture and therefore have too little depth resolution and discrimination to perform well in
confocal and nonlinear microscopy. This is a serious limitation in important areas, including the
phenotypic screening of human genes in transgenic mice by study of embryos undergoing
advanced organogenesis. We have built an optical lens system for 3D imaging of objects up to 6
mm wide and 3 mm thick with depth resolution of only a few microns instead of the tens of microns
currently attained, allowing sub-cellular detail to be resolved throughout the volume. We present
this lens, called the Mesolens, with performance data and images from biological specimens
including confocal images of whole fixed and intact fluorescently-stained 12.5-day old mouse
embryos.
DOI: 10.7554/eLife.18659.001
IntroductionDuring experiments with laser scanning confocal microscopes in the mid-1980s, it became obvious
that the optical sectioning, which is the main advantage of the confocal method, did not work with
the available low-magnification objectives, because of their low numerical aperture (N.A.)
(White et al., 1987). In specimens such as mouse embryos at the 10–12.5 day stage, when the major
organs are developing (Kaufman, 1992), it was impossible to see individual cells in the interior
despite the lateral (XY) resolution being sufficient. Since then, stitching and tiling of large datasets
has proved to be possible using computer-controlled specimen stages, but this results in a checker
board pattern in the final image due to inhomogeneity of illumination and focus height errors which
often cannot be corrected by software. Commercial and open source software algorithms are avail-
able to perform stitching and tiling but inhomogeneities and problems with dataset registration are
clearly visible (Legesse et al., 2015). Because of the continuous scanning laser spot that we use with
the Mesolens, we do not observe differences in fluorescence signal from one region of the image to
another unless it is present in the specimen.
More recently, methods to expand the tissue volume using synthetic polymers have been demon-
strated, increasing the size of the sub-micron sized structures until they can be imaged by an ordi-
nary low-magnification, low-resolution lens, but this inevitably results in some tissue distortion
(Chen et al., 2015). We decided that what was needed was a 4x magnification lens with an N.A. of
approximately 0.5, rather than the 0.1 or 0.2 currently available, to support imaging with sub-cellular
resolution through the entire specimen. Off-the-shelf lenses with the right characteristics, for exam-
ple camera lenses, which could be adapted for microscopy by placing the specimen in the plane
intended for the camera sensor and forming a x4 image in what would normally be the object space,
McConnell et al. eLife 2016;5:e18659. DOI: 10.7554/eLife.18659 1 of 15
field imaging using the Mesolens. Tsai et al. have performed large FOV two-photon microscopy
using a commercial low-magnification objective lens (XL Fluor 4X/340, N.A.=0.28, Olympus), but
they observe modest depth penetration and low axial resolution of 16 mm, as expected from the N.
A. of the objective (Tsai et al., 2015). Furthermore, for objectives designed for multi-photon imag-
ing, the performance (primarily colour correction) at visible wavelengths is poor or unpublished.
Serial two-photon tomography can provide very high lateral resolution images of the fluorescent
mouse brain (Oh et al., 2014). However, this imaging method requires the tissue to be destroyed
because of the microtome sectioning needed and this makes repeat imaging impossible. More
importantly, stitching and tiling of multiple datasets is required because of the large diameter of the
tissue, and this can result in poor image registration and differences in fluorescence signal from one
dataset to another. We finally note that some commercial microscopes are described as capable of
imaging the same specimen from the macro-scale to the micro-scale (e.g. AZ100 Multizoom, Nikon)
but at the low magnifications that permit imaging of large specimens, the N.A. of these microscopes
is low, and thus the performance is as for a low N.A. objective. In this paper we present a cure for
this problem. We describe a multi-immersion objective lens for wide-field epi-fluorescence and laser
scanning confocal microscopy with a working distance of over 3 mm and a 6 mm FOV that is cor-
rected for a wide range of wavelengths and demonstrate its advantages with large biological
specimens.
ResultsThe lens was developed from first principles with the aid of optical design software (Zemax), and
optimizing for an imaging FOV of 6 mm and an N.A. as close as possible to 0.5. The FOV was cho-
sen to match the diameter of a 12.5 day old mouse embryo specimen, and the value of N.A. was
chosen based on the well-known equations (Pawley, 2006)
rlat ¼0:61l
N:A:
(1)
and
zmin ¼2nl
N:Að Þ2:(2)
where rlat is the radius of the first dark ring around the central disk of the Airy diffraction image, zminis the distance of the centre of the three-dimensional diffraction pattern to the first axial minimum, n
is refractive index and l is wavelength. Since the depth of field (z resolution) is inversely proportional
to the square of the numerical aperture, it rapidly becomes poor for low N.A. lenses. Below N.A.
=0.45 the lateral resolution remains tolerable but the axial resolution is no longer sufficient for
resolving sub-cellular details (Figure 1—figure supplement 1). Another important design parameter
was the large working distance, to enable focusing through the embryo which, at 10 days old, is
around 3 mm thick. This dictated that the lens elements should be physically large, to accommodate
the wide collection angles for light originating at a large distance from the lens.
Because embryos may be examined in a variety of optically dissimilar fluids such as water, glyc-
erol, oil and benzyl benzoate (such as for the clearing liquid BABB), it was necessary to make the
lens suitable for use with different immersion fluids and mounting media. The Mesolens was
designed for immersion into non-corrosive immersion media such as oil (Type DF), water and glyc-
erol. We use BABB only as a mounting medium, and the specimen and BABB are separated from
the immersion fluid by a type 1.5 coverslip. This meant providing means to shift lens element groups
during use so that adequate correction for spherical and other aberrations could be obtained for the
different liquids. In practice, the necessary shift was controlled by two knurled rings on the lens bar-
rel, similarly to a standard microscope objective that corrects for the coverslip thickness or immer-
sion fluid. In addition, a further interchangeable flat compensator plate was incorporated into the
design to compensate for spherical aberrations introduced by the different immersion fluids, with a
thickness specific to the immersion medium used. The main challenge in our lens design was to
achieve the colour correction between 400 nm and 700 nm (see Figure 1—figure supplement 2).
Also, the diverse glass types required all had to be tested for auto-fluorescence, and the precise
McConnell et al. eLife 2016;5:e18659. DOI: 10.7554/eLife.18659 3 of 15
Research article Neuroscience Developmental Biology and Stem Cells
refractive index of each selected sample had to be ascertained and the lens design adjusted to
accommodate the small variations from one melt to another of nominally the same glass.
The Mesolens is shown in schematic form in Figure 1. In total the Mesolens comprises of 15 opti-
cal elements of up to 63 mm in diameter when used in laser scanning confocal mode. This increases
to 17 elements for wide-field epi-fluorescence mode, where a (removable) chromatic reflector with a
30 degree angle of incidence with a custom mercury-line coating designed specifically for this angle
of incidence (Chroma Technology Corp.) was incorporated into the optical train to introduce the
incoherent light source, as shown in the insert to Figure 1. A tilted compensating plate, similar to
the chromatic reflector but anti-reflection coated only, was added to eliminate astigmatism intro-
duced by the chromatic reflector (Chroma Technology Corp.). The lens design required manufacture
and mounting of the optical elements to fine tolerances, e.g. centration to better than 3 mm. This
was performed by IC Optical Systems Ltd.
Figure 1. Schematic diagram of the laser scanning confocal Mesolens system. BE=beam expander, ND= neutral density filter. Only one detection
channel is shown here for ease of presentation. Inset: Illustration of the optical train of the Mesolens and scan lens. Also shown is the position of the
compensator plates and camera when the Mesolens is used for wide-field epi-fluorescence imaging.
DOI: 10.7554/eLife.18659.003
The following figure supplements are available for figure 1:
Figure supplement 1. Lateral and axial resolution of a dry lens as a function of N.A.
DOI: 10.7554/eLife.18659.004
Figure supplement 2. Illustration of the excellent chromatic correction of the Mesolens.
DOI: 10.7554/eLife.18659.005
McConnell et al. eLife 2016;5:e18659. DOI: 10.7554/eLife.18659 4 of 15
Research article Neuroscience Developmental Biology and Stem Cells
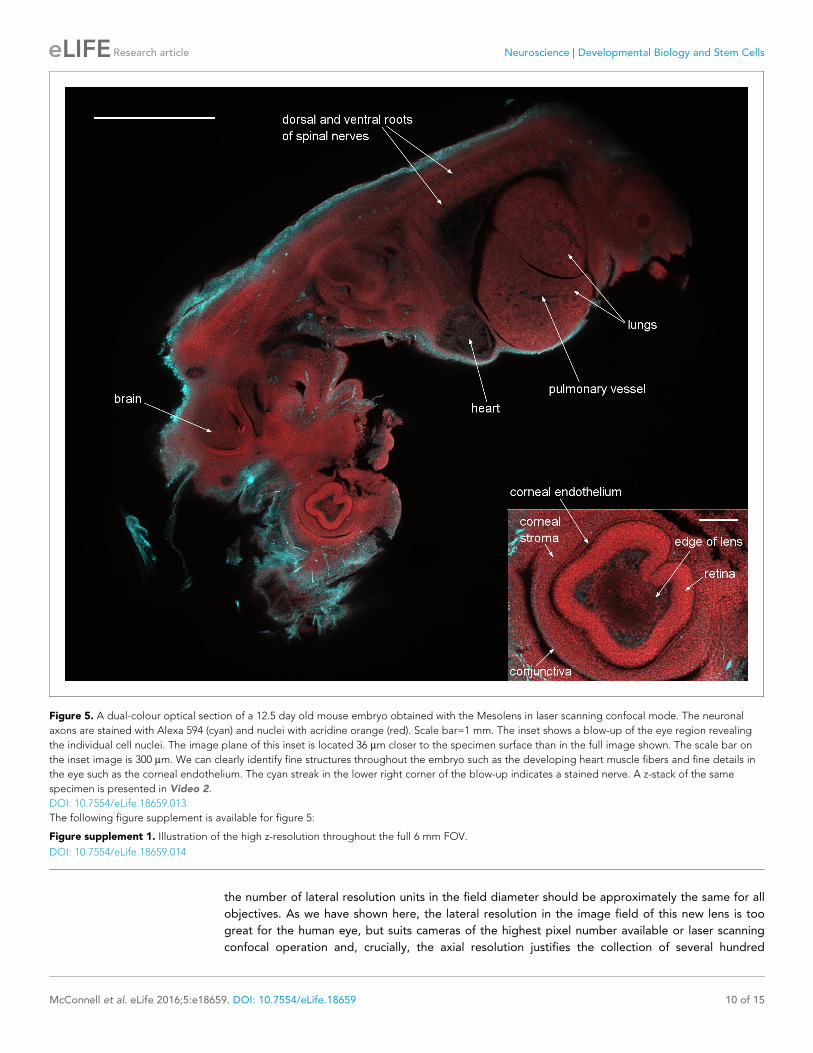
developing heart muscle fibers and fine details in the eye such as the corneal endothelium. The inset
shows a blow-up of the eye region revealing the individual cell nuclei. We emphasize that this image
is only a software zoom from the full scan range of the confocal Mesolens system, not a smaller
scanned region. In the eye, the lens was visible as a slightly absorbing structure with a sharply
defined outline, surrounded in turn by cells within the aqueous humour and then the strongly-stained
retina. All these structures were enclosed in the corneal stroma, lined on the inside with the corneal
endothelium and on the outside with the epithelial precursor of the conjunctiva.
To demonstrate that an outstanding axial resolution is retained over the full FOV with only a small
degradation at the edges of the image we performed a two-color XZ image of the 12.5 day old
embryo. This is presented in Figure 5—figure supplement 1.
DiscussionWe have shown here that it is possible, using known design software and fabrication to exact toler-
ances, to design and construct an objective to facilitate imaging of objects up to 6 mm wide and
3 mm thick in their entirety with depth resolution of only a few microns instead of the tens of
microns currently attained, allowing sub-cellular detail to be resolved. We call this lens the Mesolens.
In doing this work we have departed from a design principle of more than a century, which is that
Figure 4. Optical sectioning of an optically-cleared and fluorescently-stained 10 day old mouse embryo. (a) is the embryo imaged in XZ using a dry
objective lens of similarly low magnification to the Mesolens (5x/0.15 N.A., HCX PL Fluotar, Leica Microsystems). (b) is the same embryo imaged at the
same region in XZ using the Mesolens with oil immersion. The Mesolens can image throughout the entire 2 mm thick embryo with sub-cellular
resolution: individual nuclei can be observed all the way through. This is in contrast to the image with the commercial low magnification, low N.A.
objective, where the long needle-like vertical structures indicate a very poor z resolution. Figure 4c shows an XY cross section at a depth of around 1
mm into the same specimen imaged using the Mesolens. Full resolution versions of (b) and (c) are available as Figure 4—figure supplement 1 and 2.
DOI: 10.7554/eLife.18659.010
The following figure supplements are available for figure 4:
Figure 4—figure supplement 1. Optical sectioning of an optically-cleared and fluorescently-stained 10 day old mouse embryo imaged using the
Mesolens.
DOI: 10.7554/eLife.18659.011
Figure supplement 2. Optical sectioning of an optically-cleared and fluorescently-stained 10 day old mouse embryo imaged using the Mesolens.
DOI: 10.7554/eLife.18659.012
McConnell et al. eLife 2016;5:e18659. DOI: 10.7554/eLife.18659 9 of 15
Research article Neuroscience Developmental Biology and Stem Cells
the number of lateral resolution units in the field diameter should be approximately the same for all
objectives. As we have shown here, the lateral resolution in the image field of this new lens is too
great for the human eye, but suits cameras of the highest pixel number available or laser scanning
confocal operation and, crucially, the axial resolution justifies the collection of several hundred
Figure 5. A dual-colour optical section of a 12.5 day old mouse embryo obtained with the Mesolens in laser scanning confocal mode. The neuronal
axons are stained with Alexa 594 (cyan) and nuclei with acridine orange (red). Scale bar=1 mm. The inset shows a blow-up of the eye region revealing
the individual cell nuclei. The image plane of this inset is located 36 mm closer to the specimen surface than in the full image shown. The scale bar on
the inset image is 300 mm. We can clearly identify fine structures throughout the embryo such as the developing heart muscle fibers and fine details in
the eye such as the corneal endothelium. The cyan streak in the lower right corner of the blow-up indicates a stained nerve. A z-stack of the same
specimen is presented in Video 2.
DOI: 10.7554/eLife.18659.013
The following figure supplement is available for figure 5:
Figure supplement 1. Illustration of the high z-resolution throughout the full 6 mm FOV.
DOI: 10.7554/eLife.18659.014
McConnell et al. eLife 2016;5:e18659. DOI: 10.7554/eLife.18659 10 of 15
Research article Neuroscience Developmental Biology and Stem Cells
diameter beads (18860–1, Polysciences Inc.) for the remaining resolution measurements respectively.
To immobilize the beads they were dried down on to cleaned coverslips and immersed in a Gelvatol
medium (341584, Sigma-Aldrich) containing DABCO (diazo-bis-cyclo-octane, 290734, Sigma-Aldrich)
as antifade. For the measurement in wide-field epi-fluorescence mode we used a 10x image magni-
fier as described above and a cooled CCD camera with 6.45 mm pixel size (CoolSnap HQ2,
Photometrix).
The flatness of field was measured in epi-fluorescence in oil immersion mode using 6 mm fluores-
cent beads (18862, Polysciences Inc.) dried down on the surface of a mirror serving as a flat sub-
strate. A camera with a 35 mm sensor chip (C3900-024, Hamamatsu) was placed directly on top of
the Mesolens via an F-mount, and images were captured using the manufacturer’s software
(HCImage, Hamamatsu).
Explant culture of rat brain, Figure 3, Video 1Explant cultures of embryonic rat brain were prepared and fixed with 2% paraformaldehyde and
stained as follows: The nuclei were stained with DAPI, the neurons were stained with Alexa 488 con-
jugated to an antibody against beta-III tubulin and astrocytes were stained with Alexa 546 conju-
gated to anti-GFAP. For the fluorescence imaging with this specimen a mercury lamp was used for
excitation, with custom filters designed for DAPI, Alexa 488 and Alexa 546 (Chroma). Two different
cameras were used to image the same region (Figure 3, Video 1). A low-power image was made by
recording the entire field of the Mesolens on a monochrome 35 mm CCD chip with 10 megapixels,
each of 9 mm square (C3900-024, Hamamatsu). Three images, using UV, blue or green excitation
from the mercury lamp were merged and coded blue, green and red respectively. A high-power
image was made with a small format color camera Nikon DSL1 (used without a magnifier, in contrast
to the resolution measurements described above), recording only a 2.2 mm x 1.6 mm portion of the
Mesolens field with a square pixel size of 3.4 mm. The theoretical resolution of the Mesolens (0.6 mm)
corresponds to 2.4 mm in image space in the camera, so neither camera allowed Nyquist sampling.
In the Video 1, the wide-field epi-fluorescence image is first software-zoomed and then replaced by
the image from the smaller format camera, which is further software zoomed and the view is soft-
ware-panned around the region recorded in the small-format camera. This procedure was necessary
to overcome the lack of a camera able to record hundreds of megapixels in a single image.
Protocols for staining embryos (Figures 4 and 5, Figure 4—figuresupplement 1, 2 and Figure 5—figure supplement 1, Video 2 andVideo 3)For the 10 day old embryos in Figures 4, Figure 4—figure supplement 1 and 2, embryos were dis-
sected from mouse uteri, fixed in ethanol: acetic acid 3:1 by volume overnight at 4˚C and then trans-
ferred into aqueous media via a series of ethanol/water mixtures with decreasing ethanol content.
The embryos were then stained overnight with acridine orange (0.05% in phosphate-buffered saline),
rinsed overnight in PBS, dehydrated with ethanol solutions, cleared in xylene and mounted in Histo-
mount (Fisher Scientific).
For the embryo presented in Figure 5 and Figure 5—figure supplement 1 embryos were dis-
sected from mouse uteri, fixed in Dent’s Fix for 24 hr at 4˚C, washed 3 times in PBS and then
bleached in Dent’s Bleach (for 24 hr) at 4˚C. Embryos were then rinsed 5 times in methanol, and
fixed in Dent’s Fix (for 24 hr) at 4˚C and stored at 4˚C until staining. For antibody staining, embryos
were rinsed 3 times in PBS, then washed 5 times in PBS for 1 hr per wash at room temperature.
5 min. Finally, embryos were cleared in 100% BABB overnight at 4˚C and were stored in BABB at
room temperature until re-staining with acridine orange. All the washing, staining and clearing steps
were done with the sample on a rocker. The embryos were then stained with nuclear stain acridine
Orange as follows. The embryos were transferred from BABB to PBS via a series of solvents. First,
the embryo was transferred to xylene, and left to soak in several changes of xylene to remove the
BABB over a period of days. It was then transferred from xylene to three changes of absolute etha-
nol, then 90% ethanol, 10% water by volume, then 75% ethanol, 50% ethanol and finally into distilled
water (with at least 10 min in each change). Acridine orange powder was dissolved in PBS to a pale
yellow solution. The embryo was left in the staining solution overnight with gentle rolling on a slow
turntable. The embryo was then washed in two changes of PBS over an hour and passed through
the same series of alcohols up to xylene and then rolled in BABB overnight. These embryos were
imaged in BABB.
Imaging parameters for the embryos (Figures 4, 5, Figure 4—figuresupplement 1, 2 and Video 2)The images in Figures 4b,c, Figure 4—figure supplement 1 and 2 were acquired using 488 nm
excitation with a power of ca 100 mW at the sample plane and the signal was detected using a 525/
39 nm band pass filter. For Figure 4b/Figure 4—figure supplement 1 we used a pixel size of 1 mm
x 1 mm (XZ) a scan speed of 22 lines per second and no frame averaging. For Figure 4c/Figure 4—
figure supplement 2 we used a pixel size of 0.5 mm x 0.5 mm (XY) a scan speed of 22 lines per sec-
ond and a frame average of 4. The low line speed was necessitated by the low bandwidth of the
PMT used for the images.
The z-stack in Figure 5/Video 2/Video 3 was acquired using 488 nm excitation with a power of
ca 50 mW at the sample plane and the signal was detected using a 525/39 nm band pass filter for
imaging the acridine orange. We used 561 nm excitation with a power of approximately 150 mW at
the sample plane and the signal was detected using a 600 nm long pass filter for imaging Alexa 594.
We used a pixel size of 1 mm x 1 mm x 3.33 mm (XYZ), a scan speed of 45 lines per second and a
frame average of 4.
The image for Figure 5—figure supplement 1 was acquired using 488 nm excitation with a
power of ca 50 mW at the sample plane and the signal was detected using a 525/39 nm band pass
filter for imaging the acridine orange. We used 561 nm excitation with a power of approximately
150 mW at the sample plane and the signal was detected using a 600 nm long pass filter for imaging
Alexa 594. We used a pixel size of 1 mm x 10 mm for XZ images and 1 mm x 1 mm for the XY images,
a scan speed of 30 lines per second and a frame average of 2.
For the image in Figure 4a (acquired on a Leica DM6000 microscope with an SP5 scanning unit)
we used a pixel size of 1.44 mm x 1 mm (XZ) and a scan speed of 400 lines per second, and a frame
average of 12.
AcknowledgementsThis work was supported by the Medical Research Council, grant number MR/K015583/1, to Gail
McConnell and John Dempster. Brad Amos is supported by a Leverhulme Emeritus Fellowship. We
thank Gillian Robb (SIPBS, University of Strathclyde) for assistance with using Volocity for Video 2,
Yvonne Vallis (MRC Laboratory of Molecular Biology) for the stained rat brain explant specimens and
supply of mouse embryos and Shinya Inoue for the gift of the grating test specimen. We thank
Richard Mort, Venkat Venkataraman and Shahida Sheraz (MRC Human Genetics Unit, University of
Edinburgh) for providing mouse embryos. Brad Amos and Es Reid declare a competing interest
from Mesolens Ltd. The dataset underlying this publication can be accessed via http://pure.strath.ac.
uk.
Additional information
Competing interests
ER, WBA: Co-founder and shareholder of Mesolens Ltd, a company that specialises in designing and
manufacturing optical instruments. The other authors declare that no competing interests exist.
McConnell et al. eLife 2016;5:e18659. DOI: 10.7554/eLife.18659 14 of 15
Research article Neuroscience Developmental Biology and Stem Cells
Animal experimentation: All experimental procedures using animals were conducted in strict accor-
dance with the United Kingdom Animals (Scientific Procedures) Act, 1986 and approved by the
Home Office (UK).
ReferencesAmor R, McDonald A, Tragardh J, Robb G, Wilson L, Abdul Rahman NZ, Dempster J, Amos WB, Bushell TJ,McConnell G. 2016. Widefield two-photon excitation without scanning: Live cell microscopy with high timeresolution and low photo-bleaching. PLOS ONE 11:e0147115. doi: 10.1371/journal.pone.0147115
Beach JM, Duling BR. 1993. A light-emitting diode light standard for photo- and videomicroscopy. Journal ofMicroscopy 172:41–48. doi: 10.1111/j.1365-2818.1993.tb03391.x
Kaufman MH. 1992. The Atlas of Mouse Development. Academic Press.Legesse FB, Chernavskaia O, Heuke S, Bocklitz T, Meyer T, Popp J, Heintzmann R. 2015. Seamless stitching oftile scan microscope images. Journal of Microscopy 258:223–232. doi: 10.1111/jmi.12236
Matsuyama T, Ohmura Y, Williamson DM. 2006. The lithographic lens: its history and evolution. In: D. G.Flagelloed. Optical Microlithography XIX. 6154 SPIE
Oh SW, Harris JA, Ng L, Winslow B, Cain N, Mihalas S, Wang Q, Lau C, Kuan L, Henry AM, Mortrud MT,Ouellette B, Nguyen TN, Sorensen SA, Slaughterbeck CR, Wakeman W, Li Y, Feng D, Ho A, Nicholas E, et al.2014. A mesoscale connectome of the mouse brain. Nature 508:207–214. doi: 10.1038/nature13186
Oldenbourg R, Terada H, Tiberio R, Inoue S. 1993. Image sharpness and contrast transfer in coherent confocalmicroscopy. Journal of Microscopy 172:31–39. doi: 10.1111/j.1365-2818.1993.tb03390.x
Ou X, Zheng G, Yang C. 2016. Erratum: 0.5 gigapixel microscopy using a flatbed scanner: erratum. BiomedicalOptics Express 7:646–647. doi: 10.1364/BOE.7.000646
Pang S, Han C, Erath J, Rodriguez A, Yang C. 2013. Wide field-of-view Talbot grid-based microscopy formulticolor fluorescence imaging. Optics Express 21:14555–14565. doi: 10.1364/OE.21.014555
Pawley JB. 2006. Handbook of Biological Confocal Microscopy. Springer.Sofroniew NJ, Flickinger D, King J, Svoboda K. 2016. A large field of view two-photon mesoscope withsubcellular resolution for in vivo imaging. eLife 5:e14472. doi: 10.7554/eLife.14472
Tsai PS, Mateo C, Field JJ, Schaffer CB, Anderson ME, Kleinfeld D. 2015. Ultra-large field-of-view two-photonmicroscopy. Optics Express 23:13833–13847. doi: 10.1364/OE.23.013833
White JG, Amos WB, Fordham M. 1987. An evaluation of confocal versus conventional imaging of biologicalstructures by fluorescence light microscopy. The Journal of Cell Biology 105:41–48. doi: 10.1083/jcb.105.1.41
Zheng G, Horstmeyer R, Yang C. 2013b. Wide-field, high-resolution Fourier ptychographic microscopy. NaturePhotonics 7:739–745. doi: 10.1038/nphoton.2013.187
Zheng G, Ou X, Yang C. 2013a. 0.5 gigapixel microscopy using a flatbed scanner. Biomedical Optics Express 5:1–8. doi: 10.1364/BOE.5.000001
McConnell et al. eLife 2016;5:e18659. DOI: 10.7554/eLife.18659 15 of 15
Research article Neuroscience Developmental Biology and Stem Cells