A Novel Oxide Characterization Method of Nickel Base Alloy 600 Used in Nuclear Plant Reactors Esteban Broitman 1 , Richard Becker 2 , Koji Dozaki 3 , Lars Hultman 1 1 IFM, Linköping University, SE-581 83 Linköping, Sweden 2 Studsvik Nuclear AB, SE-61182 Nyköping, Sweden 3 The Japan Atomic Power Company, Tokyo 101-0053, Japan Keywords: Alloy 600, Nanoindentation, Surface Probe Microscopy, Pressurized Water Reactors Abstract The Alloy 600 is a polycrystalline nickel base alloy used in pressurized water reactors (PWR) of nuclear power plants. Long term exposure of the alloy to primary water of PWR generates an oxide film that strongly influences the stress corrosion cracking behavior of the alloy. Recently, it has been shown that the oxide film structure, composition and thickness depend on the dissolved hydrogen content in the primary water. In this work we have explored a novel approach which enables a high spatial resolution oxide thickness measurement by nanomechanical testing. Oxide films have been grown on Alloy 600 specimens exposed between 5000 and 35000 hours at 320-330°C with hydrogen levels in the range 5 to 25 mL H 2 /kg H 2 O. A Triboindenter TI-950 from Hysitron was used to measure the change of nanomechanical properties in polished cross-sections. The increase of hardness has been correlated to the presence of oxides. Introduction The Alloy 600 is a polycrystalline nickel-based alloy (72% Ni minimum, 14–17% Cr, 6–10% Fe) that has been widely used in light water reactor power plants, i.e., in pressurized water reactors (PWR) and boiling water reactors. In PWR plants, alloy 600 has been used for steam generator tubes, nozzles, pressurized heater sleeves, instrument nozzles, and similar applications [1] [2] [3]. It is well known that long term exposure of the alloy to primary water of PWR generates a complex multilayered oxide structure that strongly influences the stress corrosion cracking (SCC) behavior of the alloy [3] [4] [5]. There is a general agreement that Ni-containing oxides and mixed oxides with considerable Ni-content are found in the top non-protective layers facing the aqueous environment, as shown in Figure 1 [6]. In the case of water environments with low hydrogen dissolution (DH), the surface also presents nanowires of Ni oxide (Fig 1, left side). The second intermediate spinel-type layer is a Cr-rich oxide containing both Ni and Fe whose protective character is not clear. Finally, there is an internal layer a few nm thick of Cr 2 O 3 that is probably the main protective layer. The composition and thickness of the oxide layer is strongly dependent on the hydrogen dissolved in the water [5]. Research on the composition and microstructure of this multilayered oxide structure has been carried out using modern techniques like scanning electron microscopy (SEM), transmission electron microscopy (TEM), and X-ray photoelectron spectroscopy [3] [5]. In particular, the thickness determination of the Cr 2 O 3 main protective layer, usually in the range 10- 300 nm, can only be done by time-consuming TEM characterization. In this work we have explored a novel approach which enables a high spatial resolution oxide thickness measurement by
Transcript
A Novel Oxide Characterization Method of Nickel Base Alloy 600 Used in Nuclear Plant Reactors
Esteban Broitman1, Richard Becker2, Koji Dozaki3, Lars Hultman1
1 IFM, Linköping University, SE-581 83 Linköping, Sweden
2 Studsvik Nuclear AB, SE-61182 Nyköping, Sweden 3 The Japan Atomic Power Company, Tokyo 101-0053, Japan
Keywords: Alloy 600, Nanoindentation, Surface Probe Microscopy, Pressurized Water Reactors
Abstract The Alloy 600 is a polycrystalline nickel base alloy used in pressurized water reactors (PWR) of nuclear power plants. Long term exposure of the alloy to primary water of PWR generates an oxide film that strongly influences the stress corrosion cracking behavior of the alloy. Recently, it has been shown that the oxide film structure, composition and thickness depend on the dissolved hydrogen content in the primary water. In this work we have explored a novel approach which enables a high spatial resolution oxide thickness measurement by nanomechanical testing. Oxide films have been grown on Alloy 600 specimens exposed between 5000 and 35000 hours at 320-330°C with hydrogen levels in the range 5 to 25 mL H2/kg H2O. A Triboindenter TI-950 from Hysitron was used to measure the change of nanomechanical properties in polished cross-sections. The increase of hardness has been correlated to the presence of oxides.
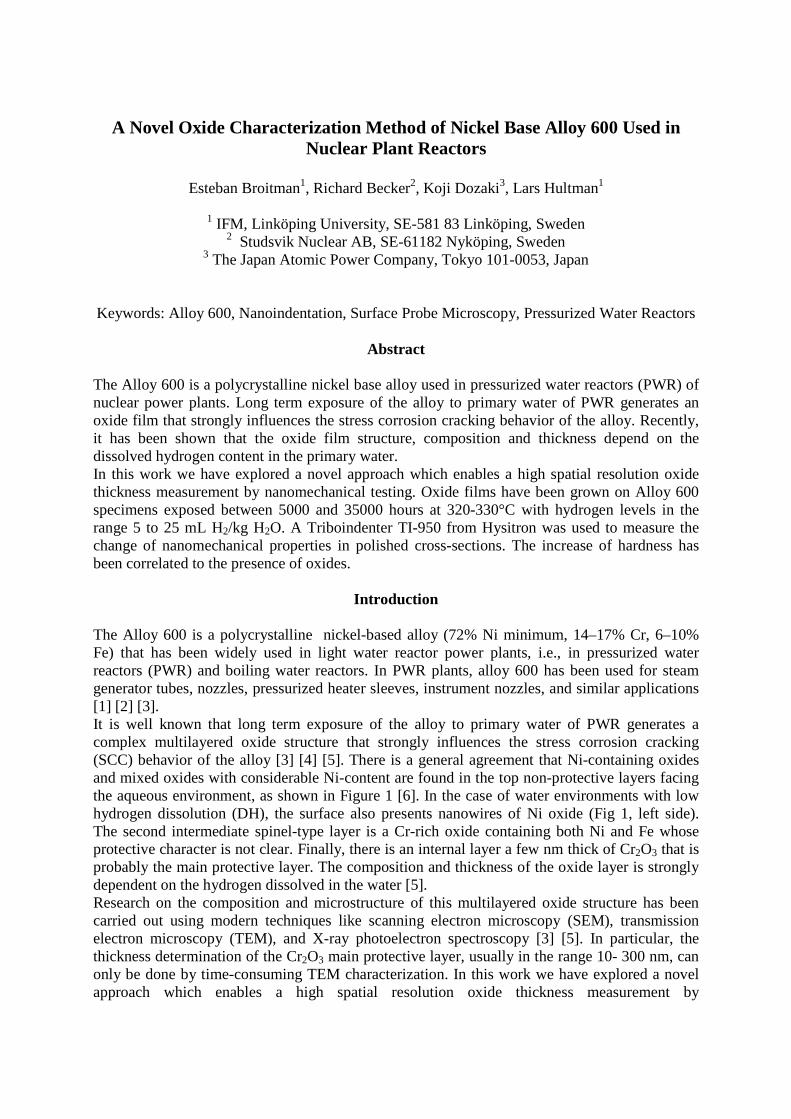
Introduction The Alloy 600 is a polycrystalline nickel-based alloy (72% Ni minimum, 14–17% Cr, 6–10% Fe) that has been widely used in light water reactor power plants, i.e., in pressurized water reactors (PWR) and boiling water reactors. In PWR plants, alloy 600 has been used for steam generator tubes, nozzles, pressurized heater sleeves, instrument nozzles, and similar applications [1] [2] [3]. It is well known that long term exposure of the alloy to primary water of PWR generates a complex multilayered oxide structure that strongly influences the stress corrosion cracking (SCC) behavior of the alloy [3] [4] [5]. There is a general agreement that Ni-containing oxides and mixed oxides with considerable Ni-content are found in the top non-protective layers facing the aqueous environment, as shown in Figure 1 [6]. In the case of water environments with low hydrogen dissolution (DH), the surface also presents nanowires of Ni oxide (Fig 1, left side). The second intermediate spinel-type layer is a Cr-rich oxide containing both Ni and Fe whose protective character is not clear. Finally, there is an internal layer a few nm thick of Cr2O3 that is probably the main protective layer. The composition and thickness of the oxide layer is strongly dependent on the hydrogen dissolved in the water [5]. Research on the composition and microstructure of this multilayered oxide structure has been carried out using modern techniques like scanning electron microscopy (SEM), transmission electron microscopy (TEM), and X-ray photoelectron spectroscopy [3] [5]. In particular, the thickness determination of the Cr2O3 main protective layer, usually in the range 10- 300 nm, can only be done by time-consuming TEM characterization. In this work we have explored a novel approach which enables a high spatial resolution oxide thickness measurement by
nanomechanical testing. By examining the nano-hardness with a nanoindenter on cross-sectional Alloy 600 samples, we correlated hardness variations to the presence of the chromium oxide layer.
Figure 1: Schematic representation of the cross-sectional interface region at lower (left side) and higher (right side) DH concentration levels (after [6])
Experimental Methods
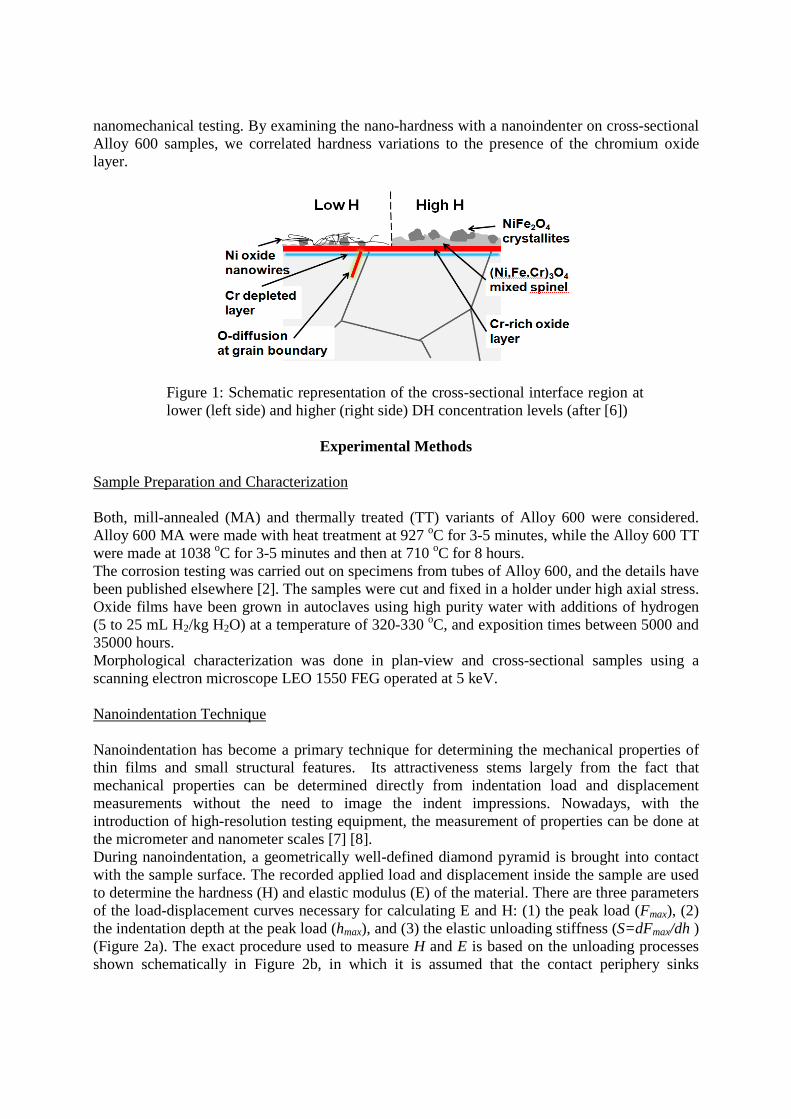
Sample Preparation and Characterization Both, mill-annealed (MA) and thermally treated (TT) variants of Alloy 600 were considered. Alloy 600 MA were made with heat treatment at 927 oC for 3-5 minutes, while the Alloy 600 TT were made at 1038 oC for 3-5 minutes and then at 710 oC for 8 hours. The corrosion testing was carried out on specimens from tubes of Alloy 600, and the details have been published elsewhere [2]. The samples were cut and fixed in a holder under high axial stress. Oxide films have been grown in autoclaves using high purity water with additions of hydrogen (5 to 25 mL H2/kg H2O) at a temperature of 320-330 oC, and exposition times between 5000 and 35000 hours. Morphological characterization was done in plan-view and cross-sectional samples using a scanning electron microscope LEO 1550 FEG operated at 5 keV. Nanoindentation Technique Nanoindentation has become a primary technique for determining the mechanical properties of thin films and small structural features. Its attractiveness stems largely from the fact that mechanical properties can be determined directly from indentation load and displacement measurements without the need to image the indent impressions. Nowadays, with the introduction of high-resolution testing equipment, the measurement of properties can be done at the micrometer and nanometer scales [7] [8]. During nanoindentation, a geometrically well-defined diamond pyramid is brought into contact with the sample surface. The recorded applied load and displacement inside the sample are used to determine the hardness (H) and elastic modulus (E) of the material. There are three parameters of the load-displacement curves necessary for calculating E and H: (1) the peak load (Fmax), (2) the indentation depth at the peak load (hmax), and (3) the elastic unloading stiffness (S=dFmax/dh ) (Figure 2a). The exact procedure used to measure H and E is based on the unloading processes shown schematically in Figure 2b, in which it is assumed that the contact periphery sinks
elastically [7]. The hardness can be defined as the ratio between the maximum load and the contact area A generated during the indentation:
H = Fmax/A. (1) Assuming that the pile-up is negligible, elasticity models show that the amount of sink-in, hs, is given by:
hs = ε (Fmax/S), (2) where ε is a geometric constant of the indenter. Figure 1b shows that the depth along which contact is made between the indenter and the specimen, hc = hmax − hs, is:
hc = hmax − ε (Fmax/S). (3) Letting F(d) be an “area function” that describes the projected (or cross sectional) area of the indenter at a distance d back from its tip, the contact area A is then A = F(hc). The area function, also sometimes called the indenter shape function, must carefully be calibrated by independent measurements so that deviations from nonideal indenter geometry are taken into account [1].
Figure 2: Schematic representations of (a) a load-displacement curve with the key experimental parameters: Fmax, hmax, and S; (b) a section through an indentation showing parameters characterizing the contact geometry (after Ref. [7]).
The nanomechanical characterization was carried our using a Triboindenter TI-950 from Hysitron. A pyramidal Berkovich tip, consisting in a diamond with an included angle of 142.35° and ~ 150 nm radius, was used in all the experiments (Figure 1b). Cross-sectional specimens were made by gluing slices into stainless-steel disks followed by mechanical polishing with a last colloidal silica polishing size of 0.04 microns. Indentation lines from the bulk toward the surface edge were performed, with 20-90 indents distributed along the line. The distance between indents was related to the maximum load, from 0.3 µm for Fmax = 250 µN to 1 µm for Fmax = 1000 µN. After calibration of the tip, the hardness values were calculated from the load-displacement curves using the software from the TI 950 instrument, which is based on the Oliver-Pharr method [7]. Surface Probe Microscopy (SPM) was also utilized to image in-situ the
surface before and after the nanoindentations. The images were obtained by the same diamond tip used for the indentations.
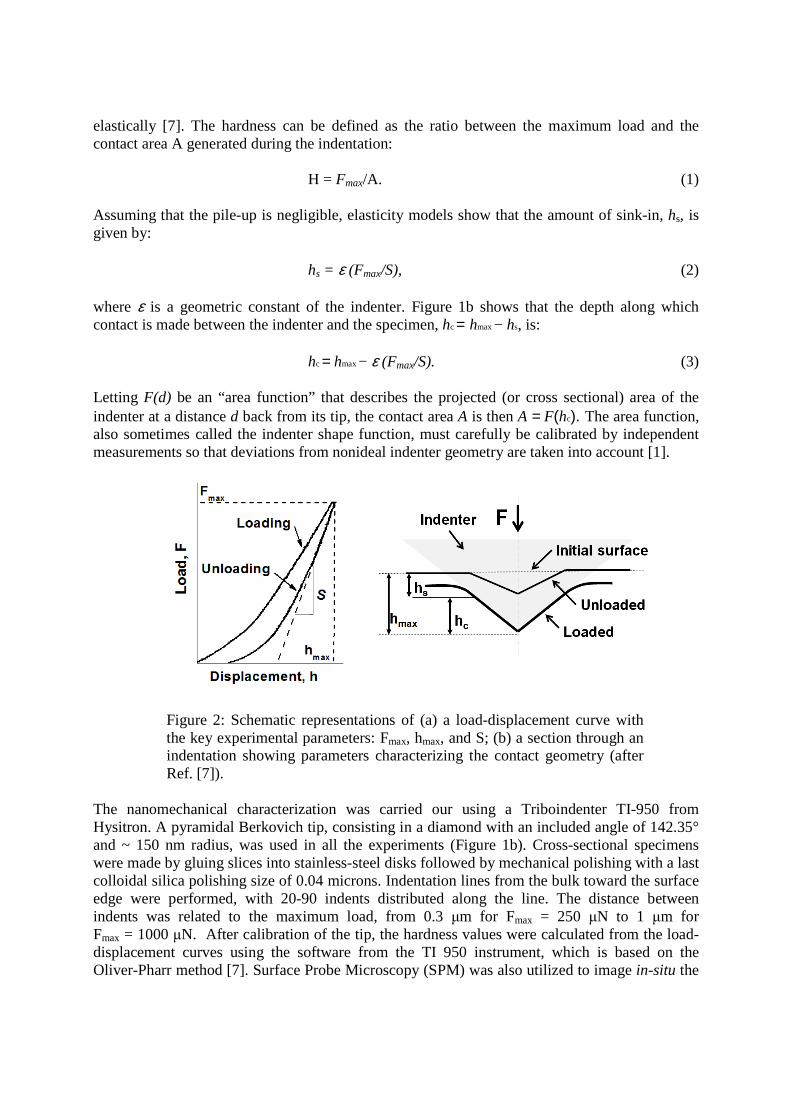
SEM characterization of plan-small crystallites, according to the DH concentration (Figure 3)presented in Figure 1.
Figure 3: SEM planlower and (b) the high
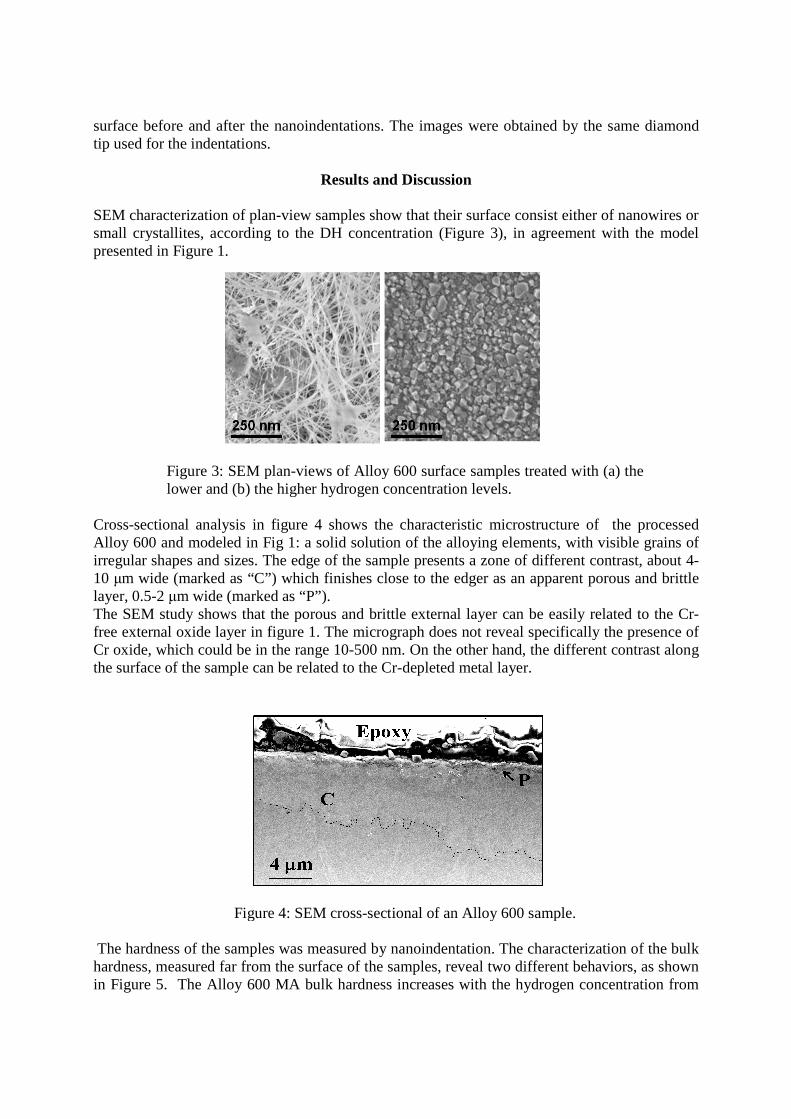
Cross-sectional analysis in figure 4Alloy 600 and modeled in Fig 1irregular shapes and sizes. The edge of the sample presents a 10 µm wide (marked as “C”) which finishes close to the edger as an apparent porous and brittle layer, 0.5-2 µm wide (marked as “P”). The SEM study shows that the porous and brittle external layer can be easily related free external oxide layer in figure 1. Cr oxide, which could be in the range 10the surface of the sample can be related to the Cr
Figure 4: SEM cross
The hardness of the samples was measured by nanoindentation. The characterization of the bulk hardness, measured far from thein Figure 5. The Alloy 600 MA bulk hardness increases
surface before and after the nanoindentations. The images were obtained by the same diamond
Results and Discussion
-view samples show that their surface consistsmall crystallites, according to the DH concentration (Figure 3), in agreement with the model
: SEM plan-views of Alloy 600 surface samples treated with higher hydrogen concentration levels.
in figure 4 shows the characteristic microstructure and modeled in Fig 1: a solid solution of the alloying elements, with visible grains of
irregular shapes and sizes. The edge of the sample presents a zone of different contrast, about 4m wide (marked as “C”) which finishes close to the edger as an apparent porous and brittle
m wide (marked as “P”). The SEM study shows that the porous and brittle external layer can be easily related free external oxide layer in figure 1. The micrograph does not reveal specifically the presence of
, which could be in the range 10-500 nm. On the other hand, the different contrast along the surface of the sample can be related to the Cr-depleted metal layer.
Figure 4: SEM cross-sectional of an Alloy 600 sample.
The hardness of the samples was measured by nanoindentation. The characterization of the bulk hardness, measured far from the surface of the samples, reveal two different behaviors, as shown in Figure 5. The Alloy 600 MA bulk hardness increases with the hydrogen
surface before and after the nanoindentations. The images were obtained by the same diamond
t either of nanowires or , in agreement with the model
views of Alloy 600 surface samples treated with (a) the
the characteristic microstructure of the processed : a solid solution of the alloying elements, with visible grains of
zone of different contrast, about 4-m wide (marked as “C”) which finishes close to the edger as an apparent porous and brittle
The SEM study shows that the porous and brittle external layer can be easily related to the Cr-not reveal specifically the presence of
. On the other hand, the different contrast along
sectional of an Alloy 600 sample.
The hardness of the samples was measured by nanoindentation. The characterization of the bulk two different behaviors, as shown
with the hydrogen concentration from
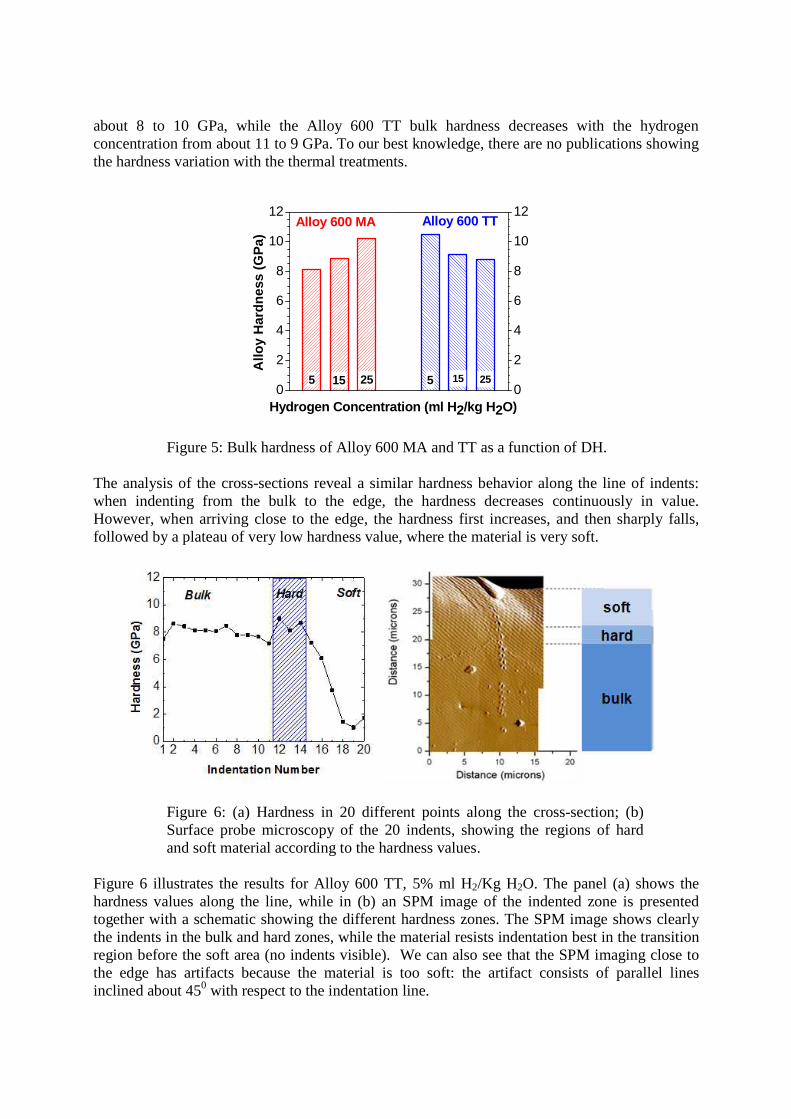
about 8 to 10 GPa, while the Alloy 600 TT bulk hardness decreases with the hydrogen concentration from about 11 to 9 GPa. To our best knowledge, there are no publications showing the hardness variation with the thermal treatments.
Figure 5: Bulk hardness of Alloy 600 MA and TT as a function of DH.
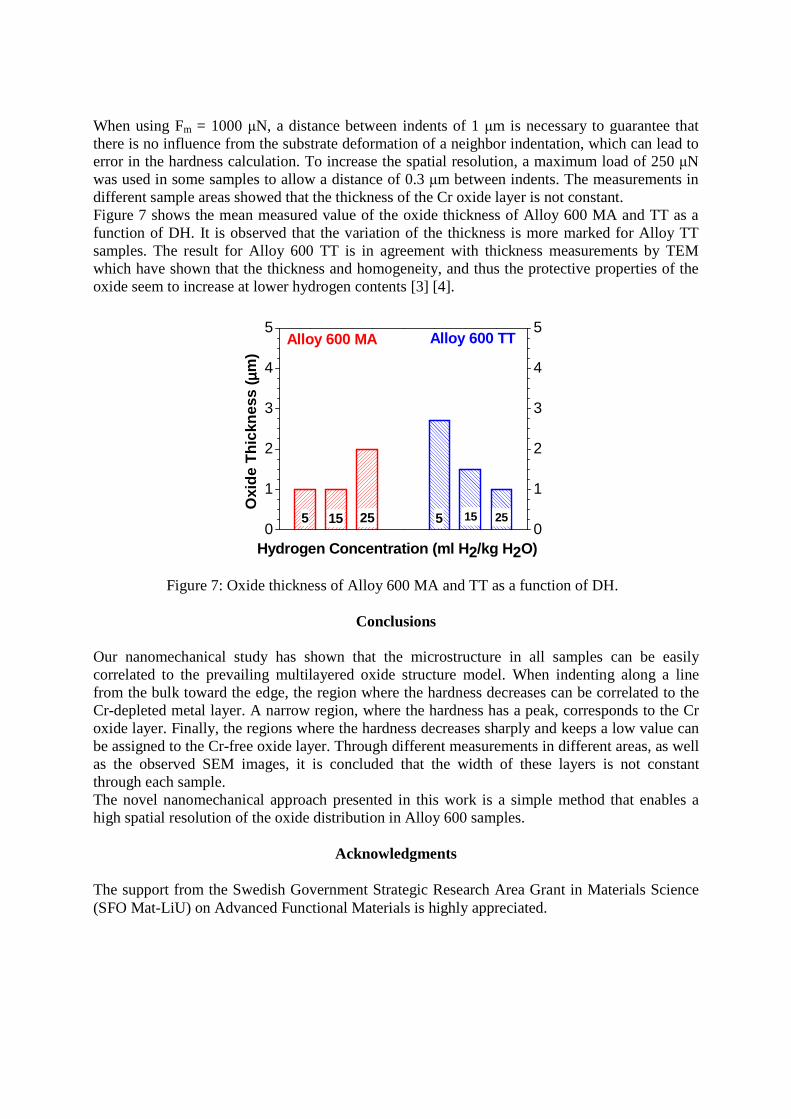
The analysis of the cross-sections reveal a similar hardness behavior along the line of indents: when indenting from the bulk to the edge, the hardness decreases continuously in value. However, when arriving close to the edge, the hardness first increases, and then sharply falls, followed by a plateau of very low hardness value, where the material is very soft.
Figure 6: (a) Hardness in 20 different points along the cross-section; (b) Surface probe microscopy of the 20 indents, showing the regions of hard and soft material according to the hardness values.
Figure 6 illustrates the results for Alloy 600 TT, 5% ml H2/Kg H2O. The panel (a) shows the hardness values along the line, while in (b) an SPM image of the indented zone is presented together with a schematic showing the different hardness zones. The SPM image shows clearly the indents in the bulk and hard zones, while the material resists indentation best in the transition region before the soft area (no indents visible). We can also see that the SPM imaging close to the edge has artifacts because the material is too soft: the artifact consists of parallel lines inclined about 450 with respect to the indentation line.
0
2
4
6
8
10
12
0
2
4
6
8
10
12
25155155
Alloy 600 TT
Allo
y H
ard
nes
s (G
Pa)
Alloy 600 MA
25
Hydrogen Concentration (ml H2/kg H2O)
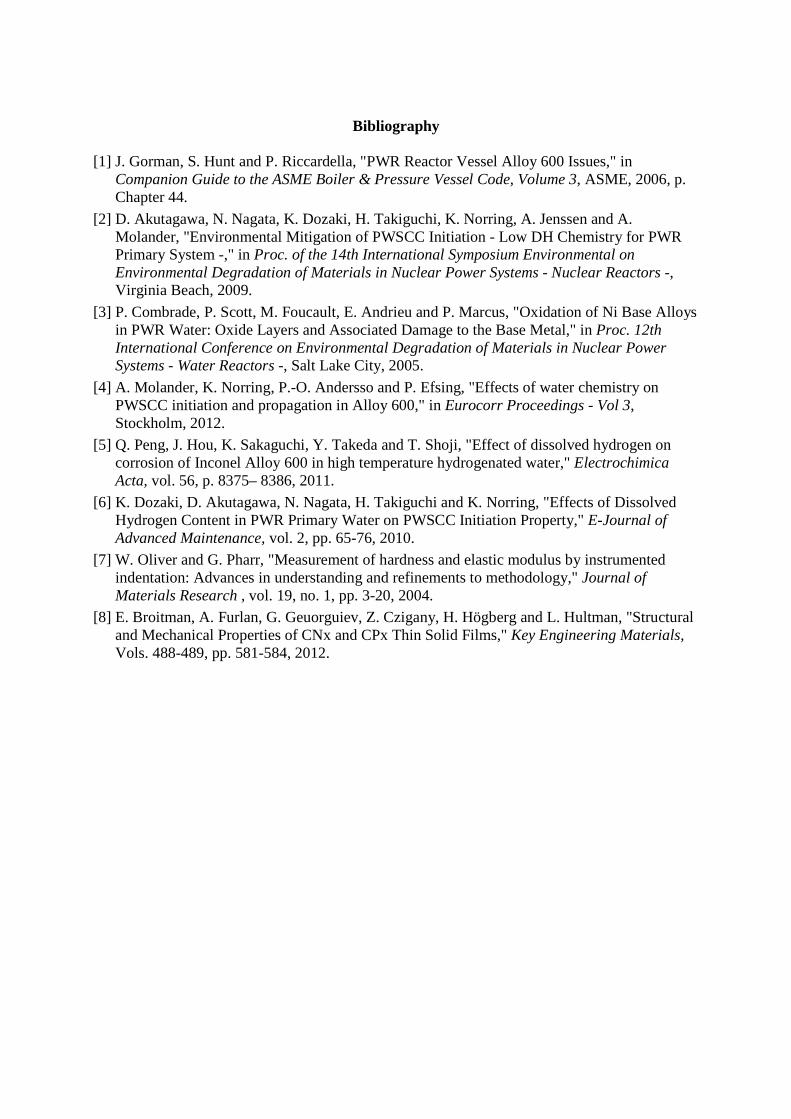
When using Fm = 1000 µN, a distance between indents of 1 µm is necessary to guarantee that there is no influence from the substrate deformation of a neighbor indentation, which can lead to error in the hardness calculation. To increase the spatial resolution, a maximum load of 250 µN was used in some samples to allow a distance of 0.3 µm between indents. The measurements in different sample areas showed that the thickness of the Cr oxide layer is not constant. Figure 7 shows the mean measured value of the oxide thickness of Alloy 600 MA and TT as a function of DH. It is observed that the variation of the thickness is more marked for Alloy TT samples. The result for Alloy 600 TT is in agreement with thickness measurements by TEM which have shown that the thickness and homogeneity, and thus the protective properties of the oxide seem to increase at lower hydrogen contents [3] [4].
0
1
2
3
4
5
0
1
2
3
4
5
25155155
Alloy 600 TT
Oxi
de
Th
ickn
ess
( µµ µµm
)
Alloy 600 MA
25
Hydrogen Concentration (ml H2/kg H2O)
Figure 7: Oxide thickness of Alloy 600 MA and TT as a function of DH.
Conclusions
Our nanomechanical study has shown that the microstructure in all samples can be easily correlated to the prevailing multilayered oxide structure model. When indenting along a line from the bulk toward the edge, the region where the hardness decreases can be correlated to the Cr-depleted metal layer. A narrow region, where the hardness has a peak, corresponds to the Cr oxide layer. Finally, the regions where the hardness decreases sharply and keeps a low value can be assigned to the Cr-free oxide layer. Through different measurements in different areas, as well as the observed SEM images, it is concluded that the width of these layers is not constant through each sample. The novel nanomechanical approach presented in this work is a simple method that enables a high spatial resolution of the oxide distribution in Alloy 600 samples.
Acknowledgments The support from the Swedish Government Strategic Research Area Grant in Materials Science (SFO Mat-LiU) on Advanced Functional Materials is highly appreciated.
Bibliography
[1] J. Gorman, S. Hunt and P. Riccardella, "PWR Reactor Vessel Alloy 600 Issues," in Companion Guide to the ASME Boiler & Pressure Vessel Code, Volume 3, ASME, 2006, p. Chapter 44.
[2] D. Akutagawa, N. Nagata, K. Dozaki, H. Takiguchi, K. Norring, A. Jenssen and A. Molander, "Environmental Mitigation of PWSCC Initiation - Low DH Chemistry for PWR Primary System -," in Proc. of the 14th International Symposium Environmental on Environmental Degradation of Materials in Nuclear Power Systems - Nuclear Reactors -, Virginia Beach, 2009.
[3] P. Combrade, P. Scott, M. Foucault, E. Andrieu and P. Marcus, "Oxidation of Ni Base Alloys in PWR Water: Oxide Layers and Associated Damage to the Base Metal," in Proc. 12th International Conference on Environmental Degradation of Materials in Nuclear Power Systems - Water Reactors -, Salt Lake City, 2005.
[4] A. Molander, K. Norring, P.-O. Andersso and P. Efsing, "Effects of water chemistry on PWSCC initiation and propagation in Alloy 600," in Eurocorr Proceedings - Vol 3, Stockholm, 2012.
[5] Q. Peng, J. Hou, K. Sakaguchi, Y. Takeda and T. Shoji, "Effect of dissolved hydrogen on corrosion of Inconel Alloy 600 in high temperature hydrogenated water," Electrochimica Acta, vol. 56, p. 8375– 8386, 2011.
[6] K. Dozaki, D. Akutagawa, N. Nagata, H. Takiguchi and K. Norring, "Effects of Dissolved Hydrogen Content in PWR Primary Water on PWSCC Initiation Property," E-Journal of Advanced Maintenance, vol. 2, pp. 65-76, 2010.
[7] W. Oliver and G. Pharr, "Measurement of hardness and elastic modulus by instrumented indentation: Advances in understanding and refinements to methodology," Journal of Materials Research , vol. 19, no. 1, pp. 3-20, 2004.
[8] E. Broitman, A. Furlan, G. Geuorguiev, Z. Czigany, H. Högberg and L. Hultman, "Structural and Mechanical Properties of CNx and CPx Thin Solid Films," Key Engineering Materials, Vols. 488-489, pp. 581-584, 2012.


![[Norbert H. Nickel, Evgenii Terukov] Zinc Oxide](https://static.documents.pub/doc/80x56/56d6be6b1a28ab30169209ee/norbert-h-nickel-evgenii-terukov-zinc-oxide.jpg)


