A thesis submitted to the Faculty of the University of Delaware in partial fulfillment of the requirements for the degree of Honors Bachelor of Chemical Engineering with Distinction
Approved: __________________________________________________________ Maciek Antoniewicz, Ph.D. Professor in charge of thesis on behalf of the Advisory Committee Approved: __________________________________________________________ Wilfred Chen, Ph.D. Committee member from the Department of Chemical Engineering Approved: __________________________________________________________ Gary Laverty, Ph.D. Committee member from the Board of Senior Thesis Readers Approved: __________________________________________________________ Earl Lee II, Ph.D. Deputy Faculty Director, University Honors Program
iii
ACKNOWLEDGMENTS
Firstly, I would like to thank my family, specifically, Mom, Dad, Nan, Pop,
Ari, Athena and Apollo for their love, compassion, kindness, and support throughout
not only my academic career, but over the course of my entire life. Without each of
you, I would not be a fraction of the person I am today. Know that I am fully aware of
all of the sacrifices and work that each of you put into raising and being with me. I am
forever grateful to all of you and am so thankful to have such amazing people serving
as my role-models and inspirations. I love you all.
Next, I would like to thank my research advisor, academic advisor, and
professor, Dr. Maciek Antoniewicz. Without your guidance, leadership, and
dedication to working with me, this research would not be possible. You provided a
student who had just finished his very first semester of college with an incredible
project that would open doors to new areas of academia that I did not even know
existed. I thank you for teaching me so much, giving me the opportunity to work in
your lab, and providing me the tools to learn so much and further my academic career.
Research has been the premiere aspect to my undergraduate career. I am indebted to
you.
I would like to thank my thesis committee, Dr. Antoniewicz, Dr. Chen, and Dr.
Laverty for their assistance during my thesis process.
Finally, I would like to thank all my friends and colleagues that have
accumulated over my years at the University of Delaware. Each of you have provided
insight and companionship that has made me truly lucky.
iv
Without those previously mentioned I would not be able to write this thesis.
Your support and motivation have been paramount to me. Thank you all again.
Robert Cipolla
May 2019
v
TABLE OF CONTENTS
LIST OF TABLES ........................................................................................................ vi LIST OF FIGURES ...................................................................................................... vii ABSTRACT ................................................................................................................ viii
A DATA FROM S.SOLFATARICUS CO-UTILIZATION EXPERIMENTS ..... 27 B ANNOTATED CENTRAL CARBON METABOLISMS ............................... 29
vi
LIST OF TABLES
Table 1. Growth characteristics of Rhodothermus marinus DSM 4252 and Sulfolobus solfataricus during exponential growth on glucose. .............. 11
vii
LIST OF FIGURES
Figure 1. General workflow for the process of creating a flux map ............................... 9
Figure 2. Growth Rate vs. Concentration data for S.solfataricus utilizing glucose (left) and xylose (right) ............................................................................ 12
Figure 3. Progression of the growth of T.fusca beginning with cellulose generation (A), Trypsin wash (B), Water wash (C), and cellular growth (D,E,F) .... 13
Figure 4. Metabolic flux map for R.marinus with glucose flux standardized to 100 ... 16
Figure 5. %13C labeling for key amino acids in the metabolism of S.solfataricus ..... 18
Figure 6. A schematic describing the Weimberg and Dahms pathways used in processing xylose .................................................................................... 18
Figure 7. Metabolic flux map for T.fusca with glucose flux standardized to 100 ........ 20
Figure 8. Metabolic flux map for T.fusca with a cellulose flux standardized to 100 ... 21
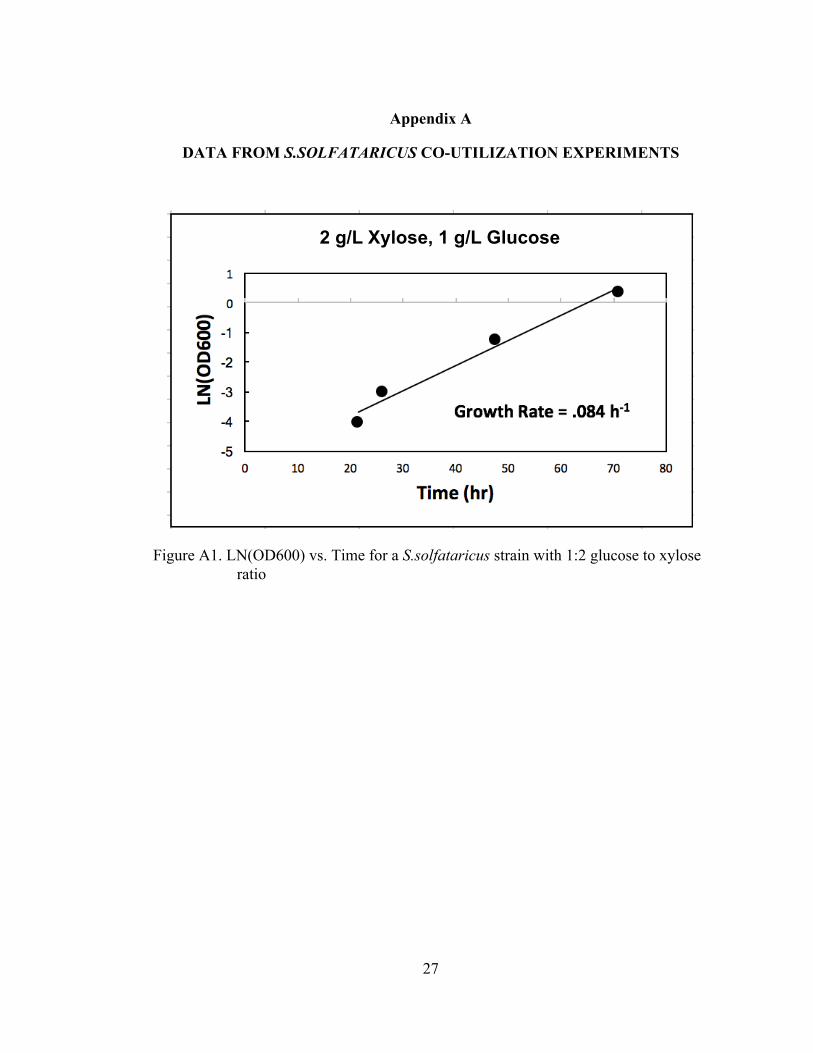
Figure A1. LN(OD600) vs. Time for a S.solfataricus strain with 1:2 glucose to xylose ratio .............................................................................................. 27
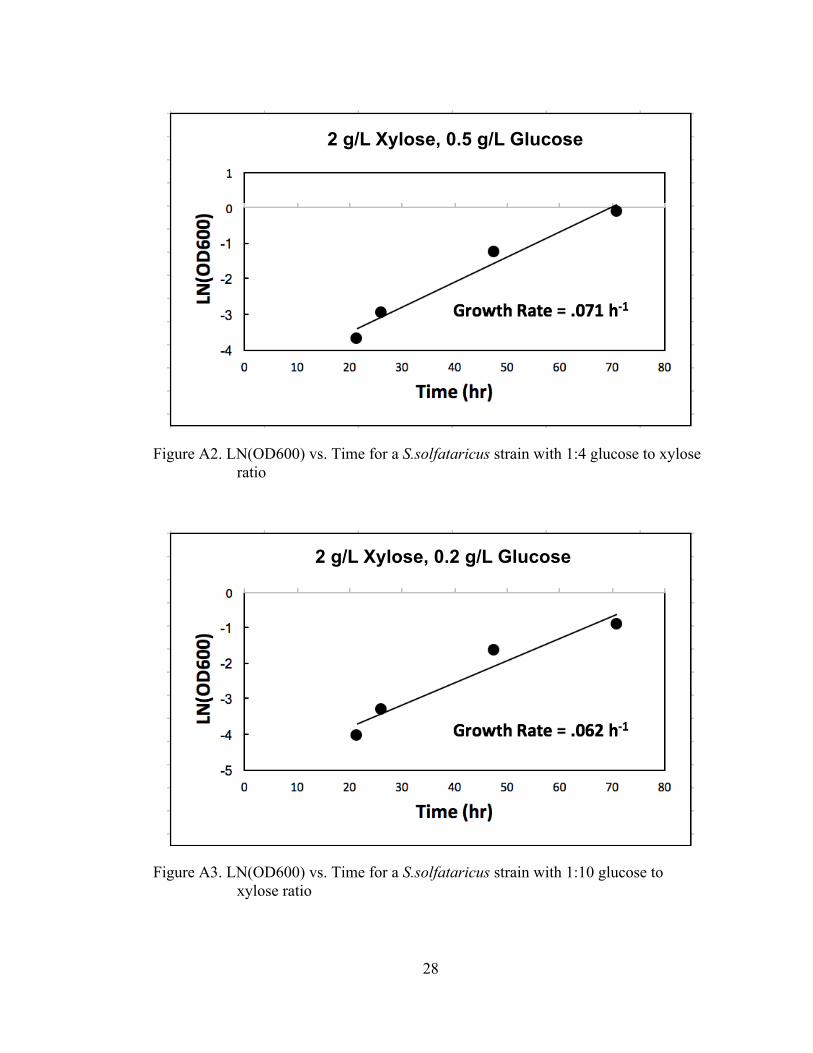
Figure A2. LN(OD600) vs. Time for a S.solfataricus strain with 1:4 glucose to xylose ratio .............................................................................................. 28
Figure A3. LN(OD600) vs. Time for a S.solfataricus strain with 1:10 glucose to xylose ratio .............................................................................................. 28
Figure B1. Annotated metabolic map for T.fusca based on KEGG Pathway Database .................................................................................................. 29
Figure B2. Annotated metabolic map for R.marinus based on KEGG Pathway Database .................................................................................................. 30
Figure B3. Annotated metabolic map for S.solfataricus based on KEGG Pathway Database .................................................................................................. 31
viii
ABSTRACT
The thermophilic organisms Rhodothermus marinus, Sulfolobus solfataricus,
and Thermobifida fusca possess unique characteristics that make them relevant to
potential industrial and biotechnological applications. Rhodothermus marinus grows
in high salinity environments, Sulfolobus solfataricus grows in low pH environments,
and Thermobifida fusca is able to utilize cellulose as its main carbon substrate. These
unique abilities coupled with thermophilic organisms’ innate ability to grow at high
temperatures (77°C, 80°C , and 55°C for R. marinus, S. solfataricus, and T. fusca
respectively) , make these valuable candidates in the realm of biotechnology, to be
utilized for tasks like production of low-boiling fuels and thermostable enzymes.
In this study, the growth physiology and metabolism of each of these
organisms is investigated. Using modern tools of metabolic engineering and systems
biology such as 13C-metabolic flux analysis (MFA), a quantitative map of the
metabolism can be generated, resulting in a greater knowledge of the organism and its
by-products of metabolism.
To understand general physiology, a combination of literature review and
growth experimentation was utilized. The results of the study included media,
temperature, and substrate optimization, as well as revelations regarding carbon
substrate sources. For instance, it was shown that S.solfataricus is able to grow on
xylose as efficiently as it grows on glucose.
Regarding metabolism, successful characterizations of flux maps were
achieved for R. marinus and T. fusca. For the S.solfataricus strain, initial hypotheses
related to xylose processing pathways appear to have been incorrect, leaving room for
further research and development of models.
1
Chapter 1
INTRODUCTION
1.1 Motivation
Within the realm of biochemical engineering applications, the use of extremely
thermophilic organisms (i.e. microbes that grow optimally at temperatures of 70°C or
higher) in industrial settings is becoming more prevalent as they have physical and
metabolic characteristics that are advantageous to product production and recovery1.
This includes aspects like high substrate uptake rates, broad substrate range, and fast
doubling times1,2. However, poor understanding of cellular physiology of
thermophiles presents a limitation in overall industrial applications1.
1.2 Rhodothermus marinus, Sulfolobus solfataricus, and Thermobifida fusca
The three microorganisms that were studied in this thesis are Rhodothermus
marinus, Sulfolobus solfataricus, and Thermobifida fusca. Each species was selected
due to desirable growth characteristics and potential industrial applications.
Rhodothermus marinus is a bacterium with optimal growth temperature of about 75-
80°C. A key characteristic of Rhodothermus marinus is its ability to grow in high
salinity environments. Sulfolobus solfataricus is a highly thermophilic archaeon with
optimal growth temperature of about 80-85°C. A key characteristic of Sulfolobus 1 Cipolla et al., 2017
2 Long et al., 2017
2
solfataricus is its ability to grow in low pH environments (pH<3), as well as an ability
to utilize xylose as a primary carbon source. Thermobifida fusca is a bacterium with
optimal growth of approximately 55°C. Though it is characterized as a thermophile, it
does not grow at as extreme conditions as the other organisms in this study. It was
primarily selected because of its intrinsic ability to process the complex carbon source,
cellulose. The abilities described above for each cell line prove advantageous for
potential industrial application, making each an adequate candidate for study.
1.3 Aim of thesis
The aim of this thesis is to apply modern metabolic engineering and systems
biology techniques such as 13C metabolic flux analysis, adaptive evolution, and whole-
genome sequencing to elucidate key cellular characteristics for improved applications
of each of the organisms. Using parallel labeling experiments, this investigation seeks
to estimate intracellular metabolic fluxes of extreme thermophiles in order to provide
more rational engineering targets for improving cellular properties. A more accurate
model of cellular metabolism should allow for the identification of specific pathway
targets for strain engineering and application of thermophilic organisms in
biochemical engineering applications.
3
Chapter 2
MATERIALS AND METHODS
2.1 Materials
Media and chemicals were purchased from Sigma-Aldrich (St. Louis, MO).
Glucose tracers, [1-13C], [2-13C], [3-13C], [4-13C], [5-13C], and [6-13C]glucose (99% 13C) were purchased from Cambridge Isotope Laboratories (Andover, MA). Xylose
tracers, [1-13C], [2-13C], [3-13C], [4-13C], and [5-13C]xylose (99% 13C) were purchased
from Cambridge Isotope Laboratories (Andover, MA). Wolfe’s minerals and vitamins
(Cat. No. MD-TMS and Cat. No. MD-VS respectively) were purchased from ATCC
(Manassas, VA). Tris solution (1 mol/L) was purchased from Cellgro (Cat. No. 46-
031-CM). Yeast extract was purchased from Fisher (Cat. No. BP-1422-500, lot
The base growth medium for the Rhodothermus marinus strain contained (per
liter of medium): 0.50 g K2HPO4, 0.30 g KH2PO4, 0.50 g NH4Cl, 0.50 g NaCl, 0.20 g
MgCl2.6H2O, 0.04 g CaSO4.2H2O, 40 mL of 1 M Tris, 5 mL of Wolfe’s minerals, 5
mL of Wolfe’s vitamins, and 0.05 g/L of yeast extract. The base growth medium for
the Sulfolobus solfataricus strain contained (per liter of medium): 0.50 g K2HPO4,
0.30 g KH2PO4, 0.20 g MgCl2.6H2O, 0.04 g CaSO4.2H2O, 1.30 g (NH4)2SO4. The base
growth medium for Thermobifida fusca contained (per liter of medium): 6.8 g
Na2HPO4, 3.0 g KH2PO4, 2.0 g (NH4)2SO4, 1.0 g NH4Cl, 1.5 g NaCl, 0.50 g Mg
SO4.7H2O, 0.015 g CaCl2.2H2O. To produce 13C-labeled cellulose, the organism
Komagataeibacter xylinus was grown in Hestrin and Schramm (HS) growth medium
which contained (per liter of medium): 5.0 g Peptone, 5.0 g yeast extract, 2.7 g
Na2HPO4, 1.15 g citric acid, and 20 g glucose (pH adjusted to 5.0 with HCl).
For growth of Rhodothermus marinus, the base growth medium was
supplemented with 1% NaCl. Glucose was added as indicated in the text. For growth
of Sulfolobus solfataricus, the base growth medium was adjusted to a pH of 3.5 using
4
a concentrated 6 N solution of H2SO4. Glucose and xylose were added as indicated in
the text. All solutions were sterilized by filtration.
2.2 Strain and growth conditions
Rhodothermus marinus DSM 4252 (ATCC 43812) was obtained from the
American Type Culture Collection (ATCC, Manassas,VA). Sulfolobus
solfataricus(ATCC 35092) was obtained from the American Type Culture Collection
(ATCC, Manassas,VA). Thermobifida fusca (ATCC BAA-629) was obtained from the
American Type Culture Collection (ATCC, Manassas,VA). For parallel labeling
experiments for Rhodothermus marinus and Sulfolobus solfataricus, cells from -80 °C
frozen stock were first pre-grown in medium containing 2 g/L of unlabeled glucose or
2 g/L xylose. Next, 50 µL of this pre-culture was used to inoculate six culture tubes
containing 10 mL of growth medium with one of six 13C-glucose tracers, [1-13C], [2-13C], [3-13C], [4-13C], [5-13C], or [6-13C]glucose, or five 13C-xylose tracers, [1-13C], [2-13C], [3-13C], [4-13C], and [5-13C]xylose . The optical density (OD600) of the inoculated
cultures was about 0.01. Cells were then grown aerobically in custom mini-bioreactors
as described previously3. Rhodothermus marinus DSM 4252 was grown at 77 °C with
2.5 g/L glucose; and Sulfolobus solfataricus was grown at 80 °C with 1.8 g/L (10mM)
glucose and in some experiments, 1.8 g/L (12mM) of xylose. A high-precision
multichannel peristaltic pump (Watson Marlow, Wilmington, MA) was used to control
the air flow to the mini-bioreactors, which was set at 11 mL/min. Gas flow rates were
monitored by a digital flow-meter (Supelco, Veri-Flow 500). Mixing in the mini-
bioreactors was achieved through the rising gas bubbles, and a constant culture
temperature was maintained by placing the tubes in a heating block (Fisher Isotemp
3 Swarup et al., 2014
5
Digital Dry-Bath 125D)4. Samples for isotopic labeling analysis were collected during
mid-exponential growth phase when OD600 was between 0.5 and 1.0.
For parallel labeling experiments involving Thermobifida fusca, cells from -80
°C frozen stock were first pre-grown in medium containing unlabeled cellulose. Next,
this pre-culture was used to inoculate shake flasks containing 20 mL of growth
medium with one of six 13C-glucose tracers incorporated into the cellulose structure,
[1-13C], [2-13C], [3-13C], [4-13C], [5-13C], or [6-13C]glucose. In order to incorporate the
glucose tracers into cellulose, the organism K. xylinus (ATCC 53524) was utilized. 13C-cellulose is a by-product of K. xylinus growth on 13C-glucose. K.xylinus was
grown aerobically in 125-mL flasks (without shaking) at 30 °C for 4 days. T.fusca
cells were then grown aerobically in the shake flasks. Thermobifida fusca was grown
at 55 °C with cellulose.
2.3 Analytical methods
Samples were collected at multiple times during the exponential growth phase to
monitor cell growth, substrate uptake and acetate production. For the Rhodothermus
marinus and Sulfolobus Solfataricus strains, biomass concentration was determined by
measuring the optical density at 600 nm (OD600) using a spectrophotometer
(Eppendorf BioPhotometer). The OD600 values were converted to cell dry weight
concentrations using experimentally determined OD600-dry cell weight relationships5
for Rhodothermus marinus DSM 4252 (1.0 OD600 = 0.32 gDW/L), and Sulfolobus
solfataricus (1.0 OD600 = 0.28 gDW/L). For the Thermobifida fusca strain, overall
biomass production was measured via dry weight following the completion of growth.
OD measurements were not collected for Thermobifida fusca since considerable cell
4 Cordova and Antoniewicz, 2016
5 determined using the techniques described in Long et al., 2016b
6
clumping was observed in these cultures. . Glucose concentration was determined
using a YSI 2700 biochemistry analyzer (YSI, Yellow Springs, OH), and acetate
concentration was determined using an Agilent 1200 Series HPLC6.
2.4 Mass spectrometry analysis
GC-MS analysis was performed on an Agilent 7890B GC system equipped with
a DB-5MS capillary column (30 m, 0.25 mm i.d., 0.25 µm-phase thickness; Agilent
J&W Scientific), connected to an Agilent 5977A Mass Spectrometer operating under
ionization by electron impact (EI) at 70 eV. Helium flow was maintained at 1 mL/min.
The source temperature was maintained at 230°C, the MS quad temperature at 150°C,
the interface temperature at 280°C, and the inlet temperature at 250°C. GC-MS
analysis of tert-butyldimethylsilyl (TBDMS) derivatized proteinogenic amino acids
was performed as described in (Antoniewicz et al., 2007a)7. Labeling of glucose in the
medium was determined after aldonitrile propionate derivatization as described in
(Antoniewicz et al., 2011; Sandberg et al., 2016)8. Labeling of fatty acids was
determined after derivatization to fatty acid methyl esters (FAME)9. Labeling of
glucose (derived from glycogen) and ribose (derived from RNA) were determined as
described in (Long et al., 2016a; McConnell and Antoniewicz, 2016)10. In all cases,
6 Gonzalez et al., 2017
7 Antoniewicz et al., 2007a
8 Antoniewicz et al., 2011; Sandberg et al., 2016
9 Crown et al., 2015
10 Long et al., 2016a; McConnell and Antoniewicz, 2016
7
mass isotopomer distributions were obtained by integration7 and corrected for natural
isotope abundances11.
2.5 Metabolic network models and 13C-metabolic flux analysis
The metabolic network models used for 13C-metabolic flux analysis (13C-MFA)
are provided in the appendix. For each organism, the core metabolic network model
was constructed based on the pathways and reactions annotated in the KEGG and
BioCyc databases12. To describe fractional labeling of metabolites, G-value
parameters were included in the 13C-MFA models. As described previously13, the G-
value represents the fraction of a metabolite pool that is produced during the labeling
experiment, while 1-G represents the fraction that is naturally labeled, i.e. from the
inoculum. By default, one G-value parameter was included for each measured
metabolite in each data set. The models also accounted for the dilution of intracellular
labeling by incorporation of atmospheric unlabeled CO2 14. Reversible reactions were
modeled as separate forward and backward fluxes. Net and exchange fluxes were
determined as follows: vnet = vf-vb; vexch = min(vf, vb).
All flux calculations were performed using the Metran software15 which is based
on the elementary metabolite units (EMU) framework16. Fluxes were estimated by
minimizing the variance-weighted sum of squared residuals (SSR) between the
11 Fernandez et al., 1996
12 Caspi et al., 2012; Kanehisa et al., 2012; Kanehisa and Goto, 2000
13 Antoniewicz et al., 2007c
14 Leighty and Antoniewicz, 2012
15 Yoo et al., 2008
16 Antoniewicz et al., 2007b
8
experimentally measured and model predicted mass isotopomer distributions of
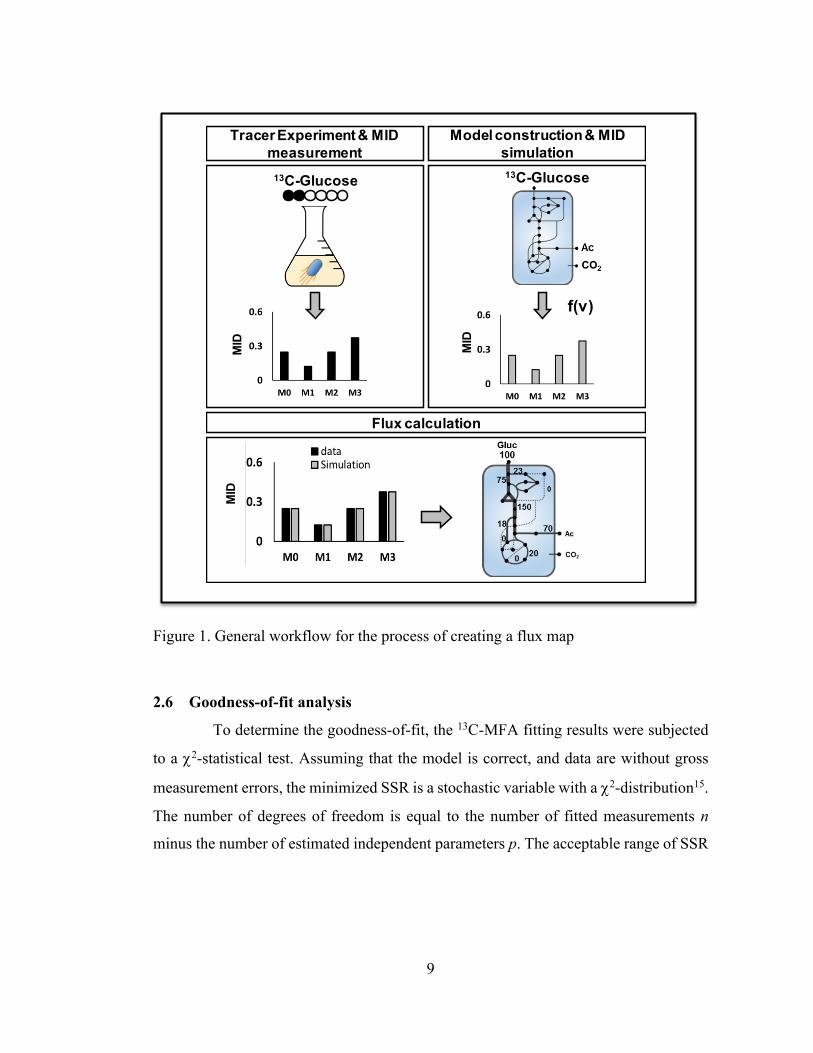
Figure 1. General workflow for the process of creating a flux map
2.6 Goodness-of-fit analysis
To determine the goodness-of-fit, the 13C-MFA fitting results were subjected
to a c2-statistical test. Assuming that the model is correct, and data are without gross
measurement errors, the minimized SSR is a stochastic variable with a c2-distribution15.
The number of degrees of freedom is equal to the number of fitted measurements n
minus the number of estimated independent parameters p. The acceptable range of SSR
z
MID
MID
13C-Glucose
Tracer Experiment & MID measurement
Flux calculation
Model construction & MID simulation13C-Glucose
MID
f(v)
10
values is between c2α/2(n-p) and c21-α/2(n-p), where α is a certain chosen threshold value,
for example 0.05 for the 95% confidence interval.
11
Chapter 3
RESULTS AND DISCUSSION
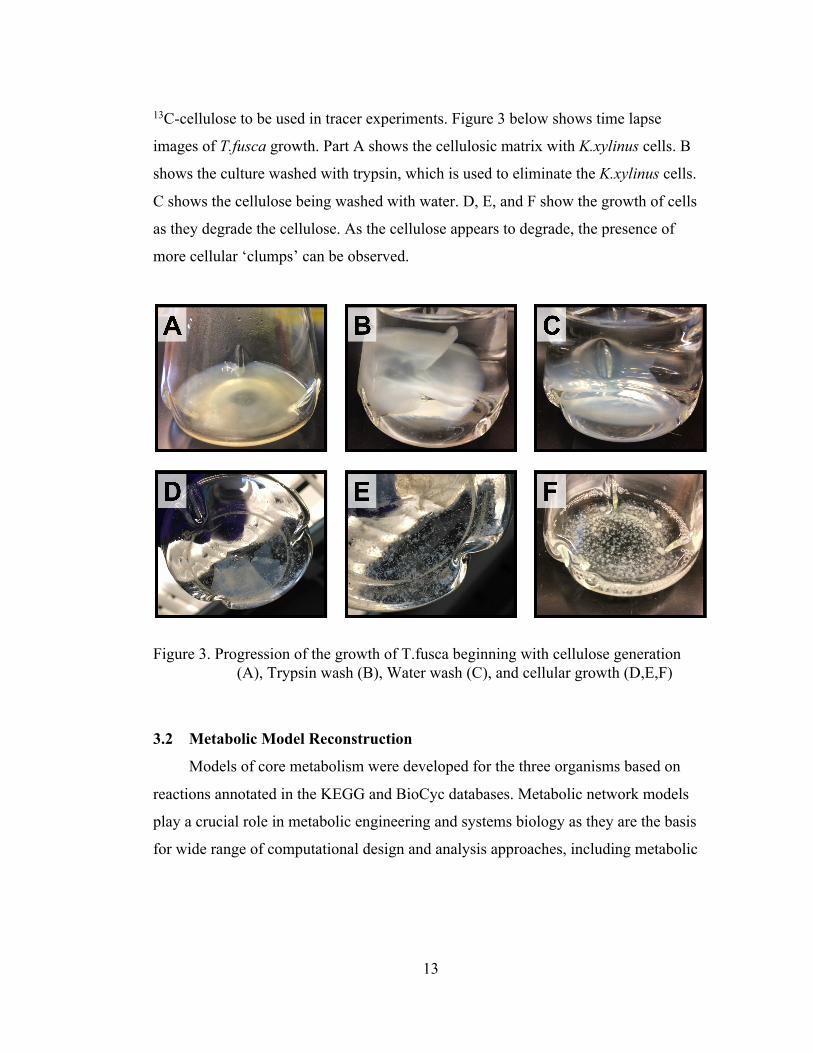
3.1 Growth physiology
Growth characteristics of Rhodothermus marinus DSM 4252 and Sulfolobus
solfataricus were determined in aerobic batch culture in minimal growth medium with
glucose as the carbon source (Table 1). A small amount of yeast extract (0.05 g/L)
was added to the media to eliminate a lag phase that was sometimes observed when
subculturing cells, although the presence of the yeast extract did not impact glucose
uptake rates or growth rates of the strains. R. marinus was grown at 77°C and
Sulfolobus solfataricus grown at 80°C.
Table 1. Growth characteristics of Rhodothermus marinus DSM 4252 and Sulfolobus solfataricus during exponential growth on glucose.
Organism Rhodothermus
marinus DSM 4252
Sulfolobus
solfataricus
Growth rate 0.51 ± 0.03 h-1 0.081 h-1
Biomass yield 0.38 ± 0.03 gDW/g 0.20 gDW/g
Glucose uptake rate 7.5 mmol/gDW/h 2.2 mmol/gDW/h
The specific growth rate of R. marinus was 0.51 ± 0.03 h-1 (doubling time 80
min). For S. solfataricus, the growth rate was slower, 0.082 h-1 (doubling time 513
min) for growth on glucose. The biomass yields were 0.38 ± 0.03 gDW/g and 0.20
gDW/g for R. marinus and S. solfataricus respectively.
12
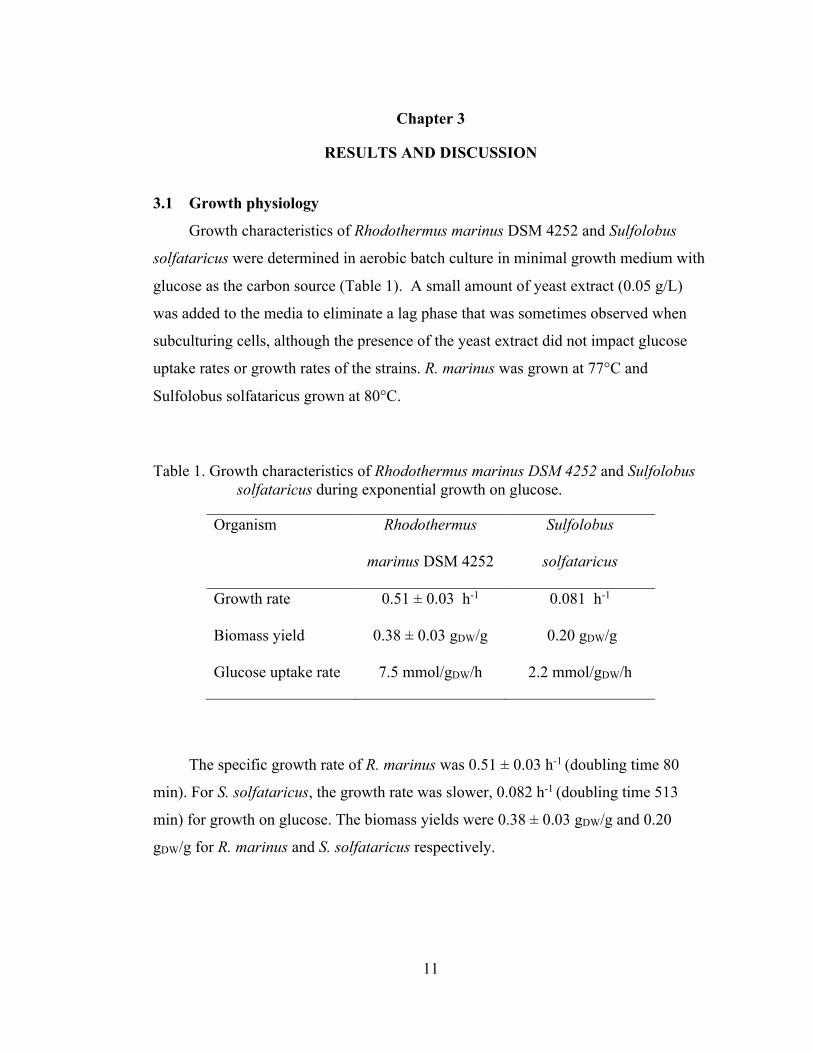
S. solfataricus’ ability to grow on multiple sugars, as well as its ability to co-
utilize carbon sources was evaluated. The tolerance of the strain to high substrate
concentrations was evaluated. For glucose, medium concentrations evaluated were 10,
20, 50, and 100mM. For growth on xylose, the evaluated concentrations were 12, 24,
60, and 120mM. The results of the growth can be observed in Figure 2 below.
Figure 2. Growth Rate vs. Concentration data for S.solfataricus utilizing glucose (left) and xylose (right)
The graphs above indicate that S. solfataricus is able to maintain growth at high
concentrations, with optimal growth occurring at 10mM and 12mM for glucose and
xylose respectively. The data also indicates that optimal growth on xylose occurs at a
rate equal to that of glucose. In addition to concentration tolerance testing, growth
experiments were carried out to evaluate the potential for co-utilization of glucose and
xylose. The experiments were run with glucose to xylose ratios of 1:2, 1:4, 1:10. The
results of the experiment showed growth at all ratios, with the 1:2 concentration
growth rate similar to that of growth of a single carbon substrate. The resulting data
and growth rates associated with these experiments can be found in the appendix.
Growth characteristics of Thermobifida fusca were determined via aerobic
growth in shake flasks, with cellulose as the main carbon source. The cellulose used in
this experiment is a by-product of the growth of the organism K.xylinus. Using growth
medium containing 18.2 g/L of 13C-glucose, K.xylinus was able to be used to obtain
13
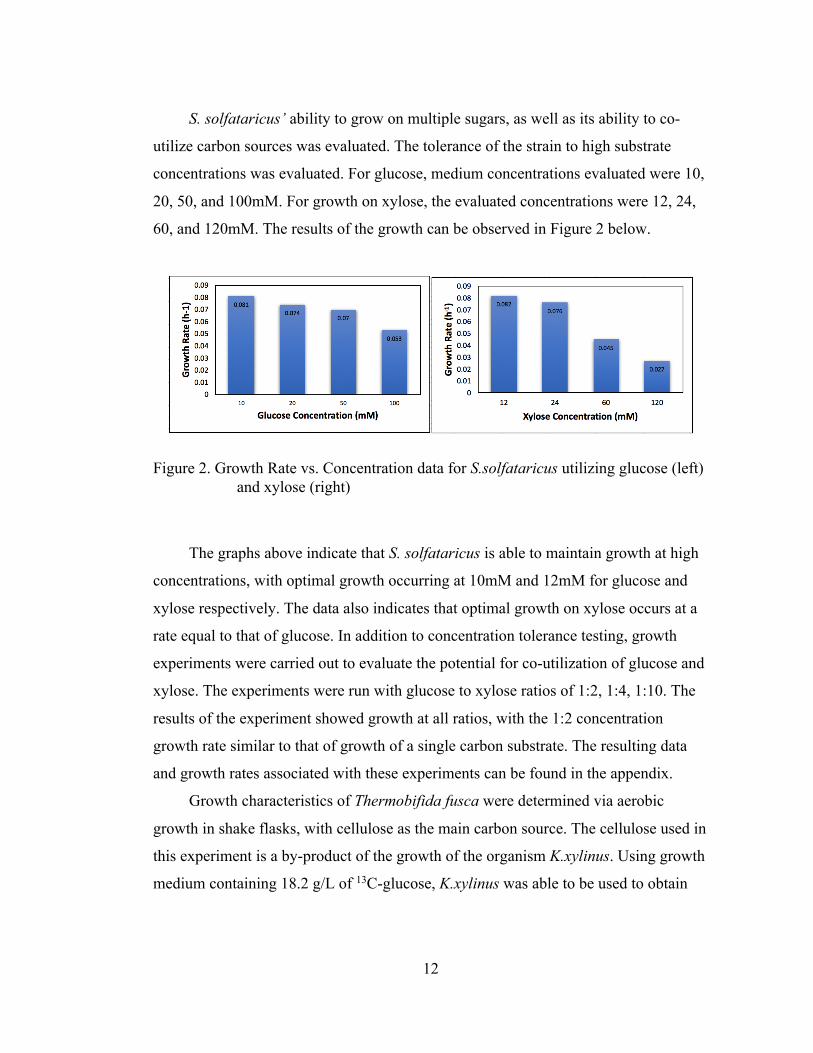
13C-cellulose to be used in tracer experiments. Figure 3 below shows time lapse
images of T.fusca growth. Part A shows the cellulosic matrix with K.xylinus cells. B
shows the culture washed with trypsin, which is used to eliminate the K.xylinus cells.
C shows the cellulose being washed with water. D, E, and F show the growth of cells
as they degrade the cellulose. As the cellulose appears to degrade, the presence of
more cellular ‘clumps’ can be observed.
Figure 3. Progression of the growth of T.fusca beginning with cellulose generation (A), Trypsin wash (B), Water wash (C), and cellular growth (D,E,F)
3.2 Metabolic Model Reconstruction
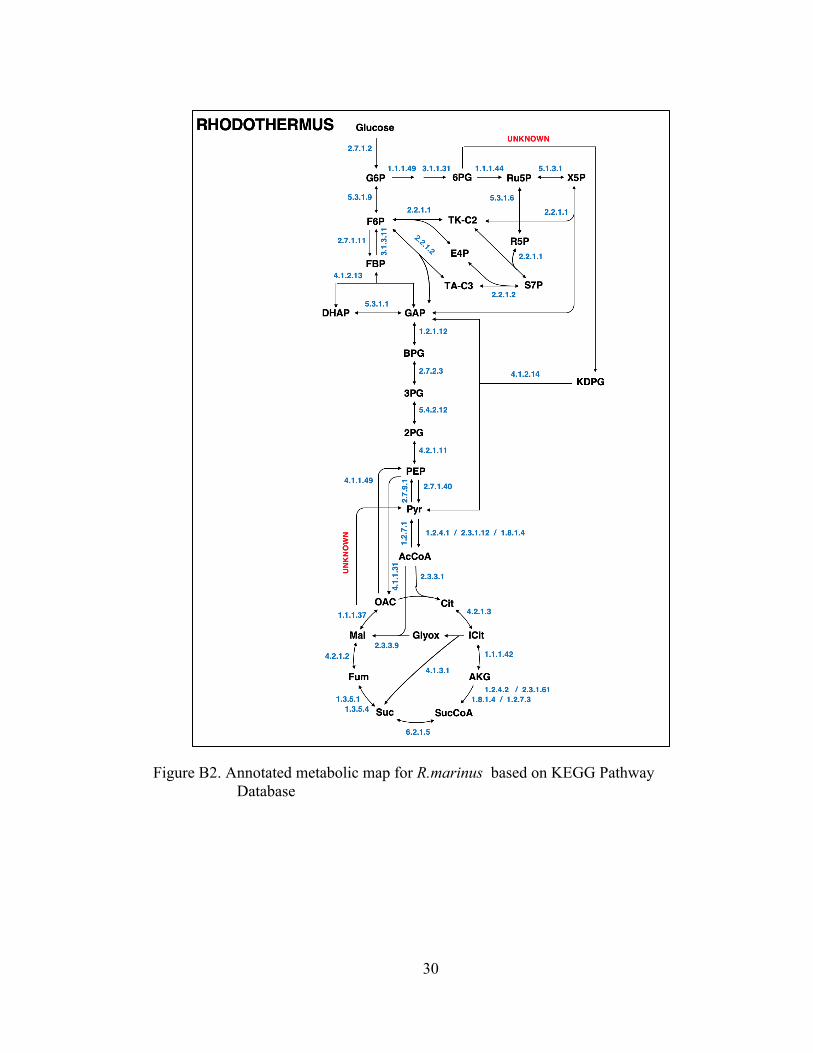
Models of core metabolism were developed for the three organisms based on
reactions annotated in the KEGG and BioCyc databases. Metabolic network models
play a crucial role in metabolic engineering and systems biology as they are the basis
for wide range of computational design and analysis approaches, including metabolic
14
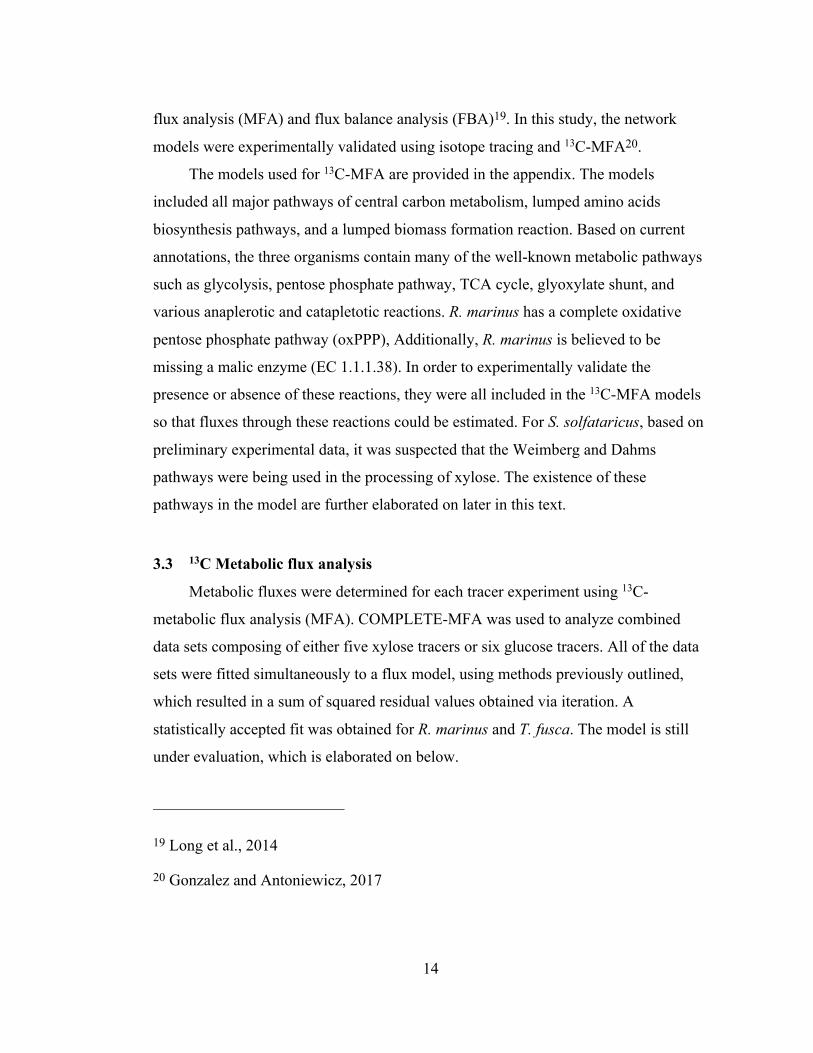
flux analysis (MFA) and flux balance analysis (FBA)19. In this study, the network
models were experimentally validated using isotope tracing and 13C-MFA20.
The models used for 13C-MFA are provided in the appendix. The models
included all major pathways of central carbon metabolism, lumped amino acids
biosynthesis pathways, and a lumped biomass formation reaction. Based on current
annotations, the three organisms contain many of the well-known metabolic pathways
such as glycolysis, pentose phosphate pathway, TCA cycle, glyoxylate shunt, and
various anaplerotic and catapletotic reactions. R. marinus has a complete oxidative
pentose phosphate pathway (oxPPP), Additionally, R. marinus is believed to be
missing a malic enzyme (EC 1.1.1.38). In order to experimentally validate the
presence or absence of these reactions, they were all included in the 13C-MFA models
so that fluxes through these reactions could be estimated. For S. solfataricus, based on
preliminary experimental data, it was suspected that the Weimberg and Dahms
pathways were being used in the processing of xylose. The existence of these
pathways in the model are further elaborated on later in this text.
3.3 13C Metabolic flux analysis
Metabolic fluxes were determined for each tracer experiment using 13C-
metabolic flux analysis (MFA). COMPLETE-MFA was used to analyze combined
data sets composing of either five xylose tracers or six glucose tracers. All of the data
sets were fitted simultaneously to a flux model, using methods previously outlined,
which resulted in a sum of squared residual values obtained via iteration. A
statistically accepted fit was obtained for R. marinus and T. fusca. The model is still
under evaluation, which is elaborated on below.
19 Long et al., 2014
20 Gonzalez and Antoniewicz, 2017
15
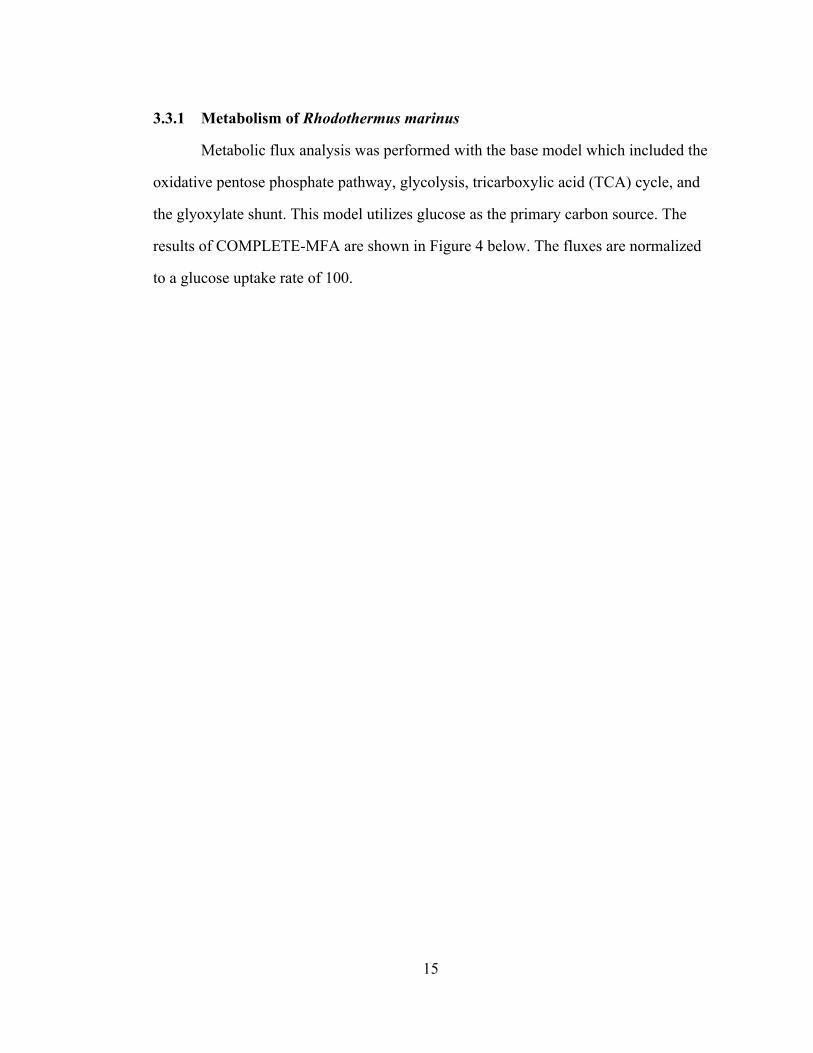
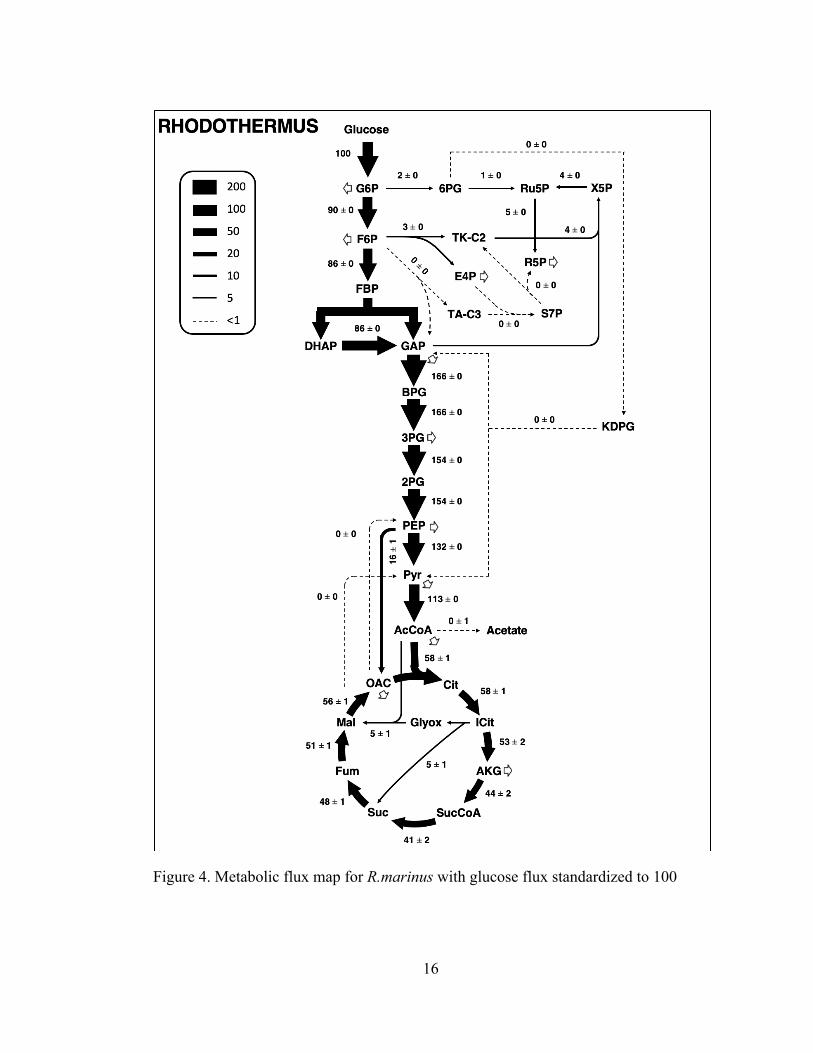
3.3.1 Metabolism of Rhodothermus marinus
Metabolic flux analysis was performed with the base model which included the
oxidative pentose phosphate pathway, glycolysis, tricarboxylic acid (TCA) cycle, and
the glyoxylate shunt. This model utilizes glucose as the primary carbon source. The
results of COMPLETE-MFA are shown in Figure 4 below. The fluxes are normalized
to a glucose uptake rate of 100.
16
Figure 4. Metabolic flux map for R.marinus with glucose flux standardized to 100
17
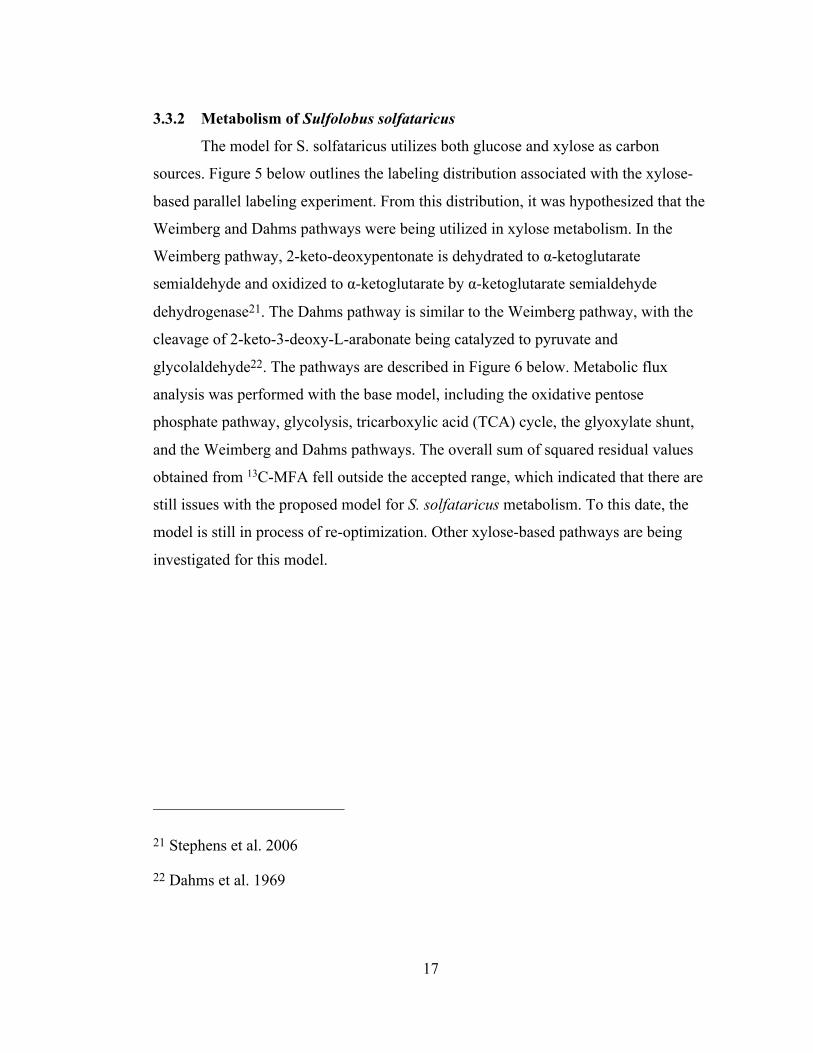
3.3.2 Metabolism of Sulfolobus solfataricus
The model for S. solfataricus utilizes both glucose and xylose as carbon
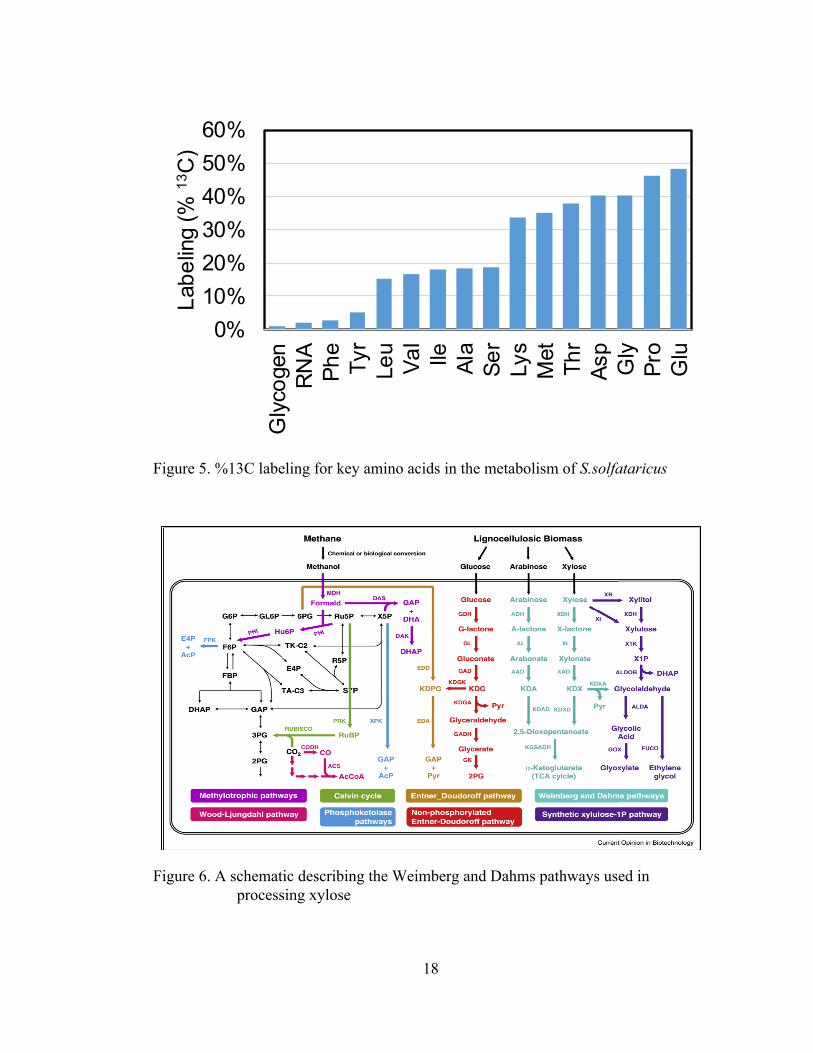
sources. Figure 5 below outlines the labeling distribution associated with the xylose-
based parallel labeling experiment. From this distribution, it was hypothesized that the
Weimberg and Dahms pathways were being utilized in xylose metabolism. In the
Weimberg pathway, 2-keto-deoxypentonate is dehydrated to α-ketoglutarate
semialdehyde and oxidized to α-ketoglutarate by α-ketoglutarate semialdehyde
dehydrogenase21. The Dahms pathway is similar to the Weimberg pathway, with the
cleavage of 2-keto-3-deoxy-L-arabonate being catalyzed to pyruvate and
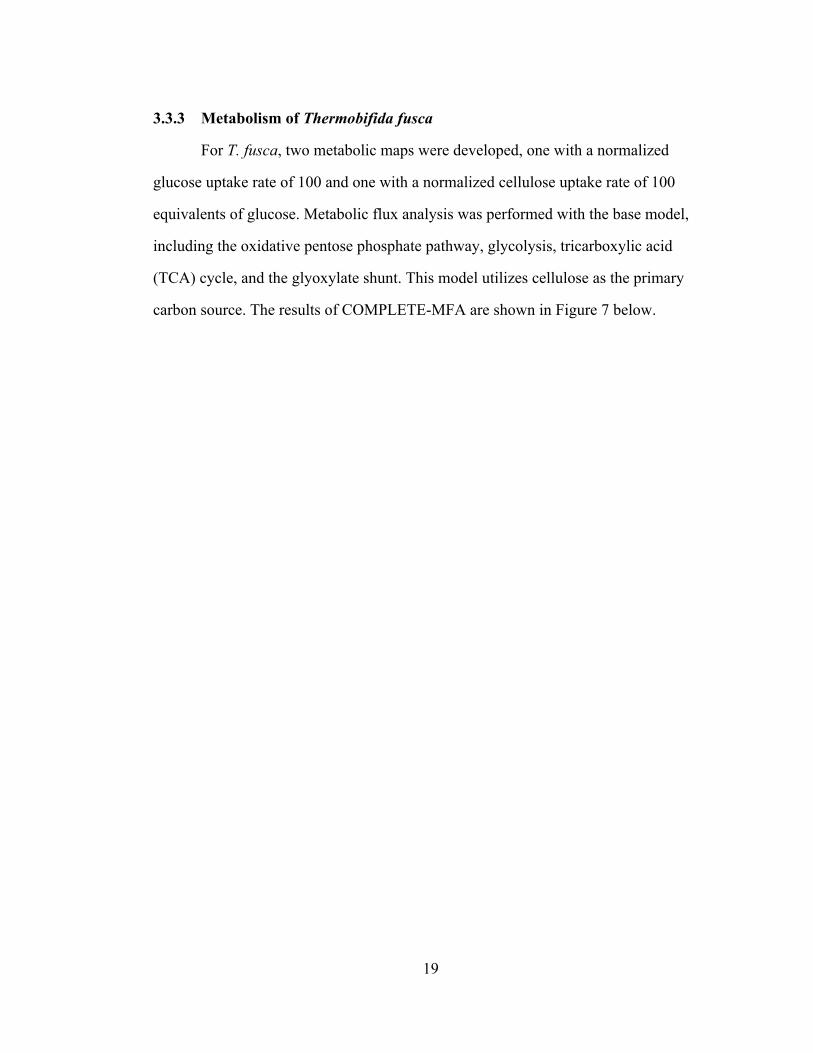
glycolaldehyde22. The pathways are described in Figure 6 below. Metabolic flux
analysis was performed with the base model, including the oxidative pentose
phosphate pathway, glycolysis, tricarboxylic acid (TCA) cycle, the glyoxylate shunt,
and the Weimberg and Dahms pathways. The overall sum of squared residual values
obtained from 13C-MFA fell outside the accepted range, which indicated that there are
still issues with the proposed model for S. solfataricus metabolism. To this date, the
model is still in process of re-optimization. Other xylose-based pathways are being
investigated for this model.
21 Stephens et al. 2006
22 Dahms et al. 1969
18
Figure 5. %13C labeling for key amino acids in the metabolism of S.solfataricus
Figure 6. A schematic describing the Weimberg and Dahms pathways used in processing xylose
0%10%20%30%40%50%60%
Gly
coge
nR
NA
Phe
Tyr
Leu
Val
Ile Ala
Ser
Lys
Met Thr
Asp
Gly
Pro
Glu
Labe
ling
(% 13
C)
19
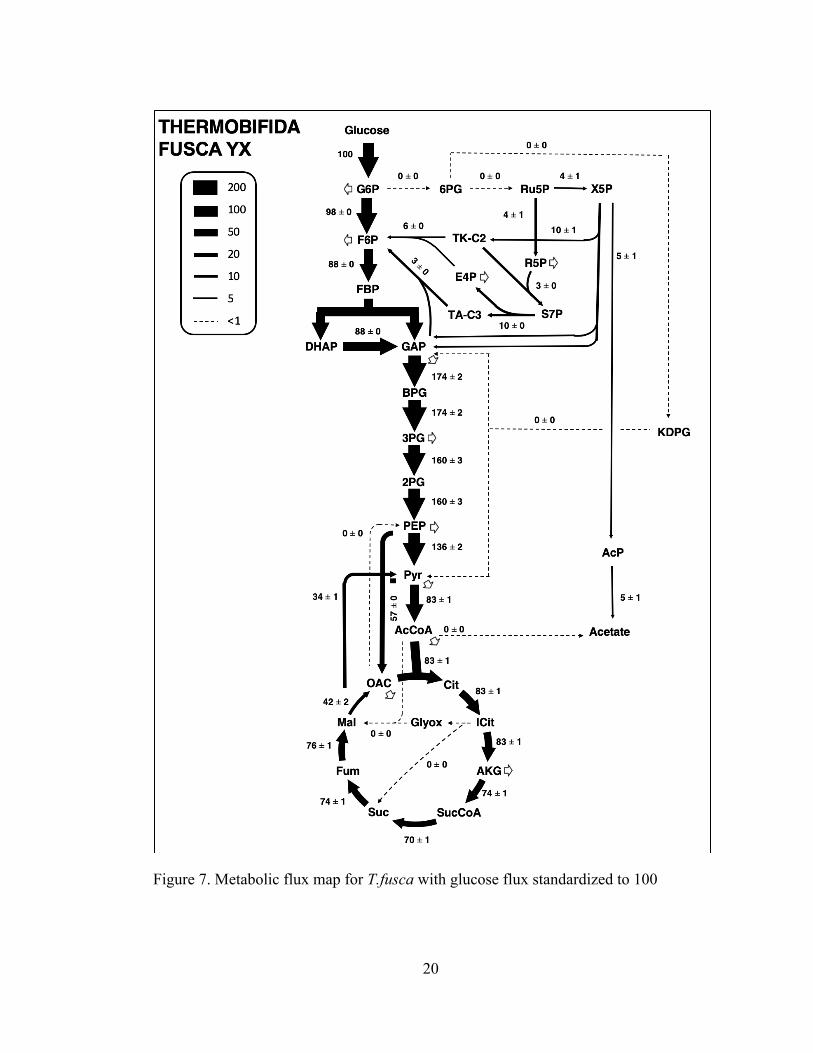
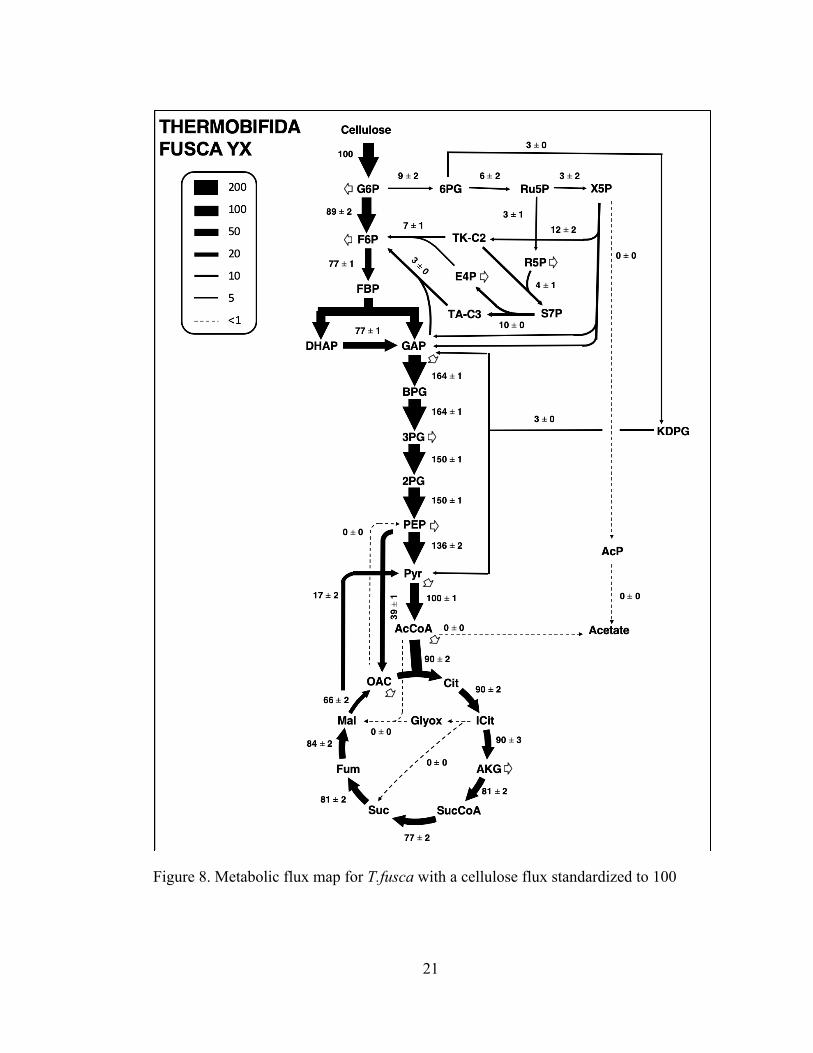
3.3.3 Metabolism of Thermobifida fusca
For T. fusca, two metabolic maps were developed, one with a normalized
glucose uptake rate of 100 and one with a normalized cellulose uptake rate of 100
equivalents of glucose. Metabolic flux analysis was performed with the base model,
including the oxidative pentose phosphate pathway, glycolysis, tricarboxylic acid
(TCA) cycle, and the glyoxylate shunt. This model utilizes cellulose as the primary
carbon source. The results of COMPLETE-MFA are shown in Figure 7 below.
20
Figure 7. Metabolic flux map for T.fusca with glucose flux standardized to 100
21
Figure 8. Metabolic flux map for T.fusca with a cellulose flux standardized to 100
22
Chapter 4
CONCLUSIONS
4.1 Conclusion
Understanding how cells process carbon substrates and how they secrete
accompanying by-products of metabolism allows for better utilization and application
of these microbes in practice. This research can be in relation to and applied to a
variety of applications over a range of topic areas. Improving biotechnology
applications helps not only industry but has a large impact on the society that is reliant
on the products of industrial efforts.
In this study, attempts were made to elucidate the physiology and metabolism
of three extremely thermophilic organisms, Rhodothermus marinus DSM 4252,
Sulfolobus solfataricus, and Thermobifida fusca using 13C-flux analysis. Initial
analysis helped define key aspects of growth physiology. For example, analysis
revealed Sulfolobus solfataricus’ ability to utilize xylose as efficiently as it utilizes
glucose.
The analysis also allowed for the establishment of a better-defined metabolic
model and flux map relating to the consumption of glucose for Rhodothermus marinus
and the consumption of cellulose for Thermobifida fusca. The 13C-MFA results also
allowed us to resolve many model inconsistencies and fill in gaps in e.g. pathways for
amino acid biosynthesis. For example, citramalate synthase was identified as playing
an important role in the biosynthesis of isoleucine in R. marinus.
4.2 Recommendations for future work
Based on this study, there are a variety of investigations that can be undertaken
as future work. The most apparent of these is further study of Sulfolobus solfataricus.
23
While this study was able to better characterize growth physiology, as well as develop
an annotated metabolic map for the organism, an accurate flux map was not fully
developed. Further investigation into the pathways associated with the processing of
xylose is required. Should the results of further investigation result in similar model
issues to that in this study (sum of squared residuals outside the accepted fit) the
original experiments may need to be repeated to validate experimental data.
In addition to increased study on S. solfataricus, scale-up experiments can be
utilized to better understand the industrial applications of the organisms. Batch or
semi-batch cultures can be run using a control system, which will begin to show cell
tolerance to aspects like high cell densities, microaerobic conditions, impeller speed,
foaming, or general mixing issues.
Finally, the methodologies and analysis tools discussed in this study can be
applied to other thermophilic organisms that can process carbon substrates like
glucose, xylose, or cellulose. There are even tools and analysis methods that can
investigate systems with more than one organism. Overall, further investigation into
potentially useful organisms and co-cultures of multiple organisms, as well as shared
environments can generate results to aid industry and benefit society.
24
REFERENCES
1. Cipolla RM, Cordova LT, Swarup A, Long CP, Antoniewicz MR, 13C-Flux analysis of three divergent extremely Thermophilic bacteria: Geobacillus sp. LC300, Thermus thermophilus HB8, and Rhodothermus marinus DSM 4252, Metab Eng, 44: 182-190, 2017
2. Long CP, Gonzalez JE, Cipolla RM, Antoniewicz MR, Metabolism of the fast-growing bacterium Vibrio natriegens elucidated by 13C metabolic flux analysis, Metab Eng, 44: 191-197, 2017
3. Swarup, A., Lu, J., DeWoody, K. C., Antoniewicz, M. R., 2014. Metabolic network reconstruction, growth characterization and 13C-metabolic flux analysis of the extremophile Thermus thermophilus HB8. Metab Eng. 24, 173-80.
4. Cordova, L. T., Antoniewicz, M. R., 2016. (13)C metabolic flux analysis of the extremely thermophilic, fast growing, xylose-utilizing Geobacillus strain LC300. Metab Eng. 33, 148-57.
5. Long, C. P., Gonzalez, J. E., Sandoval, N. R., Antoniewicz, M. R., 2016b. Characterization of physiological responses to 22 gene knockouts in Escherichia coli central carbon metabolism. Metab Eng. 37, 102-113.
6. Gonzalez, J.E., Antoniewicz, M.R., 2017. Tracing metabolism from lignocellulosic biomass and gaseous substrates to products with stable-isotopes. Curr. Opin. Biotechnol. 43, 86–95.
7. Antoniewicz, M. R., Kelleher, J. K., Stephanopoulos, G., 2007a. Accurate assessment of amino acid mass isotopomer distributions for metabolic flux analysis. Anal Chem. 79, 7554-9.
8. Antoniewicz, M. R., Kelleher, J. K., Stephanopoulos, G., 2011. Measuring deuterium enrichment of glucose hydrogen atoms by gas chromatography/mass spectrometry. Anal Chem. 83, 3211-6.; Sandberg, T. E., Long, C. P., Gonzalez, J. E., Feist, A. M., Antoniewicz, M. R., Palsson, B. O., 2016. Evolution of E. coli on [U-13C]Glucose Reveals a Negligible Isotopic Influence on Metabolism and Physiology. PLoS One. 11, e0151130.
9. Crown, S. B., Marze, N., Antoniewicz, M. R., 2015. Catabolism of Branched Chain Amino Acids Contributes Significantly to Synthesis of Odd-Chain and Even-Chain Fatty Acids in 3T3-L1 Adipocytes. PLoS One. 10, e0145850.
25
10. Long, C. P., Au, J., Gonzalez, J. E., Antoniewicz, M. R., 2016a. 13C metabolic flux analysis of microbial and mammalian systems is enhanced with GC-MS measurements of glycogen and RNA labeling. Metab Eng. 38, 65-72.; McConnell, B. O., Antoniewicz, M. R., 2016. Measuring the Composition and Stable-Isotope Labeling of Algal Biomass Carbohydrates via Gas Chromatography/Mass Spectrometry. Anal Chem. 88, 4624-8.
11. Fernandez, C. A., Des Rosiers, C., Previs, S. F., David, F., Brunengraber, H., 1996. Correction of 13C mass isotopomer distributions for natural stable isotope abundance. J Mass Spectrom. 31, 255-62.
12. Caspi, R., Altman, T., Dreher, K., Fulcher, C.A., Pallavi, S., Keseler, I.M., Kothari, A., Krummenacker, M., Latendresse, M., Mueller, L.A., Ong, Q., Paley, S., Pujar, A., Shearer, A.G., Travers, M., Weerasinghe, D., Zhang, P., Karp, P.D., 2012. The MetaCyc database of metabolic pathways and enzymes and the BioCyc collection of pathway/genome databases. Nucleic Acids Res. 40, D472–D753.; Kanehisa, M., Goto, S., Sato, Y., Furumichi, M., Tanabe, M., 2012. KEGG for integration and interpretation of large-scale molecular data sets. Nucleic Acids Res. 40, 109–114.; Kanehisa, M., Goto, S., 2000. KEGG: Kyoto encyclopedia of genes and genomes. Nucleic Acids Res. 28, 27–30.
13. Antoniewicz, M. R., Kraynie, D. F., Laffend, L. A., Gonzalez-Lergier, J., Kelleher, J. K., Stephanopoulos, G., 2007c. Metabolic flux analysis in a nonstationary system: fed-batch fermentation of a high yielding strain of E. coli producing 1,3-propanediol. Metab Eng. 9, 277-92.
14. Leighty, R. W., Antoniewicz, M. R., 2012. Parallel labeling experiments with [U-13C]glucose validate E. coli metabolic network model for 13C metabolic flux analysis. Metab Eng. 14, 533-41.
15. Yoo, H., Antoniewicz, M.R., Stephanopoulos, G., Kelleher, J.K., 2008. Quantifying reductive carboxylation flux of glutamine to lipid in a brown adipocyte cell line. J. Biol. Chem. 283, 20621–7.
16. Antoniewicz, M. R., Kelleher, J. K., Stephanopoulos, G., 2007b. Elementary metabolite units (EMU): a novel framework for modeling isotopic distributions. Metab Eng. 9, 68-86.
17. Antoniewicz, M. R., Kelleher, J. K., Stephanopoulos, G., 2006. Determination of confidence intervals of metabolic fluxes estimated from stable isotope measurements. Metab Eng. 8, 324-37.
26
18. Antoniewicz, M. R., 2015. Parallel labeling experiments for pathway elucidation and 13C metabolic flux analysis. Curr Opin Biotechnol. 36, 91-97.
19. Long, C. P., Antoniewicz, M. R., 2014. Metabolic flux analysis of Escherichia coli knockouts: lessons from the Keio collection and future outlook. Curr Opin Biotechnol. 28, 127-33.
20. Gonzalez, J.E., Long, C.P., Antoniewicz, M.R., 2017. Comprehensive analysis of glucose and xylose metabolism in Escherichia coli under aerobic and anaerobic conditions by 13C metabolic flux analysis. Metab. Eng. 39, 9–18.
21. Stephens, C., Christen, B., Fuchs, T., Sundaram, V., Watanabe, K., & Jenal, U. (2006). Genetic Analysis of a Novel Pathway for D-Xylose Metabolism in Caulobacter crescentus. Journal of Bacteriology,189(5), 2181-2185. doi:10.1128/jb.01438-06
22. Dahms, A., & Anderson, R. (1969). 2-Keto-3-deoxy-L-arabonate aldolase and its role in A new pathway of L-arabinose degradation. Biochemical and Biophysical Research Communications,36(5), 809-814. doi:10.1016/0006-291x(69)90681-0
27
Appendix A
DATA FROM S.SOLFATARICUS CO-UTILIZATION EXPERIMENTS
Figure A1. LN(OD600) vs. Time for a S.solfataricus strain with 1:2 glucose to xylose ratio
2 g/L Xylose, 1 g/L Glucose
28
Figure A2. LN(OD600) vs. Time for a S.solfataricus strain with 1:4 glucose to xylose ratio
Figure A3. LN(OD600) vs. Time for a S.solfataricus strain with 1:10 glucose to xylose ratio
2 g/L Xylose, 0.5 g/L Glucose
2 g/L Xylose, 0.2 g/L Glucose
29
Appendix B
ANNOTATED CENTRAL CARBON METABOLISMS
Figure B1. Annotated metabolic map for T.fusca based on KEGG Pathway Database
30
Figure B2. Annotated metabolic map for R.marinus based on KEGG Pathway Database
31
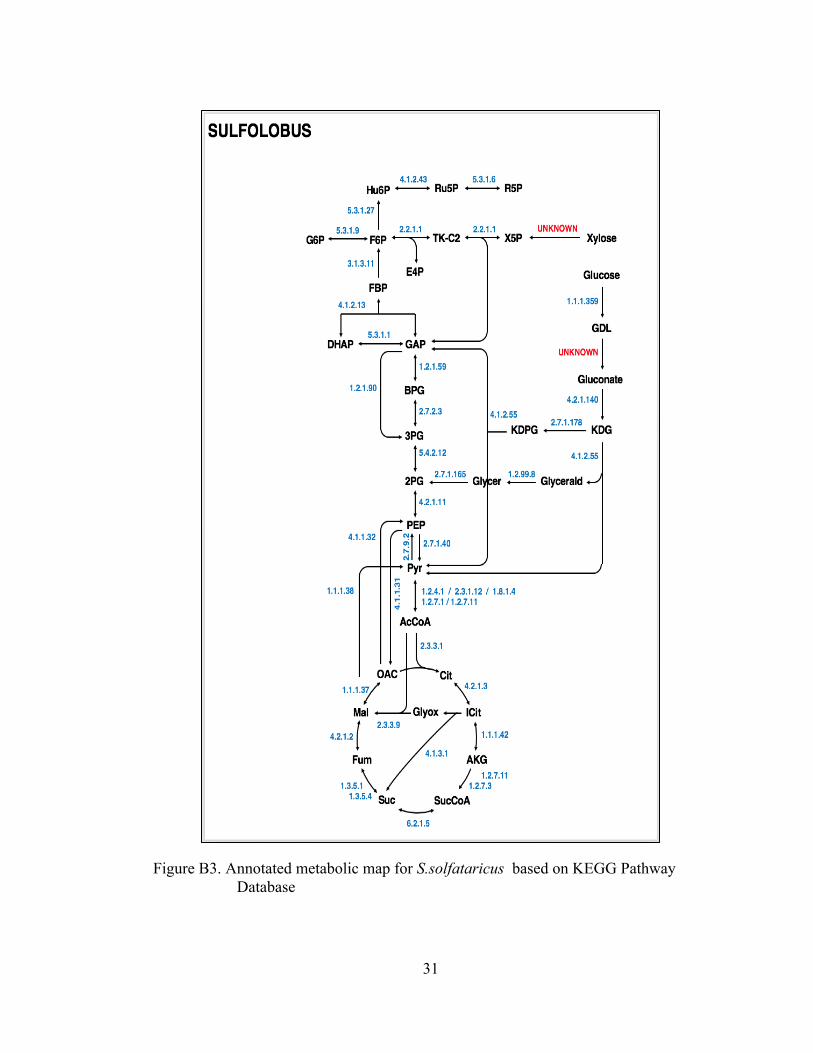
Figure B3. Annotated metabolic map for S.solfataricus based on KEGG Pathway Database