A Novel Technique for using Polymers as Optical Interconnects and Sensors for Biological Recognition by SEEMA DEEPAK YARDI DEPARTMENT OF ELECTRONICS AND COMMUNICATION ENGINEERING Submitted in fulfilment of the requirements of the degree of DOCTOR OF PHILOSOPHY to the MALAVIYA NATIONAL INSTITUTE OF TECHNOLOGY JAIPUR, INDIA August 2016
Transcript
A Novel Technique for using Polymers as Optical Interconnects and Sensors for
Biological Recognition
by SEEMA DEEPAK YARDI
DEPARTMENT OF ELECTRONICS AND COMMUNICATION ENGINEERING
Submitted in fulfilment of the requirements
of the degree of
DOCTOR OF PHILOSOPHY to the
MALAVIYA NATIONAL INSTITUTE OF
TECHNOLOGY JAIPUR, INDIA
August 2016
Dedicated in the name of Lord Shriganeshji,
to my father Late Prof. G. S. Pandit
& my mother Smt. Asha G. Pandit …
ii
Acknowledgement
I wish to thank AICTE, Department of Technical Education [M.S.],
Principals of Government Polytechnic, Mumbai and Aurangabad, Shri. D.P. Nathe
and Dr. Prashant Pattalwar for giving me this opportunity to pursue Ph.D. under QIP
(Poly) Scheme.
I sincerely thank authorities of both MNIT, Jaipur and IIT, Kanpur for
allowing me to work in their various laboratories and facilities. I thank my thesis
supervisor Dr. D. Boolchandani Sir for his consistent, all encompassing and
unconditional support in all the research related activities. His understanding,
encouraging and positive approach towards my work has enabled me to complete
this journey. I wish to express my deep sense of gratitude for always providing a
guiding light to me.
My joint supervisor, Dr. Shantanu Bhattacharya Sir, is the force behind
fabricating and shaping my research objectives into a novel implemented method of
optical sensing. His constructive and disciplinary instructions, criticism has oriented
my way of thinking Suitable for research methodologies. I am extremely thankful
for his uncompromising, unbiased and relentless support, participation in achieving
my research goals and always wish to remain in his debt for giving this opportunity
of lifetime to work under his guidance, in this esteem Institute.
I wish to express my deep sense of gratitude towards all the Staff members
of ECE department of MNIT Jaipur Dr. Vineet Sahula, Dr. Mohammad Salim,
Dr. Vijay Janyani, Dr. M.M. Sharma, Dr. K.K.Sharma, Dr. Perisamy, Dr. Samar
Ansari. I wish to thank Dr. A.B. Gupta Sir for his timely support.
My colleagues from ECE, MNIT, Nikhil Gupta, Sanjeev Methya, Janrao sir,
Amit, Priti, Jyoti Dr. Lokesh, Dr. Renu, Arun have helped me during my initial days
at MNIT, I wish to acknowledge their help. I wish to thank my colleagues from
2.6 Optical Signal Coupling Using Polymer Elliptical Microsleeve: SIMULATION
13
2.7 Result and Analysis 16
2.7.1 Simulation results 16
2.7.2 Calculations at WGM condition 16
2.7.3 Graphs of total energy profile over the spectrum 17
2.7.4 Graph of energy density time average value 17
2.8 Future Scope 19
2.9 Conclusion 19
Reference 19
xi
Chapter/ Section No.
Details Page No.
3 Laser Heat Transmission For High Efficiency Bonding Of Two Optical Fibers Using SU8 Microdroplet
21-64
3.1 Introduction 21
3.2 Lab-on-Chip 22
3.2.1 Merits of Miniaturization 24
3.2.2 Limitations of Miniaturization 24
3.3 Methods of Microfabrication 24
3.3.1 Laser Micromachining 24
3.3.2 Photolithography 25
3.3.3 Soft Lithography 25
3.4 Types of Optical Signal Coupling 26
3.4.1 Tapered signal coupler 27
3.4.2 Grating coupler 28
3.4.3 Optical Fiber Splicing 29
3.5 Epilog Laser machine 30
3.6 SU8 as bonding material 31
3.7 Design of Experiments [DOE] 32
3.8 COMSOL Simulation 32
3.8.1 Laser Heat transmission Coupling 33
3.8.2 Effect of Heating on Optical property 34
3.8.3 Whispering gallery mode [WGM ]based Optical signal coupling between two fibers
34
3.9 Measurement of optical properties –Spectra Suite Ocean Optics software
34
3.10 Related Work – Literature Survey 35
3.11 Laser Heat transmission Based Bonding of Optical Fibers Using SU8
37
3.11.1 Experimental procedures 38
3.11.1.1 SU8 microdrop dispensing on fibers set for bond formation 39
3.11.2 Laser heat treatment 40
3.11.3 COMSOL Simulation for modeling Laser heat transmission 41
3.11.4 COMSOL multiphysics simulation for modeling the whispering gallery mode WGM
43
xii
Chapter/ Section No.
Details Page No.
3.11.5 Fabrication of optical waveguides 44
3.11.6 Measurement of % Transmittance across the coupling 47
3.11.7 Measurement of absorptivity of SU8 48
3.11.8 Calculating the SU8 droplet Volume 49
3.12 Result and Analysis 50
3.12.1 Optimization of Machining Parameter 50
3.12.2 COMSOL simulations for Laser heat transfer 52
3.12.3 Calculating microvolume and absorptivity of SU8 microdroplet 54
3.12.4 Simulation of WGM using COMSOL modeling 55
3.12.5 Measurement of optical transmittance in a test set up 57
3.13 Future Scope 59
3.14 Conclusion 59
Reference 60
4 Interaction of Biomolecules with Solid Polymeric Surfaces of SU8 Microdroplet and Porous Fluorescent PDMS: Its Utility in Optical Bio-sensing
65-108
4.1 Introduction
A Polymer- SU8
B Polymer- Fluorescent PDMS
65
A Exploring use of Biocompatible photoresist SU8 material as a biosensor
4.2 Need to Study Interaction of Biomolecules on Solid Surfaces 68
4.3 Solid Polymeric Surface modification for Biomolecule Interaction
69
4.4 Surface Modification Techniques of Solid Polymeric Surfaces
72
4.5.1 Need to Explore Polymeric Sensors 74
4.5.2 Related Work 74
4.6 Steps involved in fabrication of an optical biosensor connector
76
4.6.1 SU8 Microdroplet used as WGM Resonating sensor 76
4.6.2 Fabrication of SU8 Microdroplet Sensors [Laser or UV] 78
4.6.3 Extraction of SU8 microdroplets from Substrate 79
4.6.4 Surface immobilization 80
xiii
Chapter/ Section No.
Details Page No.
4.6.5 Characterization of the Microdroplet Sensors 81
4.7 Some Elementary Results and Analysis a. Fabrication of SU8 microdroplets
b. SU8 Microdroplet dispensed using micropipette and syringe
c. Fabrication of fiber bonded SU8 microdroplet [CO2 Laser exposure]
d. Fabrication of fiber bonded SU8 microdroplet [UV exposure]
e. Extraction of SU8 microdroplets
f. Surface immobilization
81
B. Porous Polydimethyl Siloxane- Acridine Orange as Biomaterial
4.8 Introduction 86
4.9 Literature Survey 89
4.10 Porous PDMS- AO as a Biomaterial in Opto-Biosensing 91
4.10.1 Experimental Procedure 92
4.10.2 Instruments and tests 93
4.11 Result and Analysis
A. Physical Observation
B. SEM images
C. Ocean Optics SpectraSuite characterization
D. UV-VIS Spectrometer readings
E. NIKON Fluorescence Microscope Tests
93
4.12 Conclusion 97
4.13 Future Scope 97
Reference 98
List of Publications
Bio-Data
Appendix
xiv
List of Figures
Fig. No.
Details of Figure Page No.
2.1 Whispering gallery modes (a) inside St. Paul Cathedral (b) Schematic of the gallery (c) and (d) whispering gallery modes represented by eigenmode profiles
9
2.2 Free spectral range [FSR] and Full width half max [FWHM] for a WGM for modes 1,2..n inside a resonator
11
2.3 Schematic diagram of (a) Ring resonator (b)(c)(d) designs of elliptical microsleeve bond
14
2.4 Simulation of (a) optical ring resonator (b), (d) electric field and WGM inside two models of elliptical microsleeve (c) signal coupling and propagation
16
2.5 Signal coupling and WGM at wavelength (a)Large contrast : 2.6µm [115.25THz] with ( b) power graph (c) Small contrast : 515.15 nm [582THz]
18
2.6 Signal coupling and WGM at wavelength (a) 493nm [ 608THz] (b) 574.7nm [522THz] (c) 655nm [458 THz ] with Low Contrast.
18
3.1 Images of two categories of lab-on-chips.(a) microfluific chip [Lab-On-Chip] (b) Microfluidic system with multipurpose programmable controller chip.
23
3.2 Schematic diagrams of fiber coupling and causes of losses (a) Fibers with different Numerical apertures (b) Core concentricity (c) Core diameter mismatch (D1>D2) (d) Linear gap between two fibers/ waveguides.
27
3.3 Techniques used to minimise coupling losses (a) schematic diagram of a tapered coupler used to couple optical signal from fiber to SOI (b) SEM image showing coupler stack layers with parabolic index profile (c)SOI waveguide and mode converter cross section
28
3.4 Coupling between optical fiber and SOI waveguide (a) schematic of waveguide diffractive grating coupler (b) SEM image of varied coupling strength grating coupler
29
3.5 Various optical fiber-to-fiber splicing techniques (a) (b) (c) Schematic diagram of Arc fusion of two optical fibers (d) Mechanical-fiber-to-fiber splice.
30
xv
Fig. No.
Details of Figure Page No.
3.6 Schematic diagram of test setup for measurement of % optical signal transmittance
35
3.7 Fibers set, aligned, spaced before and after mocrodroplet dispensing (a) Before dispensing of microdroplet at the circle position on the misaligned fibers (b) Before dispensing of microdroplet at the circle position on the aligned fibers (c) After dispensing of the microdroplet circling the fiber joint.
39
3.8 (a) a visible spot on fiber covered with SU8 droplet after laser heat transfers without optimization of machine parameters (b) a highly optimized laser heat transmission procedure for bonding two optical fibers with SU8 microdroplet
41
3.9 Simulation of laser heat transmission process for a moving laser exposing along a circular path on a 10 microns thick patterned SU8 layer.
43
3.10 Fiber bonding (a) the schematic diagram for coupling between two pairs of optical fibers using the SU8 microdrop along with a SU8-waveguide-fibers coupling, (b) shows various stages of optimization of laser machining with the optical micrographs of the laser tagged micro-droplet surfaces for the fiber/ fiber joints
45
(c) Volume Measurements of microdrop 49
3.11 The design of experiments [DOE] results indicating the transmission as output with speed and power as input parameters.
51
3.12 The simulation output of bulk temperature of SU8-2025 vs. time in sec of heat treatment
52
3.13 Simulated estimation of effective bi-refringence with respect to distance from the surface for Air/SU8/Si combination
54
3.14 Comparison of absorptivity of SU-8 over Si and glass substrates through experimental results
55
3.15 Simulation output of the aligned case with inter-fiber distance (a) 5.5µm (b) 4.8 micron.
56
3.16 Simulation results showing % Transmittance with respect to inter-fiber distance for (a) Aligned fiber and (b) Misaligned fiber cases
57
3.17 Acquired data through spectra suite software using ocean optics spectrophotometer for (a) Aligned fibers (b) Misaligned fibers
58
4.1 Side chains of the twenty different naturally occurring amino acid chains
70
4.2 Schematic of silanization reaction on polymer surfaces. 74
xvi
Fig. No.
Details of Figure Page No.
4.3 BSA coated microrobots with bioactuators [a] Extraction of selectively BSA coated microcubes [b] Bacteria attached to bottom uncoated side [c] Fluorescent microscope images of bacteria attached to uncoated, selectively BSA coated, BSA whole coated microcubes, [d] Comparison between three configurations on the basis of number of attached bacteria
76
4.4 Silica microsphere for isolating proteins (a) unconjugated silica micro-sphere (b) Protein A conjugated silica microsphere with bound mouse IgG. For visualization of bound biotinylated goat anti-mouse IgG, NeutrAvidinTM conjugated to silica nano-particles doped with FAM dye is used
76
4.5 (a) Micro-sphere developed on the tip of an optical fiber using low power Laser processing (b) Ninhydrin treated biomimetic SU8 microdroplet.
77
4.6 (a) Analyte sensing using SU8 microdroplet in a PDMS well (b) Challenging goal to get a perfect SU8 microsphere
78
4.7 Method of BSA immobilisation on microdroplet [with and without optical fiber] and its applications (a) Microdroplet dispensing (b) UV exposed microdroplets (c) BSA immobilised on microdroplet surfaces (d) Microdroplets detached from substrate with heat treatment and then subjected to stain & dye test
80
4.8 Silica microspheres using (a) and (b) gas flame, (c) CO2 Laser (Gold Thin film coated) (d) CO2 Laser
83
4.9 Microdroplets dispensed using micropipette 83
4.10 CO2 laser heat treated fiber bonded SU8 microdroplet 84
4.11 UV exposed fiber bonded SU8 microdroplet, Inset showing fiber gap of 11µm
84
4.12 SU8 microdroplets extracted from the substrate 85
4.13 UV functionalized bare SU8 microdroplets, selectively immobilized with BSA solution [A1,B1,C1] incubated with E-Coli cells [A2,B2,C2] observed under the microscope.
4.15 Application areas, products of biomaterials. 87
xvii
Fig. No.
Details of Figure Page No.
4.16 Acridine orange interacting differentially amongst base pairs of double-stranded DNA [Green Fluorescence] and denatured DNA bases [Red Fluorescence].
A bent single mode waveguide, upto a certain limit becomes multimodal; if
its core width is increased, same as a straight waveguide. Beyond that the inner
dielectric interface becomes irrelevant and the outer dielectric interface guides the
bent mode, these are whispering gallery modes [WGM]. This phenomenon occurs in
monolithic resonators with curved geometrical shapes like cylinder, ring and sphere.
Conventional resonators used two or more mirrors, [5] to recirculate optical power,
by way of reflection between the highly reflecting, low loss mirrors; to improve
resolution, pathlength or to maintain oscillations. Although high Q quality and
finesses were features of these resonators, they suffered from low stability due to
Chatper-2 Software Simulation: Polymer Waveguide Coupling using Elliptical Microsleeve
9
vibrations at the low operating frequencies, large size and difficulty in assembly,
overall complexity and extremely high costs. Also there were hurdles in the process
of miniaturization of such devices. So the focus shifted to devices with curved,
polygonal surfaces supporting circulating light with total internal reflection. The
circular modes in these monolithic resonators, with high index contrast at the
boundaries, low losses, high –Q, pathlength of curvature in multiples of the
wavelengths, were called whispering gallery modes. Surface imperfections and
material dispersion once controlled, fabrication of these high performance transparent
structures became simpler and cheaper. Due to their small sizes and volume,
stability was good and on chip integration was possible.
Fig. 2.1 Whispering gallery modes (a) dome structure inside St. Paul Cathedral (b) Schematic of the gallery (c) and (d) whispering gallery modes represented by eigenmode profiles.
In 1912 Lord Rayleigh experienced the phenomenon of sound waves in the
form of small whispers, travelling in an oval shape domed St.Paul Cathedral [ figure
2.1 (a)] to have reached a longer distance and clearly heard. Thus the term got the
name whispering gallery waves and the signal modes called whispering gallery
modes. Figure 2.1 shows the St. Paul Cathedral dome like structure and the gallery
where this phenomenon was first observed. Optical signal when inserted at a critical
angle inside a curved surface, it is completely supported by and propagated along
the curved wall of the structure by total internal reflection. Curved surfaces like
Chatper-2 Software Simulation: Polymer Waveguide Coupling using Elliptical Microsleeve
10
micro-spheres support modes with radial, axial and polar fields which demand
complicated analysis. Further modifications in the spherical structure like in case of
ellipsoidal, hemispherical structures the analysis becomes even more complex.
Inside the curved surface a resonance like condition occurs when after one
roundtrip, the waves return with the same angle of incidence, at the same point and
with the same phase, to form a constructive interference similar to standing waves.
The performance of WGM resonator is best analysed with the following parameters:
1. Optical path length L = CE *neff .............................................................................. 2.1
= ŋ*λr
Where CE is circumference of ellipse with a1, b1 as major and minor radii,
neff is effective refractive index of waveguide material, ŋ is mode number of
the resonator, λr is wavelength at resonance.
2. Free spectral range [FSR].................................................................................2.2
υFSR = υx - υx+1 ….... υx frequency of x mode
= C/(2Пr* neff) Hz …… C is speed of light
3. Finesse is a quantity which relates FSR with resonance linewidth or it can
be considered interms of sharpness of the resonance curve
F = 2П (υFSR /δω) .................................................................... 2.3
= 2П * Q(υFSR /ωr)
4. Q-factor which is the ratio of time averaged energy in the cavity to the
energy loss per cycle.
Q = ωr * (stored energy / power loss) ….. ωr angular resonance
Where ω= angular frequency of the incident signal, σ = conductivity [S/m], εr = (
n-ik) 2 is relative permittivity [F/m] (where ‘n’ is real part and ‘k’ is complex part
of the refractive index of the material ), µr is relative permeability [H/m] (both εr
and µr are with respect to the permittivity and permeability of free space, ε0 and µ0
respectively), K0 is the wave number of free space represented by the following:
� � ��� � � ���
� !". #��$ ..................................
………….(2.7)
Where c1 = Speed of light in vacuum [3 x 10⁸m/s ].
% � &�'
∆& ……………………..(2.8)
Where Qo is quality factor, f0r is resonance frequency, ∆f is 3-db bandwidth at
resonance.
Qo can be calculated from complex eigen-frequency value, Wr as
% � )*�+'�,-.�+', (2.9)
Chatper-2 Software Simulation: Polymer Waveguide Coupling using Elliptical Microsleeve
16
RSoft simulation using fullwave analysis is implemented for design of figure
2.3 (c). The design ensures proper simulating conditions with perfectly matched
layer and material conditions in this 2-D model. A range of frequencies falling in the
optical spectrum are utilized to observe signal coupling and WGM effect between
two waveguides bonded by an elliptical microsleeve. 2.7 Result and Analysis
2.7.1 Simulation results showing ring resonator, microsleeve coupling and WGM
in the frequency range of 1-5THz.
Fig. 2.4 Simulation of (a) optical ring resonator (b), (d) electric field and WGM inside two models of elliptical microsleeve (c) signal coupling and propagation. 2.7.2 Table 2.1 Calculations at WGM condition
Sr. No.
Refractive Index Major axis
multip-lier
Frequency of WGM
[THz]
Frequency of coupling
[THz]
Q factor Decay time
τ[ps] Input
waveguide MS Output
wave guide
1 3 3 1.54 1.5 159.722 162.75 2576.17 2.567
2 1.46 1.67 1.67 1.5 458 458 1145 0.397
As shown in Table 1, the Q- factor and decay time of the WGM energy
stored inside the microsphere and waveguide assembly having refractive indices 3-
3-1.54 for the input waveguide –microdroplet-output waveguide respectively, are
comparable to that with R.I. of 1.46-1.67-1.67 [Silica optical fiber-SU8-SU8]. Inside
SU8 microdroplet the energy circulates for a slightly lower period during the WGM
condition of case 2 at frequency of resonance [low R.I. contrast].
Chatper-2 Software Simulation: Polymer Waveguide Coupling using Elliptical Microsleeve
17
2.7.3 Graphs 2.1 [A & B] of total energy inside the elliptical microsleeve resonator
vs Frequency over full spectrum.
2.1 A. High contrast performance: Peak resonance at [153.75e12Hz],
FSR = 0.55THz.
2.1 B. Total energy profile inside the SU8 microdroplet over the full visible
spectrum [430 THz to 770 THz ]
2.7.4 Graph 2.2 of Energy density time average value inside the elliptical
microsleeve resonator [low index contrast] vs Frequency, 0ver 2.061THz
range, Peak resonance at 458THz [655nm], Q –factor = 1145.
Chatper-2 Software Simulation: Polymer Waveguide Coupling using Elliptical Microsleeve
18
Graph 2.2 Enrgy Density Time Average Value
Fig. 2.5 Signal coupling and WGM at wavelength (a) Large contrast: 2.6µm
[115.25THz] with (b) power graph (c) Small contrast: 515.15 nm [582THz] [RSoft]
Fig. 2.6 Signal coupling and WGM at wavelength (a) 493nm [608THz] (b)
574.7nm [522THz] (c) 655nm [458 THz] with Low Contrast. [COMSOL]
Chatper-2 Software Simulation: Polymer Waveguide Coupling using Elliptical Microsleeve
19
2.8 Future Scope
Once the concept of elliptical microsleeve coupling and its feasibility is
verified using the simulation softwares, the coupling can be experimentally verified
using elliptical microsleeves of different dimensions, sizes, materials. Future scope
is to use this device as an optical coupler as well as a sensor of biological entities.
2.9 Conclusion
Both RSoft and COMSOL Multiphysics software supported the 2D –models
of elliptical microsleeve based coupling of optical fibers and waveguides. There was
high efficiency coupling and WGM phenomenon observed for certain wavelengths.
The performance was checked interms of the simulation graphical results, Q-factor,
electro-magnetic fields, coupling efficiency. Results in Table 1 show that in case 2,
WGM at 458THz, in the polymer waveguide and optical fiber tagged by polymer
microdroplet assembly, Q-factor = 1145, decay time 0.3978 ps. Thus it can be
concluded that polymeric waveguides and microsleeve can be used to couple two
optical waveguides.
Reference
1. G.C. Righini, Y.Dumeige, P. F’eron, M. Ferrari, G. Nunzi Conti, D. Ristic, S.Soria,
“Whispering gallery mode microresonators: Fundamentals and applications”,
Rivista Del Nuovo Cimento 34 7 (2011).
2. A.B.Matsko, A.A. Savchenkov, D. Strekalov, V.S.Ilchenko, L.Maleki, “Review of
applications of whispering gallery mode resonators in photonics and non-linear
optics”, IPN progress report (2005).
3. M.L.Gorodetsky, A.E.Fomin,“ Geometrical theory of whispering gallery modes”,
Coupling Loss = -10 [NA1/ NA2]2..................................................................... (3.2)
Coupling Loss = -10 [D1/ D2]2 .............................................................................
(3.3)
I2 = I1 e –Ad Beer -Lamberts law............................................................... (3.4)
I2(λ) = I1(λ) e –A(λ)d Beer Lambert law as function of λ .......................... (3.5)
Where n2 is refractive index of second fiber core in the joint, Ө2 is the maximum
cone of light half angle for the amount of light to enter or exit, NA1, NA2 Numerical
apertures of first and second waveguide, D1, D2 are diameters of two fiber cores, I1
is intensity of light at the input of first fiber, I2 intensity of light at the output of
second fiber, d is the gap or thickness of material in between input and output fibers/
waveguides, A is the coefficient of linear attenuation [if scattering is ignored, it can
be equated to absorption coefficient in cm-1], λ is wavelength in nm, A(λ) is
Coefficient of linear attenuation which is function of wavelength, I2(λ), I1(λ) are
ouput and input light intensities which are functions of λ, see figure 3.2 .
Chatper-3 Laser Heat Transmission for High Efficiency Bonding of Two Optical Fibers Using SU8 Microdroplet
27
Fig. 3.2 Schematic diagrams of fiber coupling and causes of losses (a) Fibers
with different Numerical apertures (b) Core concentricity (c) Core diameter mismatch (D1>D2) (d) Linear gap between two fibers/ waveguides.
3.4.1 Tapered signal coupler
The inequality between single mode fiber and Silicon-on-insulator [SOI]
waveguides dimensions is prominent and cause of coupling losses. Figure 3.3 (a)
Shows schematic diagram of a tapered coupler [31] used to couple optical signal
from fiber to SOI waveguide with minimum coupling losses. The light is confined to
the bottommost layer of the stacked tapered coupler which had highest refractive
index. Linear taper confines and guides the light to the narrow waveguide. Figure
3.3 (b) SEM image showing coupler stack layers with parabolic index profile.
Chatper-3 Laser Heat Transmission for High Efficiency Bonding of Two Optical Fibers Using SU8 Microdroplet
28
Fig. 3.3 Techniques used to minimise coupling losses (a) schematic diagram of
a tapered coupler [ Ref. 2] used to couple optical signal from fiber to SOI (b) SEM image showing coupler stack layers with parabolic index profile (c) SOI waveguide and mode converter cross section[ Ref. 3].
In Figure 3.3 (c) a 3-D adiabatic taper used to couple single vertical mode
from single mode fiber to SOI waveguide. It is called [2] mode converter and for
achieving vertical taper grayscale photolithography technique is employed.
3.4.2 Grating coupler
Another efficient optical coupling technique of single mode fiber coupling
with SOI waveguide is by using shallow etched diffractive waveguide grating
coupler [3]. The waveguide / grating [see figure 3.4 (a) and (b)] thickness, fill factor,
coupling strength are optimized to match the modes, to minimize the reflection,
minimize coupling loss, enhance efficiency of coupling.
Chatper-3 Laser Heat Transmission for High Efficiency Bonding of Two Optical Fibers Using SU8 Microdroplet
29
Fig. 3.4 Coupling between optical fiber and SOI waveguide (a) schematic of
waveguide diffractive grating coupler (b) SEM image of varied coupling strength grating coupler [4].
3.4.3 Optical Fiber Splicing
One of the oldest methods of fiber coupling is fiber splicing. In this method
heat is used to join to ends of fiber. These fiber ends are preformed before aligning
and joining. The objective of this joint is to have minimum coupling loss, scattering
and reflection at the splice. Heat is given locally at the splice using gas flame,
electric arc or current carrying heat source and CO2 laser [see Figure 3.5]. 1. Fibers
are preformed by first stripping the coating with a fiber stripper or dipping in
sulfuric acid or flowing hot air over the fiber. 2 Fibers are cleaned with isopropyl
alcohol. 3.Fiber cleaving in which fiber endface is cut with mirror like finish [90˚ at
the face], is important to minimize losses at the splice. 4. Fibers are aligned in x-y- z
in plane and then fused together. Sometimes a splice protector tube is provided
around the fiber to strengthen the joint and protect it.
Chatper-3 Laser Heat Transmission for High Efficiency Bonding of Two Optical Fibers Using SU8 Microdroplet
30
3.5 Epilog Laser machine
In this work, a mini laser machine is employed for some unconventional
functions and operations. Epilog mini/ HELIX Laser, Model 8000, Class 3R laser
product with International Standard IEC 60825-1 and CO2 laser source. It operates
with maximum 35W power and graphics software CorelDraw. Raster engraving
operation is high resolution dot matrix printing with laser beam. Vector cutting is
with hairline thickness outline, continuous path following.
Fig. 3.5 Various optical fiber-to-fiber splicing techniques (a) Electric arc: Image
from en.wikipedia.org (b) Electric arc: Enlarged view, Image from www.fiber-optic-tutorial.com (c) Schematic diagram of Arc fusion of two optical fibers. Image from www.tpub.com. (d) Mechanical-fiber-to-fiber splice, Image from www.Thorlabs. com
This machine was used for glass, PMMA, Si, SU8, Silica materials for
cutting, drilling holes, making moulds, masks, melting optical fiber tip to make
silica microspheres, strip cladding layer of optical fiber, melt and crosslink SU8
material at microspots.
Laser exposure was carried out on a EPILOG WIN32 laser machine with 32
Watts power and total working platform of size 2ft x1ft. The path of the Laser head
Chatper-3 Laser Heat Transmission for High Efficiency Bonding of Two Optical Fibers Using SU8 Microdroplet
31
was pre-programmed using Corel draw (CorelDRAW Graphics Suite X5) which was
subsequently converted into a machine readable file of format ‘.dwf’ or ‘.cdr’and
imported into the EPILOG machine.
3.6 SU8 as bonding material
In photolithography technology epoxy based SU8 photoresist is used to
selectively make structures out of a plain Silicon substrate. It is also used to produce
structures of high aspect ratio. It is dissolved in Gama Butyrolacton [GBL] an
organic solvent, quantity of which in SU8 decides, viscocity and feature thickness of
SU8 structure. Thus this negative photoresist is basically a photopatternable,
microfabrication and micromachining material. Its highest absorbtion is at 365nm
near UV wavelength. Hence UV processing is observed in 350 to 400nm near UV
range. It also has very high optical transmission above this range. Once the SU8 film
is exposed to UV rays, the exposed portion has long molecular chains of SU8
crosslinked causing hardening of the region. Once hardened, it is difficult to remove
this portion from substrate. The unexposed portion has no crosslinks, so it dissolves
easily in the developer solution. SU8 has very good imaging characteristics and it is
a regular practice to image, cure and allow the SU8 structures to remain on the
substrate. Thus the process steps involved in Photolithography for making high
DOE is a statistical way of carrying out experimental studies in number of
engineering processes. It helps in establishing a relation between process parameters
and output responses to optimize the system. Thus in the fields of science and
technology, DOE finds application of system optimization, development, management
and validation. This is a systematic way of planning experiments, accessing and
predicting the data output. Amongst various analysis techniques, ANOVA, Taguchi’s
methods are commonly used techniques [44].
3.8 COMSOL Simulation
Simulation softwares help plan the design parameters of a process, system,
device; allow to optimize them with frequent variations and provide a data base to
predict output conditions. Thus they are software DOE techniques, which provide
knowledge of feasibility and performance before actually embarking upon the
fabrication and experimentation. COMSOL Multiphysics software is one such
software. In this simulation different physics modules handling physical parameters
like flow, heat, stress and radiation can be linked together in a multi disciplinary,
multiphysics environment. Effect of one physics and process can be predicted on
other physics and process. It is graphical user interface software with illustrative
Chatper-3 Laser Heat Transmission for High Efficiency Bonding of Two Optical Fibers Using SU8 Microdroplet
33
design models, physics and studies. COMSOL Simulations were carried out using
an Intel (R) Core (TM) 2 Quad CPU, with 8.0 GB RAM and 64 bit operating
system. The research work, discussed in this chapter, also involves interdisciplinary
studies, laser heat transmission and optical signal transmission, behavior of optical
fiber and SU8 material under these conditions.
3.8.1 Laser Heat transmission Coupling
To synthesize a fiber-to-fiber bond using SU8, COMSOL Multiphysics solid
heat conduction model, as proposed in this chapter, is used. A moving laser source is
simulated to provide heat transmission at the joint. It helps design parameters to
achieve end temperature conditions at the microspot and at the location of bond.
COMSOL heat transfer module supports laser heat transfer model with the
governing mathematical equation: It is for the circular symmetry, based on
simplified heat transfer equation.
.............. 3.6)
Where zs = distance from irradiated SU8 film/contact in m, rL = distance from center
of laser beam in m, t = interaction time in sec, k= thermal conductivity [W.m-1.c-1],
T= Temperature in K, I = radiation intensity in Wm-2.
Refractive index of SU8 is in the range of 1.668 -1.575 for wavelength range
365nm-1550nm respectively [R. Muller et.al. 43].
Table 3.1 enlists properties of SU8 relevant to this model.
Table 3.1 Properties of SU8
Thermal conductivity k [W.m-1 .c-1] 0.2
Heat Capacity Cp [ J .Kg-1 .c-1] 1500
Density ρ [Kg. m-3] 1200
Absorption coefficient α [cm-1] 40
Chatper-3 Laser Heat Transmission for High Efficiency Bonding of Two Optical Fibers Using SU8 Microdroplet
34
3.8.2 Effect of Heating on Optical property
Laser heat transmission affects at microlevel the structural properties of SU8
material joining the two fibers. The stress at the joint is interpreted in terms of
change in optical properties at the joint.
3.8.3 Whispering gallery mode [WGM] based Optical signal coupling between
two fibers
The two fibers or planner waveguides are joined using SU8 microdroplet
which possess excellent optical properties and refractive index as high as 1.67 at the
operating range of frequencies. Simulation results in a 2-D design show whispering
gallery modes phenomenon [see chapter 2. for details] in the elliptical microdroplet
with selective input wavelengths. RF model used for this support the concept that
two fibers can have high efficiency coupling with WGM effect in a semicircular or
elliptical joint.
3.9 Measurement of optical properties - SpectraSuite Ocean Optics software
Ocean Optics Spectrometer [Model Name: USB 4000 UV-VIS Miniature
fiber optic Spectrometer, Spectra-Suite Software, Model No. USB4H02846 M/S
Ocean Optics, Inc. Dunedin, FL 34698 with Halogen light source (HL-2000-HP-
FHSA 034990459)] is used for optical signal measurements.
Important performance criterion of the laser heated SU8 bond is transmission
efficiency of the two fibers joined together through the bond. The fiber alignment,
position, dropsize taken care of, the bonded assembly is irradiated with CO2 laser
source to strengthen the bond. The device is then characterized with SpectraSuite
Optics mini spectrometer software and array detector. Figure 3.6 shows the
schematic diagram of the SpectraSuite optical measurement setup. Using a
broadband light source, optical signal was given to input fiber and corresponding
wavelength wise % transmittance was available on the SpectraSuite screen.
Chatper-3 Laser Heat Transmission for High Efficiency Bonding of Two Optical Fibers Using SU8 Microdroplet
35
Fig. 3.6: Schematic diagram of test setup for measurement of % optical signal
transmittance.
3.10 Related Work - Literature Survey
The optical electronics, opto-medical and communication industries are fast
developing and transforming into planar integrated optics systems [IOS] from the
individual structures like optical switches, microspheres, ring resonators, micro
prisms [5-8]. Among number of other performance measuring criterion in IOS, the
transmittance is important parameter, which depends on alignment, linear gap and
joining of the various components of such systems [9]. IOS finds application in
effectively every field of science and technology, be it optical sensing and
diagnostics for chemical/ biochemical biological analytes, optical communication,
medical therapeutics [10-14]. The complexity and levels of engineering in
association of such systems have increased very fast and keeping with the Moore’s
law, in the field of communication and sensing [15]. In communication systems and
sophisticated sensing systems multiple input/ output signals are required in an
environment of miniaturized chip platforms. The optical signals as outcome of a
reaction, intermediate signals, specific indicators need to be monitored using some
kind of optical probing. In micro/ miniaturized spacial probing, use of standard
optical probes and connectors is difficult. Fiber splicing is normally used for joining
two fibers, it is not explored much in other regions of binding which involves chip
based structures. Once the optical signal is transmitted to the right spot on the chip
Chatper-3 Laser Heat Transmission for High Efficiency Bonding of Two Optical Fibers Using SU8 Microdroplet
36
and taken from other important test points on the mini chips, the signal can be taken
over by existing connectors, splicing connectors for readers, recording systems, mini
spectrophotmeters and other such testing instruments. Thus fiber bonding is an
important interface between the mini and mega world of optical technology.
Biomedical diagnostics as in the lab-on-chip technology heavily depend on proper
input, output connecting probes for the largely used optically driven high speed
strategies of signal transmission from chip to reader and need further explorations
for a truly compact and independent LOC environment. Precaution and care must be
taken while developing these interconnects, to ensure that a strong bond is
developed between the optical fibre and the patterned structure in micro-chip
architecture, so that they remain in position, occupying much less space, provide
lossless transmission amongst various structures.
In this work we have conceptualized through literature survey, simulation
and implemented ,verified with Design of experiments, experimental work, data,
that optical fibres can be firmly bonded to substrates (both glass and silicon), to
extended contacts of patterned SU8 waveguides/ other optical fiber with laser
processed SU8 micro-droplets. The droplets further provide indication of
characteristic whispering galleries and resultant transfer of energy modes from
signal input to output sides in such an unusual optical joint. The parameters of Laser
welding process are decided by the material properties like absorption coefficient,
their behaviour under laser irradiation. Thus proper use of laser machining
parameters is important to get a perfect, shining bond for the fiber-to-fiber or fiber-
to-waveguide joint. To further elaborate the point, considering a transparent polymer
film coated over absorbent/ opaque substrates which when exposed to a small laser
spot with high energy density enables a much faster heat transfer to take place across
the film, eventhough the film material may have high reflectivity, transmissibility
and probably less absorptivity. If the substrate is thermally insulating then the
absorbent substrate below the thin transparent film layer melts and transfers the heat
back to the transparent film layer. This melting, solidification and re-melting at the
film substrate interface create a well bonded region. The advantage offered by the
laser is its ability to machine and work in a small area without affecting the
surrounding material, keeping it intact. [16-19].
Chatper-3 Laser Heat Transmission for High Efficiency Bonding of Two Optical Fibers Using SU8 Microdroplet
37
Literaure survey on laser assisted machining, heating provided, mathematical
modeling of stationary and moving laser beam [20,21], experimental procedures
[22] and computer simulation of the moving and still laser source [23, 25,28], helped
predict laser assisted bonding for various materials speculating different machining
conditions. A range of work is carried out for micro-fabrication of optical
waveguides using photoresist SU8 material spun in a thin film on desired substrate
[24]. The major problem as discussed is access to the optical signal coming out of
these waveguides.
Alternate materials other than SU8 were ABS (Acrylonitrile Butadiene
Styrene) polymeric material[26], PC (poly carbonate) and PMMA (Poly methyl
methacrylate) have shown good quality joining strength when exposed to laser
source although their optical properties may not be suitable to apply them for wave-
guiding function as in case of ABS and PC materials[27]. Optical waveguides are
subjected to various coupling strategies including usage of hybridized rib-like
waveguides with polystyrene microsphere [29], gap filling between the fiber and
waveguide using optical solder [30], to confine light in both vertical and horizontal
directions, stepwise parabolic graded index profile is used for a vertically
asymmetric design and combined it with a horizontal taper [31], optical fiber end
with miniature waveguide grating structure [32]. The methods described in all these
works are either complex in nature, accommodated outside the planar architecture of
the IOC or associated with self assembly/ difficult micro-fabrication strategies,
requiring one or the other form of alignment.
3.11 Laser Heat transmission Based Bonding of Optical Fibers Using SU8
In this research work, SU8 photoresist with laser heat transmission
processing was used as a contact bond material to assist a high coupling efficiency
amid chip bonded optical fibers. Low power CO2 laser was used for stitching or
welding of two optical fibers using SU8 micro-droplet acting as a contact pad or
optical fiber solder bond for the coupling and coupled ends of the optical transmitter
test set up. The coupling end of the optical transmitter was an off-chip fiber and the
coupled end a well located fiber on a microchip substrate. The fiber coupled end
indicates whispering gallery mode formation happening along the SU8 microdroplet
ensuring good transmissibility of input signal between the two coupled fibers. The
simulation models and experiments based on fiber-to-fiber interconnects gave us
Chatper-3 Laser Heat Transmission for High Efficiency Bonding of Two Optical Fibers Using SU8 Microdroplet
38
clear idea of the physics of whispering gallery modes occurring in the micro-droplet.
Silicon and glass, both substratres were used for evaluating the performance of these
contacts. CO2 laser based engraving system [EPILOG] was used with precise control
on beam traversing pattern, power, exposure time, speed, frequency, resolution for
bonding optical fibers to the IOC or LOC with an SU8 micro-droplet and %
transmittance as the experimentally measured output parameter of this coupler
presented the quality of the bond interms of transmissibility and strength. COMSOL
Multiphysics version 4.3 based Modeling of the heat transfer process was excercised
with initial scanning speed/ power, pattern and other Lasing parameters estimated
before using them on the actual laser engraving machine. Design of experiments
(DOE) technology was implemented to plan number of experiments, to further
optimize the heat transfer control of laser machining process. The SU8 micro-
droplet bond joining both the fibers exhibited whispering gallery mode (WGM)
phenomenon along its circumference. With suitable positioning of fiber ends with
respect to the diameter of the microdroplet, light could be transmitted between the
two fibers aligned or misaligned with high efficacy. Thus we could provide with
simulations and experimentation a basis to endorse high transmittance couplings in
this manner between the two bonded off chip fibers.
3.11.1 Experimental procedures
SU8 photoresist polymer (M/S Micro chem. Inc.) with its inherent properties
[section 3.6] was utilized as a bonding material for stitching optical fiber to Si or
Glass substrate. Advantages of SU-8 over other polymers are, its chemical resistance
after UV exposure due to cross linking, high bond strength, transparent appearance,
suitability in bio-sensing applications due to bio-compatible nature, excellent optical
properties and low bonding temperature [90ºC]. SU8 being an epoxy based negative
photo resist is also photo-patternable and is used to create waveguides on microchips
and thus it is possible to translate, the coupling strategy developed in this paper to
patterned optical devices on microchips. It offers resistance to removal once coated
on the substrate and is otherwise a very good bonding material sometimes used to
bond multiple layers of microchips [33, 34].
Chatper-3 Laser Heat Transmission for High Efficiency Bonding of Two Optical Fibers Using SU8 Microdroplet
39
3.11.1.1 SU8 microdrop dispensing on fibers set for bond formation
The optical fibers are aligned using a fixing ,clamping and positioning
system over the substrate (Glass or Si) and a 1.05 µl in volume microdrop of SU8
2025, is dispensed over the prior set optical fibers on the substrate, which is heat
treated with laser to firmly glue the two optical fibers to the substrate. The exact
nature of the drop volume is set through an off-chip syringe pump with a 1ml
syringe [pretreated if required] and a prior modification of the surface energy of the
substrate is performed if required to generate the requisite contact angle of the
dispensed SU8 fluid formulating
Fig. 3.7 Fibers set, aligned, spaced before and after mocrodroplet dispensing (a) Before dispensing of microdroplet at the circle position on the misaligned fibers (b) Before dispensing of microdroplet at the circle position on the aligned fibers (c) After dispensing of the microdroplet circling the fiber joint.
The droplet with the substrate surface. The substrate is moved in z-direction
after adjusting the two fibers in the x or y directions accordingly to set the proper
[linear and lateral] distance between them, before applying the SU8 micro-droplet
and the two different states that are achieved by this process are categorized as
misaligned and aligned fibers [Figure 3.7 (a) and (b)].
In a two-stage X-Y-Z fiber alignment and microdroplet dispensing,
following procedure was used .The first fiber was fixed on the substrate which was
Chatper-3 Laser Heat Transmission for High Efficiency Bonding of Two Optical Fibers Using SU8 Microdroplet
40
mounted and fixed on one of the XYZ stages. The other fiber was mounted on a
holder near the X-Y-Z stage and carried near the previously mounted glass substrate.
Once the fibers are aligned and found satisfactory, when observed under the
magnifying lens the second XYZ stage containing the syringe pump with a projected
syringe is aligned first in the X-Y platform with respect to the coupling region. Then
the syringe pump is moved down in the - Z direction so that the droplet starts
touching over the substrate at exact spot of the desired bond. The droplet adheres to
the substrate and the syringe is pulled back in the –X direction to break the contact
and release the droplet over the coupling region. This way the small distances
between the fibers for both the aligned and misaligned cases could be easily
maintained. The drop volume was recorded as 1.05 µl. Accurate laser beam
exposure of the precise location and spot-size in the polar zone of the droplet could
be obtained to ensure a perfect adherence at the spot to the substrate surface. SU8
grade 2025 was found to offer the right viscosity to undertake these repeated
dispensing. The substrate plays a major role in offering a relatively higher level of
adhesion to the SU-8 drop and the de-adherance of the drop from the needle body.
Goniometric contact angle studies were conducted on the SU-8 droplet getting
formulated over the silicon substrate and over the thermal grown oxide layer on
surface. The contact angle formed by the droplet was approximately 101°C. This
fabrication technique ensured precision dispensing of SU8-2025 without affecting
the surrounding miniaturized devices or structures.
3.11.2 Laser heat treatment
To provide laser heat with a preselected and preset pattern for the laser head,
CorelDraw software was used. Laser exposure was carried out by 32 Watt powered
EPILOG WIN32 laser machine. The laser parameters were fully optimized using
DOE technique in which a Central Composite Design (CCD) was used to fit a model
by least square technique. The software tool Software Design Expert 7.0, is used for
this purpose. After carrying out all experiments, images of the fabricated designs
were captured with top illuminated fluorescence microscope (Nikon 80i) in the
bright-field mode. Transmittances of these welded pairs were measured using test
setup of Ocean Optics Spectra Suite including its software, a broadband [Halogen]
Chatper-3 Laser Heat Transmission for High Efficiency Bonding of Two Optical Fibers Using SU8 Microdroplet
41
3.8 shows the effect of optimization of laser machining parameters, on the quality
and appearance of the bond.
3.11.3 COMSOL Simulation for modeling Laser heat transmission
The processing problem is multi disciplinary and involves Multiphysics
considerations and studies. In process modeling, finite element solid heat transfer
model was used to get temperature distribution at the Air-fiber-SU8 interfaces and
estimate the heat induced stress in the fiber. Using this information as preset input
data in optical [RF] model, birefringence at the SU8 bonded fiber was obtained.
Fig. 3.8 (a) a visible spot on fiber covered with SU8 droplet after laser heat transfers without optimization of machine parameters (b) a highly optimized laser heat transmission procedure for bonding two optical fibers with SU8 microdroplet
Software COMSOL multiphysics was used to model the temperature
distribution on the irradiated SU8 contact surface. 3-D model and geometry was
designed to simulate laser heat transfer, on temperature at the bond, the fiber, SU8
interface and investigate effect of varying thickness of the SU8 film on the
temperature. Equation (3.7) was modified to suit the simulation conditions,
boundary conditions [19-20]. Mathematical model considered circular symmetry for
the simplified heat conduction equation
.................. (3.7)
Chatper-3 Laser Heat Transmission for High Efficiency Bonding of Two Optical Fibers Using SU8 Microdroplet
42
Where rL = distance from center of laser beam in m, zS = distance from irradiated
SU8 film/contact in m, T= Temperature in K, t = interaction time in sec,
I = radiation intensity in Wm-2. [Section 3.8.1] Table 1 enlists the properties of SU8
which were used for thermal modeling of heat transfer across SU8 film on glass or
silicon substrate.
Figure 3.9 shows temperature distribution caused by a simulated 30W laser
beam traversing in circular path on the substrate over a SU8 micro-drop.
Some process constants are assumed while carrying out simulation:
Reflection coefficient of SU8 = 0.3, Heat transfer coefficient � /01�∆2$ of contact:
10~260 [W/(m2 .K)] depending on area of interaction, where PL is laser power, A is
area of interaction, ∆T is desired temperature difference on exposure.
For WGM simulation, boundary conditions were selected as perfect electric
conductor [PEC], perfect magnetic conductor, electric field and the domain
condition was perfectly matched layer [PML] to control dispersive outer region.
3.11.5 Fabrication of optical waveguides:
Fiber to fiber laser welding using SU8 was done with two pairs of optical
fibers placed in close proximity on glass slide, Si-wafer or Si/SiO2 substrate. The
distance between each individual pair and its alignment were adjusted using
microscope, X-Y-Z stage. The interfaces were covered with small drops of SU8-
2025. SU8 material was also used for fabricating the optical waveguides and
interconnects [detailed procedure is given in section 3.6]. These structures were
suitably aligned with the, off the chip optical fibers using clamping or positioning
system and SU8 micro-droplet was dispensed over the respective joints in volume of
about [ 2.42E-10 m3 ] 0.242 micro-liter. One-by-one the SU8 micro-droplets were
then exposed to the CO2 Laser beam of Epilog Laser Engraving Machine according
to the pre-programmed pattern and select parameters of the machine. The beam
diameter of this machine is around 80µm and the system emits at 10.6µm
wavelength. The laser path was designed using Corel Draw and is described to
move the laser head over the assembly, connecting the coupling to coupled fibers in
a pre-designed layout. Each exposure of the laser is coincided with the geometric
pole of the individual SU-8 micro-droplet and only a very small zone of the droplet
was laser exposed. The laser power being highly focused in a small area guides the
light past the whole radius of the micro-droplet all the way to the substrate over
which the droplet is placed. The advantages of these laser welding processes are
1.They prepare the bonded fiber and waveguide or bonded fibers for external
Chatper-3 Laser Heat Transmission for High Efficiency Bonding of Two Optical Fibers Using SU8 Microdroplet
45
connections in a system, 2.By varying some of the machine parameters a wide range
of surface changes alongwith a bond and corresponding % transmittance can be
availed.
Figure 3.10 shows (a) schematic of fiber to fiber coupling and fiber-
waveguide fiber coupling on a Si substrate using SU8 microdroplets (b) optical
micrographs of fiber-fiber bonded laser tagged microdroplets at different stages of
optimization of Laser machining.
As the SU8 micro-droplet was top irradiated with laser the heat transfer
occurs across the surface of the droplet through its bulk to the substrate (Si or Glass)
along a small central zone of the droplet. As discussed before depending on the heat
transfer coefficient of the substrate if the heat is not conducted away by the
substrates it can result in more localized heating although there is a chance of the
droplet to totally melt and develop splashes.
Fig. 3.10 Fiber bonding (a) the schematic diagram for coupling between two
pairs of optical fibers using the SU8 microdrop along with a SU8-waveguide-fibers coupling, (b) shows various stages of optimization of laser machining with the optical micrographs of the laser tagged micro-droplet surfaces (top view) for the fiber/ fiber joints[Clockwise from top left].
Chatper-3 Laser Heat Transmission for High Efficiency Bonding of Two Optical Fibers Using SU8 Microdroplet
46
The heat is also said to flow across the embedded fiber thus melting and
partially dissolving the fiber in SU8 so that on resolidification there was strong
adherence between the substrate surface and the fiber. The softening temperature of
optical fiber is 1600-1710°C. Thus the localized and focussed laser beam is
completely controllable. Post the instant of laser beam exposure, the center of the
SU8 drop is solidified very fast. CO2 laser beam has operating wavelength of
10.6µm. With optimization of speed, pattern, power, frequency of the laser machine,
the controlled laser power is flown through the surface and bulk of the droplet,
forming either a desired bond strength or making the inner curved surface area near
the substrate functionalized for the input optical signal or by creating a sensitive
surface for registering the activities just beyond the dome like surface of the semi-
elliptical /semi-hemispherical surface of SU8 microdroplet.
With DOE and number of other tests carried out on Si and glass surfaces for
laser heat transmission based bonding, led to optimized values of laser machine
parameters. The strength of the fiber weld after exposure to laser heat and
resolidifaction was evaluated qualitatively and grouped Very Good, Good, Not
Good and Bad. Optical fibre softening can be reached on Si or glass surface by
controlling laser machine parameters as shown in Table 3.2.
Table 3.2 Laser based bonding: % Transmittance obtained with variation in
speed and power of laser beam.
S.
No.
Corel Draw Pattern % Power
Speed
Weld Strength
Optical Transmittance
1. Si + SU8 drop
100/1 Bad -----
2. 60/1 Good 0.00209
3. 50/1 Very good 0.744
4. 40/1 Good 0.09495
5. Direct Bonding of Fiber on glass with no SU8 material
100/ (40-80)
Good
(Fiber melt)
-------
Chatper-3 Laser Heat Transmission for High Efficiency Bonding of Two Optical Fibers Using SU8 Microdroplet
47
Direct bonding of optical fiber on the glass surface without SU8 thin film or
drop was attempted to know % power/ speed. The bond strength was found to be
poor and there was spill over of the fiber melt, so this option was not investgated in
further studies. The fiber softening temperature is in the higher range [1600-17100C]
than SU8. So fiber material or SU8 do not experience degradation [600~ 900 K
max] in this study.
3.11.6 Measurement of % Transmittance across the coupling
Once the strategy of coupling of optical fibers is established, it can be
applied and extended to microchip based waveguide like structures using SU8
micro-drop. To evaluate performance and optical characteristics of this bond, its use
as a tool or probe to access optical signal from source, microchip and deliver it to
desired external setup; the bonded assembly must be tested for % transmittance
using an optical test setup. The laser bonded fiber-fiber and fiber-waveguide-fiber
bond assemblies were optically characterized for % Transmittance measurement
using Ocean Optics Spectra Suite Spectrometer in an integrated test setup, see figure
3.6.
A halogen lamp [wavelength 300-1100 nm peak measured value [Rλ] of
60000 counts (this 60000 count is considered as reference value for further
discussion)] was used as light source for the input fiber chord which fed the signal to
coupling fiber bonded on chip. The alignment process of the fiber and SU8
microdroplet dispensing was done using two precision XYZ stages. The ouput signal
[SOλ] is connected by optical fiber cable or chord to the Ocean optics USB4000
which is a UV-VIS miniature Fiber optic spectrometer. USB 4000 has 16-bit A/D
convertor, a set of CCD arrays, GPIOs, enhanced electronics with increased signal-
to-noise ratio. It is connected to a computer system at the USB port and Spectra-
Suite spectroscopy software of Ocean Optics with advanced data capture attributes,
was used to analyse signal from the array detector. The output spectra has
wavelength in ‘nm’ on X-axis and intensity (counts) on Y-axis. It can be used to
measure wavelength dependent transmittance of a sample or structure, its
absorbance, reflectance and relative irradiance. Before starting with the actual
measurement, reference [Rλ], dark [DRλ] files referring to background subtraction
must be first stored, see equation (3.13).
Chatper-3 Laser Heat Transmission for High Efficiency Bonding of Two Optical Fibers Using SU8 Microdroplet
48
In order to find coupling efficiency of a sample, the transmittance of an
optical signal across such a sample, coupling was numerically determined by
percentage transmittance which represents the % amount of energy allowed to pass
through a sample medium relative to energy passing through the reference medium.
Where, NA is Avogadro no. representing for a given material, number of constituent
particles per mole. The absorption cross section was considered to be in terms of the
Chatper-3 Laser Heat Transmission for High Efficiency Bonding of Two Optical Fibers Using SU8 Microdroplet
49
laser beam spot-size on the exposed substrate, assumed to be in cm2. So an exercise
was undertaken to find absorptivity of SU8 at this wavelength. A comparison of
absorptivity with and without SU8 on glass/ Si was made where, Absorptivity (ε)
was measured at 10.6 µm. Number of substrates of glass, Si were prepared with
coating of Su8 in the form of small circles prepared for the Laser exposure. Half the
Si/ glass sample substrates were kept uncoated for the exposure. Then systematically
number of CO2 laser exposures were carried out on all the four sets [Si, Si+SU8,
Glass, Glass+SU8] of substrates with varying power and speed parameter of the
lasing machine. The spot-sizes thus obtained were imaged and measured using
Nikon epifluorescence microscope. As the glass - SU8 interface is the most heated
up and high temperature zone in the whole cross-section of the droplet owing to the
heat reflux back into the SU8 at the interface we thought it important to observe the
absorption at this interface. Hence the absorptivity at the interface of the SU8 was
subsequently calculated by using the equation (3.15).
Absorptivity of SU8=Absorptivity of Glass-Absorptivity of (Glass+SU8) …….
(3.15)
Method of averaging was used to get the final value of SU8 absorptivity.
3.11.8 Calculating the SU8 droplet Volume
The cross-sectional area [for a, b] of the SU8 micro-droplet was imaged
using the Nikon epifluorescence microscope using the bright field option. Then
vertical cross-section plane of the droplet, perpendicular to the plate (both major and
minor axes) was imaged and measured [for h]. This was achieved by aligning the
glass slide in the vertical direction perpendicular to the sample stage of the
microscope. The volume of the droplet was calculated by using the expression (3.16)
see Figure 3.10 (c):
3.10 (c) Volume Measurements of microdrop
Chatper-3 Laser Heat Transmission for High Efficiency Bonding of Two Optical Fibers Using SU8 Microdroplet
50
M � NO P Q P �3!� S 3T� S Q�) .......................................................(3.16)
Where a, b and h were the major radius, minor radius and height of the
hemispherical droplet, respectively. The first job was to see the consistency in
dispensing identically sized volumes and then based on this data the average
interface area of the glass SU8 interface was calculated.
3.12 Result and Analysis
After considering methodologies of analysis, simulations, calculations,
measurements of various quantities, following subsections present results and
correlation between them.
3.12.1 Optimization of Machining Parameter
In the laser stitching experiments the lasing parameters like span time,
power, pattern of lasing, speed, frequency were varied and optimization of these
parameters was carried out using design of experiment (DOE) software. Table 3.2
shows the strength of the laser welding process with respect to the power/ speed
percentage of maximum values. The maximum power of the laser source was 32
Watts and the maximum speed with which the beam traverses the X-Y stage of the
laser machine was 15.4 cm/sec. Desired strength of the laser welded fiber bond was
obtained with the parameters mentioned in row 2-5 of Table 2. Poor weld strength
was obtained at row no. 1. It is observed that the optical transmittance values across
such joints as mentioned in the last column of table 1 are also low in case the
strength of the fiber joint is poor indicating that the coupling is inappropriate if the
fiber SU8 melt pool is not properly formed due to insufficient heating of the
microdroplet. It is further noticed that a power level equalizing the full power value
provided insufficient bond strength. The cause of this condition may be overheating
or burning of the SU8 material at the spot. This probably can be accounted for by
looking into the thermal expansion coefficient of the Glass (1.1x10⁻⁸ / K) and SU8
(5.2x10⁻⁵/ K) respectively. In the direct bonding of fiber to glass the coefficient of
expansion being more or less similar demonstrated no inter-layer shear between the
fiber and glass resulting in good bond strength between both. There was a spillover
of melted fiber when direct bond was formulated. Out of all the combinations of
power / speed parameters, experiments showed that ratio of 50% power and 1%
speed correlated to the best bonding between the fiber, SU8 photo-resist and the
Chatper-3 Laser Heat Transmission for High Efficiency Bonding of Two Optical Fibers Using SU8 Microdroplet
51
silicon substrate. It was also corresponding to highest transmittance. We hypothesize
that if the fiber is very well bonded then the transmittance is also higher.
The DOE software tool Software Design Expert 7.0 was used with ANOVA
mathematical model, Response Surface Methodology [RSM] and Cental Composite
Design [CCD] fitted in the model by least square technique [See functional
equations in Appendix]. Factors chosen for this single objective optimization
process are lasing speed and lasing power of the epilogue machine. The DOE
module was operating between the optimum machining conditions and resulting in
getting greatest % of transmittance. Contour plot output from the DOE is provided
in figure 3.11. It predicts the maximum transmittance level corresponding to 72%
obtained at Laser power of 52.90% of maximum power and speed corresponding to
1% of maximum speed which is very close to the actual values at which the bond
strength of the joint is very good as illustrated in Table 2 and reported earlier.
Therefore, it can be concluded that there is a very high level of correlation between
the % transmittance and good bonding strength. The % transmittance observed by
way of experiments is actually a 2% higher than the DOE predicted value which
may be further improved by taking more no. of observations in the model.
Fig. 3.11 The design of experiments [DOE] results indicating the transmission
as output with speed and power as input parameters.
Chatper-3 Laser Heat Transmission for High Efficiency Bonding of Two Optical Fibers Using SU8 Microdroplet
52
3.12.2 COMSOL simulations for Laser heat transfer
Simulation of the laser heat transmission process used for welding between
fibers by using SU8 micro-droplet had shown time dependent variation in
temperature distribution of the laser exposed area. The heat was rapidly dissipated
across the micro-droplet as well as the surface. As detailed previously the heated
substrate was responsible for refluxing and reflecting back the heat to the SU8 layer
along the interface had it been a poor heat conductor. In fact due to the rapid
temperature rise and a cross-over of the ‘Tg’ [glass transition temperature] value of
uncross-linked SU8 2025 (50° - 65°C), it melted and then got superheated near the
interface due to the heat refluxing action of the substrate [36]. This is clear in the
simulation output which is reported in Figure 3.9 and Figure 3.12.
Fig. 3.12 The simulation output of bulk temperature of SU8-2025 vs. time in sec of heat treatment. [Different plots show the temperature behavior from a surface 10 micron above the interface in the SU8 layer treated as ‘zero datum’ towards the interface]
The temperature started rising as the Laser started radiating at time instant
‘0’ at the micro-droplet and simultaneously heat transfer processes occured so that
equilibrium was achieved in around 125 milliseconds. The equilibrating temperature
is shown as 560°K (287°C) for 10 micron thickness, away from the interface [based
on sectional plot of figure 3.9] and the temperature further decreased, away from the
Chatper-3 Laser Heat Transmission for High Efficiency Bonding of Two Optical Fibers Using SU8 Microdroplet
53
interface towards the bulk of the SU8 material. In fact at a distance 1 micron from
the interface the temperature is at a value of 470° K [197°C]. Thus very near to the
Si surface, the temperature reached the melting point of SU8 but it did not go into
the degradation temperature for SU8 which is about 380°C. [40] The glass being a
higher reflector of incident beam shooted up to above 380°C which may degrade the
SU8 in actual practice, due to very less absorbance of the substrate on beam incident
side. So, we can see that as the laser processing involved similar conditions of the
laser frequency, scan rate, laser power and resolution, speed as obtained in the
earlier section, the exposed zone always had a molten state which solidified on
removal of the Laser power. The interface therefore was found ideal for the
placement of input/ output fibers. A stronger joint was formed as the fibers were
aligned or misaligned as per figure 3.7 on the surface of the substrate (interface of
SU8 and substrate). The model accounted for the conductivity of the wafer and if the
conductivity resulting in interfacial heat loss was considered then the overall
maximum temperatures achieved at the interface should be lower for Silicon
substrate as the thermal conductivity of silicon will be higher than that of glass.
The birefringence estimation was performed on a combination of COMSOL
modules, including structural mechanics model giving stress due to rise in laser
heated material temperature [Solid heat transfer model]. This stress was monitored
over a short portion of the model to find birefringence or change in effective
refractive index and corresponding change in optical properties of the material.
Birefringence prediction if performed starting from the interface to the bulk of the
droplet, then the superheated molten state of SU8 that was formulated closer to the
interface will have more refractive index homogeneity thus causing less amount of
birefringence. As the distance from surface was increased then away from the hot
zone as the SU8 may still be semi solid there may be large variation of refractive
index causing an increase in the overall birefringence. Simulated effective
birefringence data was plotted for Air/SU8/Si combination. Figure 3.13 shows the
birefringence plot drawn using COMSOL multiphysics simulation software.
Chatper-3 Laser Heat Transmission for High Efficiency Bonding of Two Optical Fibers Using SU8 Microdroplet
54
Fig. 3.13 Simulated estimation of effective bi-refringence with respect to
distance from the surface for Air/SU8/Si combination.
3.12.3 Calculating microvolume and absorptivity of SU8 microdroplet
Using recorded and measured optical micrographs, minimum volume of the
SU8 micro-droplets were calculated as 1.05 * 109 µm3 [As per equation 16]. Further
the number of microscopic images of laser heated spots, on glass substrates, with or
without SU8 coating were used for calculating the spot area of the microdroplet
based on which using equations(14) and (15) the absorptivity variation for SU8 on
glass and silicon was ascertained. It was observed that the absorptivity depends
heavily on overall spot size and a higher spot area shows greater absorptivity. In any
event glass is opaque at 10.6µm wavelength which is also the wavelength
corresponding to the CO2 laser [42]. On the other hand Si is normally opaque to UV-
Vis range and is transparent at 10.6 microns wavelength. Figure 3.14 shows the
absorptivity plot for SU8 on glass and Silicon substrates and it is observed that the
transmittance of ‘Si’ at 10.6um is about 40-50 %, as compared to that of Glass
which has no absorbance at this wavelength. The SU-8 over Si reflected by the blue
trace in figure 3.14 show increase in absorptivity of incident laser light whereas
glass reflects everything back to the medium or SU8 as illustrated in the red and
black traces respectively. This provides a basis of good strength of direct bonded
Chatper-3 Laser Heat Transmission for High Efficiency Bonding of Two Optical Fibers Using SU8 Microdroplet
55
fibers over glass substrates,eventhough the reflected light would add much reflux
which may degrade the SU8 overshooting its ‘Tg’ and go upto the degradation
temperature (380°C) value. Thus a preferable usage of Si substrates is considered by
this analysis.
Fig.3.14 Comparison of absorptivity of SU-8 over Si and glass substrates
through experimental results.
3.12.4 Simulation of WGM using COMSOL modelling
Two different aspects were studied in this 2-D model, corresponding to the
aligned and misaligned cases as detailed in figure 3.7 earlier. In the aligned case the
input and output fibers were aligned axially and the distance between them was
varied from 1 ~5.5 microns. The geometry constructed while simulating in RF
module of COMSOL that demonstrated the WGM effect most prominently
happened for an ellipsoidal droplet [39] of overall diameter of 6.0 microns along the
major axis and 4.0 microns along the minor axis. Therefore it was used with a
refractive index =1.67 boundary of the SU8 and a refractive index = 1.46 of the
optical fiber for carrying out the simulations. Initially the fibers are at the two axial
ends of the microdroplet in the aligned case, so maximum distance between them is
5.5 microns, to capture the WGM based transmission of optical power inside the
droplet. This was followed by a gradual movement of the output fiber towards the
Chatper-3 Laser Heat Transmission for High Efficiency Bonding of Two Optical Fibers Using SU8 Microdroplet
56
input fiber (spatially fixed) upto an extent where the fiber almost touched each other.
The transmissibility of the input signal in all these cases is simulated and figure 3.15
(a), (b) show output of such simulations.
Figure 3.15 Simulation output of the aligned case with inter-fiber distance (a)
5.5µm (b) 4.8 micron.
In case of misaligned fibers, they were separated perpendicularly to their
axes. The fibers were initially positioned tangentially to the ellipsoidal micro-droplet
on and later manoeuvred, with input fiber fixed and the output fiber varying radially
inwards. The simulation results for the same were observed and recorded. Figure
3.16 shows a bar graph with the simulation predicted % transmittances corresponding
to figure 3.15.
The simulation output in the aligned case shows that as the inter-fiber
distance approaches the diameter of the micro-droplet there was a tremendous
increase in % transmittance between the input and output fibers almost to the extent
of 100%. At other distances of separation the overall transmittance was lower than
45 % owing to scattering effects of the microdroplet material. Similarly, in the
misaligned case the maximum % transmittance of 65% occured at an inter-fiber
distance of 2.0 microns. This separation distance brings both the fibers close to the
circumference of the ellipse. Therefore, through simulation it can be predicted that
when the interfiber spacing was matched with the WGM zone in the ellipsoidal
droplet, there was a sudden increase in % transmittance, even though the fibers are
misaligned and at a distance from each other.
Chatper-3 Laser Heat Transmission for High Efficiency Bonding of Two Optical Fibers Using SU8 Microdroplet
57
Fig. 3.16 Simulation results showing % Transmittance with respect to inter-
fiber distance for (a) Aligned fiber and (b) Misaligned fiber cases.
3.12.5 Measurement of optical transmittance in a test set up
We have used the Ocean Optics SpectraSuite test setup described previously
in figure 3.6 for measuring the % transmittance, using the mathematical relationship
of equation (13). The transmittance study was performed for both the aligned and
misaligned cases, on the similar lines to that of by simulations. The micro-drop
diameter was more realistic in actual set up and in the range of 1054 microns as
shown in the optical micrograph as shown in figure 3.7 (c). The inter-fiber distance
in the aligned fiber case was varied from ‘0’ to 750-microns. The fiber diameter
itself was around 125 microns .When both fiber diameters and the inter-fiber
(a)
(b)
Chatper-3 Laser Heat Transmission for High Efficiency Bonding of Two Optical Fibers Using SU8 Microdroplet
58
distance was added together to get the necessary confinement distance. The
confinement distance for both the fibers in the largest separation case comes out to
be similar to the drop diameter which illustrated the possibility of coupling of
optical signal through WGM effect. The wavelengthwise transmitted intensity was
acquired digitally and recorded with the ocean optics spectrophotometer.
Experimental results of this study, for both aligned and misaligned fiber cases is
shown in graphical form in figures 3.17 (a) and (b). All the graphs were recorded
using the spectrophotometer and acquired with spectra-suite software. From the two
graphs it can be seen that the highest transmittance occured pertaining to either a
contact condition or if both fibers are near to the outer edge of the SU8 microdroplet
where the transmission utilizes the WGM effect. The ~60% transmission was
recorded in case of aligned fibers as they were connected end to end within the
microdroplet. Full 100% transmission does not happen owing to polishing defects,
lack of cleaving or mirrorlike finish of the fibers at its ends. The transmission %
increased as soon as both fiber faces were brought near the outer edge of the droplet
so that the WGM effect pre-dominated the transmission. The transmissibility started
increasing to almost 60 % corresponding to an inter-fiber distance of 650 microns. A
similar observation was recorded in the misaligned case where the maximum
transmittance of 95 % was observed as the two fibers were shifted along a direction
perpendicular to the axes of both fibers upto a distance of 700 microns. In the other
extremity as the fibers were laterally misaligned by 10 microns the transmissibility
was 80%.
Fig. 3.17 Acquired data through spectra suite software using ocean optics
spectrophotometer for (a) Aligned fibers (b) Misaligned fibers.
Chatper-3 Laser Heat Transmission for High Efficiency Bonding of Two Optical Fibers Using SU8 Microdroplet
59
Therefore, in conculsion, the micro-droplet method using SU8 photo-resist
and aligned fibers, followed by laser machining shown in the above work ideally
offers a good methodology for optical tagging and joining of standalone optical
fibers to furnish high transmittance even if the fibers were in misaligned orientation.
3.13 Future Scope
The methodology discussed above when supported by smaller (diameter <
350 microns) SU8 droplets over the two fibers or fiber-waveguide-fiber, may
provide improved and optimized solutions for signal transmission and sensing of
biological entities.
3.14 Conclusion
Through this work, we have attempted to explore and develop a new
technique to tag optical fibers on the surface of a substrate with the aid of SU8
microdroplet and CO2 laser source. The exposure parameters of the laser machine
were optimized in such a way that the SU8 material very close to the substrate
melted locally up to several layers due to heat reflux from the surface of the
substrate. This melt then resolidified to ensure a good bond between the fibers,
droplet and the surface. It was further ensured through heat transfer simulations that
the fiber or SU8 are not degraded while getting heated. The DOE factors are lasing
speed and lasing power with single objective of Transmittance. The optimization
process gives optimized values of these laser machine parameters with the
mathematical model set on least square techniques. Speed /power = 52/1 was
obtained for transmittance of 0.792. The stitched or bonded optical fiber was then
extensively evaluated for % transmittance or optical characteristics when input light
was transmitted through the SU8 microdrolet to the output fiber. It was observed
through simulations as well as experiments that the fibers demonstrated high
transmissibility in two circumstances. One is in which the fiber is completely
connected end to end. In the other configuration the fiber ends were shifted away
from each other till they come very close to the outer surface of the drop where due
to the WGM effect the transmissibility was found to increase. The method was
further evaluated for aligned and misaligned fibers and transmissibility was found to
have similar behaviour in both the cases. Thus the work ascertains that optimized
laser beam exposed SU8 micro-droplet can be used to couple two or more optical
fibers maintaining an overall high level of optical coupling efficiency.
Chatper-3 Laser Heat Transmission for High Efficiency Bonding of Two Optical Fibers Using SU8 Microdroplet
60
Reference
1. Book: Maria L. Calvo, Vasudevan Lakshminarayanan ,“ Optical
waveguides: from theory to applied technologies”, CRC Press Taylor and
Francis Group.
2. M.B.Frish, J. Fijol, E.E. Fike, S.A. Jacobson, P.B. Keating, W. J. Kessler, J.
LeBlanc, C. Bozler, M. Fritze, C. Keast, J. Knecht, R. Willamson, C.
Manolatou, “ Coupling of single mode fibers to planar Si Waveguides using
aldehyde) of the surfaces by various interaction methods in immobilization
processes [16]. This invokes heterogeneity in population of immobilized proteins.
The epoxy surface chemistry is most popularly used for its characteristic
stable reactions, even in severe humid and varying pH conditions. It reacts with
many nucleophilic groups and establishes strong bonds to qualify as a means to
perform nominal chemical processing of the protein moieties. Covalent attachments
between epoxy supports and proteins is very slow but the proteins attachment on
sites nearby to the epoxy sites in the same support is very fast [17] A 2-step
mechanism of rapid adsorption, then, intramolecular chemical attachment to
supports with higher “apparent” concentration of epoxy functionalities is very often
used for immobilization of protein molecules. Epoxy-agarose conjugates endorse
negligible immobilization of proteins at low and at high ionic strengths owing to the
lack of hydrophobic core for adsorption processes to start. Epoxy-amino group aided
ethylene-diamine layer promotes physical adsorption of amine group and then
covalent linkages by epoxy groups.
Chatper-4 Interaction of Biomolecules with Solid Polymeric Surfaces of SU8 Microdroplet and Porous…
72
Another important group of surfaces is photoactive surfaces.
Photolithography was applied in spatially-directed fabrication of oligonucleotide
arrays on selective surfaces using photolabile protecting groups [18, 19]. This photo-
reaction strategy is a well-organized and quick one-step reaction with no
functionalization requirement of target molecules. It can be utilized for biomolecules
which lacks sufficient active functional groups. The reaction needs moderate
surrounding conditions and is unaffected by temperature and pH conditions.
Photoactive reactions confer biocompatible surfaces. The common photo-reagents
such as diazirines, arylazides and benzophenones are activated by photolysis via
incident light of wavelengths ≥350 nm, but most of the other biomolecules are
transparent. Arylazides on photolysis are converted into reactive nitrene
intermediates which can be inserted into C-H bond. It provides slow binding.
Diazirines upon photolysis creates reactive carbenes which act in response with
proteins within microseconds forming covalent chemical bonds. An irreversible
linkage between the proteins and surfaces is generated, thus enhancing the molecular
immobilization. Nitrobenzyl linker provides the attachment of labile chemical
groups which on UV exposure generates CO2, freed reactive groups, ketone and
CO2.
Bio-affinity immobilization is creation of biochemical affinity-bonds of a
certain group of protein sequence (e.g. biotin, histidine, carbohydrate residue etc.)
with the activated substrate (e.g. avidin, lectin, metal chelates etc.). It has benefit of
having oriented and homogeneous immobilization of biomolecules on the surfaces.
Proteins can be detached from the surface and the same surface can be reused for
other purposes. Clinical and biomedical microdevices are required to be
characterized to have chemically inert surfaces to avoid non-specific adsorption of
proteins. Antifouling surfaces are highly protein resistant surfaces. Polymer surfaces
are passivated and made resistant to adsorption of proteins or adhesion of cells with
the treatment of PEG Poly (ethylene glycol).
4.4 Surface Modification Techniques of Solid Polymeric Surfaces
Solid polymeric surfaces can be modified with plasma or chemical treatment.
In plasma modification there are two categories:
1. Exposure to gas plasma for physical or chemical surface alteration
Chatper-4 Interaction of Biomolecules with Solid Polymeric Surfaces of SU8 Microdroplet and Porous…
73
2. Plasma deposition or polymerization to grow a film on surface by plasma
phase reaction. Plasma treatment builds up an undamaged oxide thin layer on
poly(dimethyl) siloxane (PDMS) with active silanol groups changing the
hydrophobic surface to hydrophilic, when the process maintains high
pressure, low RF power, short duration exposure [20]. Plasma polymerization
is a process of deposition in an environment of plasma discharge. In this
process the vapour phase develops a thin polymeric film on surface of
microchannels fabricated using variety of materials. This is a solvent-free, one-
step method in which virtually any dry substrate can be coated with a thin film
[21-23]. Hexamethyldisiloxane (HMDSO) is used to coat open microchannels
of glass for protein separation using iso-electric focussing [24].
Surface modification using chemical methods:
1. Polymer surface silanization for covalent linkages
2. Self assembled monolayer [SAM]
In silanization method the silanol groups are substituted on the surface by
Oxygen –plasma [Silicon surface: Si-OH] method. Polymeric surfaces are silanized
with the following procedure: Polymeric coated surfaces to be silanized were kept
immersed in 2% (3-mercaptopropyl) trimethoxysilane (MTS) in Toluene solution, in
nitrogen (N2) atmosphere for 1-1.5 hours. They were cleaned in Toluene and dried
with N2 gas. After this MaleimidoButyryloxy-Succinimide ester in Ethanol was
poured on the sample. The samples were washed with PBS (Phosphate buffer silane)
three times. GMBS was included to ethanol after suspending in 50µl N, N-
Dimethylformamide. The last step ensures that sufficient ethanol is present during
incubation [25]. The modified surfaces were well-suited for interactions with
proteins and antibodies. The reaction is shown schematically in figure 4.2.
Chatper-4 Interaction of Biomolecules with Solid Polymeric Surfaces of SU8 Microdroplet and Porous…
74
Fig.4.2 Schematic of silanization reaction on polymer surfaces. [J-J Chen et.al.
(25)].
4.5.1 Need to Explore Polymeric Sensors
As per discussion in chapter 2 [Simulation of coupling elliptical
microsleeve], chapter 3 [ binding and Coupling with a microdroplet ], chapter 4 [
Interaction of solid polymeric surfaces ], on various aspects of polymers used as
biosensors; need of research and efforts in exploration of possibility of role of
polymeric devices in the field of low cost, sensitive biosensing, seems evident. The
facts that polymers can be easily doped, polymer resonators can lower losses, they
were realized in microlasers, chemical sensors [75]. Polymer waveguide like
microstructures make integrated devices highly efficient, with its capacity to carry
light over a longer distance while enabling interaction of better quality between
optical signal and the host material. Polymeric materials are available in wide range,
type, cost. Fabrication of these devices is easier and optical properties are good.
They are mostly biocompatible and adapt well with the application situation. Simple
surface functionalization and immobilization methods are used for these
materials.Hence it is pertinent to study and explore the biosensing feature of
polymeric materials; SU8, a negative photoresist material in particular.
4.5.2 Related Work
It is important for researchers looking for early detection in life threatening
diseases, to identify biomarkers in sensitive and robust way, for further investigations.
Biomarkers involve separating DNA, Cells and proteins from blood, body fluid or
other samples. Conventional methods involve beads, filters, resins amongst other
controllers. They have properties to attract or process specific biomolecules. Surface
immobilization of required analytes need surface modification or functionalization
Chatper-4 Interaction of Biomolecules with Solid Polymeric Surfaces of SU8 Microdroplet and Porous…
75
to suite the chemical interaction. The chemical coupling is caused by covalent
bonding, adsorption, encapsulation or entrapment. In case of solid polymeric
surfaces, to be more precise, of epoxy based, negative photoresist SU8 material,
M.Joshi et.al. [76] used Sulfochromic solution to remove C-O bonds and instill
hydroxyl groups on the UV exposed SU8 coated surface. Amino groups were
created with silanization treatment for bonding of antibodies. Wang et. al [77 ] used
Cerium (IV) ammonium nitrate [CAN] with nitric acid or sulfuric acid on residual
epoxy groups of fabricated SU8 surface for grafting hydroxyl groups by method of
oxidation. In a detailed study [78] reports of interaction of proteins with polymer
material surfaces were seen. Blagoi et.al. [79] compared CAN treated surfaces with
bare fabricated SU8 surfaces for investigating binding kinetics of proteins. Result
according to the report was, better performance of bare SU8 surfaces, making the
process of protein immobilization simpler. In another paper [80] it was reported that
silanization was necessary in case of positive photoresist surfaces for desired protein
immobilization. Techniques of smart immobilization were discussed in a review
paper [81]. After the immobilization step it was characterized by AFM , FTIR , FT-
VIS-IR spectroscopy, stain and dye tests [82,83] for confirmation. Label free
technique of detection of protein antigen-antibody binding was preferred over
labeled technique due to sheer simplicity and rapidness of the assay. One of these
techniques was refractometric which was used in detection of proteolytic activity,
BSA antibody-antigen binding by noting the spectral shifts [84, 85] after each step.
BSA coating protects possible adherence between substrate and analyte, this
property was made use of in a novel microrobots-bioactuator to prove [86] the
concept. Bare UV exposed SU8 microcubes were selectively coated by fluorescence
tagged BSA layer to allow and observe attachment of specific bacteria cells to only
uncoated cube surfaces. Fluorescence imaging was used to see the result. Figure 4.3
shows the resultant selective binding.
Some methods of isolation of protein, DNA for biomarkers of life
threatening diseases involved functionalized microspheres, instead of conventional
methods to capture specific analyte from samples. Making of cost effective, simple
to dope silica microsphere was the research topic in the interest of highly specific
target sensing [87].
Chatper-4 Interaction of Biomolecules with Solid Polymeric Surfaces of SU8 Microdroplet and Porous…
76
Fig. 4.3 BSA coated microrobots with bioactuators [a] Extraction of selectively
BSA coated microcubes [b] Bacteria attached to bottom uncoated side [c] Fluorescent microscope images of bacteria attached to uncoated, selectively BSA coated, BSA whole coated microcubes, [d] Comparison between three configurations on the basis of number of attached bacteria. (Park et. al. [86]).
Additional features of the silica microspheres observed: light in weight to
float in a sample solution, smoother, non-porous surface for effective and specific
binding [See figure 4.4].
Fig. 4.4 Silica microsphere for isolating proteins (a) unconjugated silica micro-sphere (b) Protein A conjugated silica microsphere with bound mouse IgG. For visualization of bound biotinylated goat anti-mouse IgG, NeutrAvidin TM conjugated to silica nano-particles doped with FAM dye is used. [Stefansson et. al. (87)]
4.6 Steps involved in fabrication of an optical biosensor connector
4.6.1 SU8 Microdroplet used as WGM Resonating sensor
Optical biosensing is considered most versatile amongst various techniques
of biosensing analytes [DNA, Bacteria and viruses] from sample solutions. It is fast,
Chatper-4 Interaction of Biomolecules with Solid Polymeric Surfaces of SU8 Microdroplet and Porous…
77
accurate, clean, stable, contact less, operating in UV-VIS-IR range. It can be
categorised on the basis of type of optical signal sensed, which property of signal
has changed in response to change in surrounding sample, labled or lablefree.
Fig. 4.5 (a) Micro-sphere developed on the tip of an optical fiber using low power Laser processing (b) Ninhydrin treated biomimetic SU8 microdroplet.
Various optical detection techniques are Fluorescence detection, change in
refractive index detection, evanescent field sensing, sensing surface Plasmon resonance.
Sensing or recognizing element has its material surface properties and functional groups
changed to facilitate its reaction with specific analyte. Optical fibers are most commonly
used waveguides for carrying signals into and out of the microchips in Lab-on -chip
applications and communication applications. The connections of fibers to the
microchips, at specific locations is a crucial task. Construction of the silica microsphere
is a real problem and involves Laser irradiation (see figure 4.5) of fiber tip followed
by chemical etching which is very low yield process. Micro-spheres are not free
from vibrations and as the change of wavelength if in ‘pm’ level it can be very
sensitive to thermal noise or any other noise. The whole body of the Micro-sphere
which is around 100-150 microns in radius needs to be immersed in the analyte thus
necessitating the analyte volume to be high which is always very difficult to obtain.
In this section we propose simple SU8 microdroplet [with or without bonded
optical fibers] as a WGM resonating sensor. Photonic software simulation supports
this concept [73]. Two optical fibers are joined on a hard substrate [Silicon wafer /
Glass] by using a SU8 micro-droplet. When the wavelength and launching is right
Whispering gallery modes start circulating continuously, while sensing the
molecular activity at the equatorial periphery. Advantages of SU8 material besides
Chatper-4 Interaction of Biomolecules with Solid Polymeric Surfaces of SU8 Microdroplet and Porous…
78
being an excellent microstructurable material are many, it is biocompatible,
transparent, relatively inert and has very good optical properties. Radius of
microdroplet is 150~250µm. Its smooth surface can be functionalized and processed
to suite the signal coupling fiber bonding and biosensing requirements. It is very
important that the SU8 microdroplet is a perfect hemisphere or hemi-ellipsoidal,
microsphere, smaller in diameter (100-150 µm), having smoother surface, to get
good sensing conditions. The optical fibers are required to be decladded or tapered
further to achieve this. Efforts are on and the future goal is to get all these three
conditions achieved to further improve its functionality as an optical sensor.
Fig. 4.6 (a) Analyte sensing using SU8 microdroplet in a PDMS well (b)
Challenging goal to get a perfect SU8 microsphere.
As shown in Figure 4.6 the SU8 microdroplet can be used to find out the
binding kinetics of sample solution. With WGM response sensitive to evanescent
field region, in terms of variation in effective refractive index, it can be used as a
refractometer.
4.6.2 Fabrication of SU8 Microdroplet Sensors [Laser or UV]
Before embarking upon protein immobilization tests on SU8 microdrop,
number of experiments were carried out on spin coated SU8 layers on Si, Glass,
plasma treated Si/ glass surfaces with or without UV exposure and with CO2 Laser
exposure. After the fabrication, various methods of immobilization were used to find
a best suited method for our purpose. Some of the methods of surface
functionalization and immobilization tested were, 1. H2SO4 [Dip test surface in
Chatper-4 Interaction of Biomolecules with Solid Polymeric Surfaces of SU8 Microdroplet and Porous…
79
95% Sulphuric acid for 10sec, coat entire surface with BSA to incubate for 90 min,
rinse with Deionised water [DIW] thrice and dry with N2 gas] 2. MCPTS [Dip
surface in mixture of 2% MCPTS in Toluene for 60 min, wash with Phosphate
Buffer Saline[PBS], dip in 0.005 NDMFM in ethanol for 60 min, wash thrice with
PBS, immobilize in PBS solution of BSA overnight, wash with PBS buffer]
3. Get the SU8 surfaces UV exposed suitably.
According to the results of this exercise, it was observed that:
1. Laser treated SU8 Micro-droplets were suitable for signal coupling [Ref:
chapter 3], hence they can be easily adapted to refractometric sensing of
solutions under test with varying refractive indices.
2. UV exposed SU8 surfaces were functionalized suitably for protein
immobilization, so protein assisted or repellent [antifouling surfaces] analyte
sensing can be explored. Based on results of SU8 thin film coated surfaces,
immobilization techniques were implemented on SU8 microdroplets.
Fabrication, functionalization and immobilization procedures for both types
of microdroplet were similar; it involved manual dispension of drop using
2.5µl micropipette. In one of the methods of dispensing, X-Y-Z stage and
flow controlled dispensing pump for 1ml Syringe was used to carry out
precise and controlled dispensing. Glass slides and Si wafers were cut into
1cm size to dispense SU8 microdroplets. One set of glass slides was used for
UV exposure and treatment, other set for CO2 Laser exposure as methods of
surface functionalization .In UV exposure microdroplets on glass/ Si
substrates were preheated at 95˚C for 5min, exposed to UV light for 80 sec,
then post exposure bake was another 5min heating at 95˚C. The devices were
ready for post processing. Similarly laser exposure procedure involved
precise control on power /speed, center position, time to get perfect bond
[Ref.: Chapter 3] and sensing.
4.6.3 Extraction of SU8 microdroplets from Substrate
The work presents possibility of both stand alone and chip based sensing
scheme. The microdroplet devices can be used on the substrate or extracted to use as
independent sensing component. The extraction step may be before or after
immobilization, accordingly the substrates were heated at 80˚C for 24 hrs [87]. Then
Chatper-4 Interaction of Biomolecules with Solid Polymeric Surfaces of SU8 Microdroplet and Porous…
80
carefully they were detached from substrate with the help of a knife. Extracted or
attached micrdroplets with or without fiber bonding were then subjected to
refractometric test [CO2 Laser treated] or protein immobilization test [UV exposed].
4.6.4 Surface Immobilization
UV exposed bare SU8 microdroplets [87] were used for further processing.
Figure 4.20 shows BSA immobilisation, microdroplet removal and stain and dye
tests along with its applications. The microdroplets thus detached were tested for
bonding of E-Coli cells on selectively coated and uncoated surfaces. Microdroplets
in 3 groups were incubated with BSA for a period of 8 hours. First group had
droplets extracted from the substrate and completely immersed in BSA solution for
full coating. Second group had droplets attached and intact on the substrate. Only
top dome like surface was subjected to BSA coating. Extraction step was after
immobilization. Third group was kept aside; it was not incubated in BSA solution.
Thus there were o6 groups; attached, extracted; fully coated, partial top coated and
not coated microdroplets. These microdroplets were stored separately and marked
for reference. Now they can be flown in a channel for observation of fluorescence
effect under microscope. Figure 4.13 Shows images of various test results of these 3
groups. Some optical fiber bonded microdroplets were detached and placed in a
1cm2 PDMS [Polydimethylsilicone 10:1 curing agent after desiccation, in plastic
mould for 45 min in oven at 95˚] well for carrying out similar sensing experiment.
Thus the hemispherical microdroplets as shown in figure 4.7, 4.10, 4.12 can be used
as standalone or chip-based sensing entities.
Fig. 4.7 Method of BSA immobilisation on microdroplet [with and without optical fiber] and its applications (a) Microdroplet dispensing (b) UV exposed microdroplets (c) BSA immobilised on microdroplet surfaces (d) Microdroplets detached from substrate with heat treatment and then subjected to stain & dye test.
Chatper-4 Interaction of Biomolecules with Solid Polymeric Surfaces of SU8 Microdroplet and Porous…
81
Fiber bonded microdroplets were used to sense varying concentrations of
ethanol. In another set of experiments, BSA coating, dye doped E-Coli binding,
ninyhydrin test, AOD tests were carried out to check the sensitivity of the sensing
device.
Further Green Fluorscence Protein [GFP] tagged E-Coli was administered on
the UV exposed selectively BSA coated microdroplets to conform the protein
immobilisation sensing.
4.6.5 Characterization of the Microdroplet Sensors
As mentioned previously because of the curved nature of surface, thickness
in sub mm range and 3-D appearance, none of the conventional imaging or
characterization schemes is suitable. Being a solid state device fluorimetry method is
difficult to incorporate. Best solution was to characterize fiber bonded sensor
microdroplets with microscopy and Spectra-Suite mini spectrometer test setup for
measurement of light intensity with its array detector and supporting software. LED
sources of suitable excitation wavelengths can be used. As mentioned above only
elimentary results were obtained and spectrometer results are possible subjected to
the perfect microdroplet shape, size and smoothness. The future work entails this for
a perfect optical biosensor connector. The independent microdroplets were
characterized for detecting fluorescence intensity on attachment of GFP [Green
Fluorescence protein] tagged E.Coli on selectively BSA coated Microdroplet
surfaces [87]. Number of suitable arrangements, such as use of PDMS well,
Channels etc. can be thought of, for sensing purpose.
4.7 Some Elementary Results and Analysis
In view of the objective of making an SU8 microdroplet sensitive to thin
layers of sample solutions in its evanescent region, surface immobilization methods
were carefully selected as any chemical reactions were likely to corrode the smooth
glistening surface of the SU8 microdroplet, loosing its transparent appearance. The
immobilization procedures found suitable for thin films, were applied on fabricated
SU8 microdroplets. The tabulated results, when analysed, it was observed that UV
exposed bare microdroplets were suitable for protein immobilisation. Acridine
orange dye and Ninhydrin stain tests were carried out for confirmation. Next
Chatper-4 Interaction of Biomolecules with Solid Polymeric Surfaces of SU8 Microdroplet and Porous…
82
mobility and accessibility was checked with detachment procedure made applicable
to both, with and without fiber bonded, microdroplets [Figure 4.12 & 4.13]. The
detached selectively BSA coated microdroplets were allowed to separately interact
with small quantity of E-Coli cell solution. The results were tabulated, for ease of
understanding, the methods used for ensuring E-Coli cell binding on Microdroplet
surface. The procedure is to use one fiber bonded microdroplet to detect change in
concentration of Ethanol [0.025ml/ml to 0.825ml/ml]. The microdroplet acts as a
whispering gallery mode resonator with BLUE [446-483nm] wavelength source.
With change in concentration of sample solution in the evanescent region of the
microdroplet, effective refractive index or effective radius of the device will change,
causing a Blue shift [towards left of Visual spectrum [300-1100nm] or Red shift
[towards right of visual spectrum] of the peak output wavelength. The equation (4.1)
defining this relation is
..........……………………………….(4.1)
where λm is resonant wavelength of microdroplet , Rm is radius of micro-droplet, Nm
is refractive index of microdroplet under consideration. Proportionality sign of
equation (1) signifies that the microdroplet is not a perfect sphere, it is deformed.
The output optical signal intensity can be detected by USB 4000 array photo
detector [Mini spectrometer] and supporting software. Graphical presentation of
change in concentration of Ethanol vs wavelength in nm gives sensitivity of the
device. Further to check BSA immobilization, E-Coli cell attachment, dye and stain
test, fiber bonded microdroplet as shown in figures 4.6 can be kept in a PDMS well
for sensing spectral shift due to sample solution administration.
a. Fabrication of SU8 microdroplets
Fabrication of Silica microspheres using gas flame and CO2 Laser:
Initial efforts were concentrated on getting a perfect silica microsphere .Glass
blowing section possessed a gas flame. Figure 4.8 (a), (b) are images of silica
microspheres fabricated by melting an optical fiber tip in an extremely high
temperature gas flame. Resultant microspheres were extremely round and small
[diameter~ 374µm], very brittle. Using CO2 Laser, the microspheres were fabricated.
Chatper-4 Interaction of Biomolecules with Solid Polymeric Surfaces of SU8 Microdroplet and Porous…
83
It required high level of optimization to get moderately good, smaller [diameter
~60µm] microspheres. Fig. 4.8 (c), (d) show the microspheres.
Fig. 4.8 Silica microspheres using (a) and (b) gas flame, (c) CO2 Laser (Gold
Thin film coated) (d) CO2 Laser.
The gold thin film coating on the microsphere was deposited in a sputtering
machine. It strengthened the microsphere and reduced the brittleness.
b. SU8 Microdroplet dispensed using micropipette and syringe:
SU8 is highly viscous in nature and 1µl drop volume was initially required to
be used. Using both X-Y-Z stage, dispensing pump, syringe and manual
micropipette methods the droplets were dispensed. See figure 4.9.
c. Fabrication of fiber bonded SU8 microdroplet [CO2 Laser exposure]:
As shown in figure 4.10, it was difficult to form a rounded SU8 droplet
across the fiber pair because of surface energy of the SU8 and very small volumes
involved. Subsequent coatings on the droplet are shown in the figure. The laser
tagging ensures a strong bond between SU8 and fibers with the substrate.
Fig. 4.9 Microdroplets dispensed using micropipette.
Chatper-4 Interaction of Biomolecules with Solid Polymeric Surfaces of SU8 Microdroplet and Porous…
84
Fig. 4.10 CO2 laser heat treated fiber bonded SU8 microdroplet.
d. Fabrication of fiber bonded SU8 microdroplet [UV exposure] :
The fiber pair shown in figure 4.11 is covered with an SU8 droplet which
Chatper-4 Interaction of Biomolecules with Solid Polymeric Surfaces of SU8 Microdroplet and Porous…
85
e. Extraction of SU8 microdroplets
Figure 4.12 shows pretreated and extracted SU8 microdroplets.
Fig. 4.12 SU8 microdroplets extracted from the substrate.
f. Surface immobilization
Figure 4.13 tabulates the results of BSA incubation and E-Coli attachment to
the selectively coated microdroplets. A2 shows E-Coli attachment to the fully BSA
coated microdroplet surfaces. Its density is comparatively less than the other two. B2
shows the cell attachment at the bottom surface of microdroplet. C2 has higher
density and more uniform cell attachment. This proves the point that E-Coli can
attach to functionalized SU8 surfaces; BSA covering, protecting SU8 acts as a
repellent for E-Coli.
Fig. 4.13 UV functionalized bare SU8 microdroplets, selectively immobilized with BSA solution [A1,B1,C1] incubated with E-Coli cells [A2,B2,C2] observed under the microscope.
Chatper-4 Interaction of Biomolecules with Solid Polymeric Surfaces of SU8 Microdroplet and Porous…


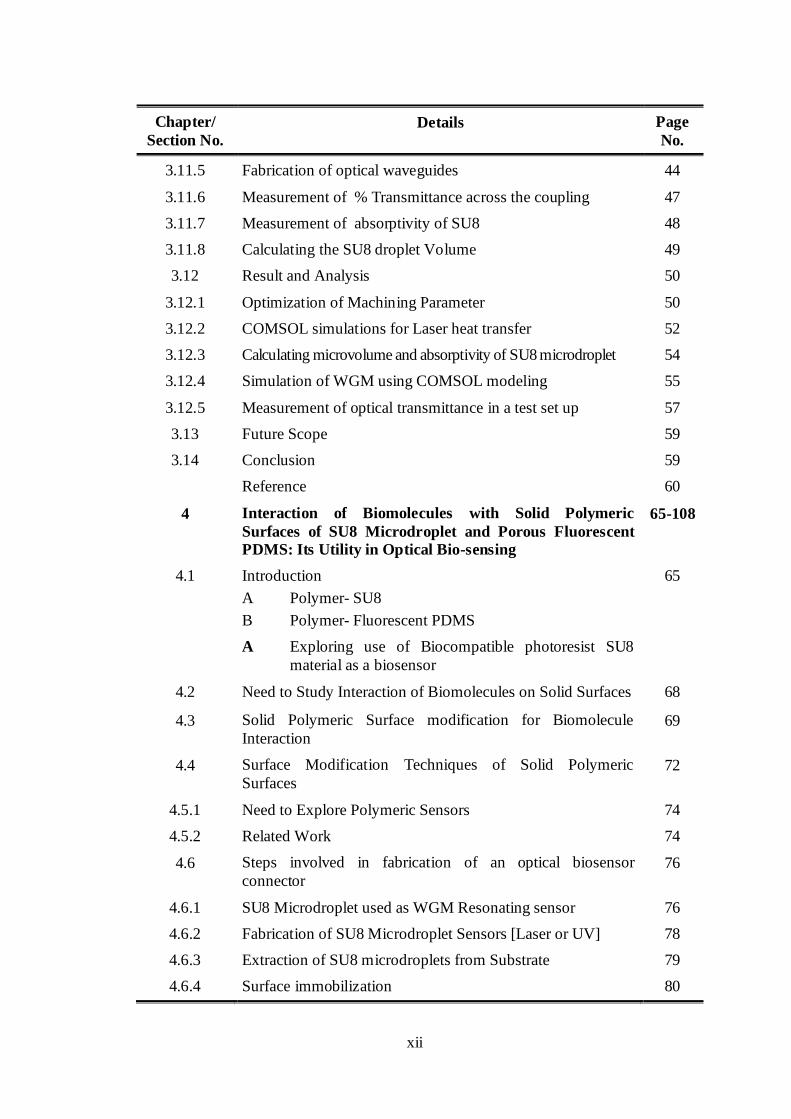
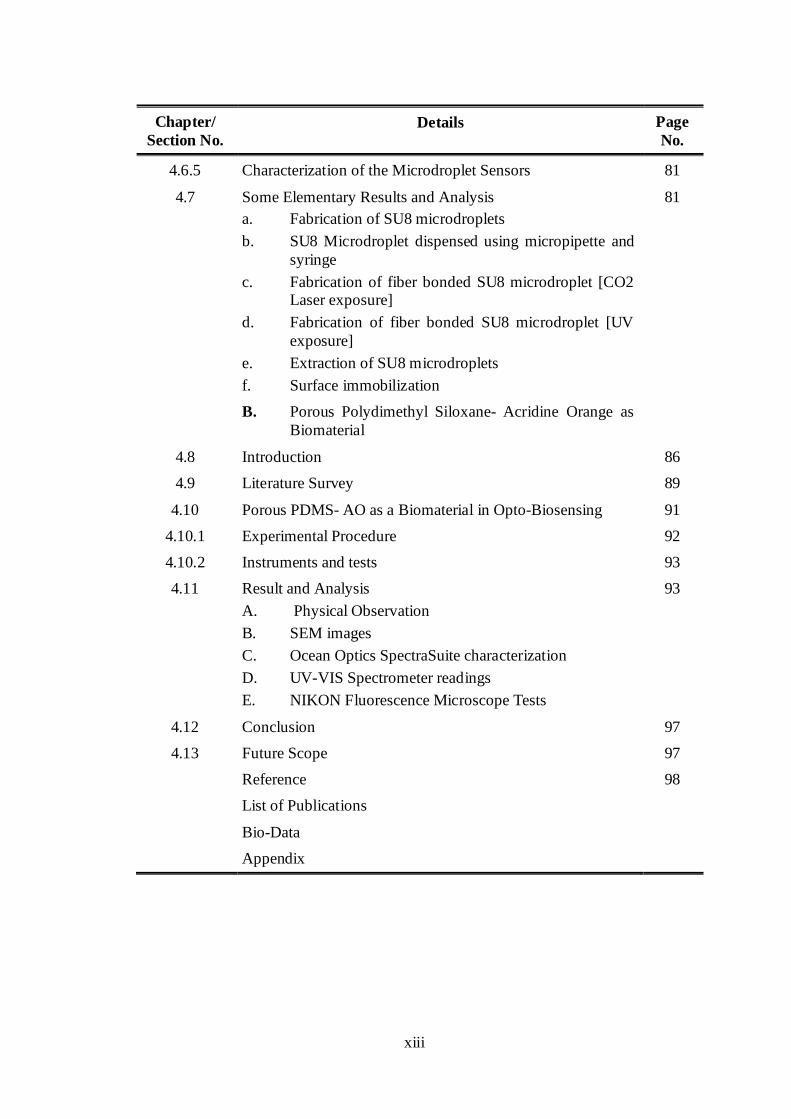


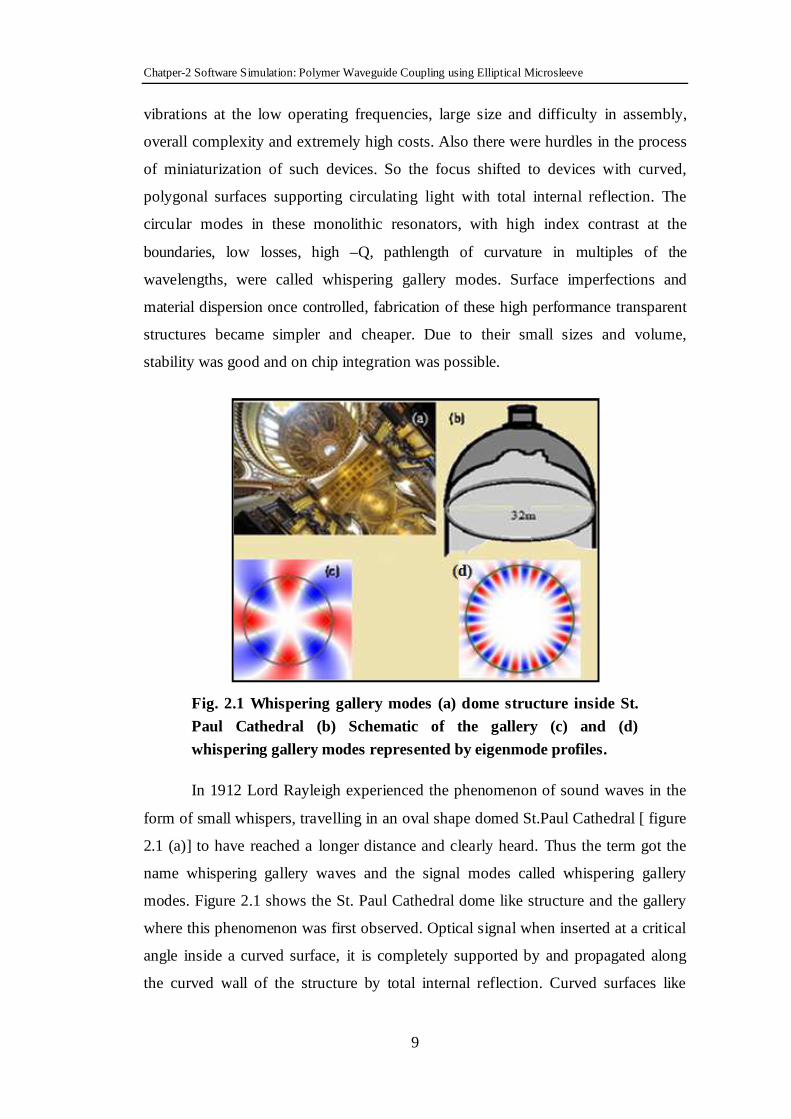

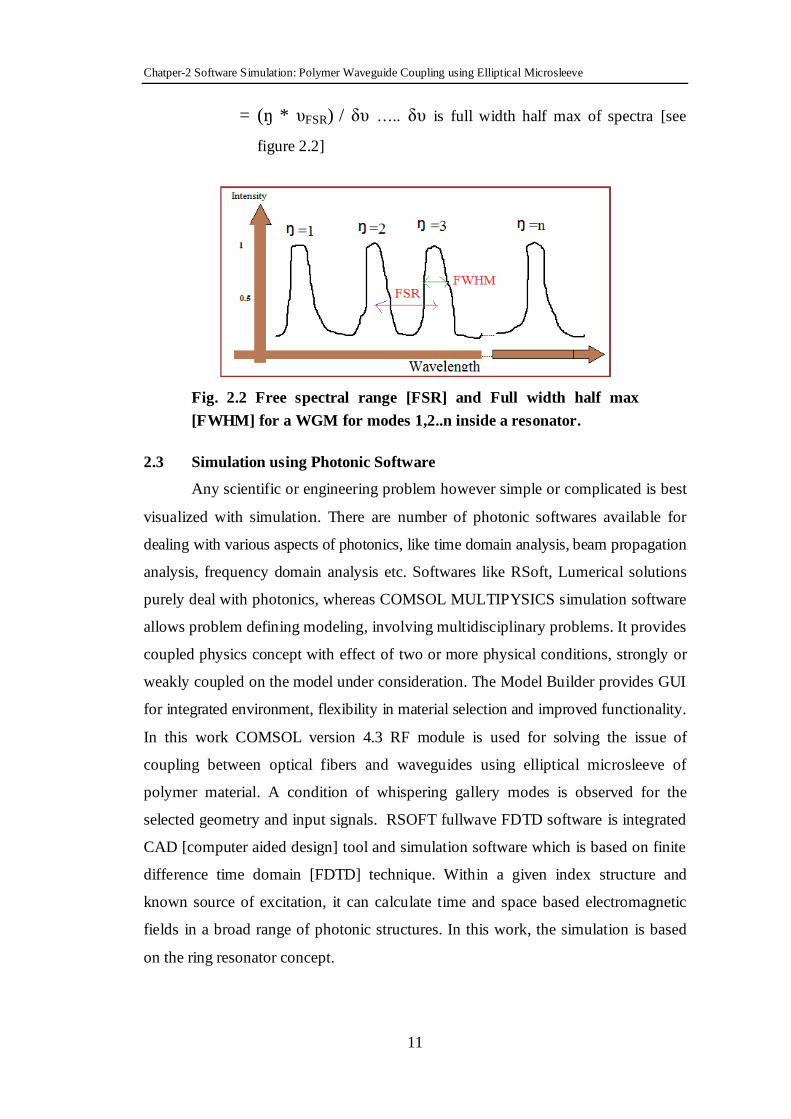
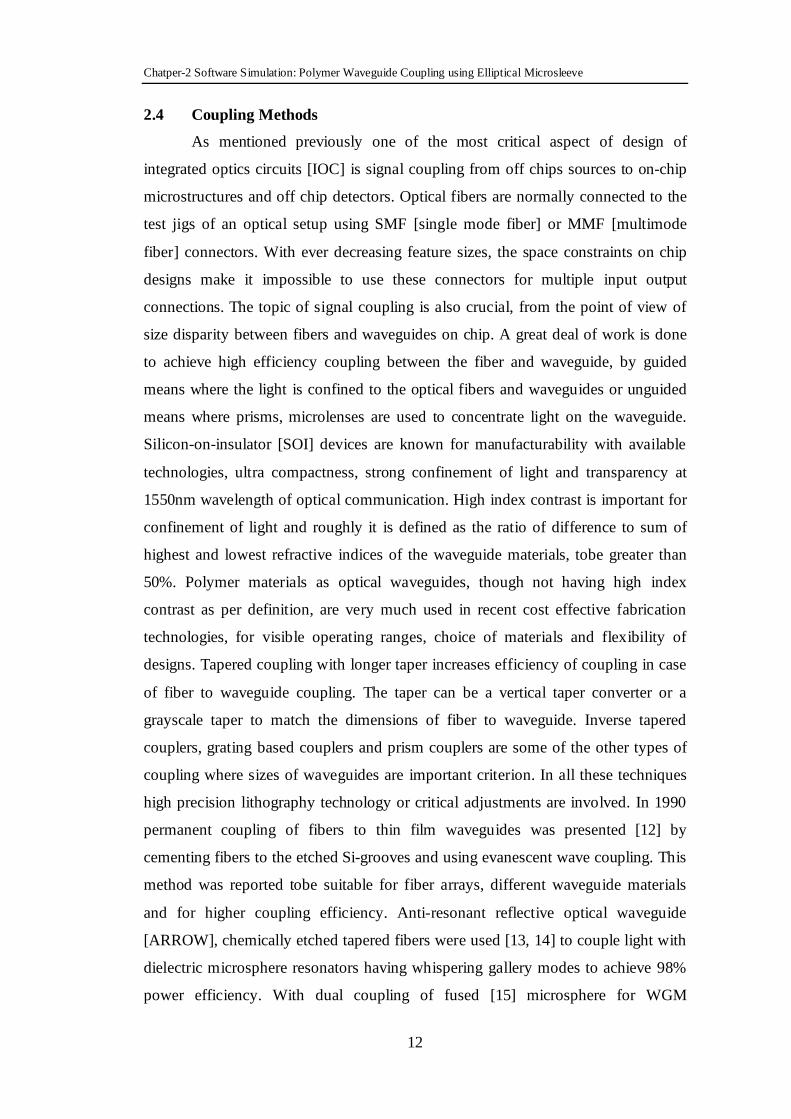

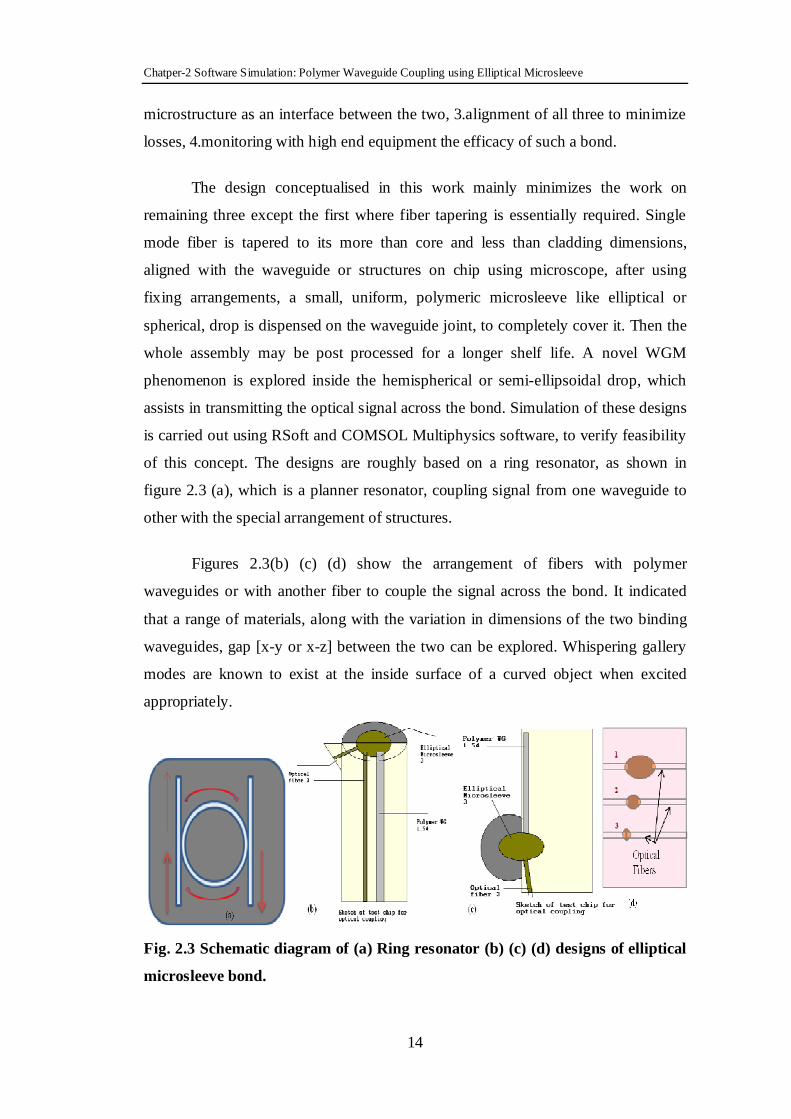
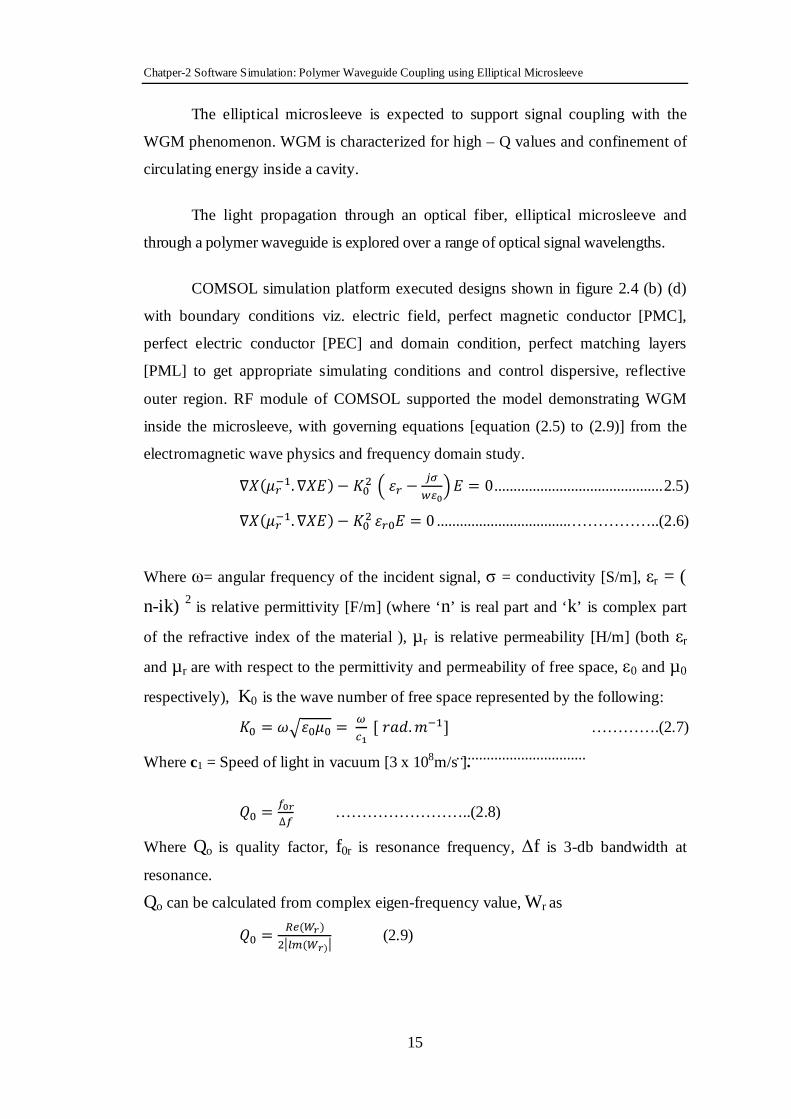
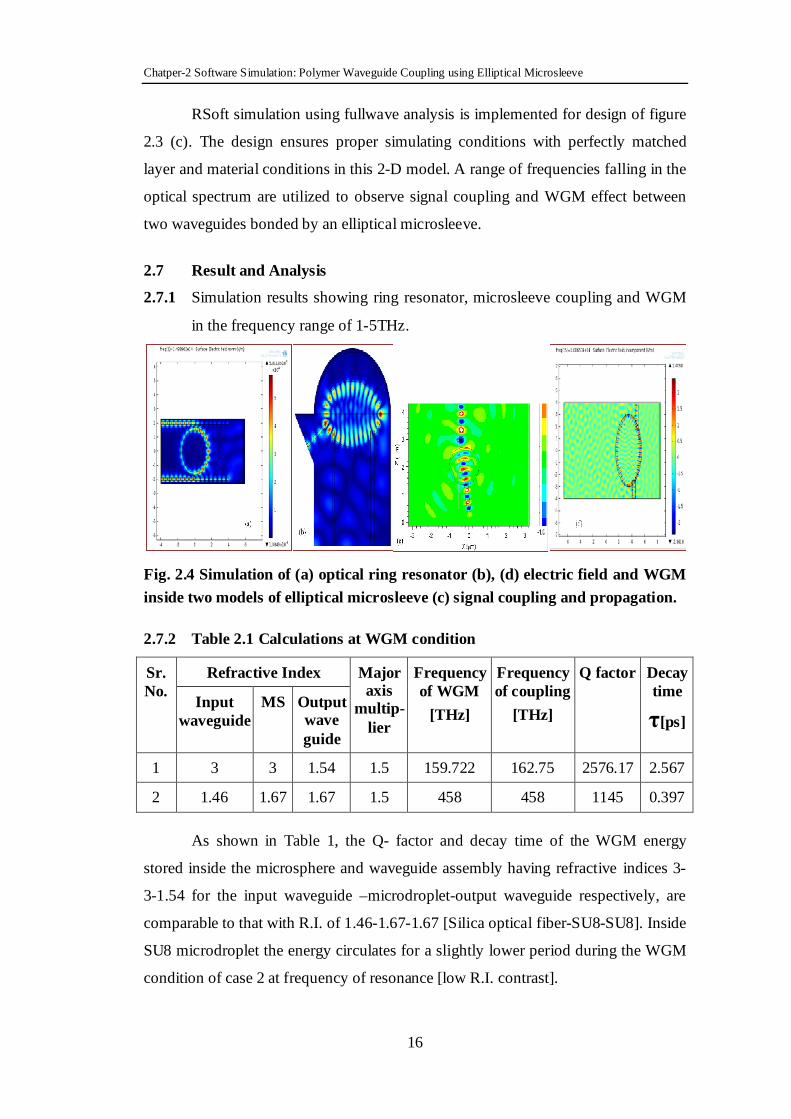
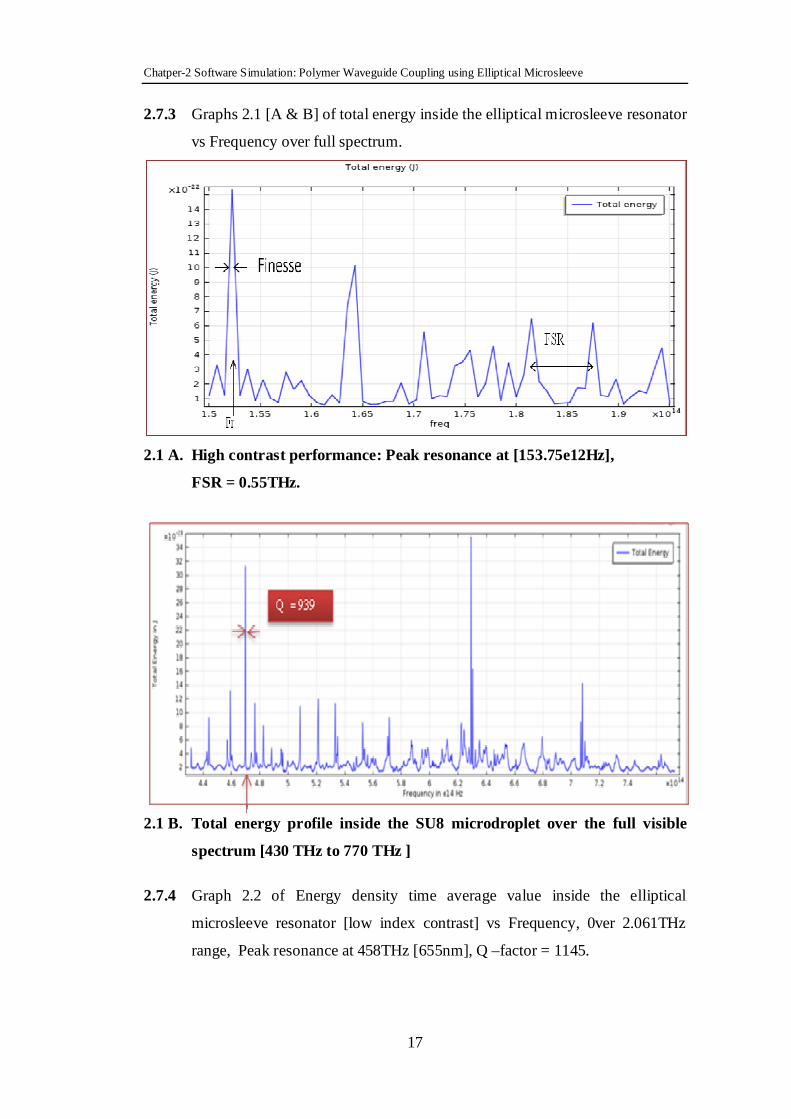
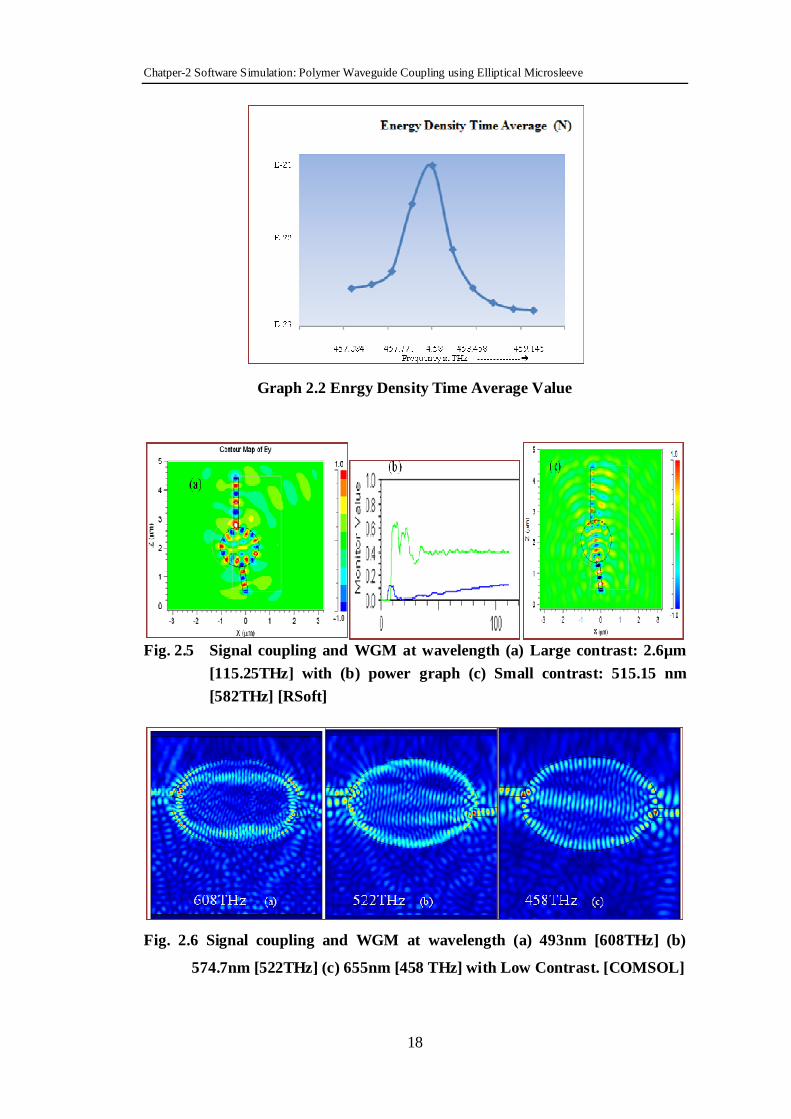


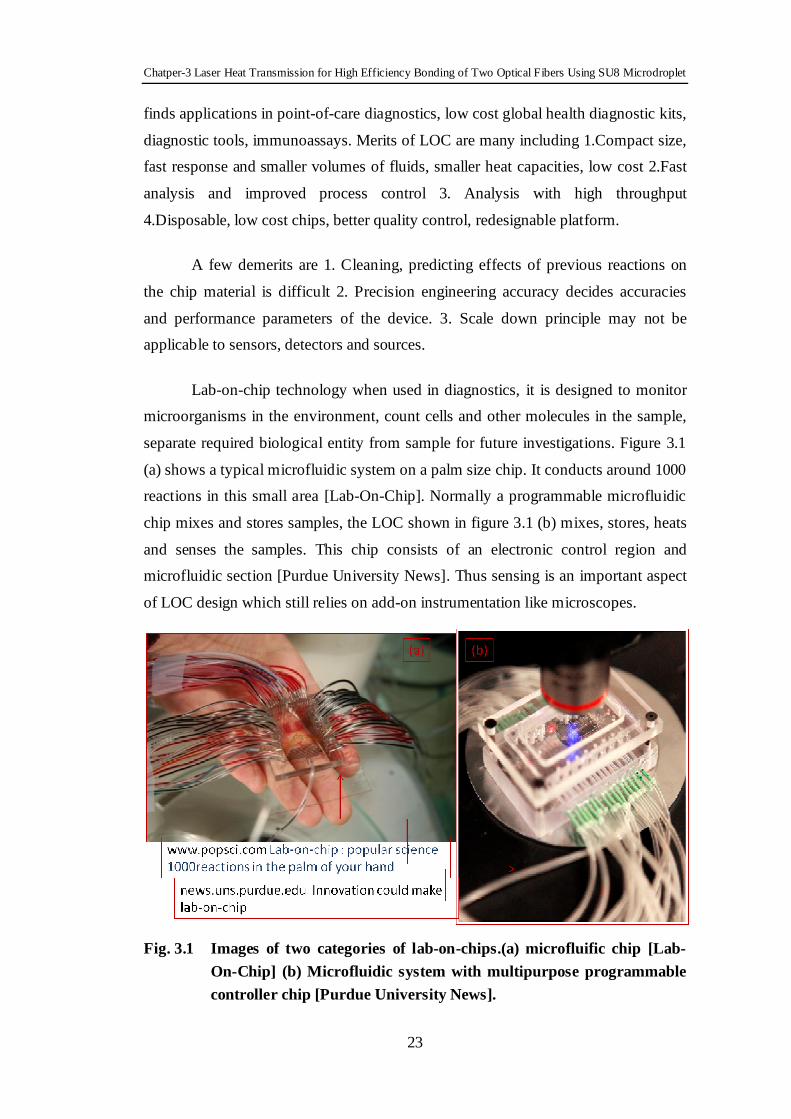
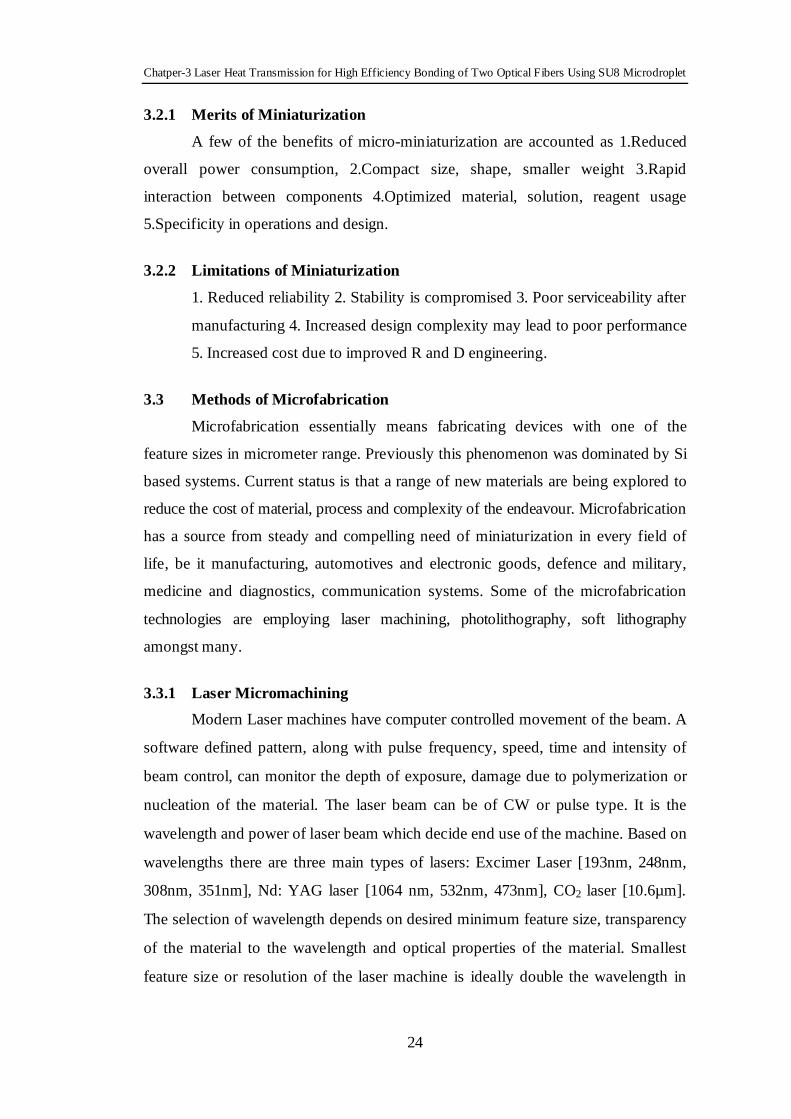
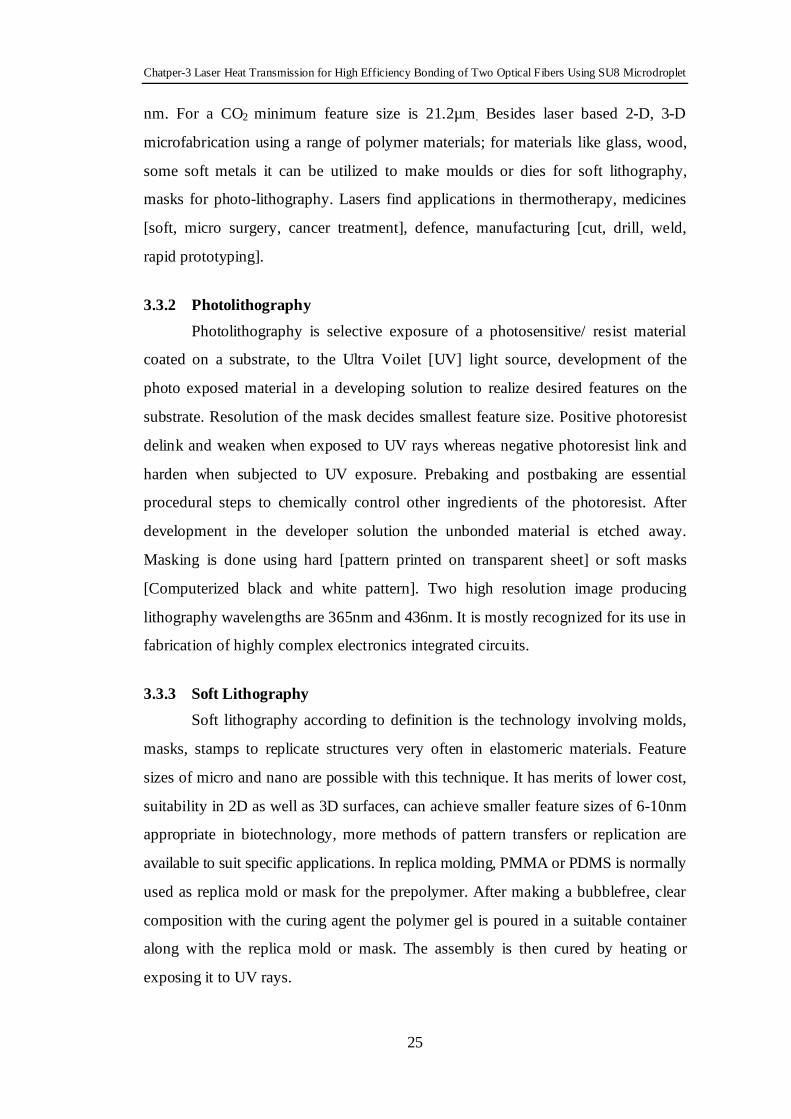
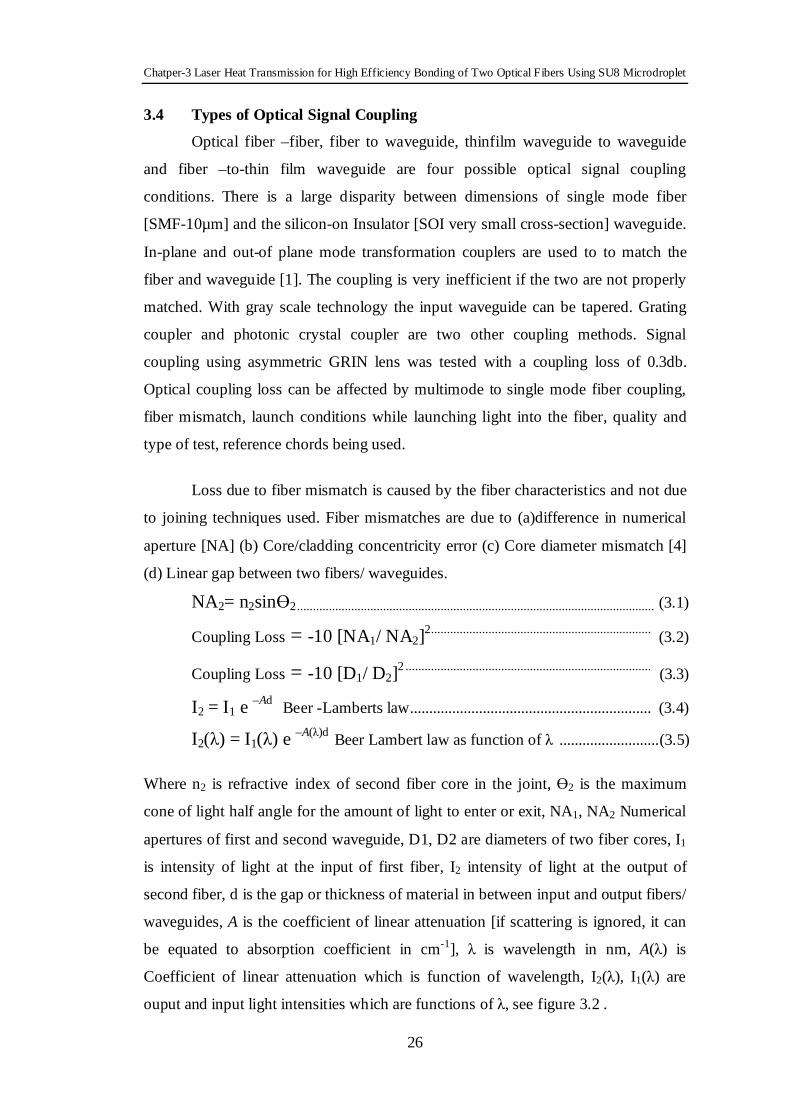


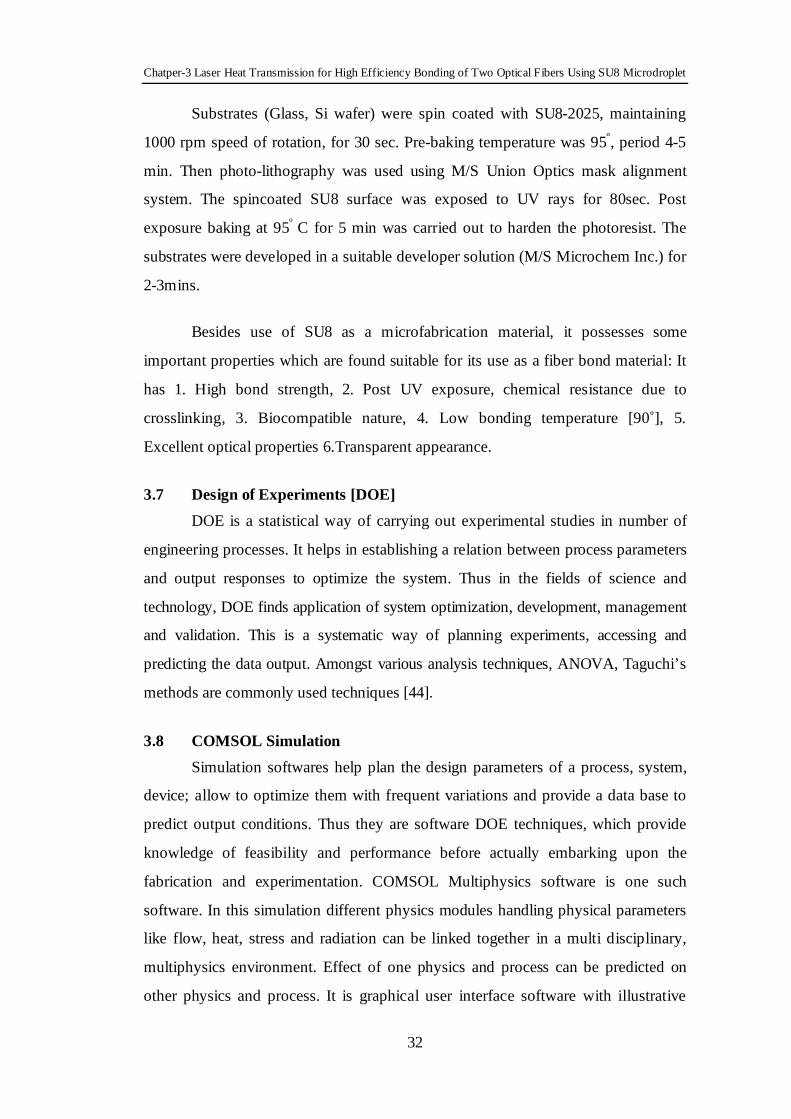
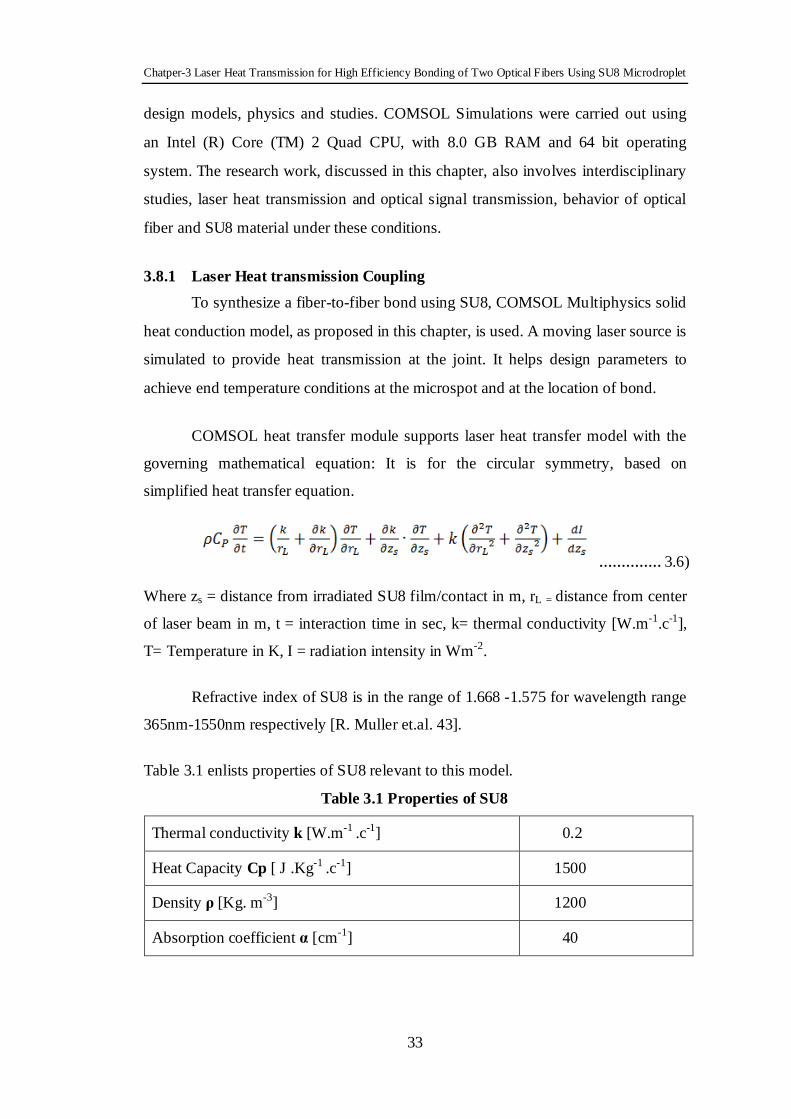


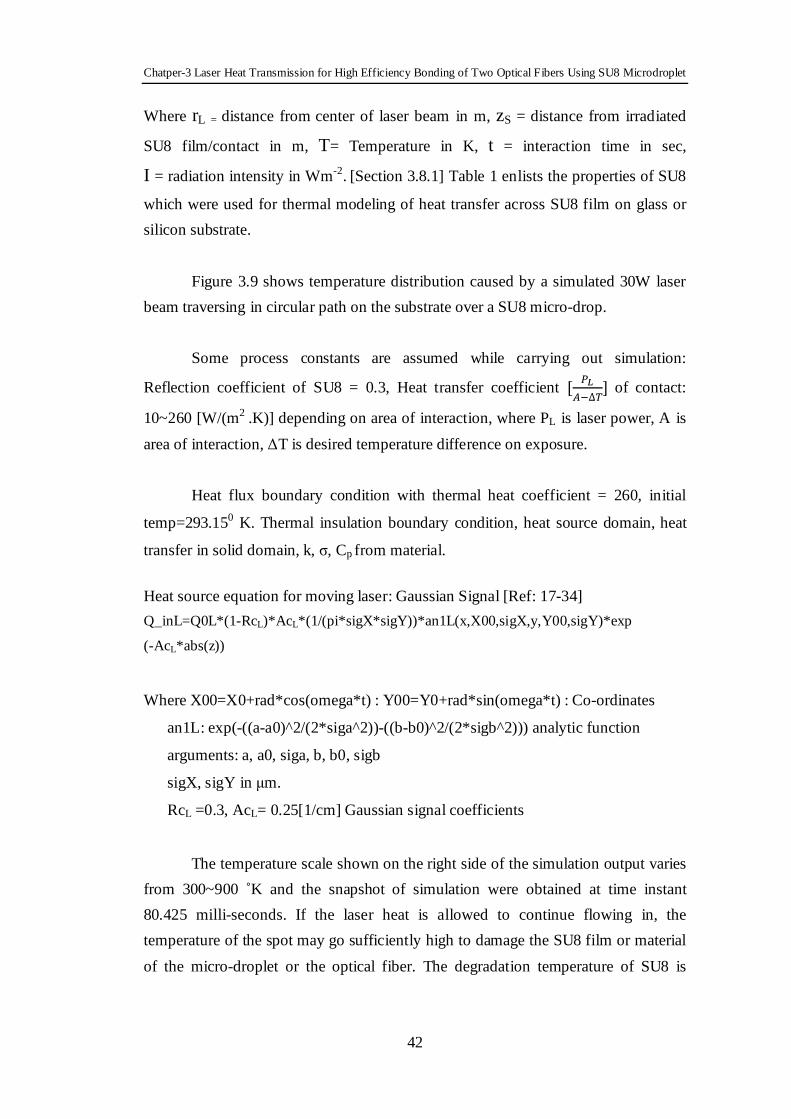
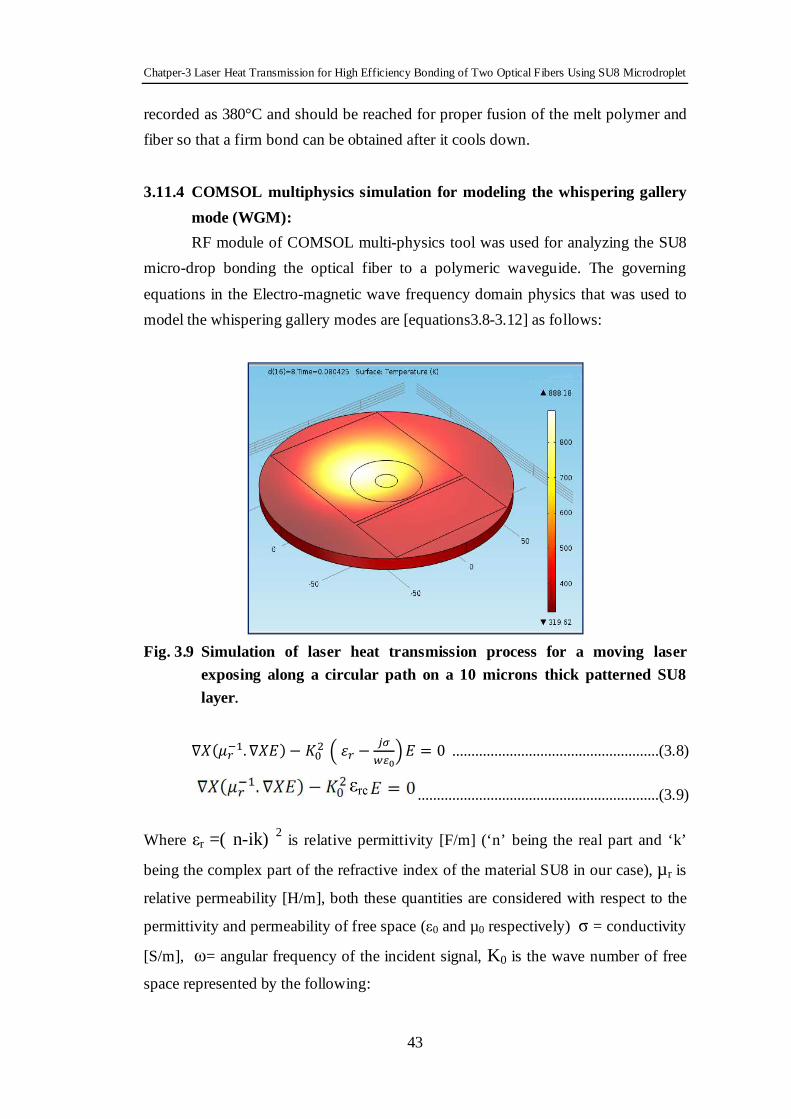
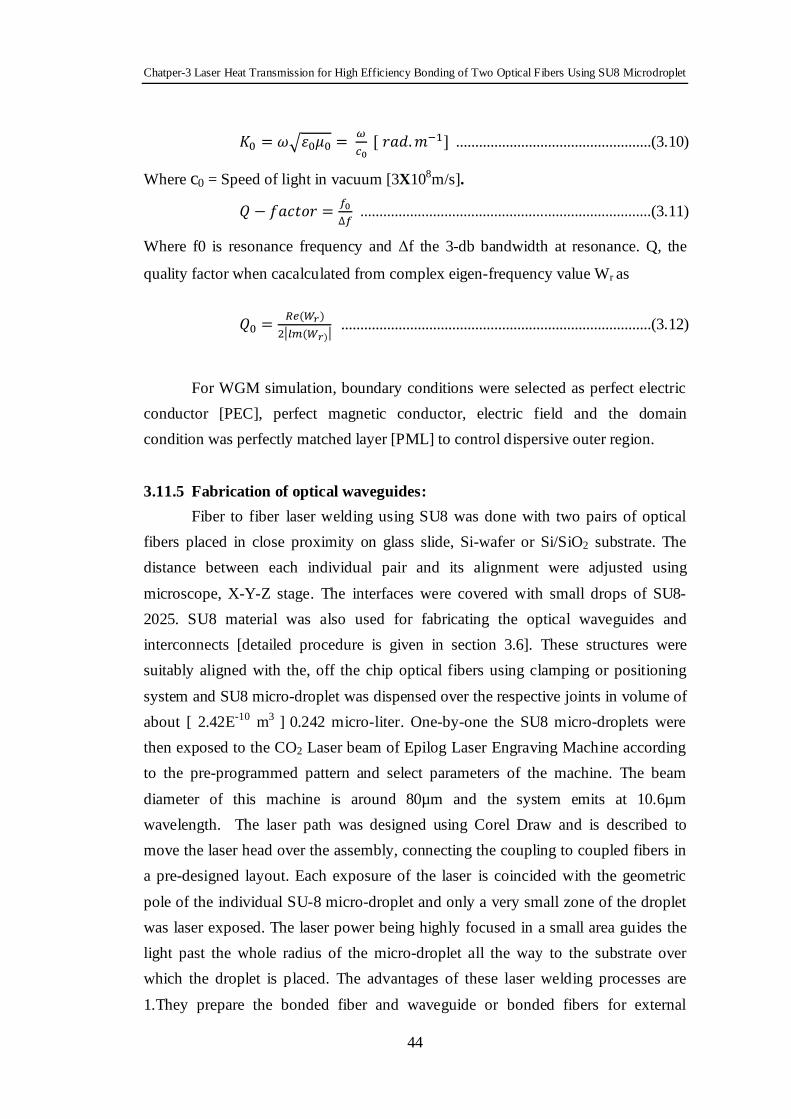


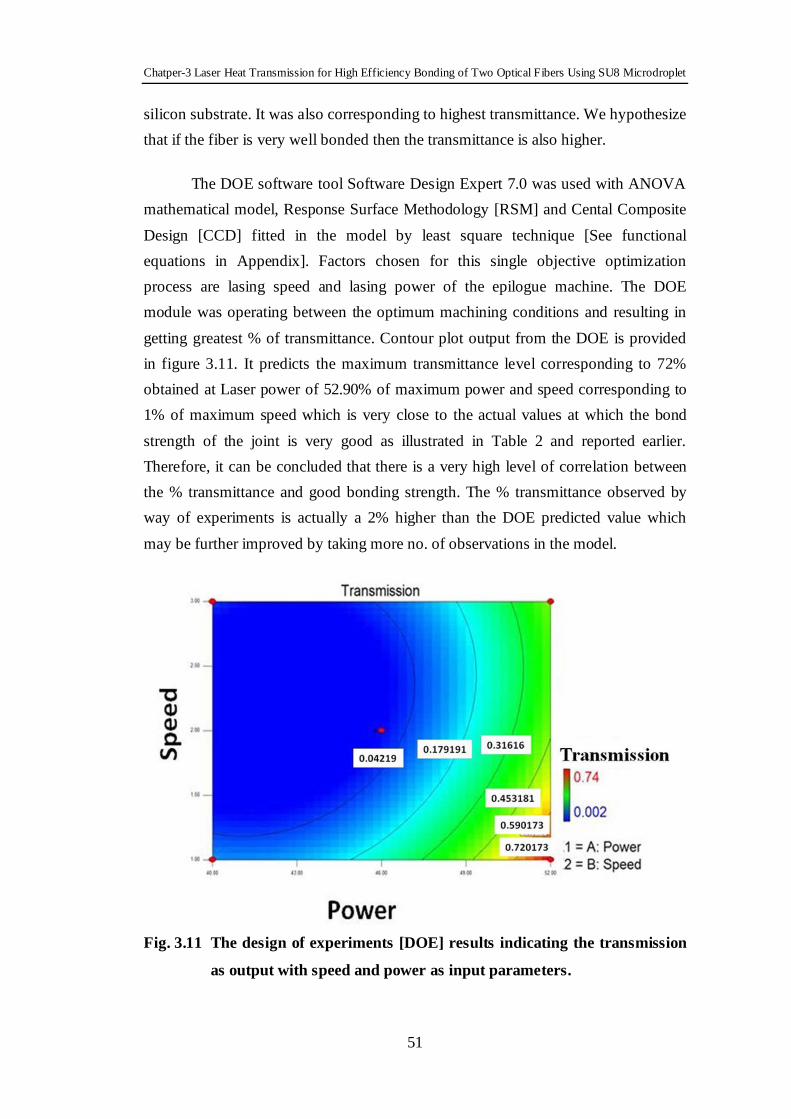
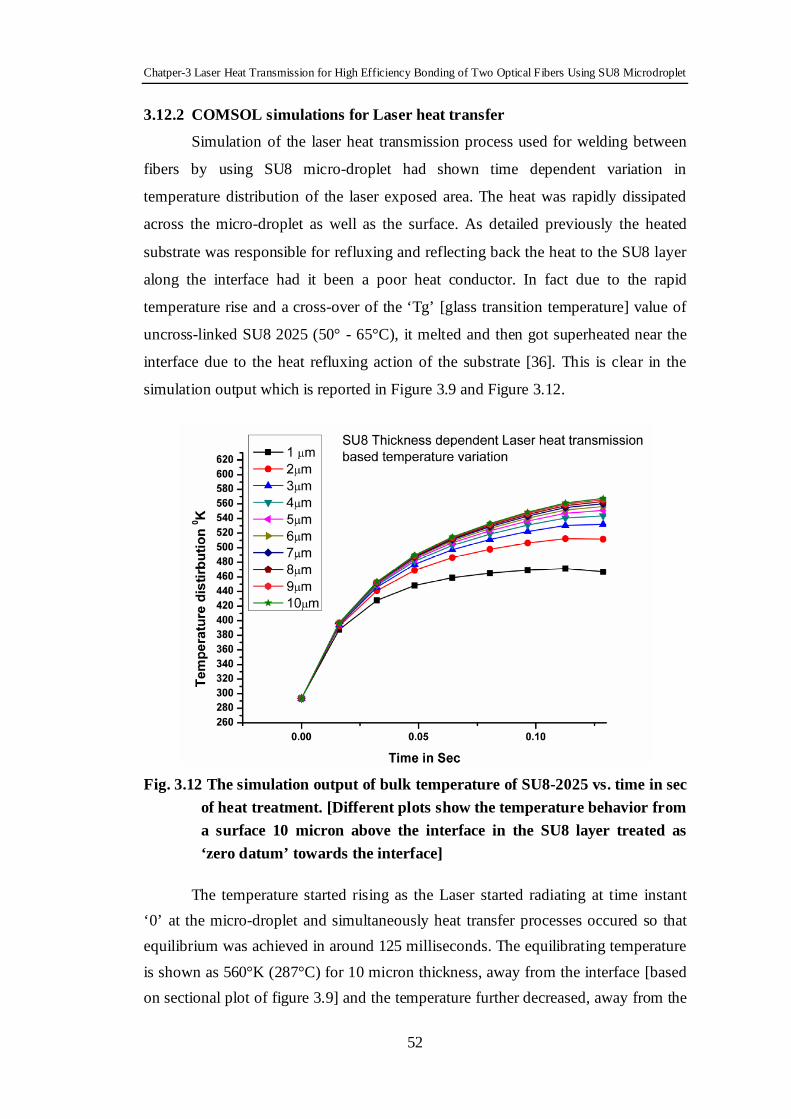
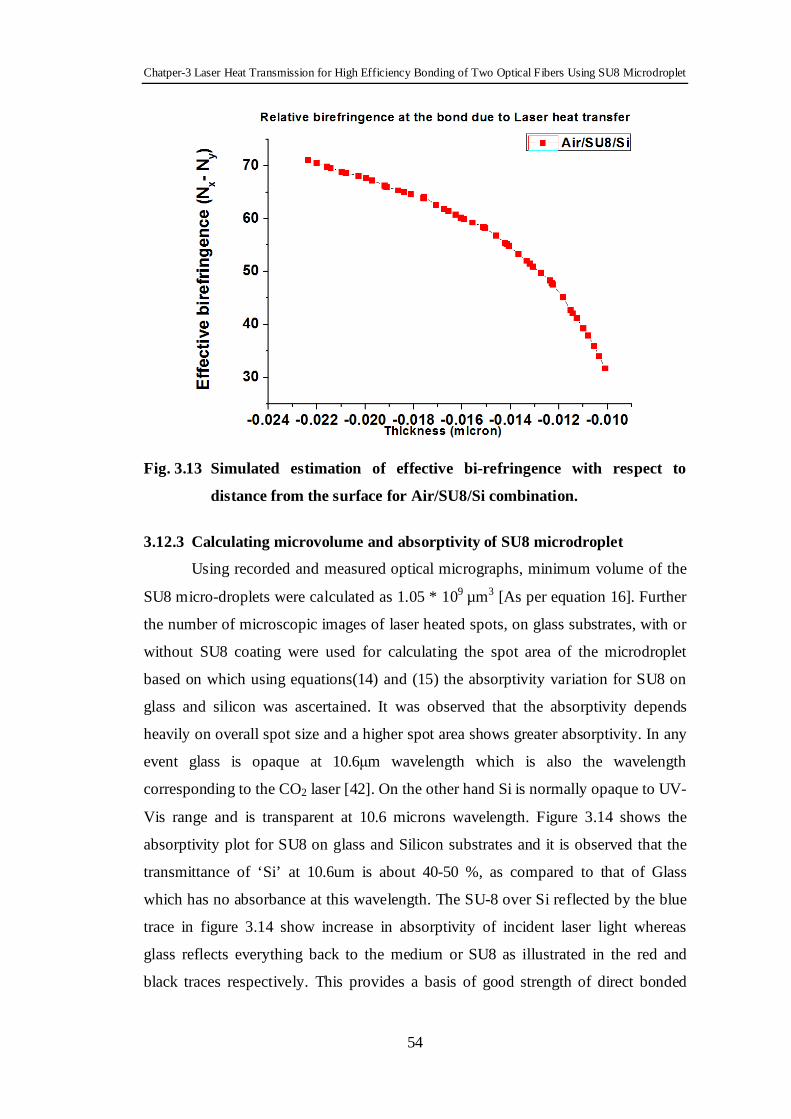


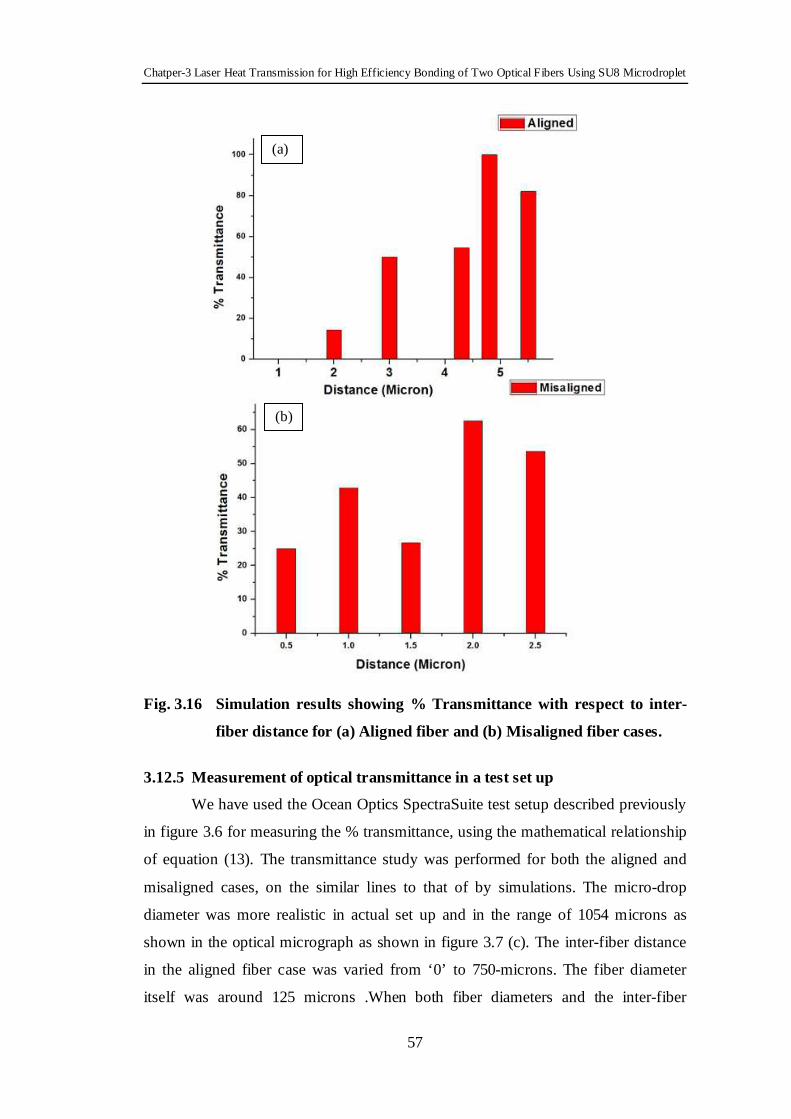


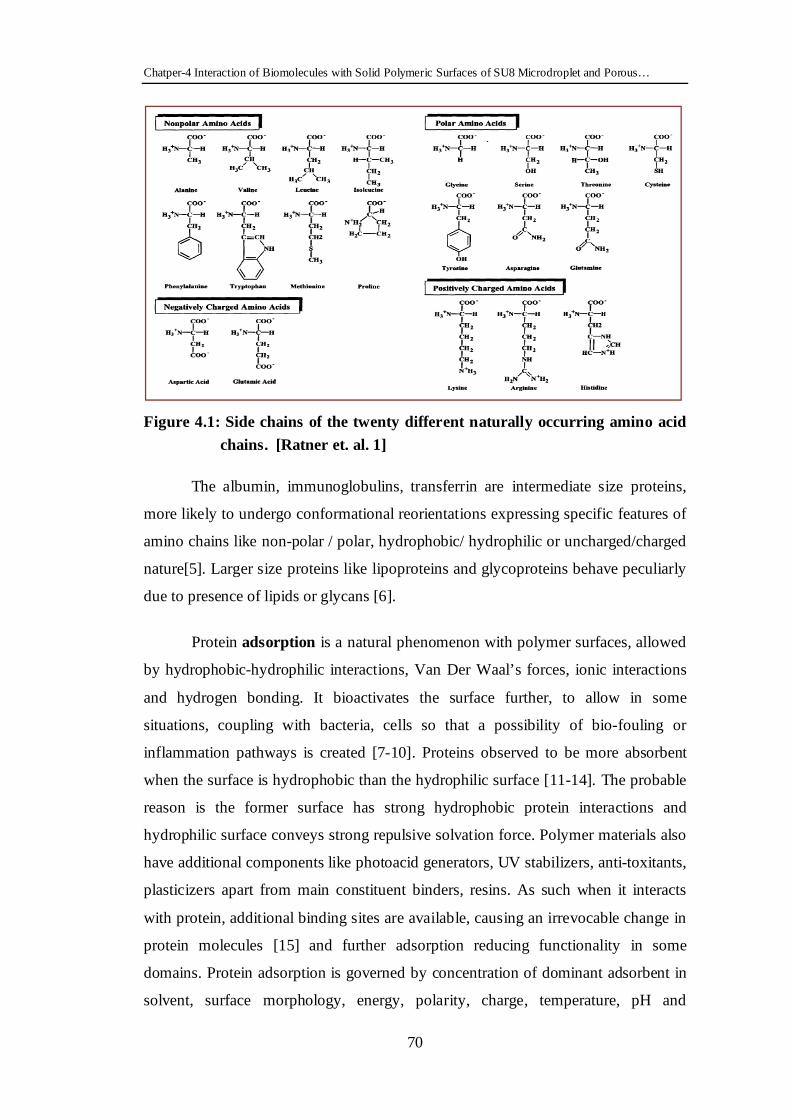


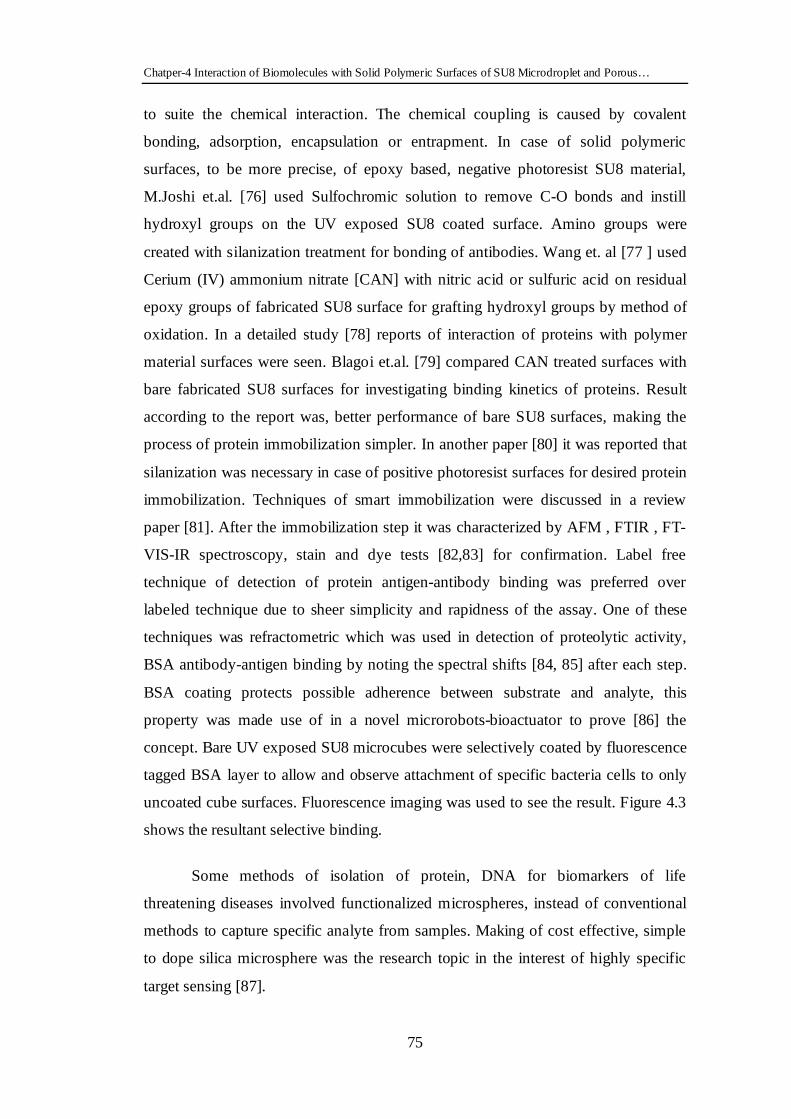

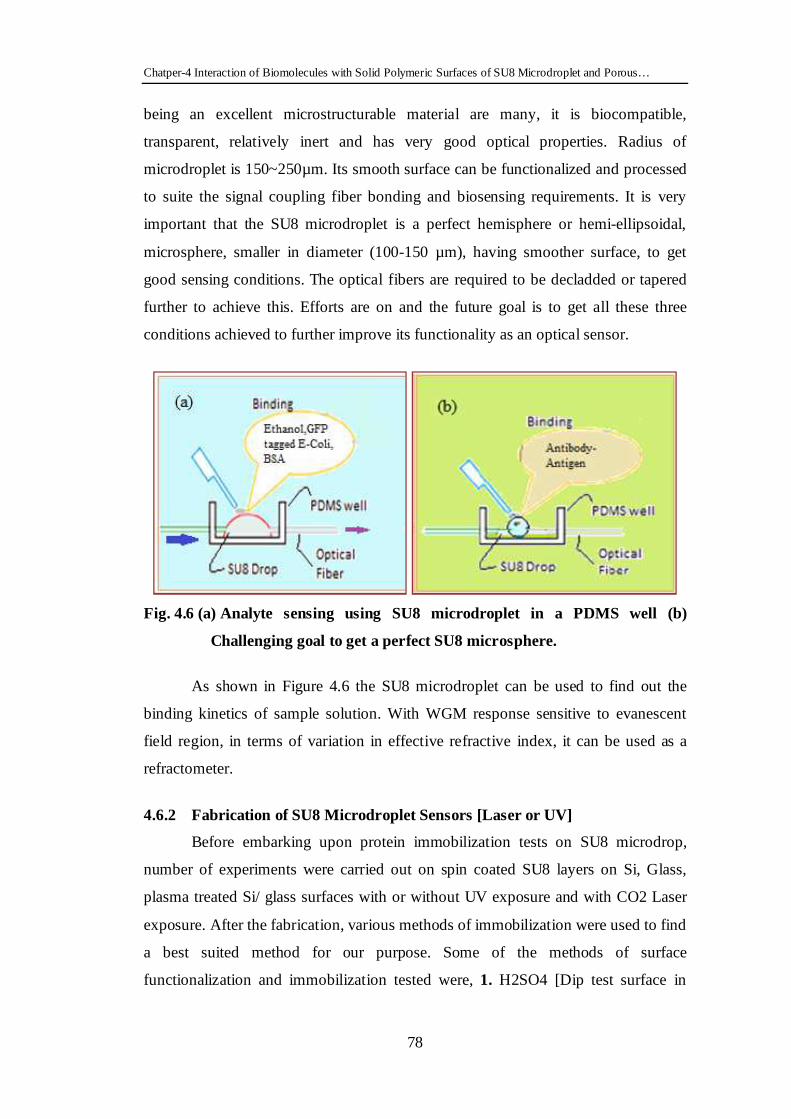

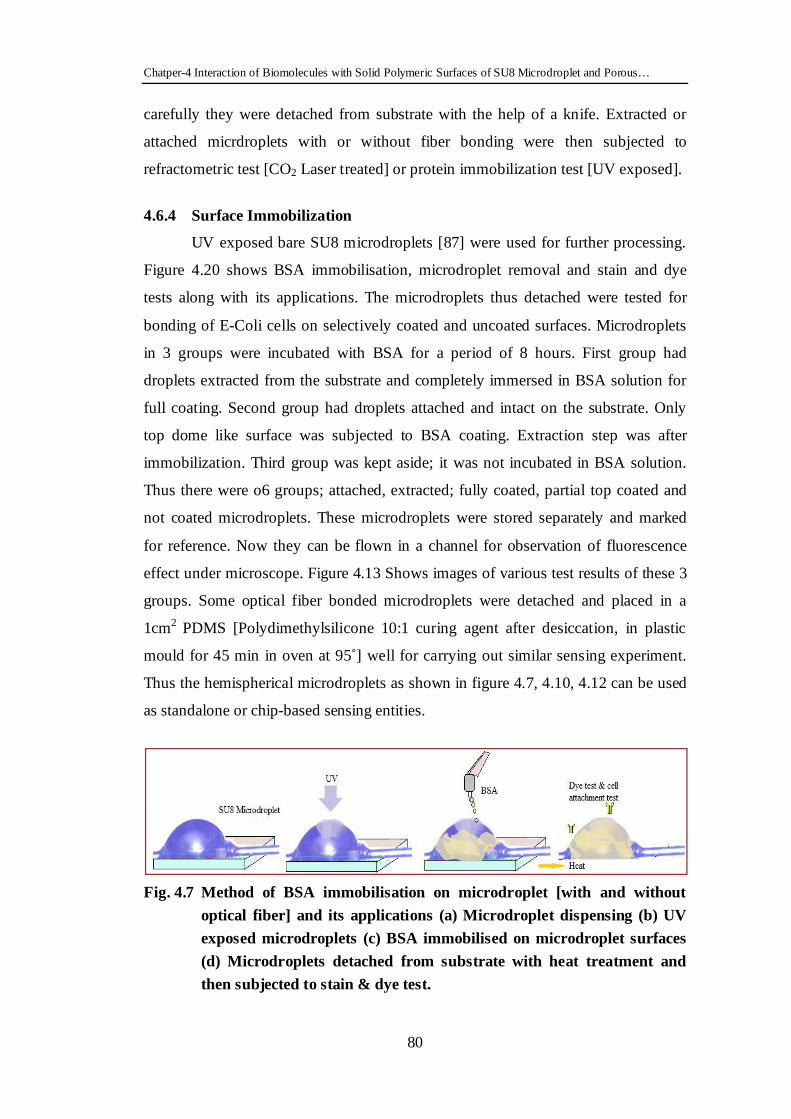
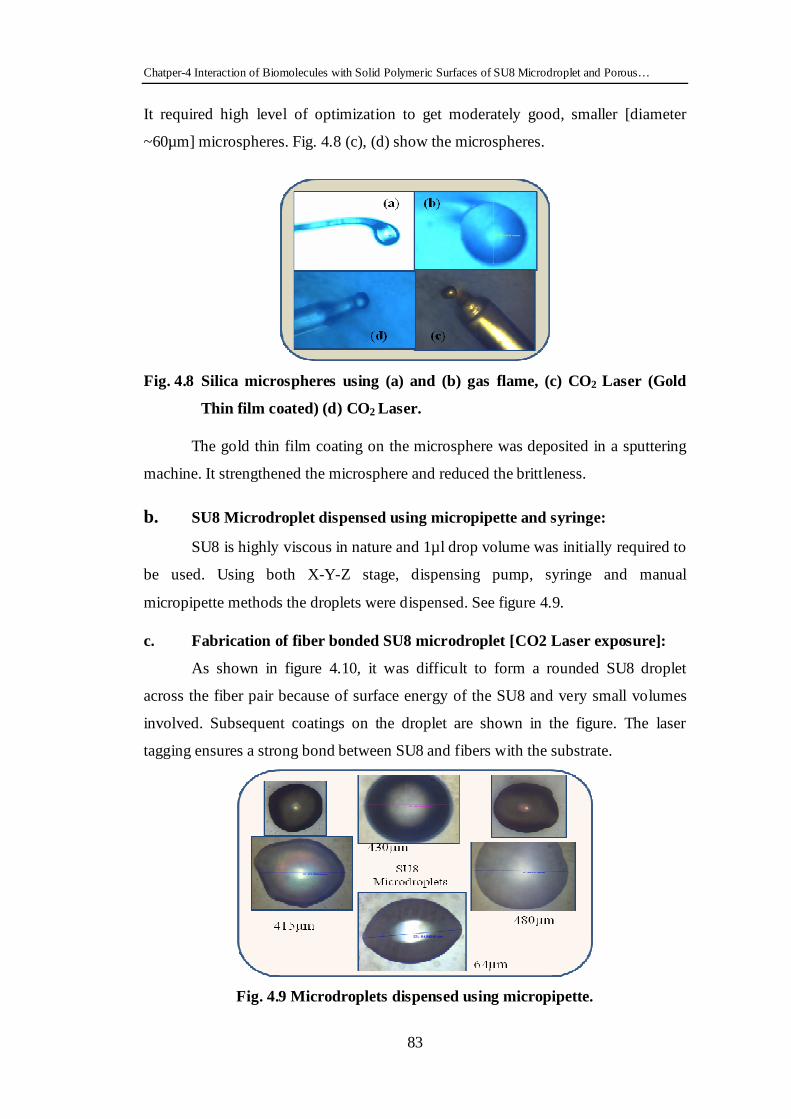


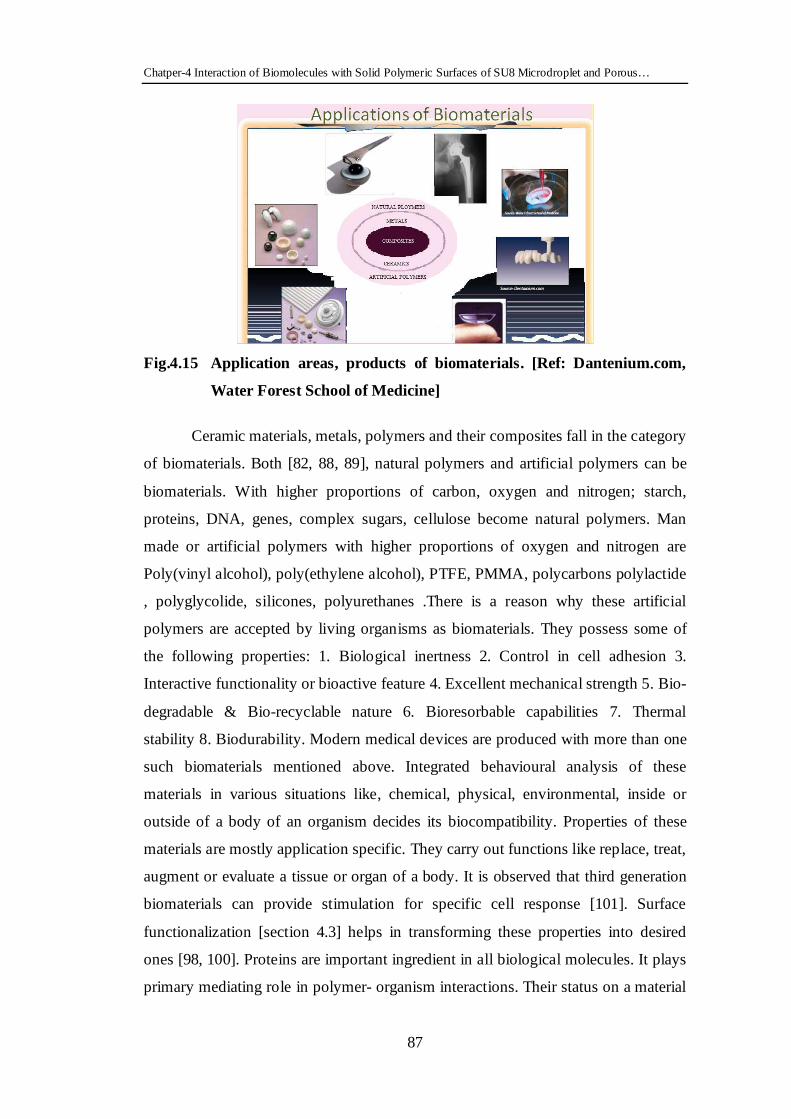


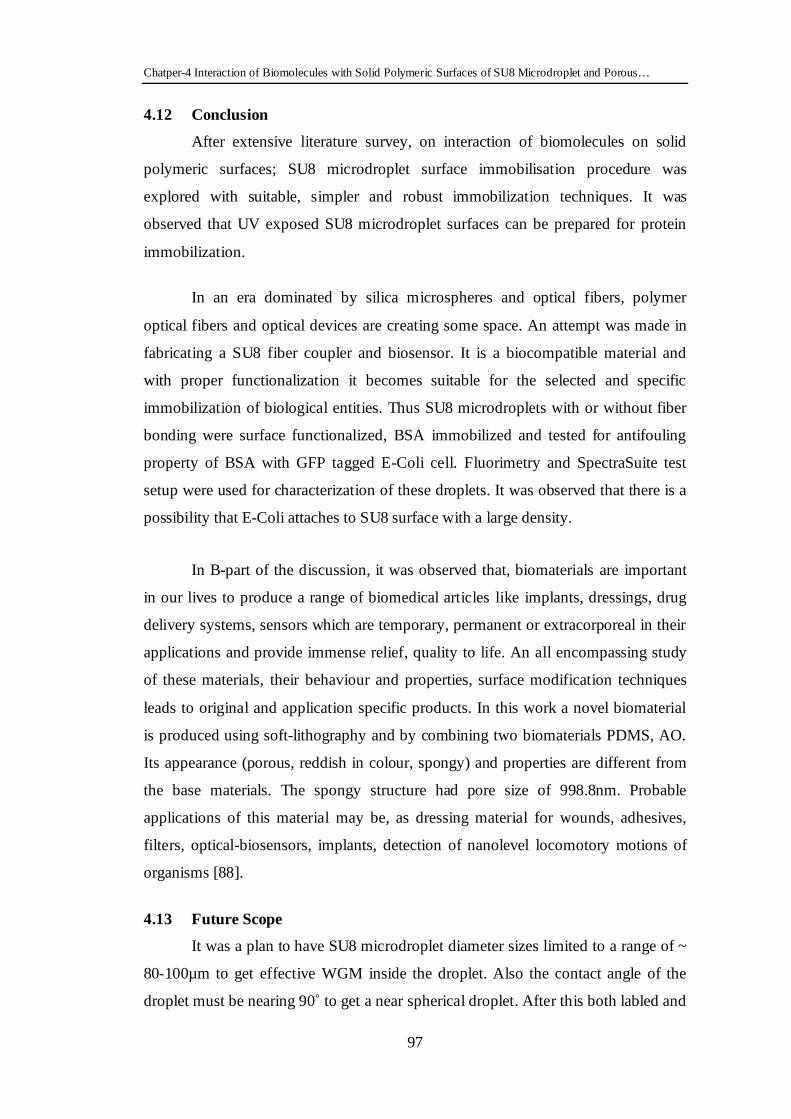


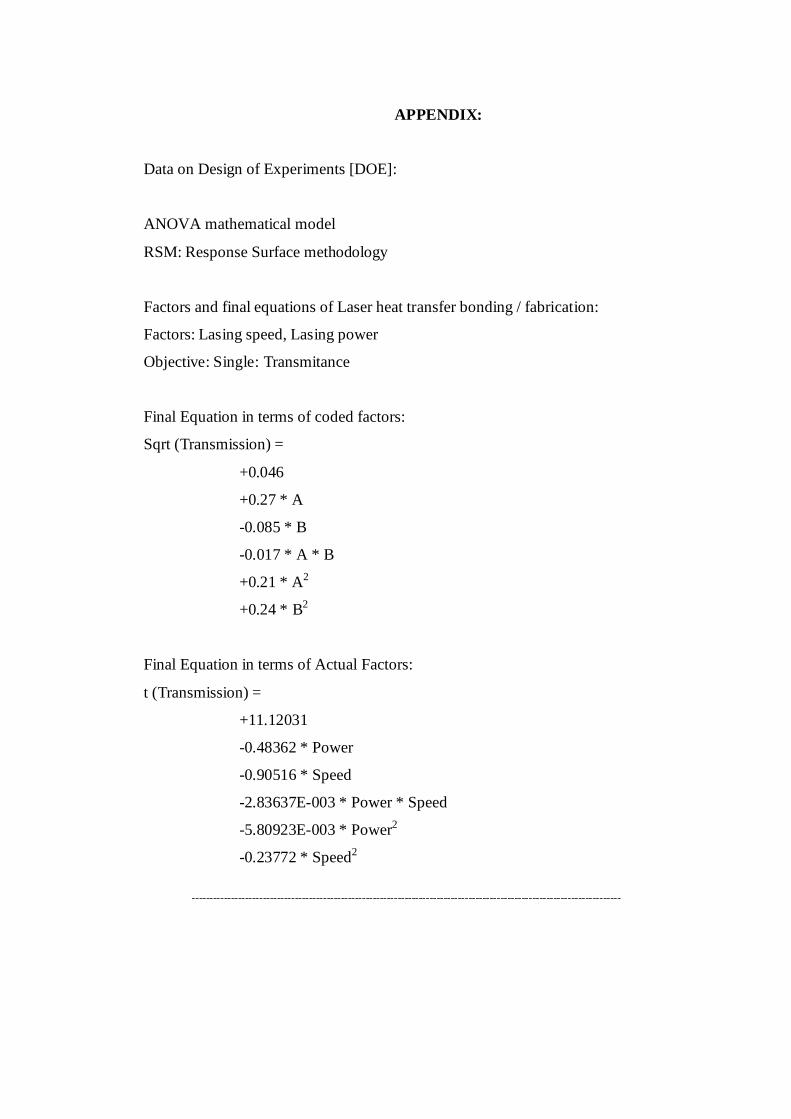


![Capacity limits of systems employing multiple optical ... · compensation, optical phase conjugation (OPC) [8,11,18–25]. This all optical technique provides compensation of both](https://static.documents.pub/doc/80x56/5fbae1b56c3386685757997b/capacity-limits-of-systems-employing-multiple-optical-compensation-optical.jpg)


