158


A numerical approach into new designs forSPR sensors in D-type optical fibersDOCTORAL THESIS
Diego Felipe De Nóbrega Dos SantosDOCTORATE IN AUTOMATION AND INSTRUMENTATION
SUPERVISORJosé Manuel Rocha Teixeira Baptista
CO-SUPERVISORAriel Ricardo Negrão Silva Guerreiro

II

III
Acknowledgements
First, I am thankful to Prof. Dr. José Manuel Baptista and Prof. Dr. Ariel Guerreiro,
for supervising me in the past years during my Ph.D. thesis. José Manuel had always
asked for new scientific possibilities and looking for error in the results making me to
understand completely the results, before continuing to other problems. Ariel gave
me a lot advice about the simulation, how to solve the problems and suggesting from
time to time a crazy idea.
Also, I am thankful to all the group of the department of physics of the University
of Madeira in special to Prof. Dr. Pedro Almeida and Prof. Dr. Mikhail Benilov for advice
about COMSOL Multiphysics and show me that there are more than SPR sensors in
optical fibers.
I am also thankful to Prof. Dr. Markus Schmidt, Prof. Dr Kay Schuster and Prof. Dr.
Patrick Uebel, that welcomed in Institute for Photonic Technology (IPHT) and let me
understand the theoretical and experimental physics difficulties of working with
optical fibers.
I also would like to thank to Dr. Nunzio Cennamo and Prof. Dr. Luigi Zeni from the
Second University of Naples and Dr. Luis Coelho and Dr. Pedro A. S. Jorge from Institute
for Systems and Computer Engineering, Technology and Science (INESC-TEC former
INESCPorto) for allowing me to validate the experimental and theoretical results.
To the University of Madeira and to INESC-TEC friends, teachers and staff for the
companionship and professionalism shown over the years.
I also like to acknowledge the Portuguese funding institution (FCT - Fundação para
a Ciência e a Tecnologia) for supporting their program under Grant
SFRH/BD/85068/2012.
Finally, I thank all my family, for understanding, for caring, for motivation and for
being always present.

IV
Abstract
This thesis investigates how to improve the performance of current designs of
optical fiber sensors based on Surface Plasmon Resonance, and how to use a better
understanding of the physical and sensing principles behind them to propose new
sensing concepts and ideas. We adopt a methodology based on numerical simulations
because they provide a better insight onto the operation of these sensors and because
they allow an easy and quick way of testing new designs and concepts without the
need to fabricate the sensors. We also show that these simulations have a good
agreement with experimental results.
We adopt a systematic approach to investigate the various parameters that
influence the sensor performance, and present different sensors designs, where we
study the localization, optical properties, shape and size of the metal components,
combined with different type of fibers, resulting in the coupling between the plasmon
and optical modes. Furthermore, we verify that choosing the optical modes used in
sensing in multimode fibers can also have advantages. We investigate the use of
modern artificial materials, such as metamaterials, as well as the inclusion of multiple
wires in the fiber to enhance the performance of the SPR sensor. At a more
fundamental level, we show that the control of the coupling between multiple plasmon
modes in metal components and the optical modes in the fiber constitutes a new way
to improve the performance of the sensor and can be inclusively used to develop a
new type of SPR sensors capable of measuring simultaneously two variables, such as
the external refractive index and temperature
Keywords: Optical fiber sensor, Surface plasmon resonance, Numerical simulation,
Metamaterials, Nanoplasmonics, Multiparameter sensing

V
Resumo
Esta tese investiga como é possível melhorar o desempenho das estruturas atuais
dos sensores de fibra ótica baseados em Ressonância Plasmónica de Superfície (SPR),
bem como compreender melhor os princípios físicos e de sensorização na base do seu
funcionamento, permitindo propor novos conceitos de sensores. Foi utilizada uma
metodologia baseada em simulações numéricas, pois proporcionam um melhor
entendimento do funcionamento desses sensores, constituindo uma maneira simples e
rápida de testar novas estruturas e conceitos, sem a necessidade de fabricar os
sensores. Mostra-se também que essas simulações têm uma boa concordância com os
resultados experimentais.
Foi adotada uma abordagem em que se investiga sistematicamente os diversos
parâmetros que influenciam o desempenho do sensor e se apresentam diferentes
estruturas de sensores onde foram estudadas a localização, propriedades óticas, forma
e tamanho dos componentes metálicos, combinados com diferentes tipos de fibras,
resultando no acoplamento entre os modos plasmónicos e os modos óticos. Também
foi verificado que a escolha dos modos óticos utilizados na deteção em fibras
multimodo pode apresentar vantagens. Foi investigado ainda o uso de materiais
artificiais recentemente desenvolvidos, de que são exemplo os metamateriais, bem
como, a inclusão de múltiplos fios metálicos na fibra, de forma a melhorar o
desempenho dos sensores SPR. A um nível mais fundamental, foi demonstrado que o
controlo do acoplamento entre os múltiplos modos plasmónicos gerados nos
componentes metálicos e os modos óticos propagados na fibra constitui uma nova
forma de melhorar o desempenho do sensor. Tal pode ser inclusivamente utilizado
para desenvolver um novo tipo de sensores SPR capazes de medir simultaneamente
duas variáveis, como por exemplo o índice de refração externo e a temperatura.
Palavras chave: Sensores de fibra ótica, Ressonância plasmónica de superfície,
Simulação numérica, Meta-materiais, Nano-plasmões, deteção multi-parâmetro

VI
Resumen
Esta tesis investiga cómo es posible mejorar el desempeño de los diseños actuales
de sensores de fibra óptica basados en la Resonancia Plasmónica de Superficie (SPR) y
permitir un mejor entendimiento de los principios físicos y sensores que luego
permitirá proponer nuevos conceptos e ideas. Fue utilizada una metodología basada
en simulaciones numéricas, ya que esta proporciona una mejor comprensión sobre el
funcionamiento de estos sensores y porque permiten una manera simple y rápida de
probar nuevos diseños y conceptos sin necesidad de fabricar los sensores. También fue
verificado que estas simulaciones son una buena aproximación a los resultados
experimentales.
Se adoptó un enfoque sistemático para investigar los diversos parámetros que
influyen en el desempeño del sensor y se presentan diferentes diseños de sensores,
donde estudiamos la localización, las propiedades ópticas, la forma y el tamaño de los
componentes metálicos, combinados con diferentes tipos de fibras, resultando en el
acoplamiento entre los modos plasmónicos y los modos ópticos. También se verifico
que la elección de los modos ópticos utilizados en la detección en fibras multimodo
ofrece otras ventajas. Fue investigado el uso de materiales artificiales recientemente
desenvuelto, como son los metamateriales, así como la inclusión de múltiples hilos de
metal en la fibra óptica para mejorar el rendimiento del sensor SPR. En un nivel más
fundamental, se demuestra que el control del acoplamiento entre múltiples modos
plasmónicos criados por la componente metálica y los modos ópticos en la fibra
constituye es una nueva forma de mejorar el rendimiento del sensor. Esto incluso se
puede utilizar para desarrollar un nuevo tipo de sensores basados en SPR capaces de
medir simultáneamente dos variables, tales como el índice de refracción externa y la
temperatura.
Palabras clave: Sensores de fibra óptica, Resonancia plasmónica de superficie,
Simulación numérica, Metamateriales, Nano-plasmones, Detección de
multiparámetros.

VII
Contents
Chapter 1 Introduction and motivation........................................................................................... 1
1.1 Motivation ................................................................................................................................... 2
1.2 Supporting Research collaborations ............................................................................................ 3
1.3 Structure of the thesis .................................................................................................................. 3
Chapter 2 State of the art ............................................................................................................... 5
2.1 What are Surface Plasmons ......................................................................................................... 5
2.2 Optical Excitation of Surface Plasmon ......................................................................................... 6
2.3 Evaluation of the performance of the SPR sensors ...................................................................... 7
2.4 SPR sensor classification .............................................................................................................. 8
2.4.1 Optical configurations ........................................................................................................ 10
2.4.2 Interrogation of the SPR sensor ......................................................................................... 10
2.4.3 Geometry design of the SPR fiber sensor .......................................................................... 11
2.4.4 Plasmonic coating .............................................................................................................. 16
2.4.5 Fiber Grating SPR sensor .................................................................................................... 16
2.4.6 Application of the SPR sensor ............................................................................................ 17
Chapter 3 Models and methodology ............................................................................................. 19
3.1 Maxwell’s equations .................................................................................................................. 19
3.2 The Lorentz and the Drude models, and the optical properties of the gold, silver, aluminum and
copper 21
3.2.1 The Lorentz model ............................................................................................................. 21
3.2.2 The Drude model ............................................................................................................... 22
3.2.3 The Sellmeier equation ...................................................................................................... 23
3.2.4 Optical properties of gold, silver, aluminum and copper .................................................. 24
3.3 Optical waveguide theory .......................................................................................................... 26
3.3.1 Definitions and properties of guided modes ..................................................................... 27
3.3.2 Poynting vector, total power and loss in the guided mode ............................................... 27
3.3.3 The planar step-index waveguide ...................................................................................... 28

Contents
VIII
3.3.4 The circular step-index waveguide .................................................................................... 30
3.4 Surface plasmon resonance (SPR) .............................................................................................. 33
3.4.1 Theory of the surface plasmon polariton (SPP) ................................................................. 33
3.4.2 Planar waveguide in a metal and dielectric external interface.......................................... 34
3.4.3 Fiber optics sensors based on surface plasmon resonance ............................................... 36
3.5 Finite element method (FEM) .................................................................................................... 37
Chapter 4 Singlemode sensors with thin metal films .................................................................... 41
4.1 SPR sensor based on conventional D-type fiber ......................................................................... 42
4.1.1 Numerical mode analysis ................................................................................................... 42
4.1.2 Algorithm using Fresnel laws ............................................................................................. 47
4.2 Optimization of the microstructured D-type fiber sensor based in SPR ..................................... 51
4.2.1 Triangular and parabolic SPR D-type fiber sensor ............................................................. 52
4.2.2 Microstructured D-type fibers: intensity of electric field and transmission coefficient .... 54
4.2.3 Microstructured D-type fibers: optimization of the parameters of the SPR ..................... 55
4.3 PCF D-type sensor based in SPR. ................................................................................................ 56
4.3.1 Introduction of photonic crystal fibers .............................................................................. 56
4.3.2 Design of photonic crystal fibers ....................................................................................... 57
4.3.3 Loss of the conventional and PCF D-type fiber .................................................................. 58
4.3.4 Sensitivity and resolution of the two configurations ......................................................... 59
4.4 Proposals of PCF D-type sensors based in SPR. .......................................................................... 59
4.4.1 Loss and distribution of the Poynting vector ..................................................................... 60
4.5 Conclusion .................................................................................................................................. 64
Chapter 5 Multimode sensors with thin metal films ..................................................................... 65
5.1 Introduction to multimode fibers ............................................................................................... 65
5.2 Multimode fiber sensor based in SPR ......................................................................................... 67
5.3 POF SPR sensor and effect of modal filtering ............................................................................. 68
5.4 Numerical simulation without tapered POF filter ...................................................................... 68
5.5 Experimental characterization of the POF SPR sensor ............................................................... 71
5.5.1 Experimental configuration without tapered POF filter .................................................... 73
5.5.2 Configuration with tapered POF filter before the SPR sensor system ............................... 74
5.5.3 Configuration with tapered POF filter after the SPR sensor system .................................. 74
5.6 Conclusion .................................................................................................................................. 75

Contents
IX
Chapter 6 Sensors with metamaterials ......................................................................................... 79
6.1 SPR sensor based in metamaterials ........................................................................................... 80
6.2 Effective medium theory ............................................................................................................ 81
6.3 Metamaterials formed by Alumina and Silver (Al2O3 – Ag) ........................................................ 82
6.4 Proposal SPR sensor based in a metamaterial ........................................................................... 83
6.4.1 Metamaterial versus pure metal layers ............................................................................. 84
6.4.2 Loss for different concentrations of Al2O3 and Ag ............................................................. 86
6.4.3 Loss for different thicknesses of the metamaterial ........................................................... 88
6.4.4 Optimization of the sensor ................................................................................................ 89
6.5 Conclusion .................................................................................................................................. 91
Chapter 7 ............................................................................................................................................. 93
Singlemode sensors with wires .............................................................................................................. 93
7.1 SPR sensor based in metal wire.................................................................................................. 94
7.2 Singlemode fiber sensor based in SPR with a metal wire on a D-type fiber ............................... 94
7.2.1 Description of the isolated modes and the supermodes ................................................... 95
7.2.2 Effects of the different parameters ................................................................................... 97
7.2.3 Resolution, sensitivity and operation range ...................................................................... 98
7.3 Conclusion ................................................................................................................................ 100
Chapter 8 Multimode sensors with wires .................................................................................... 103
8.1 Optimization of modal sensitivity in nanowire SPR multimode sensor .................................... 104
8.1.1 Design parameters ........................................................................................................... 104
8.1.2 SPR in the multimode fiber .............................................................................................. 105
8.2 Sensitivity of two modes in the SPR multimode fiber ............................................................... 106
8.3 Conclusion ................................................................................................................................ 108
Chapter 9 SPR sensor with wires for simultaneous measurement of refractive index and
temperature 109
9.1 Introduction of the SPR sensor for measurement of temperature ........................................... 110
9.2 Consideration of temperature in the calculation ..................................................................... 111
9.2.1 Sellmeier equation with temperature variation .............................................................. 111
9.2.2 Drude model with temperature variation. ...................................................................... 111

Contents
X
9.3 Plasmonic measurement of refractive index and temperature based on a D-type fiber sensor
with gold wires..................................................................................................................................... 113
9.3.1 Study of sensor behavior as function of the external refractive index variation ............ 114
9.3.2 Optimization of the sensor .............................................................................................. 118
9.3.3 Study of the sensor behavior as a function of temperature ............................................ 120
9.4 Conclusion ................................................................................................................................ 122
Chapter 10 Conclusions and outlook ............................................................................................ 125
10.1 Sensors with thin materials films ............................................................................................. 126
10.2 Sensors with wires ................................................................................................................... 127
10.3 Simultaneous measurement of refractive index and temperature .......................................... 128
10.4 Outlook .................................................................................................................................... 128
Bibliography ......................................................................................................................................... 131

XI
List of Figures
Figure 2.1 Basic schemes for SPR sensors with (a) Otto configuration based coupling; (b) Kretschmann configuration based coupling........................................................ 6
Figure 2.2 Basic scheme for SPR sensors with grating coupling. ..................................... 6 Figure 2.3 Configuration of SPR sensor using an optical fiber where the fiber cladding is
removed (cladding-off fiber). ........................................................................ 7 Figure 2.4 Attenuation of light due to SPR with angular modulation or wavelength
modulation [2]. ......................................................................................... 8 Figure 2.5 Classification of SPR fiber sensors. MMF: Multi Mode Fiber; SMF: Single Mode
Fiber; MOF: Microstructured Optical Fiber; PMF: Polarization Maintaining Fiber; FBG: Fiber Bragg Grating, LPG: Long Period Fiber Grating; TFBG: Tilted Fiber Bragg Grating; LSPR: Localized Surface Plasmon Resonance [23]. ............................................... 9
Figure 2.6 SPR fiber-optic sensor with a side-polished configuration. ............................. 11 Figure 2.7 SPR fiber optic sensor with a D-shape or D-type fiber configuration. ................ 12 Figure 2.8 Schematics of the SPR fiber-optic sensor design with (a) tapered fiber; (b)
hetero-core fiber; (c) U-shape fiber; d) H-shaper fiber. ....................................... 12 Figure 2.9 Schematic of an optical fiber SPR sensor implemented on the tip of an optical
fiber with a mirror in the end. ...................................................................... 13 Figure 2.10 SPR fiber optic sensors based in photonic crystal fibers with; (a) with circular
holes [55], (b) with crescent-shape holes, (c) MOF three structured holes (also called wagon wheel fiber) [12] and d) microcapillary fiber SPR sensor [56]........................ 14
Figure 2.11 Examples of grating SPR sensor (a) with a long period grating (LPG), (b) with a tilted fiber Bragg grating TFBGs [1]................................................................ 17
Figure 3.1 Refractive index of the core (GeO2-SiO2) and of the cladding (SiO2). ................. 24 Figure 3.2 (a) Refractive index and (b) permittivity of gold (Au) and silver (Ag). The solid
lines are the real part of the refractive index and permittivity, the dashed lines are the imaginary part of the refractive index and permittivity, respectively. The black and red lines refer to the gold with and without interband, respectively, and the green line refers to silver. ................................................................................... 26
Figure 3.3 Schematic of the planar step-index waveguide. .......................................... 28 Figure 3.4 Schematic of the fiber step-index waveguide. ............................................ 31 Figure 3.5 Numerical solution of the eigenvalue equation in a step-profile planar composed
of gold (Au) and step fiber circular composed of the core (GeO2-SiO2) and the cladding (SiO2). ................................................................................................... 33
Figure 3.6 Surface plasmon is propagated along the interface between the metal and the dielectric, where εm is the permittivity of the metal, εd is the permittivity of the dielectric and the penetration field in each element is given as δd and δm, for the dielectric and metal, respectively. (a) Lines of the electric field and (b) distribution of electric, Ex and magnetic, Hy, fields, respectively [1]. ..................................... 34
Figure 3.7 Basic scheme of computational simulations used in this work. ........................ 39 Figure 4.1 Schematic of the SPR D-type sensor. The fiber is composed by two refractive
indexes (core - nco and cladding - ncl) then a metallic layer is deposited with thickness dm and refractive index nm, at a distance d of the center of the fiber, for the measurement of the external refractive index next. ............................................ 42
Figure 4.2 Structure of the finite elements in COMSOL for a D-type optical fiber with a metallic layer for SPR. The elements are smaller in the metallic layer and in the core. ........................................................................................................... 43
Figure 4.3 (a) Refractive index as function of the wavelength of the modes when considering insolated waveguides for the fundamental mode fiber type D (solid black) and for the plasmonic mode in the interface Au and next = 1.34 and next = 1.38 (dashed red). The found SMs are represented in dot-dashed blue and dot-two-dashed, respectively. (b) Attenuation in function of the wavelength for the SMs with different external refractive indexes. The thickness of the gold is dm = 45 nm. ................................. 45
Figure 4.4 Poynting vector distributions in 2D near of the fiber core and the interface metal, with a thickness of metal dm = 45 nm and an external refractive index next = 1.34. The

List of Figures
XII
blue lines indicate the transverse electric field ex and ey. (a) No resonance = 500 nm. (b) Resonance = 630 nm. .................................................................... 46
Figure 4.5 Normalized Poynting vector amplitude along a cutline across the fiber core for different values of the wavelength, with the thickness of metal dm = 45 nm and external refractive index next = 1.34. ............................................................. 46
Figure 4.6 Transmission (T) as a function of wavelength for a SPR D-type fiber by two methods: The Fresnel method (solid line) and using the FEM method (dash line) with different thicknesses of the gold (Au), d = 4.0 µm, next = 1.392 and = 88.85º. .......... 48
Figure 4.7 Simulation of the transmission coefficient of the sensor, for different distances between the center of the core and the metal (d). In this simulation, the thickness of the gold layer is 65 nm and the refractive index of the external environment is 1.392. ........................................................................................................... 48
Figure 4.8 Transmission as function of wavelength for two values of external refractive index, where d = 4.0 µm and dm = 65 nm......................................................... 49
Figure 4.9 Simulation of the transmission coefficient T of the sensor for different thicknesses of the dielectric (Ta2O5). The thickness of gold is 65 nm and next = 1.329 .. 50
Figure 4.10 Transmission coefficient T of the sensor with different dielectric (Ta2O5) thickness dov = 20 nm. The thickness of gold is 65 nm. ........................................ 50
Figure 4.11 D-type optical fiber (a) holes in a triangular configuration and (b) holes in a parabolic configuration. ............................................................................. 52
Figure 4.12 (a) Intensity of the electric field Ez in 2D (V/μm) with λ = 300 nm, dm = 65 nm and next = 1.37. (b) and (c) Zoom of the core of the intensity of the electric field Ez in 2D (V/μm) with: (b) λ = 300 nm, no SPR present and (c) λ = 660 nm, with SPR........... 53
Figure 4.13 (a) Intensity of the electric field 𝑬𝒛 in 1D (V/μm) as function of the longitudinal fiber x at λ = 630 nm. (b) Attenuation as a function of wavelength for different external refractive indexes (next), for three configurations of the SPR sensor, convectional (solid line), parabolic (dashed line) and triangular (dot line), where the dm = 45 nm and d = 4.5 µm. ......................................................................... 54
Figure 4.14 Attenuation as a function of wavelength for different thicknesses of gold (Au) and for three configurations of the SPR sensor, conventional (solid line), parabolic (dashed line) and triangular (dot line) where next = 1.38 and d = 4.5µm. .................. 55
Figure 4.15 Simulation of attenuation as function of the wavelength, for different values of residual cladding, d. In this simulation, only two configurations of the SPR sensor were studied, conventional (solid line) and parabolic (dashed line) where dm = 45 nm and next = 1.38. ........................................................................................ 56
Figure 4.16 Schematic of the PCF D-type. .............................................................. 58 Figure 4.17 Attenuation as a function of wavelength for different external refractive
indexes for the conventional (solid line) and PCF (dashed line) D-type. L = 1 mm and dm = 45 nm. ............................................................................................ 58
Figure 4.18 Design of the enhanced proposal for the PCF D-type sensor based in SPR. ........ 60 Figure 4.19 Attenuation as a function of wavelength for D-type and enhanced D-type fibers.
The configurations had the following parameters: L = 1 mm, next = 1.39 and dm = 45 nm. ...................................................................................................... 60
Figure 4.20 Normalized Poynting vector distributions, overlayered by an arrow indicating the transverse electric field ex and ey, for the different wavelengths, indicated in Figure 4.19. The upper images are for the conventional D-type fiber and lower images are for the enhanced PCF D-type. ................................................................. 61
Figure 4.21 Normalized Poynting vector amplitude along a cutline across the fiber core for the different wavelengths indicated in Figure 4.19 for the enhanced PCF D-type fiber. ........................................................................................................... 62
Figure 4.22 Attenuation as a function of wavelength for different refractive indexes of external medium for both configurations. The configurations had the following parameters: d = 4.05 μm and d = 3.2 μm for conventional (solid lines) and enhanced PCF D-type (dashed lines), respectively, L = 1 mm and dm = 45 nm. ........................ 62
Figure 5.1 Section view of the sensor system based on SPR in POF. ............................... 68 Figure 5.2 Numerical results for two modes LP02 (mode 56) and LP04 (mode 16) in POF. (a)
POF without the cut, (b) POF with cut and gold layer. ........................................ 69 Figure 5.3 (a) Attenuation as function of the wavelength for different modes when the RI
of the external medium is 1.39. (b) The distribution of the light intensity of the sensor for different modes................................................................................... 70

List of Figures
XIII
Figure 5.4 Attenuation as function of wavelength for different values of the external refractive index of the sensor for: (a) mode 16 (dashed line) and mode 56 (solid line), (b) magnification of the mode 56 behavior. ..................................................... 71
Figure 5.5 Experimental configuration of the sensor system with tapered POF filter at the input of the sensor system .......................................................................... 72
Figure 5.6 Experimental configuration of the sensor system with tapered POF filter at the output of the sensor system. ........................................................................ 73
Figure 5.7 Experimentally obtained SPR transmission spectra, normalized to the air spectrum, for different RI of the aqueous medium. Configuration without tapered POF filter. .................................................................................................... 73
Figure 5.8 Experimentally obtained SPR transmission spectra, normalized to the air spectrum, for different RIs of the aqueous medium. Configuration with tapered POF filter at the input of the SPR sensor. .............................................................. 74
Figure 5.9 Experimentally obtained SPR transmission spectra, normalized to the air spectrum, for different RIs of the aqueous medium. Configuration with tapered POF filter at the output of the SPR sensor. ............................................................ 75
Figure 6.1 Scanning electron microscopy (SEM) images of the fabricated metamaterial: (a) cross section and (b) top view. Bright and dark spots correspond to Ag-filled and empty pores, respectively [99]. ............................................................................. 80
Figure 6.2 Complex dielectric (a) real part and (b) imaginary part of the metamaterial for concentrations of Ag of 100% (solid curve, corresponding to pure silver), 90% (dashed curve), 80% (dotted curve) and 70% (dash-dotted curve) 60% (dash-double dotted curve) and 50% % (small dashed curve). The equivalent curve for alumina (Al2O3) is also presented for reference (small dotted curve). ............................................ 83
Figure 6.3 From left to right up: three dimensional representation of a section of the fiber sensor, transverse cross-section of the fiber sensor. From right to left down: detail of the structure of the surface of the sensor indicating the position metamaterial film and a scheme of the thin metal-dielectric layers that compose the metamaterial. ...... 84
Figure 6.4 (a) Attenuation as function of wavelength for different values of the external refractive index, with two different layers, one with only Ag and the other with metamaterial with a concentration of 80% Ag and 20% Al2O3. (b) Distribution of the light in the region of the center of the fiber and the metal/metamaterial film for two concentrations of Ag (100% and 80%) and with 1.34 RI. ........................................ 85
Figure 6.5 (a) Attenuation as function of wavelength for different metamaterial filling ratios for the PCF D-type configuration with next = 1.30 RIU. (b) Distribution of light in the region of the center of the fiber and the metamaterial film for two concentrations of Ag (75% and 65%). .................................................................................. 87
Figure 6.6 Attenuation as function of wavelength for different thicknesses of the metamaterial PCF D-type configuration fiber with next = 1.32 RIU and Ag = 90%. ......... 89
Figure 6.7 Attenuation peak as function of the relative concentration and thickness of the metamaterial with next = 1.30 RIU. ................................................................. 90
Figure 6.8 The wavelength peak of the attenuation as function of the relative concentration and thickness of the metamaterial for next = 1.30 RIU. ......................................... 91
Figure 7.1 Schematic of the SPR D-type fiber with a gold wire configuration, with the inset of zoom of the core and metal wire. .............................................................. 95
Figure 7.2 (a) Real and imaginary part of the refractive index of the sensor as function of wavelength for external refractive index of 1.38. (b) Detailed distribution of the light intensity in the metal wire for the plasmon modes of the wire (top) and the resulting modes after hybridization with the fundamental mode of the fiber (bottom)............. 96
Figure 7.3 Attenuation curves as a function of wavelength for different distances between the center of the metal with the center of the fiber core (a) and for different radius of the metal (b). In the inset of Figure 7.3a, it is also shown the intensity of the electric field distribution along a cutplane of the sensor, corresponding to the supermodes of the two peaks (SM2 and SM1). ................................................... 98
Figure 7.4 Comparison between the attenuation curves as function of wavelength for two configurations of sensors, one with the metal wire (dotted curves) (as described in Figure 7.1) and another where the wire is replaced by a metal layer/film with 45 nm of thickness (solid curves). The external refractive index varies between 1.30 and 1.34 in Figure 7.4a and between 1.36 to 1.40 in Figure 7.4b. ...................................... 99
Figure 8.1 Schematic of the proposed SPR D-type multimode fiber. ............................. 105

List of Figures
XIV
Figure 8.2 Attenuation as a function of wavelength for different modes. The distribution of light intensity for each different mode is also presented. ................................... 105
Figure 8.3 Attenuation as function of wavelength for different values of the external refractive index for: (a) the fundamental mode (solid line) and the MP,3,5. (dashed line), (b) magnification of the fundamental mode behavior. (c) The distribution of light intensity for the MP,3,5 mode and the fundamental mode. ............................ 107
Figure 9.1 Schematic of the proposed SPR D-type fiber. ............................................ 114 Figure 9.2 (a) Real part (solid line) and imaginary part (dot line) of the refractive index of
the sensor as a function of wavelength for external refractive index of 1.38. Also, we represent the dispersion curves of the metal wires for the external modes, mE (dashed line) and for the internal modes, mI (dashed-dot line). The crossings between the dispersion curves of the modes in the metal wires and the fundamental mode of the fiber are indicated by square and triangle dots created by the external wire (RI) and the internal wires (T), respectively and these points are represented by the circular green circles in the imaginary part of the effective refractive index of the sensor (green dot line). (b) Distribution of light intensity in the sensor in the referred points. (c) Detail of the distribution of light intensity near the external and the left internal wire in Figure 9.2b. ................................................................................. 116
Figure 9.3 Attenuation as function of wavelength for different values of external refractive index with four metallic wires, for d = 2 µm. The range of external refractive index is from 1.30 to 1.38. In the curve for next=1.38, the two peaks with higher wavelengths are partially overlapped, which makes at extremely difficult to measure the central wavelength for the weaker peak, and therefore limits the range of operation of the sensor. ................................................................................................. 117
Figure 9.4 Attenuation as a function of wavelength for different values of external refractive index D-type for d = 2 µm, (a) dI = 3 µm (the distance between the internal wires and the core) and rI = 500 nm (radius of the internal wires) and for (b) dI = 4 µm and rI = 550 nm. The external refractive index varies from 1.30 to 1.38. ................. 119
Figure 9.5 Attenuation as a function of wavelength for different values of temperature sensor D-type. The external refractive index is 1.34 RIU. The configuration is d = 2.5 µm, dI = 4 µm, rE = 300 nm (the radius of the external wire) and rI = 500 nm (the radius of the internal wires). .............................................................................. 120

XV
List of Tables
Table 2.1 Characteristics of general SPR-based fiber-optic sensors [1]. .......................... 15 Table 3.1 Sellmeier coefficients for germanium, silica, alumina and PMMA ..................... 23 Table 3.2 Plasma and collision wavelengths used for different metals [71]. ..................... 24 Table 3.3 Coefficients for gold from reference [91]. ................................................. 25 Table 3.4 Modal field components for step-profile planar waveguide for the modes TE,
where /xX is the normalized radial distances and the 0 yzx hee [93]. .... 29
Table 3.5 Modal field components for step-profile planar waveguide for the modes TM,
where the /xX is the normalized radial distances and the 0 xzy hhe
[93]. ..................................................................................................... 30 Table 4.1 Sensitivity, resolution, wavelength operation range values for the refractive
index SPR optical fiber sensor based on conventional D-type fiber and with an overlayer of the Ta2O5 with thickness of the 20 nm. ........................................... 51
Table 4.2 Sensitivity and resolution values for the refractive index optical fiber sensors based on conventional and on the PCF D-type fiber configurations. ........................ 59
Table 4.3 Sensitivity values for the refractive index optical fiber sensors based on conventional D-type fiber and on the enhanced PCF D-type sensor ......................... 63
Table 5.1 Sensitivity, resolution and range of the wavelength for the POF D-type of the mode 16. ................................................................................................ 76
Table 6.1 Sensitivity, resolution and range of the wavelength values for the refractive index optical fiber sensors based on two materials (Ag and metamaterial). ...................... 86
Table 6.2 Information about the loss peak (αpeak), wavelength (λ), 3dB/mm the variation of the loss ( ) low and high wavelength with variation of loss 3dB (λL and λH,
respectively) information about narrow of the sensor, extracted from Figure 6.5 ....... 88 Table 7.1 Sensitivity, resolution and range of the wavelength values for the refractive index
optical fiber sensors based on two forms of metal inclusions (film with 45 nm of thickness and wire with 300 nm of radius). .................................................... 100
Table 8.1 Sensitivity, resolution and wavelength range for the fundamental and MP,3,5 modes ......................................................................................................... 108
Table 9.1 Values of the Lorentz-Drude Model parameters in electron volts [87]. ............. 112 Table 9.2 Sensitivity, resolution and range of the wavelength values for the refractive index
optical fiber sensors. ............................................................................... 118 Table 9.3 Sensitivity coefficients of the two peaks for refractive index and temperature .. 121

XVI

XVII
Publications in Refereed Journals and Conferences
Journals
1 D. Santos, A. Guerreiro and J. M. Baptista, “SPR Microstructured D-Type Optical
Fiber Sensor Configuration for Refractive Index Measurement”, IEEE Sensors
Journal, 5472 – 5477, 15 (2015). DOI: 10.1109/JSEN.2015.2442335
2 N. Cennamo, L. Coelho, D. F. Santos, J. M. Baptista, A. Guerreiro, P. A. S. Jorge
and L. Zeni, “Modal Filtering for Optimized Surface Plasmon Resonance Sensing in
Multimode Plastic Optical Fibers”, IEEE Sensors Journal, 6306-6312, 15 (2015).
DOI: 10.1109/JSEN.2015.2450991
3 D. Santos, A. Guerreiro and J. M. Baptista. “SPR optimization using metamaterials
in a D-type PCF refractive index sensor”, Optical Fiber Technology, 83-88, 33
(2017) DOI: 10.1016/j.yofte.2016.11.010.
4 D. Santos, A. Guerreiro and J. M. Baptista. “Surface plasmon resonance sensor
based on D-type fiber with a gold wire”, Optik - International Journal for Light
and Electron Optics, 244-249, 139 (2017) DOI: 10.1016/j.ijleo.2017.03.035.
5 D. Santos, A. Guerreiro and J. M. Baptista. “Simultaneous plasmonic measurement
of refractive index and temperature based on a D-type fiber sensor with gold
wires”, IEEE Sensors Journal, 2439-2446, 17 (2017) DOI:
10.1109/JSEN.2017.2674522.
Conference Proceedings
1 D. Santos, A. Guerreiro and J. M. Baptista, “Performance analysis simulation of
new SPR microstructured D-type optical fiber sensor configurations for refractive
index measurement”, 23rd International Conference on Optical Fibre Sensors, 1-4,
91579O (2014).
2 D. Santos, A. Guerreiro and J. M. Baptista, “New SPR PCF D-type optical fiber
sensor configuration for refractive index”, 24th International Conference on
Optical Fibre Sensors, 1-4, 96346 (2015).

Publications in Refereed Journals and Conferences
XVIII
3 D. Santos, A. Guerreiro and J. M. Baptista, “Optimization of modal sensitivity in
nanowire SPR multimode sensor”, 25th International Conference on Optical Fibre
Sensors, accepted (2017).
4 D. Santos, A. Guerreiro and J. M. Baptista, “SPR based PCF D-type sensor based
on a metamaterial composed of planar metals for refractive index sensing”, 6th
European Workshop on Optical Fibre Sensors, 1-4, 991619 (2016).

1
Chapter 1 Introduction and motivation
Sensors are a technology component that play a critical role in the modern world
in improving the quality of life, either as part of information and monitoring systems
or integrated in different types of devices. They are found in applications ranging from
infrastructure and industrial monitoring to environmental control, among others.
Indeed they can be found measuring many distinct parameters, from pH, temperature,
humidity, pressure and voltage, to refractive index, carbon dioxide (CO2)
concentration and many other physical, chemical and biological parameters. The use
of sensors is today generalized, and they play a crucial role in obtaining relevant
information.
In particular, fiber optic sensors have the advantage of allowing their integration
in vast numbers in the existing network of optical fibers, an infrastructure that covers
almost the entire world. Due to their intrinsic characteristics, a single optical fiber
can support a high number of sensors, operating remotely and having immunity to
electromagnetic and radiofrequency interference [1]. In addition to some external
refractive index detection fiber optic systems already available commercially, there
has been considerable scientific interest in the technology of surface plasmon
resonance (SPR), sensors associated with photonic crystal fiber (PCF), nanoscale
structures and metamaterials. This new type of sensors, based on micro-layers of
material deposited on nano- and micro-structured fibers, have been attracting the
attention of researchers [2].
The operation of surface plasmon resonance sensors as bio sensing has been
demonstrated by Liedberg et al. [3] in 1983. In his study, the authors used a practical
and commonly used method to excite surface plasma, which was originally suggested
by Kretschmann in 1971. It is a method in which light propagates through a prism in
the configuration of attenuated total reflection (ATR), depositing a metal film by
evaporation at the base of this prism [4].
In 1993, Jorgenson and Yee [5] constructed the first fiber-based SPR sensor. This
work demonstrated that the optical fiber can replace the prism, in the configuration
of Kretschmann, allowing also generate the resonance of surface plasmons. The fiber
used was chemically treated to remove almost the entire sheath and thereby increased
the sensitivity of the sensor. This type of fiber optic sensor based on SPR is able to
present a very high sensitivity to the refractive index, a short response time and still
have all the advantages of using optical fiber [6].
SPR sensors in optical fibers have a large variety of classification, depending on:
the type of fiber, the geometry of the sensor, the number, form and size of the

Introduction and motivation
2
coatings, the excitation techniques, the detection or interrogation method and the
application.
The performance enhancement of SPR sensors is focused on improving the
operating wavelength range, refractive index detection range, sensitivity, and
resolution, to obtain the best configuration SPR sensor for a given application. Due to
the different types of SPR sensors, their actual construction and testing is very
expensive and time consuming, making simulation programs important tools to obtain
a first and fast approximation of the behavior of the final sensor. These tools should
allow analyzing parameters such as: the intensity of the electric and magnetic field,
the effective index of refraction, among others, permitting to innovate SPR sensors
and understand phenomena not previously observed.
There are several difficulties to develop a good simulation program, including those
found when writing the code for 2D and 3D designs [1]. When the structure of the
sensor is too complex, the calculations become rather elaborate, being necessary to
use more simplified numerical analysis methods such as: the expansion and
propagation method (MEP) [7], the method for multilayer structure transfer matrix
modeling [8], the optical fiber multilayer cylindrical structure [9] and the rigorous
couple wave analysis (RCWA) [10]. However, these methods have some limitations in
analyzing structures with nanostructured irregularities [11]. The finite-difference time
domain (FDTD) method and the finite element method (FEM) allow calculate the
electric and magnetic fields in these structures, but require high computational
memory capacities [12]. Therefore, it is a challenge to work with this type of
structures.
1.1 Motivation
One of the main reasons for this thesis was the need to have tools to simulate the
behavior of SPR fiber sensors for the measurement of external refractive index. Due
to the different types of optical fibers and sensor configurations associated with SPR,
their actual construction and testing is very expensive and time consuming, making
simulation programs important tools to obtain a first and fast approximation of the
behavior of the final sensor. With such a tool, it is possible to solve problems that arise
during the study and at the same time optimize the project to be carried out. The
possibility of having a single tool to simulate the performance of fiber optic sensors
was the objective in this thesis in the field of optical fiber sensors based on SPR.
The work of this thesis is therefore motivated by the following questions:
• Is this simulation approach effective in modelling different SPR D-Type fiber
configurations?
• How do the results of the simulations compare with the experimental data?
• How can we engineer the interactions between light and plasmons to
improve sensing performance?
• What kind of microstructures and new materials can be incorporated in the
sensors to help boost sensing performance?
• Can we integrate the characteristics of different SPR sensors measuring
distinct quantities in a single sensor?

Introduction and motivation
3
The main objective of this thesis is the numerical simulation analysis of new SPR
sensor configurations using the same simulation tool, focusing on the optimization of
different parameters in SPR sensors (see chapter 4-9). Therefore, we compare the
numerical results with experimental results (see chapter 5). We study the effect of
replacing a conventional film metal with a metamaterial (see chapter 6). We proposed
an SPR sensor based in wires where a single and multimode fibers are used (see
chapters 7-8). And finally, we propose and analyze an SPR sensor configuration for the
simultaneous measurement of the external refractive index and the temperature (see
chapter 9).
1.2 Supporting Research collaborations
The realization of this Ph.D. thesis included periods as visiting researcher and
collaborations with several institutions: University of Porto, Portugal, Institute for
Photonic Technology, in Jena, Germany, Second University of Naples, Italy, and the
host institutions, the Institute for Systems and Computer Engineering, Technology and
Science (INESC-TEC former INESCPorto) and the University of Madeira. Each of these
periods had a direct impact in one or more chapters of this thesis, as well as, the
publication of different scientific articles.
In particular, the period between the 2nd and 3rd year was spent at the Institute for
Photonic Technology (IPHT), under the local supervision of Dr. Kay Schuster and Prof.
Markus A. Schmidt, investigating the interaction between light, plasmonic and high
refractive index microstructures in optical fibers.
Another collaboration included Prof. Dr. Luigi Zeni, Dr. Nunzio Cennamo (from the
University of Naples), and Dr. Pedro Jorge and Dr. Luis Coelho (from INESC-TEC), and
resulted in a study of multimode optical fiber sensor, discussed in chapter 5.
1.3 Structure of the thesis
This thesis is organized in ten chapters, including this introduction. In the second
chapter a definition of SPR is presented, a current state of the art of the SPR sensor
configurations found in literature and how the SPR sensors can be classified. In
addition, we described the characteristics of an SPR sensor, completed in chapter
three. In the third chapter, we describe Maxwell’s equations and the wave equation
to study the behavior of the electromagnetic wave (light) inside the optical fiber. We
also study the optical properties of the materials used in this thesis and we analyze
guided modes in planar and cylindrical structures.
Chapter 4 presents the conventional SPR D-type fiber sensor and we analyze the
behavior of the different SPR sensor parameters. We also analyze and compare the
SPR sensor based on a conventional D-type fiber and on a D-type photonics crystal
fiber. From this chapter resulted two publications, one in a journal (1) and another
one in a conference (1).
In Chapter 5 we study the modal effects on a SPR D-type plastic optical fiber
comprehending a theoretical and an experimental part. A journal paper was published
in conjunction with the University of Naples and the University of Porto (2).

Introduction and motivation
4
In Chapter 6 we address an SPR D-type PCF with a metamaterial and we propose a
method to manufacture a SPR fiber sensor with a metamaterial with specific
characteristics. Two publications resulted from this chapter, one in a journal (3) and
another one in a conference (2).
In Chapter 7 and 8 we study a SPR D-type with two different types of fiber,
singlemode and multimode, respectively, where we study the effects of the multiple
modes that propagate in the fiber and in the metal. From this chapter resulted three
publications, one in journal (Erro! A origem da referência não foi encontrada.) and
another two in conferences (3 and 4).
Chapter 9 proposes a sensor with simultaneous measurement of the refractive
index and temperature. Another journal paper was published (4).
Finally, in chapter 10 we summarize the work performed and highlight the main
conclusions of the thesis.

5
Chapter 2 State of the art
The phenomenon of surface plasmon resonance (SPR) has been studied since the
beginning of the 20th century, and since then the basic principles of operation of SPR
have become well known. The quantity of work in literature about SPR sensors is so
large that any review is necessarily incomplete, therefore, in this chapter we shall
focus on the main results relevant to the central problem of this dissertation.
In this chapter, we explore the nature of surface plasmons and the different ways
to excite optically surface plasmons, starting with the prism configurations by Otto
and Kretschmann, and then moving into other configurations in different types of
optical fibers, such as cladding-off fiber, D-type fiber, microstructured fiber, plastic
optical fiber, among others. We also describe how SPR sensors are classified and
characterized. The large quantities of configurations found in literature justify the
need to have a simulation tool that is able to completely understand, optimize and
choose the more appropriated SPR sensor.
2.1 What are Surface Plasmons
Surface plasmons are excitons that are sometimes described as a type of polaritons,
resulting from a strong coupling of the electromagnetic waves that propagate along
the boundary between a dielectric medium and a metal, with the oscillations of the
density of free electrons in the metal. Plasmons are strongly affected by electric
resistance and other dissipative processes in the materials and typically have short
propagation lengths after which they decay rapidly. At certain optical wavelengths,
electromagnetic waves can couple resonantly with the plasmons resulting in an
enhancement of the optical loss. This mechanism translates into a strong reduction of
transmission power of light for certain wavelengths in optical waveguides coated with
metals. The conditions of occurrence of this resonance can be affected by the optical
properties of the media surrounding the metal, namely the refractive index of the
medium in the exterior of the fibre, which causes several optical parameters (such as
the resonant wavelength and the level of loss) to change. This principle is the corner
stone of most of the SPR based sensors in optical fibres.

State of the art
6
2.2 Optical Excitation of Surface Plasmon
A light wave can couple to a surface plasmon at a metal-dielectric interface if the
component of light’s waveguide is parallel to the interface and matches the
propagation constant of the surface plasmon. The most common couplers used in SPR
sensors include a prism coupler, a grating coupler , and a waveguide coupler, as shown
in Figure 2.1a, Figure 2.1b and Figure 2.2, respectively [13].
The phenomena of surface plasmon resonance has been studied since the beginning
of the 20th century, although the greatest progress on SPR was achieved in the late 60s
with the development of bulk configurations [14], [15]. The first two bulk
configurations are the Otto [14], (dielectric-metal interface) and the Kretschmann [15]
(metal-dielectric interface), as shown in Figure 2.1a and Figure 2.1b, respectively.
The first SPR sensor based on a light prism was developed in 1983 by Liedberg et al.
[3]. Another SPR configuration based on a prism uses a corrugated interface to form a
grating coupler, as shown in Figure 2.2 [16]. Nowadays SPR sensors are the most
sensitive optical refractometric configurations.
(a)
(b)
Figure 2.1 Basic schemes for SPR sensors with (a) Otto configuration based coupling; (b) Kretschmann configuration based coupling.
Figure 2.2 Basic scheme for SPR sensors with grating coupling.

State of the art
7
Figure 2.3 Configuration of SPR sensor using an optical fiber where the fiber cladding is removed (cladding-off fiber).
Optical fiber sensors are also a very interesting solution for environmental
monitoring, due to their intrinsic characteristics such as high sensor count
multiplexing, remote sensing, miniaturization capability and immunity to
electromagnetic and radiofrequency interferences [1]. The first configuration of a SPR
sensor in an optical fiber was first proposed in 1990 [17], but only Jorgenson and Yee
in 1993 [5] fabricated the first optical fiber SPR sensor. In this work, SPR in an optical
fiber was generated by removing the fiber cladding (cladding-off fiber), where a metal
layer was deposited, allowing the excitation of the SPR, as shown in Figure 2.3.
2.3 Evaluation of the performance of the SPR sensors
The performance of an SPR sensor is evaluated based on certain characteristic
properties, such as sensitivity, resolution, linearity, accuracy, reproducibility,
dynamic range and limit of detection [18]. Nevertheless, published works focus more
on the sensitivity and resolution. In SPR sensors based in the prism configuration the
focus is normally on the angular modulation or on the wavelength modulation, as
shown in Figure 2.4. The resonance angle 𝜃𝑟𝑒𝑠 or the resonance wavelength 𝜆𝑟𝑒𝑠 is
determined by the refractive index of the sensing medium. Thus, when the refractive
index of the sensing medium is changed by 𝛿𝑛, the resonant angle of the incidence
light 𝜃𝑟𝑒𝑠 is changed by 𝛿𝜃 or the resonant wavelength 𝜆𝑟𝑒𝑠 is changed by 𝛿𝜆, as shown
in Figure 2.4 [19].

State of the art
8
Figure 2.4 Attenuation of light due to SPR with angular modulation or wavelength modulation [2].
The variation of the 𝛿𝑛 can be observed trough the reflection (Figure 2.4), loss [20]
or transmission. For example, Jorgenson and Yee [5] measured the variation of the
transmission when some important parameters were changed (film thickness, film
refractive index, external refractive index, waveguide refractive index). The
sensitivity of an SPR sensor is defined as the ratio between the change in sensor output
and the change in the quantity to be measured. Homola in [21] calculated the
sensitivity of a SPR sensor using perturbation theory. This theory consists in studying
the relation between the change in the propagation constant of the surface plasmon
(SP) and the refractive index. In other work, the author uses another interrogation
technique based on the optical excitation and interrogation of a surface plasmon,
which consisted in the analysis of the state of polarization of the reflected wave in
presence of the excited plasmon [22].
The resolution of a refractive index SPR sensor defines the smallest variation in the
refractive index which produces a variation in the sensor output. This parameter of
performance is related to the limit of detection and the intensity noise [19].
The sensitivity and the resolution of an SPR sensor is dependent on three
parameters, according to Homola: the variation of the refractive index of the external
medium; the method of excitation of the SPR and the modulation approach used in
the SPR sensor.
2.4 SPR sensor classification
SPR sensor classification in literature depends on multiple parameters: the method
of guiding the light (fiber or prism) and the respective material (different types of
glass, like silica, BK7, among others and plastic), the geometry that allows the coupling
between the surface plasmon and the waveguide, the structure of the metal on which
depends the surface plasmon behavior, the method of surface plasmon excitation, the
type of detection that permits the measurement of the refractive index, and finally
the application the SPR sensor is used for. Figure 2.5 represents a flowchart where SPR
sensor classification is represented, based in the model used by Klantsataya in [23].

State of the art
9
Figure 2.5 Classification of SPR fiber sensors. MMF: Multi Mode Fiber; SMF: Single Mode Fiber; MOF: Microstructured Optical Fiber; PMF: Polarization Maintaining Fiber; FBG: Fiber Bragg Grating, LPG: Long
Period Fiber Grating; TFBG: Tilted Fiber Bragg Grating; LSPR: Localized Surface Plasmon Resonance [23].

State of the art
10
2.4.1 Optical configurations
SPR sensors can be categorized by the type of optics (prism or fiber). The two first
configurations of SPR prims sensors are based in the Otto [14] and Kretschmann [15]
configurations. The appearance of the optical fiber permitted another method of
propagation of the light, and at the same time the possibility of the creation of another
kind of SPR sensor. The optical fiber can be: multimode fiber (MMF), singlemode fiber
(SMF), microstructured optical fiber (MOF), polarization maintaining fiber (PMF), or
multiple-core fiber.
The first SPR fiber sensor was made using a multimode fiber in which a part of the
fiber was removed and then was placed the metal [5]. This configuration is one of the
most common type used for SPR fiber sensors, due to the abundance and relative
simplicity of sensor fabrication. The problem with this configuration is the large
number of modes that propagate in the fiber, producing a lot of resonance modes and
a lot of signal noise in the sensor, resulting in a decreased sensor performance. The
use of a singlemode fiber is the solution for the problem of multiple modes that
propagate in the fiber but, when part of the fiber is removed to place the metal, the
SPR fiber sensor becomes extremely fragile.
The microstructured optical fiber (MOF) is another recent possibility in the creation
of a SPR fiber sensor. The MOF D-type or D-shape is a simple sensor configuration used
for fabrication of a SPR sensor [24]–[26]. Theoretically MOF SPR sensors are constructed
with a different size, structure of the metal, localization of the metal, among other
differences, when compared with SPR fiber sensors based on conventional optical
fibers [27]–[29].
2.4.2 Interrogation of the SPR sensor
Although the sensing principle of SPR sensors is simple, several interrogation
approaches have been applied in these sensors. Today SPR sensors can be classified
based on the type of sensor interrogation:
SPR sensor with angular modulation: in this case the measurement is obtained by
analyzing the angles of coupling incident light as function of the excitation of the
surface plasmon. The angle of incident light that produces the strongest coupling is
used as a sensor output [30], [31]. In this type of interrogation, the optimization of
the sensing parameter is obtained by using the Fresnel’s formulas and multiple-
reflectance theory.
SPR sensor with wavelength modulation: for this type of classification many
wavelengths are used to excite the surface plasmon and normally is measured the
wavelength with the strongest coupling and used as a sensor output. In this case the
angle of incident is the same and only the wavelength is changed [32]. This kind of
modulation also permits multiplexing on wavelength using different materials or
different sizes to change the resonance of the plasmon [33].
The most used sensors based in SPR are based on angular or on wavelength
modulation [28], [34], [35].
SPR sensor with intensity modulation: in this case the wavelength and the angle
of incident is kept constant and only the loss intensity is measured as function of the

State of the art
11
light interaction with the surface plasmon. The loss intensity is used as a sensor output
[36]. The advantages of this configuration is its simplicity and low cost, but it is
necessary the complete control the wavelength resonance of the sensor which, is
controlled by the materials that constitute the sensor [23]. Moreover, this
interrogation scheme requires intensity referencing.
SPR sensor with phase modulation: in this case is used the phase of the light wave
as the sensor output, being observed the interaction of the light with the surface
plasmon as function of the light phase modulation [37]. The SPR sensor based in phase
modulation has better resolution, but there are some difficulties to build high precision
and real-time wave front phase detection [38], [39].
SPR sensor with polarization modulation: changes in the polarization of the light
wave interacting with a surface plasmon are measured [40].
Finally, it is possible to combing two types of modulation, for example, phase
modulation and polarization modulation, as proposed by Xiangliang in [41].
In this thesis, we considered SPR sensors with wavelength modulation because is
relatively easy to interrogate, presents a good sensitivity and resolution, and does not
require referencing [1].
2.4.3 Geometry design of the SPR fiber sensor
The geometry design of the SPR fiber sensor can be classified in three ways,
depending on the localization of the metal with respect of the fiber:
Side fiber SPR sensor: In this case, the localization of the metal is on one side of
the fiber. The metal cladding-off fiber (also denominated unclad fiber) was the first
configuration to be studied for SPR sensors in an optical fiber, as shown in Figure 2.3
[5]. This configuration has been very studied with a good sensitivity when using MMFs,
but with the noise problem. The metal cladding-off using SMF has a good sensitivity
with low noise since only one mode is studied, but the fragility of the SPR sensor is
increased. To solve this problem another configuration was proposed. In 1994 Bender
et al. [42] demonstrated another configuration, the side-polished fiber. This sensing
configuration is formed by an optical fiber where the cladding is polished, only on one
face, where the metal is deposited. In this case the fiber is bent, as shown in Figure
2.6. This type of configuration demonstrated the same sensitivity, being more robust
in comparison with the cladding-off SMF [43].
Figure 2.6 SPR fiber-optic sensor with a side-polished configuration.
The evolution and appearance of new fiber manufacturing techniques allowed the
creation of the other SPR sensor designs like the D-type or D-shape fiber, as shown in
Figure 2.7. The D-type fiber (without SPR) allowed to study the sensitivity of the
external refractive index as function of the phase difference variation [44], and the

State of the art
12
combination with SPR technology, the sensitivity of the external refractive index is
obtained using the wavelength [45], intensity [46] or phase variations [47] and with
better results. This configuration is very used in the literature because of the
robustness and availability of the fiber and can use other types of fiber, films, or metal
configurations, like multimode plastic fiber [48], microstructured fiber [12],
metamaterial films and metallic wires studied in this thesis.
Figure 2.8 shows different schematics of the SPR fiber optic sensor design. In 1997
Tubb et al. [49] used other configuration, a tapered fiber, as shown in Figure 2.8a.
This type of configuration is able to generate multiple SPR wavelength peaks [50]. The
SPR tapered fiber can reach high sensitivity (11800 nm/RIU) when combined with a
Figure 2.7 SPR fiber optic sensor with a D-shape or D-type fiber configuration.
(a)
(b)
(c)
(d)
Figure 2.8 Schematics of the SPR fiber-optic sensor design with (a) tapered fiber; (b) hetero-core fiber;
(c) U-shape fiber; d) H-shaper fiber.

State of the art
13
high dielectric overlay like Indium Nitride [51], but again with the cost of an increased
fragility of the SPR sensor.
There are more fiber configurations of the SPR sensor based in optical fibers:
Hetero-core fiber, that consists in two fibers with different sizes of the cores (one
large and one small). The main characteristic of this sensor is that the modes leak into
the cladding layer and then the SPR occurs between the metal and the external
medium. This can be used for the measurement of the variation of the refractive
external medium (Figure 2.8b) [52]. U-shape fiber, like in the previous designs, the
aim is to allow the modes to propagate in the cladding through the bend of the fiber,
and replacing the cladding by the metal layer we can create SPR (Figure 2.8c) [34]. H-
shape fiber design is a fiber where the cladding is partial removed, and replaced by a
metal film, resulting in a fiber with the form of an “H”, as shown in Figure 2.8d. In
this fiber the modes that propagate in the core can couple into the plasmonic mode,
similar to a D-type fiber [53].
Fiber tip SPR sensor: in this case the localization of the metal is at the end of the
fiber. The schematic of the sensor is shown in Figure 2.9, and consists in an optical
fiber where the end of the cladding is removed and then a thin film is deposited in the
side of fiber. Finally in the tip of the fiber is deposited a mirror that reflects the wave
and then interrogation is performed through analyzing light back-reflected from the
mirrored fiber tip. The characteristics of the sensor are similar to the unclad sensor,
but increase dips, because the wave travels two times in the metal [54].
Figure 2.9 Schematic of an optical fiber SPR sensor implemented on the tip of an optical fiber with a mirror in the end.
Interior fiber SPR sensor: in this kind of design the metal is deposited in the
interior of the fiber through the holes of a microstructured optical fiber, by the micro
capillaries. Not only metal can be deposited inside of the fiber. In some configurations,
can be use the MOF to deposit also the sample in the interior of the fiber. This new
type of sensors, based on micro and nano material layers deposited on MOF, have also
been attracting the attention of researchers [2]. The optical fiber community has been
continuously engaged on research and development activity around these new fibers.
Indeed, the fiber structure with a lattice of air holes running along its length shows
remarkable properties that support a large variety of novel optical fiber devices, which

State of the art
14
can be used both in communication and sensing systems. Some of the designs of SPR
sensors found in literature are: MOF with crescent-shape holes, PCF with circular holes
[55], MOF with three structured holes (also called wagon wheel fiber) [12] and
microcapillary fiber SPR sensors [56], as shown in Figure 2.10.
(a) (b)
(c) (d)
Figure 2.10 SPR fiber optic sensors based in photonic crystal fibers with; (a) with circular holes [55], (b) with crescent-shape holes, (c) MOF three structured holes (also called wagon wheel fiber) [12] and
d) microcapillary fiber SPR sensor [56].
Figure 2.10a and Figure 2.10b show two types of MOF SPR sensors where the
fundamental mode propagates in the region confined between the different air holes.
In that process, light can couple with the multiple plasmonic modes supported by the
circular metal, resulting in multiple peaks in the loss curve of the device. These MOF
SPR sensors report a sensitivity in wavelength of 800 nm/RIU and 3000 nm/RIU,
respectively, in the range of the external refractive index (sample) between 1.33 and
1.34 RI. The problem with these designs is the size of the circular hole and the
consequent deposition of a thin layer of metal in these holes [55]. One solution for
this problem is to use a fiber with larger holes, like the fibers depicted in Figure 2.10c
and Figure 2.10d. Figure 2.10c shows a MOF with three holes. In this case the light is
propagated in the center of the fiber, but results of the sensor show a low sensitivity

State of the art
15
to refractive index in wavelength. Figure 2.10d illustrates the microcapillary fiber SPR
sensor and the characteristic of this SPR sensor is that light travels in the medium with
the highest refractive index (sample). This design reached a sensitivity of 6607 nm/RIU
for a large high refractive index (>1.5 RI). In these configurations one of the main
difficulties is the deposition of the metal inside the fiber.
Table 2.1 shows some parameters that characterize SPR sensors’ performance,
namely, sensitivity, resolution, wavelength operation, refractive index (RI) range of
detection for different fiber optical structures [57]. Table 2.1 addresses SPR fiber
structures with different geometrical configurations and coatings [18].
Table 2.1 Characteristics of general SPR-based fiber-optic sensors [1].
Optical structure Characteristics Detection RI range
Wavelength operation
Sensitivity/ Resolution
Ref.
Cladding-off cylindrical fiber
Single metal coating
MMF, Au-Ag alloy nanoparticle.
1.342~1.346 400~800 nm ~3000 nm/RIU [58]
MMF, Au, surface roughness.
1.3335~ 1.4018
550~1000 nm 1600~3000 nm/RIU [59]
MMF, Au. 1.33~1.40 670 nm 2.5 x 10⁻⁴ RIU [60]
MMF, parameter analysis.
1.333 e 1.339
400~900 nm 2266.7~2780.1
nm/RIU [61]
Multi-metal coating
Au, Ag double layer, Au-Ag alloy
nanoparticle. 2500~3000 nm/RIU [62]
With multi-layer MMF, Au, dielectric
multilayer. (SIO2, TiO2)
1.333 e 1.336
1.001~1.313 450~950 nm 10-5 RIU [63]
Tapered fiber
Off Cladding
MMF, Au, tapering ratio.
1.333 e 1.335
2700~4900 nm/RIU [64]
MMF, Au. 1.333~1.343 600~700 nm 2750~15000nm/RIU [65]
With Cladding SMF, Au, semi-
cylindrical, multiple peaks.
1.440~1.454 400~1700 nm 7 x 10⁻⁷ RIU [50]
D-Type fiber
Single metal coating
SMF, cut core 1.33~1.40 632.8 nm 8 x 10⁻⁵ RIU [66]
With overlayer
SMF, half of core polished, Au, Overlayer SiO2
1.332~1.40 632.8 nm 2.5 x 10⁻⁶ RIU
(phase) [67]
SMF, half of core polished, Au, Overlayer SiO2
1.33~1.40 632.8 nm 2.5 x 10⁻⁵ RIU [46]
SMF, remained thin clad, Au, overlayer
Ta2O5 1.329~1.393 760~940 nm 5 x 10⁻⁷ RIU [68]
SMF, Au, Al mirror, overlayer Ta2O5
1.32~1.42 825 nm 4 x 10⁻⁵ RIU [69]
With thin cladding
PMF, polarization alignment.
1.33~1.339 700~900 nm 4 x 10⁻⁶ RIU [70]
Modified fiber end
Flat fiber tip MMF, end mirror Ag and metal coating,
Au. 1.333~1.346 400~840 nm 1557 nm/RIU [54]

State of the art
16
2.4.4 Plasmonic coating
The most simple designs of SPR sensor found in literature consist in a material that
guides the light and a metal film, normally gold (Au), silver (Ag), copper (Cu) or
alumina (Al), but there are countless possibilities to combine multiple metal coatings
to improve the sensitivity, resolution and spectral operation region of the SPR sensor.
Sharma in [71] studied different combinations of two metallic layers and these bi-
metallic layers have a better performance that only one layer. We can also use a thin
high refractive index overlayer after the metallic layer to shift the spectral operation
sensing region [72]. We can also use metamaterials instead of pure metallic layers and
improve the operational characteristics of the sensor [73]. The shape of the metallic
layer is also studied to improve the sensor. The use of metallic wires permit an increase
in the number of modes that couple with the fundamental mode and increase the
performance of the sensor [74].
2.4.5 Fiber Grating SPR sensor
Until now, the most common mechanism of SPR excitation in an optical fiber is
total internal reflection (TIR), where a part of the evanescent field that penetrates
through the interface no ordinary total reflection can excite SPs. The evanescent field
is increased by reducing the distance between the waveguide and the metal, and with
that purposed, multiple designs were created (subsection 2.4.3). Another technology
used for SPR excitation is fiber grating.
A fiber grating is a periodic structure in the refractive index of the fiber core that
couples with a specific wavelength, producing an effective mirror for that wavelength.
This technology allows the modes that are propagated in the core to be propagated in
the cladding of the fiber and be coupled with the plasmonic modes without change
the external geometry of the fiber. These structures are the Long Period Fiber Gratings
(LPFGs) and Tilted Fiber Bragg Gratings (TFBGs) permitting the deposition of the metal
directly on the fiber cladding. The use of LPFGs as SPR sensors was reported by Nemova
et al. [75] and the use of TFBGs as SPR sensors was reported by Shevchenko et al. [76],
as illustrated in Figure 2.11a and b, respectively.

State of the art
17
(a)
(b)
Figure 2.11 Examples of grating SPR sensor (a) with a long period grating (LPG), (b) with a tilted fiber Bragg grating TFBGs [1].
2.4.6 Application of the SPR sensor
SPR sensors are essentially refractive index sensors and the sensitivity and
resolution of the sensor (characterization parameters) are calculated through the
variation of the refractive index (n), as shown in section 2.3. We also know the
different components of the SPR sensor (thickness and type of metal, composition of
the fiber, distance between the core and the metal, external refractive index, among
others) change the effective refractive index of the sensor and consequently change
the operational characteristics of the SPR sensor. The possibility to change these
important parameters of the SPR sensor permits the optimization of the sensor.
The refractive index in a SPR sensor is the basic parameter measured by this sensor,
but, with a proper configuration of the sensor, we can detect and analyze chemical,
physical and biological values. Some examples of this applications are: Hassani in [77]
used a Ferroelectric PVDF in a SPR sensor that allowed to detect values of the
refractive index close to 1.00 RI, typically close to the refractive index of the gases.

State of the art
18
Luan in [28] used a liquid with large thermo-optic coefficient, ideal for measure of
temperature. Saikia in [78] created a pH sensor based on SPR of silver nanostructured
film.
As stated before, another area of interest for SPR sensors are biosensors. To build
a biosensor, a biorecognition layer has to be used with elements (e.g., antibodies
polymeric coating) that recognize and are able to interact with a selected analyte.
This element will change the refractive index accordingly in the presence of the
analyte. Hence, this change will give rise to a change in the propagation constant of
the surface plasmon [19]. Another application of this type of sensor is pH
measurement, that used one layer based in the hydrophilic polymers after the layer
of metal [79], [80]. Another application is the measurement of urea and glucose in the
same fiber, but with different resonance wavelengths for each parameter under
analysis [33].

19
Chapter 3 Models and methodology
In this chapter, we review the concepts of light propagation, addressed by
electromagnetic theory. We also discuss the optical properties of dielectrics and
metals. Next, we explain optical waveguide theory for a planar step-index and for a
circular step-index guide, to understand the behavior of the different materials in
these structures and finally the phenomena of SPR in optical fiber sensors is explained
[81].
An introduction of the finite element method (FEM), the methods used for the
simulation of SPR and the different problems of these methods in the simulations are
also addressed.
3.1 Maxwell’s equations
The electromagnetic fields in optical fiber waveguides are governed by the
macroscopic Maxwell’s equations in the absence of external currents or electric
charges, say:
t
tt
),(),(
rBrE (3.1)
t
ttjt
),(),(),(
rDrrH (3.2)
),(),( tt rrD (3.3)
0),( trB (3.4)
where E, H, D and B are the electric, the magnetic, the dielectric and the magnetic
induction fields, respectively. Also, the term j is the current density, ρ is the charge
density, r is the spatial coordinate and t denotes time.
The dielectric and the magnetic fields are written as [82]
),(),(),( 0 ttt rPrErD (3.5)
),(),(1
),(0
ttt rMrBrH
(3.6)

Models and methodology
20
where P and M are the macroscopic polarization and magnetization, respectively, the
constants ε0 and µ0 are the vacuum permittivity and vacuum permeability,
respectively. The equations that relate the material properties with the
electromagnetic fields are known as constitutive relations, and specifically relate D
and B with E and H.
In a linear, isotropic, nonmagnetic and nondispersive medium they have the
form of [83]:
EDEP re 00 (3.7)
HBHM rm 0 (3.8)
Ej c (3.9)
where e and m are the electric and magnetic susceptibility, e +1 r and
m +1 r are the relative permittivity and relative permeability of the material,
respectively and is the conductivity.
Time-harmonic solutions describing strictly monochromatic fields are of the form:
tjt exp),(),( rErE (3.10)
)exp(),(),( tjt rHrH (3.11)
where is the angular frequency of light. In this representation, the fields are
complex quantities whose real parts correspond to the physical fields [10]. Therefore,
the next constitutive relations can be described as:
)exp(),(),( 0 tjt r rErD (3.12)
)exp(),(),( 0 tjt rHrB (3.13)
)exp(),(),( tjtc rErj (3.14)
For complex optical structures composed of elements with different materials,
these constants include the dielectric, magnetic constant and conductivity, which vary
along the system from point to point and therefore can be considered as position
dependent functions.
Taking the curl of equation 3.1 and using equations 3.3, 3.12 and 3.13, yields the
wave equation for the Fourier components of the electric field, which is the same one
that COMSOL Multiphysics uses to determine the eigenvalues and eigenmodes of the
electric field:
0),(),(~),( 2
0 rErεrE rk (3.15)
Applying the same reasoning for the magnetic field, it comes:

Models and methodology
21
),(),(),(~ 2
0
1 rHrHrε kr
(3.16)
where ck /0 is the wavenumber of the mode of the field and 00/1 c is the
speed of light in vacuum. In this work the angular frequency is replaced by the
wavelength , where the relation between the two components is 0/2 ckc .
The term 0/),(),(),(~ rjrr σrεrε represents the effective complex
relative dielectric function, which includes the contribution of the material-dependent
(real valued) relative permittivity ),( rεr, mostly determined by the bound state of
the optical active modes of the material [84], and the contribution of the Ohmic
conductivity of the material ),( rσ .
3.2 The Lorentz and the Drude models, and the optical
properties of the gold, silver, aluminum and copper
The Lorentz and Drude models are the most basic models to calculate the optical
properties of materials in terms of complex index of refraction and of dielectric
constant for different wavelengths or frequencies of light [85].
3.2.1 The Lorentz model
The Lorentz model is based on the study of the interaction between the
electromagnetic field and the material. When any electromagnetic field is applied to
the material, the conduction electrons and other charges in the material react and
move away of the is equilibrium position, thus varying the local dipole moment of the
material. In a simple way, one may consider that light causes the different charged
particles in the material to vibrate, altering their relative separation. The resulting
oscillating dipoles work as small antennas that re-emit light and are responsible for
the optical properties of the material. The main contribution comes from the
electrons, which are the lightest of these particles and therefore are those which
vibrate with the largest amplitudes. Their behavior can be described by the following
equation [86]:
Exxx
edt
d
dt
dme
2
02
2
(3.17)
where me is the electron mass, the damping rate, ω0 is the resonant frequency of
the oscillator (undamped), e is the electron charge and x is the time varying electron
displacement. Equation 3.17 contains four terms that describe different effects: the
Lorentz force associated with the force produced by the electromagnetic field on the
electron, the damping force associated with electron collisions and other mechanisms
of incoherent losses, the restoring force which traps the electron to the atom and the
electric field driving force. Equation 3.17 can be solved in reciprocal space using the
Fourier transform, resulting in an amplitude of oscillation given by:

Models and methodology
22
im
e
e
22
0
)()(
Er (3.18)
The Fourier component of the dipole moment, associated with this vibration is
defined as:
im
e
e
22
0
2 )()(
Ep (3.19)
while the polarization for all the atoms per volume (N) is defined as:
im
eNN
e
22
0
2 )()()(
EpP (3.20)
Combining equations 3.20 and 3.7, it is possible to find the value of the
susceptibility and the permittivity of the material considering only one oscillator:
jm
Ne
jm
Ne
e
r
e
22
00
2
22
00
2 11)(
1)( (3.21)
For real materials, the dielectric function is assumed to be equal to the sum of
contributions from individual oscillators. The equation of the permittivity of the
multiple oscillator is given by [87]:
N
m mm
pm
rj
f
122
0
2
)(
(3.22)
where p is the plasma frequency, m is the number of the oscillator resonant with
frequency m0 , mf is related to the strength of the oscillator and is the
permittivity at the infinite frequency.
3.2.2 The Drude model
This model explains the transport properties of conduction electrons in metals.
Electrons in metals with higher energy and near the Fermi level can be excited into
other energy and momentum states by photons with very small energies (metals tend
to be either highly absorbing or reflecting at visible and infrared wavelengths). If These
electrons can be considered “free”, then the Drude oscillator is a simplification of the
single Lorentz oscillator where the resonance frequency ( m0 ) is equal to 0, because
there is no “spring” to connect free electrons with ions. Applying this condition,
equation 3.20 yields the Drude model for the optical properties of a free-electron
metal [81]:
j
p
r 2
2
1)( (3.23)
where the plasma frequency is stated by 0
22 / eep meN , being eN the density of
the electron.

Models and methodology
23
3.2.3 The Sellmeier equation
The electric and magnetic fields are dependent on the angular frequency
(equations 3.10 and 3.11), as well as, on the refractive index of the materials.
Therefore, it is necessary to calculate the material’s index of refraction for all
frequencies under study. Typically, in a dielectric layer, the refractive index can be
calculated using Sellmeier’s equation [88]:
3
122
22 1)(
i i
i
C
Bn
(3.24)
where iB , iC are the Sellmeier coefficients, determined experimentally. Table 3.1
presents the Sellmeier coefficients for different materials like the germanium, silica, alumina and plastic (Poly(methyl methacrylate) - PMMA).
Table 3.1 Sellmeier coefficients for germanium, silica, alumina and PMMA
Material B1 B2 B3 C1 C2 C3 Ref.
SiO2 0.696166 0.407942 0.897479 0.068404 0.116241 9.896161 [88]
GeO2 0.8068664 0.7181585 0.8541683 0.06897261 0.1539661 11.84193 [88]
Al2O3 1.4313493 0.65054713 5.3414021 0.00726631 0.1193242 18.028251 [89]
PMMA 0.4963 0.6965 0.3223 0.0718 0.1174 0.9237 [90]
The SiO2 core of the optical fiber is normally doped with a X percentage of GeO2.
The calculation of the refractive index as a function of the wavelength in pure silica
and in a glass doped with a X percentage of GeO2 follows the Sellmeier relation
according to:
2/13
12
2
)2
)
(
(1
iS
i
G
i
S
i
S
i
G
i
S
i
CCXC
BBXBn
(3.25)
whereS
iB , S
iC ,G
iB and G
iC are the Sellmeier coefficients and the superscripts S and G
denote SiO2 and GeO2, respectively. The values of these parameters are represented
in Table 3.1. However, for some specific dielectric materials the Sellmeier’s not
provide the best description of the dependency of the refractive index with
wavelength and other approximations are used. For example, for Ta2O5 the refractive
index is calculated as:
4
5
2
107.520178.0878.1
n (3.26)
In this thesis, we have considered that the optical fiber core is composed of pure
silica with 16% of germanium (GeO2-SiO2) and the optical fiber cladding is composed
of pure silica. The refractive index of the core and cladding as a function of the
wavelength is shown in Figure 3.1.

Models and methodology
24
Figure 3.1 Refractive index of the core (GeO2-SiO2) and of the cladding (SiO2).
3.2.4 Optical properties of gold, silver, aluminum and copper
The optical properties of a metal can be obtained through equation 3.23. Also, the
permittivity and the refractive index can be obtained from the Drude model as
function of wavelength as:
)(1)(
2
2
jcP
cm
(3.27)
where the permittivity is defined through the refractive index as:
)()()( mmm jkn (3.28)
mn and mk are the real and imaginary parts of the index of refraction for the metal,
respectively, m is the complex permittivity of the metal and p and c denote the
plasma wavelength (pP c /2 ) and the collision wavelength ( /2 cc ),
respectively. Typical values of the plasma and collision wavelengths are shown in Table 3.2 [71] for Ag, Au, Cu and Al.
Table 3.2 Plasma and collision wavelengths used for different metals [71].
Metal Plasma wavelength (λp) (m) Collision wavelength (λc) (m)
Silver (Ag) 1.4541χ10−7 1.7614χ10−5
Gold (Au) 1.6826 χ10−7 8.9342χ10−6
Aluminum (Al) 1.0657 χ10−7 2.4511χ10−5
Copper (Cu) 1.3617 χ10−7 4.0852χ10−5
The Drude model presented in equation 3.27 is valid to study the behavior of the
optical properties in the visible/near-ultraviolet (uv) region for the most of the metals
mentioned in Table 3.2 (not considering Au) [71]. In the particular case of Au, it is not

Models and methodology
25
so effective in the violet/near-uv region (wavelengths < 400 nm). The reason for that
is the more important role played by interband transitions in the violet/near-uv region.
For this reason, Etchegoin in [85] considered the two interband transitions in gold and
determined the full mode permittivity relation of Au as function of the frequency as:
2
1
2
2
)()(
)()(
i ii
ij
ii
ij
i
p
Au
j
e
j
eC
j
(3.29)
where the third and four elements in the equation represent the contributions of the interband transitions (gaps). In equation 3.29,
iC is the amplitude, i is the phase,
i is the energy of the gap, i is the broadening and we can also describe the relation
as function of wavelength as:
2
1
22
)//1/1()//1/1(
)//1(
1)(
i ii
j
ii
j
i
i
cP
Au
j
e
j
eA
j
ii
(3.30)
where ii c /2 is the interband transition in wavelength, ii c /2 is the
transition broadening expressed in wavelength units, and iii CA / is the
dimensionless critical point amplitude. Also iC , i , i and i are the amplitude,
phase, energy of the gap in frequency units and the broadening, respectively [85]. The
values of the parameters of equation 3.30 are represented in the Table 3.3.
Table 3.3 Coefficients for gold from reference [85].
P [nm] c [nm] i iA i i [nm] i [nm]
1.54 1.43 14500
1 1.27 4/ 470 1900
2 1.1 4/ 325 1060
The behavior of the Drude model with and without the interband transition
(equations 3.27 and 3.30) is shown in Figure 3.2. This Figure illustrates the variation
of the real and imaginary part of the refractive index (Figure 3.2a) and of the
permittivity (Figure 3.2b) as function of the wavelength for silver and gold, in the case
of gold with and without the interband transition.

Models and methodology
26
(a)
(b)
Figure 3.2 (a) Refractive index and (b) permittivity of gold (Au) and silver (Ag). The solid lines are the real part of the refractive index and permittivity, the dashed lines are the imaginary part of the refractive index and permittivity, respectively. The black and red lines refer to the gold with and
without interband, respectively, and the green line refers to silver.
From Figure 3.2 we observe that the difference between the Drude model with and
without interband is considerable. Comparing the results of these models with the
experimental values from Johnson in [91], one concludes that equation 3.30 is a good
approximation of the behavior of the gold. On the other hand, equation 3.27 can be a
good approximation for silver [85].
3.3 Optical waveguide theory
In this section, we are interested in the study of electromagnetic modes in
cylindrical (core of the optical fiber and metallic wire) and planar (slab inclusions)

Models and methodology
27
geometries. The slab inclusion comprehends two types of materials, metal and high
refractive index material.
3.3.1 Definitions and properties of guided modes
Waveguides not only confine the electromagnetic (EM) field, but also and more
importantly, constrain the directions of propagation of the field. Waveguides are
distinguished according to their geometry and consequently the type of confinement
obtained, ranging from planar to axial waveguides, being the optical fiber the most
notorious and used technological application of waveguides. This spatial confinement
results in a discrete set of solutions of the wave equations 3.10 and 3.11, which are
usually called guided modes. In optical fibers, the dependency in the spatial z
coordinate along the axis is obtained using the variable separation method:
)exp(),()( zjyxerE iii (3.31)
)exp(),()( zjyxhrH iii (3.32)
where i is the propagation constant of the i-th mode, ie and ih are the electric and
magnetic fields of the guided i-th mode, respectively. The propagation constant of one mode can be written as function of the effective refractive index (
effn ) as
00 )'''( kjnnkn effeffeff (3.33)
where 'effn and ''effn are the respective real and imaginary parts of the effective
refractive index.
3.3.2 Poynting vector, total power and loss in the guided mode
The optical power flow carried by a guided mode is characterized by the real part
of the time-averaged Poynting vector as:
)exp()Re()2/1()Re()2/1( z heHES (3.34)
where 0''2 kneff is known as the power absorption coefficient. The Poynting vector
has the same direction of the EM wave, and that means the Poynting vector can be
reduced to a scalar field zSz S . The total power P of a guided mode after a
propagation distance z = L (where L is the length of the sensing fiber) is given by
integrating the power density across an infinite cross section A :
A
L
A
z dAedASP )Re(2
1 *he
(3.35)
In the field of optics, the absorption coefficient is most commonly represented in
terms of decibel as:
LdB 10ln
20 (3.36)

Models and methodology
28
3.3.3 The planar step-index waveguide
The planar step-index waveguide is the simplest of step profile waveguides and in
this thesis is used to provide a simple tool to model and help to understand the
behavior of the modes in metal and in high refractive index planar profiles, as shown
in Figure 3.3.
Figure 3.3 Schematic of the planar step-index waveguide.
The schematic of the planar step-index waveguide is represented in the Figure 3.3
and the profile is defined as
;
;)(
cl
co
n
nxn
x
x
2
20 where clco nn (3.37)
where is the core half width, con and cln are the refractive index of the core and
of the cladding, respectively. Also, it is possible to define more complex structures
that include components of different materials such as an internal medium (e.g.
composed of a dielectric or an absorbing dielectric) surrounded by external medium.
This guide is a two-dimensional waveguide and by orienting it in a system of Cartesian
axes, the fields depend on x and z, that means the equations 3.30 and 3.32 can be
described as:
)exp()(),( zjxezxE iii (3.38)
)exp()(),( zjxhzxH iii (3.39)
We can express the transverse fields in terms of the longitudinal fields by [92]:
;0
2/1
0
0
y
zzx
hk
x
e
p
je
,0
2/1
0
0
x
zzy
hk
y
e
p
je
(3.40)
;2
0
2/1
0
0
y
zzx
enk
x
h
p
jh
,2
0
2/1
0
0
x
zzy
enk
y
h
p
jh
(3.41)
where 22
0
2 knp and n takes either the value of con or cln depending in which
region the fields are calculated. In the case of the planar waveguide, we consider that
the structure is infinitely extended in the y direction, and the partial derivative as
function of y is equal to 0. Equations 3.40 and 3.41 can be written as:

Models and methodology
29
;x
e
p
je z
x
;0
2/1
0
0
x
zy
hk
p
je
(3.42)
x
h
p
jh z
x
,2
0
2/1
0
0
x
zy
enk
p
jh
(3.43)
We obtain a solution for ze and zh by solving the wave equations 3.15 and 3.16 and
using the equation 3.37 we obtain:
;02
2
22
U
dx
d 2||0 x (3.44)
;02
2
22
W
dx
d ||2 x (3.45)
where 22
0 effco nnkU and 22
0 effcl nnkW are the model parameters of
the core and of the cladding, respectively. denotes one of the longitudinal field
components, ze or zh [92].
The eigenvalue equation for the planar waveguide mode can be defined by two
types of polarization states of the electromagnetic field: the transverse magnetic (TM)
and transverse electric (TE) modes. TM modes do not have longitudinal magnetic field
( 0zh ) and we TE modes when do not have longitudinal electric field ( 0ze ). The
modal field components for a step-profile planar waveguide are represented in Table
3.4 for modes TE and in Table 3.5 for modes TM [92].
Table 3.4 Modal field components for step-profile planar waveguide for the modes TE, where
/xX is the normalized radial distances and the 0 yzx hee [92].
Core Cladding
ye Even )cos(
)cos(
U
UX
)exp(
|)|exp(
W
XW
Odd )sin(
)sin(
U
UX
)exp(
|)|exp(
|| W
XW
X
X
xh Even )cos(
)cos(2/1
0
0
0 U
UX
k
)exp(
|)|exp(2/1
0
0
0 W
XW
k
Odd )sin(
)sin(2/1
0
0
0 U
UX
k
)exp(
|)|exp(
||
2/1
0
0
0 W
XW
X
X
k
zh Even )sin(
)sin(2/1
0
0
0 U
UX
k
jW
)exp(
|)|exp(
||
2/1
0
0
0 W
XW
X
X
k
jW
Odd )cos(
)cos(2/1
0
0
0 U
UX
k
jW
)exp(
|)|exp(2/1
0
0
0 W
XW
k
jW

Models and methodology
30
Table 3.5 Modal field components for step-profile planar waveguide for the modes TM, where the
/xX is the normalized radial distances and the 0 xzy hhe [92].
Core Cladding
xe Even
)cos(
)cos(
U
UX
)exp(
|)|exp(2
2
W
XW
n
n
cl
co
Odd
)sin(
)sin(
U
UX
)exp(
|)|exp(
||2
2
W
XW
X
X
n
n
cl
co
yh Even
)cos(
)cos(2/1
0
00
2
U
UXknco
)exp(
|)|exp(2/1
0
00
2
W
XWknco
Odd
)sin(
)sin(2/1
0
00
2
U
UXknco
)exp(
|)|exp(
||
2/1
0
00
2
W
XW
X
Xknco
ze Even
)sin(
)sin(2
2
U
UX
n
njW
cl
co
)exp(
|)|exp(
||2
2
W
XW
X
X
n
njW
cl
co
Odd
)cos(
)cos(2
2
U
UX
n
njW
cl
co
)exp(
|)|exp(2
2
W
XW
n
njW
cl
co
The eigenvalue equations for a planar step-index (applied only if the length of the
metal is infinite or close to infinite, in numerical terms) are:
modes TM
UUnWnOdd
UUnWnEven
clco
clco
cot
tan22
22
(3.46)
modes TE
UUWOdd
UUWEven
cot
tan (3.47)
where each value of the effective refractive index effn must lie in the range for bound
modes coeffcl nnn . These equations are transcendental and cannot be solved
analytically, instead numerical methods have to be used.
3.3.4 The circular step-index waveguide
In the case of a circular or fiber step-index waveguide, the same method used to
study the planar waveguide can be applied. The schematic of the fiber step-index
waveguide is shown in Figure 3.4.

Models and methodology
31
Figure 3.4 Schematic of the fiber step-index waveguide.
In this case is the radius of the fiber and the use of the Cartesian coordinate
system is not the best choice, because with a cylindrical symmetry it is more convenient to use the polar coordinate system. That means, that equations 3.30 and 3.32 can be expressed as:
)exp(),(),,( zjrezrE iii (3.48)
))(,(),,( zjrhzrH iii (3.49)
From waveguide theory and considering polar coordinates, we assume that the transverse field components can be expressed in terms of the longitudinal field
components ze and zh as [92]:
;0
2/1
0
0
zz
r
h
r
k
r
e
p
je ,0
2/1
0
0
r
hk
e
rp
je zz
(3.50)
;2
0
2/1
0
0
zz
r
e
r
nk
r
h
p
jh .2
0
2/1
0
0
r
enk
h
rp
jh zz
(3.51)
As the planar waveguide, we can obtain a solution for ze and zh by solving the
wave equations 3.15 and 3.16 and we deduce that:
;011 2
2
2
22
2
U
RRRR 10 R (3.52)
;011 2
2
2
22
2
W
RRRR 1R (3.53)

Models and methodology
32
where /rR is the normalized radial distance.
In the case of acircular fiber, TE and TM, with circular symmetric fields, can be
propagated as in the planar waveguides, because they have electric and magnetic
fields that are parallel to the interface, respectively. In terms of local plane waves,
or rays, only meridional rays, i.e. those passing through the waveguide axis can
preserve the 0, ize and 0, izh at every reflection [92]. In general, the ray follows
an helical or skew trajectory in a circular fiber, that means it is impossible to maintain
0, ize and 0, izh , because the direction of propagation rotates along the ray
trajectory. These combinations of TM and TE modes are called hybrid modes (EH and
HE modes) [92].
The general solutions for longitudinal field components can be written as [92]:
)()(
)(v
v
vz f
UJ
URJAe )(
)(
)(v
v
vz g
UJ
URJBh 10 R (3.54)
)()(
)(v
v
vz f
WK
WRKAe )(
)(
)(v
v
vz g
WK
WRKBh 1R (3.55)
where A and B are constants, 𝐽𝑣 and 𝐾𝑣 are respectively the Bessel functions of the
first kind and modified Bessel functions of the second kind relatively to 𝑣 (𝑣 is the
Bessel order and can be a positive integer or zero) and )(vf and )(vg are defined
as:
modes Odd)sin(
modesEven )cos()(
v
vfv (3.56)
modes Odd)cos(
modesEven )sin()(
v
vgv (3.57)
Finally, the eigenvalue equation for a step-index circular fiber depends on the four
modes TM0,m, TE0,m, EHv,m and HEv,m and are described as (m is the root of the
eigenvalue equation):
42
0
'
2
2'''
vmvm
)(
)(
)(
)(
)(
)(
)(
)(
Modes
HE and EH
UW
V
nk
v
WWK
WK
n
n
UUJ
UJ
WWK
WK
UUJ
UJ
co
v
v
co
cl
v
v
v
v
v
v
(3.58)
modes TE0,m 0)(
)(
)(
)(
0
1
0
1 WWK
WK
UUJ
UJ (3.59)
modes TM 0 ,m 0)(
)(
)(
)(
0
1
2
0
1
2
WWK
WK
W
n
UUJ
UJ
U
n clco (3.60)

Models and methodology
33
where 𝑉 = (𝑈2 + 𝑊2)1/2 is the waveguide parameter, '
vJ and '
vK are the derivate of
the Bessel function of the first kind and of the modified Bessel function of the second kind, respectively.
In these two-last sections we described eigenmodes for the step-profile planar
waveguide and the step-profile circular waveguide, composed by the core and the
cladding. The same technique can be used when, the step-profile planar waveguide is
composed of metallic material, the exclusive difference being the complex component
of the refractive index of the metal, as shown in Figure 3.5.
Figure 3.5 Numerical solution of the eigenvalue equation in a step-profile planar composed of gold (Au)
and step fiber circular composed of the core (GeO2-SiO2) and the cladding (SiO2).
Figure 3.5 shows the numerical solution of the eigenvalue equation in a step-profile
planar composed of gold (Au) and two external refractive indices. Also, Figure 3.5
shows the numerical solution of the eigenvalue equation in a circular fiber composed
of the core (GeO2-SiO2) and the cladding (SiO2).
3.4 Surface plasmon resonance (SPR)
In this section, we describe the theory of surface plasmon polariton, the
importance in the dielectric metal interface, and the types of SPR-based optical fibers
sensors.
3.4.1 Theory of the surface plasmon polariton (SPP)
A plasmon is defined as a (quasi-particle) field resulting from oscillations of the
free electrons in a medium. The excitation of the surface plasmon polaritons (SPP) [1]
results from the coupling of the electromagnetic waves with the oscillations of the
free electrons of the metal on the surface between the metal and the external
dielectric medium, as shown in Figure 3.6. When the excitation is produced optically
the effect is known as SPR [1], [2].
As shown in Figure 3.6a, only modes with TM polarization or modes with an electric
field parallel to the metal surface can delocalize electrical charges and then form

Models and methodology
34
localized charge distributions, and obtain the SPR. In Figure 3.6b it can be observed
that the maximum amplitude of the field occurs at the interface between the metal
layer and the dielectric layer and decays exponentially on both sides of the metal and
of the dielectric.
(a)
(b)
Figure 3.6 Surface plasmon is propagated along the interface between the metal and the dielectric, where εm is the permittivity of the metal, εd is the permittivity of the dielectric and the penetration
field in each element is given as δd and δm, for the dielectric and metal, respectively. (a) Lines of the electric field and (b) distribution of electric, Ex and magnetic, Hy, fields, respectively [1].
From equation 3.23 it can be concluded that the plasmon frequency 𝜔𝑝 is a cutoff
frequency below which the light wave vector becomes imaginary, indicating that light
cannot propagate in the medium. Instead, the light that strikes the surface of the
metal is fully reflected, and the electromagnetic field can only penetrate the metal
to a small depth. In simple words, below 𝜔𝑝, metal charges can oscillate with the field,
radiating a secondary electromagnetic field, which cancels the incident wave. This
effect results in a strong coupling between the oscillation of the plasmon and the
electromagnetic field, which results in an excitation, known as the surface plasmon
resonance [67], [93]. Above 𝜔𝑝, the charges move very slowly, unable to keep up with
the oscillations of the field and cannot cancel it.
3.4.2 Planar waveguide in a metal and dielectric external interface
As described in the section 3.3.3 for a planar waveguide with core and cladding,
we can do the same for interface metal/dielectric (M/D) where the refractive index
of the material n takes either the value of the metal mn or of the external dielectric
dn .
The most simple geometry sustaining SPPs is that of a single interface (Figure 3.6)
between a dielectric, non-absorbing half space (x > 0) with positive real dielectric
constant d and an adjacent conducting half space (x < 0) described via a dielectric
function )(m . The requirement of metallic character implies that Re[ )(m ] < 0.
For metals this condition is fulfilled at frequencies below the bulk plasmon frequency
𝜔𝑝. We want to look for propagating wave solutions confined to the interface, i.e. with
evanescent decay in the perpendicular x-direction.
Considering Figure 3.6, using the equations from 3.42 to equation 3.45 and
considering only the TM solution, we obtain the equations for both regions of the study
[94]. For x > 0:
xkjAxe dz exp)( (3.61)

Models and methodology
35
)exp()(0
0
2
xkzjk
njAxh d
d
dy
(3.62)
)exp()( xkzjk
jAxe d
d
x
(3.63)
and for x < 0:
xkzjBxe mz exp)( (3.64)
)exp()(0
0
2
xkzjk
njAxh m
m
m
y
(3.65)
xkzjk
jAxe m
m
x
exp)( (3.66)
where mmm pknk 2
0
22 and ddd pknk 2
0
22 are the SPP
parameters in the metal and external dielectric, respectively. Continuity of the axial
electric field at the M/D interface and of the magnetic field parallel to the y-direction
gives A = B and:
2
2
m
d
m
d
n
n
k
k (3.67)
Solving this condition for the propagation constant of the metal, mk , and external
dielectric, Dk , which have the dispersion relation of SPPs propagating at the interface
between the two half spaces [94], such as:
22
22
0
dm
dmsp
nn
nnkk
(3.68)
This equation is also called the propagation constant of the surface plasmon ( spk )
at the interface M/D.
The same solution of the TM mode can be applied for the TE mode as shown in [94],
but on continuity of the electric field, parallel to the y direction and of the magnetic
field parallel to the z-direction at the M/D interface, leads to the condition:
0 dm kkA (3.69)
Since confinement to the surface requires Re [mk ] > 0 and
dk > 0, this condition
is only fulfilled if A = 0, so that A = B = 0. Thus, no surface modes exist for TE
polarization. Surface plasmon polaritons only exist for TM polarization [94].
The physical parameters of the metals such as plasma frequency p (equation
3.23) and propagation constant of the plasma spk cannot be altered. However, from
the point of view of sensor design, it is possible to optimize sensor performance by
altering the thickness of the metal or by combining different layers of metals and
dielectrics. This can be used to control the nature of the plasmon modes obtained in

Models and methodology
36
each interface and their mutual interaction, and in the process customize the sensor
response.
3.4.3 Fiber optics sensors based on surface plasmon resonance
The technology evolution began with the Otto and Kretschmann configurations
[15], based on a simple prism with a metal layer (gold), and becoming more complex,
when including configurations based on: D-type fibers [45], cladding-off fibers [58],
end-reflection mirrors [95], tapered fibers [96], photonic crystal fibers [97], fiber
Bragg gratings [98], among others. More recently, the development of new fabrication
techniques, capable of providing micro and nanoscale metallic structures, have paved
the way to the development of new devices that use the localization of surface
plasmons to better control their properties and achieve higher sensing performances.
These approaches include metamaterials [99], nano and micro structures with
different sizes and forms [100], and their combination with other materials, in a
myriad of optical devices, including optical fibers [101]. The performance of these
devices based on metallic sub-micron structures depends strongly on the fine control
and optimization of geometrical parameters such as the dimensions or relative
positions of the components, thus promoting numerical simulations as the preferred
method to explore new sensor designs and reduce time and development costs [20],
[97].
Today, fabrication techniques offer many geometries for the metal components,
ranging from wires and disks to spheres and grooved surfaces, which can be used to
customize the modal dispersion of the plasmons and increase their coupling with light.
In particular, it is possible to couple the modes of a step-index fiber with those of a
metallic wire at certain wavelengths, when some of these modes become phase
matched. Also, metallic wires support multiple modes which permit an increased
number of resonant peaks [102], and result in sensors with different values of
sensitivity, operation wavelength and RI detection range, among others [55], [103].
Some new fabrication techniques (like spliced-fiber with pressure-filling [104], stack-
and-draw technique [105] or pressure assisted melt filling (PAMF) [106] increased the
possibility of the creation of new configurations with more complex geometries
allowed to produce virtually any nano-structure on an optical fiber [28], [107].
The fiber-based SPR sensors have a configuration like that of the Otto and
Kretschmann configurations, as shown in Figure 2.3. A simplistic way of creating this
sensor is to replace the prism with an optical fiber where the cladding is removed
through a chemical method [29]. The purpose of eliminating or reducing the cladding
is to make the electromagnetic field interact more efficiently with the metal and with
the external environment, allowing the evanescent field to propagate to the external
medium with greater intensity. The condition of the SPR is when:
zco
dm
dmsp knk
)sin(
22
(3.70)
In sections 3.3 we explained a numerical solution to the planar and circular step
waveguide. From equation 3.70 and the Figure 3.5 we can conclude that the point of
intersection between the solution of the optical fiber and the solution of the two-

Models and methodology
37
planar waveguides based in Au and two external refractive indices (1.34 and 1.38). As
shown in Figure 2.4, a small variation of the external refractive index and the SPR
effect will imply a variation of the wavelength relative to an external reference
refractive index. Then the sensitivity (S) and the resolution (R) can be calculated with
the following equations [28]:
ext
peak
nS
)( (3.71)
,)(
1)(
peak
min
minextn
SR
(3.72)
where λmin is the minimum value in wavelength between two spectral lines that can
be experimentally detected and Δλpeak is the shift in wavelength of the resonance peak
obtained from the simulations for different values of external refractive index (next).
In this thesis, we assume that it is possible to detect experimentally a spectral variation of
0.1 nm (λmin) [108].
3.5 Finite element method (FEM)
In subsection 3.4.3 it was explained some of the main configurations of the optical
fiber sensor based in the SPR. Because of the different types of optical fibers and
associated SPR sensor configurations, their actual construction and testing is very
costly and time consuming, making simulation programs important tools to obtain a
first and fast approximation of the final sensor behavior. The eigenvalue equation
explained in sections 3.3 can be a first approximation, but the usual numerical analysis
methods are: the expansion and propagation method (MPE) [7], the method for
multilayer structure transfer matrix modeling [8], the optical fiber multilayer
cylindrical structure [9] and the rigorous couple wave analysis (RCWA) [10]. However,
these methods have some difficulties for arrangements with nanostructured
irregularities [11].
The full analysis of an optical fiber sensor based in SPR may combine the study of
multiple modes inside the fiber [109], multiple modes in metallic wires [97], and
simultaneous sensing of the external refractive index and temperature [107] [110],
which may result in a complex study with multiple nanostructures, modes and
materials. However, for many realistic device designs, it is difficult to compute the
hybridization mode by ordinary analytical techniques. Thus, numerical schemes must
be used to optimize those optical devices. For that, the need of more complex
simulation tools using finite difference time domain (FDTD) and finite element
methods (FEM) are crucial [12].
The advantage of using numerical methods of analysis is that they allow solving
problems where the geometry of the structure is important whether it is micro- or
nanostructured. In these cases, the planar method cannot be used, or is not a good
approximation. On the other hand, numerical methods of analysis make it possible to
carry out studies of the intensity of the electric and magnetic fields throughout the
structure, to have a graphical environment, 3D simulations, among other advantages.

Models and methodology
38
The disadvantage of this type of system is the high consumption of computing memory,
which leads to a high processing time.
FDTD consists of solving partial differential equations in the time domain, being
easier to understand and it is a more commonly used method to solve basic problems.
For example, for simple structures, FDTD is easier to implement than FEM. The
calculation of the partial differential equations (PDEs) using FEM is based on the
construction of sub-elements within the structure to be studied (mesh). In this
structure, the calculations of the field equations are represented discreetly in a system
of algebraic equations and are solved by an eigenvalue method. The FEM are usually
used when it is necessary to vary the resolution by which the field is described over
different regions of the simulation box, since other methods (such as FTDT) would
render the computational problem too large. The drawback in using the FEM is that to
obtain a smaller computational problem, the method to reduce the PDEs to a system
of algebraic equations is much more complex.
The study, calculation and implementation of the FEM was carried out in COMSOL
Multiphysics and we completed the study using MatLab as an interface and for quick
calculation, as shown in Figure 3.7. This figure represents a basic schematic of the
computational approach used in this work.
The MatLab starts the simulation defining the design we want to study. COMSOL
Multiphysics allows the design of the different components in different dimensions:
3D, 2D and 1D, symmetric or asymmetric, to reduce the number and size of the
elements (mesh). In this work, the design was conducted in 2D, due to the high
processing time required to use 3D. Then, we select and choose the parameters we
want to study in the design, for example, the size of the core, the cladding, the metal
type and shape, the type of overlayer, among others.
COMSOL Multiphysics has multiples modules with different tools for each module.
In this work, we used the RF module, the physics module called electromagnetic waves
frequency domain. This module allows the study of radio frequency comprising
physical parameters for the study of high frequency magnetic and electric fields,
Poynting vector, parameters of the materials, among others, using Maxwell's
equations. The wave equation used by COMSOL Multiphysics is represented in equation
3.15, when the electric displacement field is based on the model of the relative
permittivity. But in section 3.2 we demonstrated the equation can be written as a
function of the refractive index 0,0,~ 22 rr nikn (and equation 3.15 is
written then:
0),(),(~),( 22
0 rErrE nk (3.73)
Also, in COMSOL it is possible to define the different optical properties of the
materials like the electric component (permittivity), magnetic component
(permeability), dispersion, and conductivity. These properties can be defined through
a equation defined by the user, using the models predefined by the program (Lorentz
and Drude) or using materials predefined in COMSOL.
Finally, a good choice of mesh is critical in FEM since it determines the quality of
theresults of the simulation, and many times it is necessary to repeat the simulations
to adjust the mesh. A good approach is to use smaller elements in regions where the

Models and methodology
39
fields have a sharper variation. On the other hand, a smother variation of the field can
be sampled by larges elements.
Figure 3.7 Basic scheme of computational simulations used in this work.

Models and methodology
40
In short, the quality and validity of the numerical results is strongly dependent on
the mesh used. The choice depends on the balance of two factors:
1. Reduction of the numerical error due to rounding and respective propagation
during the calculation, which is obtained for meshes with fewer elements and,
consequently reduces the number of calculations in the simulations.
2. Reduction of methodological error associated with the finite element method,
which is achieved using more samples of the field, which requires grids with
more elements. However, there are drawbacks to choosing meshes with many
elements as this increases the complexity of simulations, requiring more
computational resources and more time to perform calculations.
The balance between these two sources of error (numerical and methodological) is
achieved by selecting grids where there is a denser sampling of the field (smaller finite
elements) in areas where the field has larger variations and lowering the sampling in
areas where field is approximately constant or zero.
We computed the model in COMSOL and obtained several preliminary solutions.
These initial solutions are then exported to MatLab where we have automatized the
program to find the more thorough solutions, by solving the mathematical problem
defined between equations 3.31 to 3.70 in the sections 3.3 and 3.4. If the solution
cannot be found, we redefine the initial condition and compute again in COMSOL. If
we find the correct solution or mode, we save the information and increment the value
of the wavelength. The new initial approximation is calculated using Newton’s
method, a mathematical technique to approximate solutions for non-linear equations
and systems of equations. We repeat this process until we obtain the results as function
of the wavelength.

41
Chapter 4 Singlemode sensors with thin metal films
The previous chapters reviewed the fundamental physical principles and models
that support the operation of SPR sensors and summarized the main sensor
configurations, including their structure and components, as well as their applications
and methods of detection. Although the basic physical principles behind the SPR
phenomenon are well understood, their optimization towards better sensing designs is
not trivial, specially in sensors with complex structures, combining components with
different types of materials, in particular if one wishes to consider realistic models of
their optical properties. For example, real metals and dielectrics are described by
complex dispersion and absorption curves over the wavelength operation range of the
sensors. This imposes the use of numerical methods of analysis to compute the optical
and plasmonic modes supported by the sensors and their impact on sensor
performance.
In this chapter we use a computer model based on FEM implemented in COMSOL
Multiphysics to simulate and optimize the operation and performance of different SPR
sensor configurations based on single mode D-type fibers with thin metal films. This
model incorporates most of the phenomenological aspects and reproduces the results
described in literature. In particular, we verify the fundamental physical principles
behind SPR, from the conditions for the occurrence of SPR, the behavior of the electric
and magnetic fields, to the distribution of the Poynting vector in the interface between
the dielectric and the metal, among others. We also study the different parameters
that affect the performance of SPR optical fiber sensors, with particular emphasis to
the thickness of the metal film and other material layers, and the relative position of
the components of the sensor.
This chapter is also focused on improving the performance of one of the sensor
configurations most commonly described in the literature, namely SPR sensors based
on single mode D-type fibers with thin metal films, by incorporating a distribution of
holes in the structure of the fiber that promotes the interaction between the single
guided mode in the core of the fiber with the plasmon modes supported by the metal
film. This distribution of holes can operate as a scattering structure that enhances the
optical intensity on the metal, or even forms a photonic crystal that traps light at the
center of the fibre (the fibre is in fact a D-type PCF), allowing this light only to escape
in the direction of the metal film. We consider the enhancements in sensitivity, in the
resolution, in loss and in operational wavelength range of the sensors. This
configuration establishes a reference to the following chapters, where we present

Singlemode sensors with thin metal films
42
other variations of this basic sensor by exploring other degrees of freedom in sensor
design.
4.1 SPR sensor based on conventional D-type fiber
The conventional D-type fiber sensor is one of the many configurations studied in
literature, with multiple applications including gas detection [111], curvature sensing
[112], temperature and refractive measurement [113]. These sensors are based on a
fiber that is highly birefringent, where the linear polarization states are structurally
maintained [44] and the detection of the external medium refractive index is based
on its interaction with the evanescent field of the light that travels in the optical fiber
[113]. These characteristics of the D-type fiber are very interesting for sensing and
they can be even further optimized when combined with SPR. The combination of
these technologies results in refractive index sensors with a sensitivity of 1×10- 7, much
higher than the refractive index sensor configuration that uses only the D-type fiber
[19]. Moreover, the SPR D-type fiber sensor has been also implemented as a biosensor
[114], [115].
4.1.1 Numerical mode analysis
In order to optimize the SPR D-type fiber sensor, it is crucial to fully characterize
the behavior of light inside the waveguide and its interactions with the metal film that
create the SPR phenomenon. As described earlier in this thesis, we developed models
based on the finite element method which is described in section 3.5. The considered
sensing configuration studied in this work, are shown in Figure 4.1. Figure 4.1
illustrates the configuration of the conventional D-type optical fiber with a metal film
deposited on the flat D-type fiber surface. The analysis of this structure as a SPR fiber
sensor is one of the most commonly studied in the literature [1].
Figure 4.1 Schematic of the SPR D-type sensor. The fiber is composed by two refractive indexes (core - nco and cladding - ncl) then a metallic layer is deposited with thickness dm and refractive index nm, at a
distance d of the center of the fiber, for the measurement of the external refractive index next.

Singlemode sensors with thin metal films
43
The fiber is formed by a core and a cladding with refractive indexes, nco and ncl,
respectively. The fiber has a D-type profile, where a metallic layer, with a refractive
index nm deposited in the horizontal surface. It is assumed that the space outside the
fiber is filled with the analyte medium to be studied, having a refractive index of next.
The distance between the center of the fiber and the gold layer is denoted by d
(residual cladding) and the thickness of the gold layer by dm. The refractive indexes of
the dielectric materials were alculated using the Sellmeier equation 3.25, whereas
that of the metal was obtained from the Drude model (equation 3.27).
The next step was the creation of the mesh, which basically consists in dividing the
simulation domain into smaller subdomains; as shown in Figure 4.2. The subdomains
have different sizes and are smaller near the interfaces between different media, to
account for steeper variations of the electromagnetic field. The field equations were
then discretized into an algebraic system of equations and solved for their
characteristic eigenvalues.
The numerical mode analysis provided by COMSOL allows us to find the solution of
the eigenvalues for our configuration, through the definition of the wavelength,
number of modes and initial approximation. The initial distribution of the field used
by COMSOL to iterate the solution of the problem is set to be identical to the
fundamental mode, calculated analytically for the fundamental mode of the core of
the fiber.
Figure 4.2 Structure of the finite elements in COMSOL for a D-type optical fiber with a metallic layer
for SPR. The elements are smaller in the metallic layer and in the core.
In Erro! A origem da referência não foi encontrada. we studied the calculation
of the modes in isolated waveguides. However, SPR sensors combine several of these
waveguides integrated in the structure of an optical fiber. Therefore, it is necessary
to understand how the modes supported by the different waveguides couple and
determine the optical response of the sensor. The strongest coupling occurs when the
dispersion curves of the different waveguides cross, as shown in Figure 4.3. At these
crossing points, occurs a strong hybridization of these modes, resulting in the so called
supermodes (SMs). An approximated method of calculating the supermodes can be
found in reference [116].This approximation is poor because it does not consider how

Singlemode sensors with thin metal films
44
these waveguides are integrated in the overall structure of the optical fiber and how
the latter influences the coupling between the modes. In Figure 4.3b we show the
results of the loss curves, resulting from the hybridization of the modes whose
dispersion curves are described in Figure 4.3a. By changing the external refractive
index, the crossing point of the two dispersion curves changes, thus, shifting the
maximum loss peak in wavelength, as shown in Figure 4.3b.
These SMs can be also calculated more accurately using COMSOL, but with and
increase of the time of computation and calculation complexity, in comparison with
the method referred in section 3.3. The calculation of the properties of the SM using
COMSOL are also shown in Figure 4.3, but for this case are practically indistinguishable
from the results using the previous method.
Figure 4.4 illustrates the intensity of the Poynting vector using the study Mode
Analyses from COMSOL, for the structure of Figure 4.1, considering a metallic layer,
in this case a 45 nm thickness gold layer and the mesh of Figure 4.2 with no resonance
(Figure 4.4a)) and in resonance (Figure 4.4b)). The study allows confirmation of the
single-mode behavior propagation in the optical fiber in the interaction with the
metal. Also, these figures allowed to observe some of the conditions of the SPR, for
example, the coupling between the fundamental mode of the fiber and the metal
mode, which is denoted by the loss of light in the center of the core. The maximum
intensity on the center of the core goes from 372 Wm−2 (Figure 4.4a) to 158 Wm−2
(Figure 4.4b), while at the same time is observed an increment of the light energy in
the interface between the metal and the external medium.
Another important parameter for the SPR is the polarization. SPR occurs when the
electric field is perpendicular to the surface of the metal or the magnetic field is
parallel to the surface of the metal (TM modes). The blue lines indicate the
polarization and we verified that the TM mode, in fact, produced the SPR and not the
TE mode.

Singlemode sensors with thin metal films
45
(a)
(b)
Figure 4.3 (a) Refractive index as function of the wavelength of the modes when considering insolated waveguides for the fundamental mode fiber type D (solid black) and for the plasmonic mode in the
interface Au and next = 1.34 and next = 1.38 (dashed red). The found SMs are represented in dot-dashed blue and dot-two-dashed, respectively. (b) Attenuation in function of the wavelength for the SMs with
different external refractive indexes. The thickness of the gold is dm = 45 nm.

Singlemode sensors with thin metal films
46
(a) (b)
Figure 4.4 Poynting vector distributions in 2D near of the fiber core and the interface metal, with a thickness of metal dm = 45 nm and an external refractive index next = 1.34. The blue lines indicate the
transverse electric field ex and ey. (a) No resonance = 500 nm. (b) Resonance = 630 nm.
Another tool of COMSOL permits the study of the field across the transversal
section. For example, we can do the study of the normalized 1D Poynting vector
amplitude across the fiber core, as shown in Figure 4.5, for different wavelengths.
Figure 4.5 Normalized Poynting vector amplitude along a cutline across the fiber core for different values of the wavelength, with the thickness of metal dm = 45 nm and external refractive index
next = 1.34.
Comparing the curves, it is possible to see the intensity of the light in the external
medium is stronger when the wavelength is close to the resonance peak (around
630 nm). We also observed that the intensity of the light inside of the metal is 0 for
all wavelengths and for that wavelengths close to the resonance, the maximum of the
Poynting vector occurs in the interface between the metal and the external medium.
We also verified that the mode propagating in the center of the fiber corresponds to
the fundamental mode. These conditions have also been verified in each simulation
(each wavelength) using MatLAb and confirmed by Figure 4.4 and Figure 4.5.

Singlemode sensors with thin metal films
47
4.1.2 Algorithm using Fresnel laws
To confirm that the method works properly, it was compare with the results
obtained in reference [46] which employed the method for multilayer structure
transfer matrix modeling, based on Fresnel equations applied to the structure of Figure
4.1, allowing the transmission intensity to be written (for four layers) as:
)tan(/
1234
crLrT (4.1)
where 1234r is the reflective coefficients for four layers, which and can be written as:
dkjrr
dkjrrr
223412
2234121234
2exp1
2exp
(4.2)
where the reflective coefficients for three layers and two layers are, respectively:
dkjrr
dkjrrr
33423
33423234
2exp1
2exp
(4.3)
jjii
jjii
ijknkn
knknr
22
22
(4.4)
and where 𝑘𝑖 is the component of the wave vector on the interface of the two layers
of the sensor in the direction 𝑧 and is given as 𝑘𝑖 = 𝑘0(𝑛𝑖2 − 𝑛1 sin2 𝜃)
1/2 , where 𝑛1,
𝑛2, 𝑛3 and 𝑛4 represent the refractive index of the core, cladding, metal and external
test medium, respectively.
Equation 3.36 can be written as function of the transmission (T) as
LT exp (4.5)
Applying the equations 4.1, 4.5 and considering L = 1mm it is possible to obtain the
results by the two different methods, as shown in Figure 4.6. The behavior of the two
methods is similar, with the difference in the transmission coefficients and a small
shift in the wavelength dips. We attribute this difference to the fact that in the method
based in the Fresnel equations are only considered planar waves in a fairly symmetrical
arrangement. On the other hand, when using FEM, we consider the D-type fiber as a
non-symmetrical cylindrical waveguide, being able to model the inhomogeneous
optical regions with a resolution of the cell size, resulting in a more accurate outcome.
In terms of the results and in what concerns the material thickness, the optimal point
is when a layer of 55 to 65 nm is used.

Singlemode sensors with thin metal films
48
Figure 4.6 Transmission (T) as a function of wavelength for a SPR D-type fiber by two methods: The
Fresnel method (solid line) and using the FEM method (dash line) with different thicknesses of the gold
(Au), d = 4.0 µm, next = 1.392 and = 88.85º.
Tailoring the simulation analysis in COMSOL, it is possible to optimize the
sensitivity, transmission coefficient dip, wavelength operation area, amongst others
for a refractive index D-type fiber optic SPR sensor. To decrease the depth of the
transmission coefficient dip, and consequently lowering the sensitivity of the external
medium, d can be increased, as is shown in Figure 4.7.
Figure 4.7 Simulation of the transmission coefficient of the sensor, for different distances between the center of the core and the metal (d). In this simulation, the thickness of the gold layer is 65 nm and the
refractive index of the external environment is 1.392.
From Figure 4.6 it is possible to have an SPR sensor that works in an operation area
near 830 nm, for a metal thickness of 65 nm (Au). Finally, to understand the efficiency
of the sensor we study the behavior of the SPR sensor for two different external
refractive indexes, as shown in Figure 4.8.

Singlemode sensors with thin metal films
49
Figure 4.8 Transmission as function of wavelength for two values of external refractive index, where d = 4.0 µm and dm = 65 nm.
In this way we can calculate the sensor sensitivity, /RIU, through equation 3.71
as a function of the different refractive indexes of the external environment, and
compare the method with the results found in the literature. The resulting sensitivity
of 2542 nm/RIU is close to the sensitivity of 3150 nm/RIU found in [68] with an
overlayer of tantalum pentoxide (Ta2O5).
In case another operation wavelength is required, one possible solution is to apply
an additional layer of a dielectric with a high refractive index, such as tantalum
pentoxide (Ta2O5) [1], [68] whose simulation results can be seen in Figure 4.9 and
compared with the results presented in reference [68]. For different thicknesses of
Ta2O5 (dov), the transmission coefficient dip of the sensor is not significantly altered,
being possible to tailor the sensor operation wavelength [68]. We also observe from
Figure 4.9 that for next = 1.329 with a overlayer thickness dov = 25 nm. The wavelength
of the operation is in the 850 nm region, where in Figure 4.6 the SPR sensor with the
same thickness of the metal (dm = 65 nm) but without overlayer the wavelength of the
operation was 820 nm, but with a higher external refractive index (1.392).

Singlemode sensors with thin metal films
50
Figure 4.9 Simulation of the transmission coefficient T of the sensor for different thicknesses of the
dielectric (Ta2O5). The thickness of gold is 65 nm and next = 1.329
The Ta2O5 overlayer allows us to shift the operation wavelength of the sensor, as
shown in Figure 4.9. In order to study the sensitivity of the sensor with this overlayer,
Figure 4.10 shows the variation of the transmission as a function of wavelength for
different external refractive indexes.
Figure 4.10 Transmission coefficient T of the sensor with different dielectric (Ta2O5) thickness
dov = 20 nm. The thickness of gold is 65 nm.
From Figure 4.10 and equations 3.71 and 3.72, we can calculate the sensitivity and
resolution of the sensor, as shown in Table 4.1. The usage of the Ta2O5 overlayer not
only produces a shift to higher operation wavelengths in the sensor, it also produces
an improvement in the sensitivity. This sensitivity is close to the obtained in [68].

Singlemode sensors with thin metal films
51
Table 4.1 Sensitivity, resolution and wavelength operation range values for the refractive index SPR optical fiber sensor based on conventional D-type fiber with an overlayer of Ta2O5 with a thickness of
20 nm.
Sensitivity (nm/RIU) Resolution (RIU) Range λ (nm)
Range of next Overlayer Ta2O5 dov = 20 nm
[1.320,1.343] 2.652×10³ 3.770×10⁻⁵ 778-840
[1.343,1.367] 3.913×10³ 2.556×10⁻⁵ 840-930
[1.367,1.390] 6.783×10³ 1.474×10⁻⁵ 930-1068
In Figure 4.6 the two simulations, one with COMSOL and the other with Fresnel's
equations, present a similar behavior. Also, the simulation in COMSOL has the ability
to model inhomogeneous optical regions with a resolution of the cell size and allows
the analysis of other parameters such as the intensity of magnetic and electric fields
across the structure [117]. On top of that, COMSOL permits in a graphical environment
more accurate and realistic results than traditional approaches, although at the
expense of longer running times.
Thus, we can use COMSOL to improve the performance of a refractive index SPR D-
type optical fiber sensor, where the characteristics of the material layers, in terms of
type and thickness, and the residual fiber cladding thickness can be optimized, as
shown in the following section.
4.2 Optimization of the microstructured D-type fiber sensor based in SPR
The geometry of the SPR sensors in optical fibers is more complex than the Otto
and Kretschmann configurations [1] where a beam of light is focused directly on the
thin metal layer. Instead the distribution of light inside the fiber depends on the
optical modes allowed by the shape and dimensions of the fiber, which do not
necessarily provide higher intensities on the metal layer and strong excitation of the
surface plasmon. As a result, the sensitivity of the sensor is far from optimal. So far,
most of the studies or optimization of SPR sensors in optical fibers rely on geometrical
optics and use a model based on transference matrices, developed for multilayer
planar sensors [71], and are mainly concerned with the fine tuning of the resonance
frequency of the plasmon to the operational frequency or wavelength of the device by
optimizing the metal thickness and adding supporting layers. As we have shown in [45],
this approach has strong limitations since it does not take into account the modal
structure of the fiber, and consequently the intensity profile that actually reaches the
metallic layer. As a result, using the transference matrix approach, there is an
overestimating assumption that all the light shines on the metal surface, and also it
disregards how a particular fiber mode adjusts to the presence of that layer.
Empirically, we can expect a sensor to be more sensitive if, at the resonance frequency
of the plasmons, most of the light inside the fiber can be tunneled through the metal

Singlemode sensors with thin metal films
52
into the exterior medium. In principle this can be achieved not only by adjusting the
geometry and constitution of the multilayers that separate the core and the exterior,
but also by introducing structures inside the fiber that scatter the light and change
the spatial structure of the modes towards the exterior of the fiber.
In this section, we present two new microstructured D-type fiber configurations for
refractive index measurement based on SPR. The two new fiber configurations aim to
increase the electromagnetic field in the sensing zone and therefore the sensitivity of
the sensor in relation to variations of the refractive index of the external medium.
4.2.1 Triangular and parabolic SPR D-type fiber sensor
The conventional D-type fiber was compared with the two new configurations
(Figure 4.11a and Figure 4.11b). The conventional D-type fiber is based on a
singlemode configuration (rco = 4.0 µm and rcl = 62.5 µm) where the cut of the fiber is
placed at d = 4.0 µm, the index of refraction of the core is nco = 1.450 and for the
cladding is ncl = 1.442. The thickness of the metal is dm = 65 nm. The holes in the new
configurations have the goal to create an optical mirror that reflects the light into the
external medium. In the first new configuration, the cladding holes of the
microstructured D-type fiber are placed in a triangular arrangement, while in the
second configuration, they are placed in a parabolic arrangement (Figure 4.11a and b,
respectively).
(a) (b) Figure 4.11 D-type optical fiber (a) holes in a triangular configuration and (b) holes in a parabolic
configuration.
Using Equation 3.73 with the FEM in a defined structure, we can obtain the field
equations, which are discretized into an algebraic system of equations and then solved
for their characteristic eigenvalues. To determine the optical performance of the two
new proposed configurations, the electric field intensity in the external medium is
evaluated, as shown in Figure 4.12.

Singlemode sensors with thin metal films
53
(a)
(b) (c) Figure 4.12 (a) Intensity of the electric field Ez in 2D (V/μm) with λ = 300 nm, dm = 65 nm and
next = 1.37. (b) and (c) Zoom of the core of the intensity of the electric field Ez in 2D (V/μm) with: (b) λ = 300 nm, no SPR present and (c) λ = 660 nm, with SPR.
Figure 4.12a shows the intensity of the electric field z (𝐸𝑧) in 2D for the parabolic
configuration, without SPR ( = 300 nm). In Figure 4.12b, also for the case without SPR
( = 300 nm), a zoom of the intensity of electric field in the fiber core shows the
electric field is concentrated in the core and vanishes quickly in the external medium.
In the case of Figure 4.12c, where SPR occurs ( = 650 nm), the core zoom shows that
the maximum of the intensity of electric field occurs in the transition metal-dielectric
(M/D) and the energy is concentrated in the interface of the metal-dielectric and on
the external medium. These results clearly show the physical effect of the SPR in an
optical fiber, where at specific resonant wavelengths, dependent on the refractive
index of the external medium, the metallic film becomes in practice transparent, as
light is tunneled from the core to the exterior, thus increasing dramatically the losses
of the fiber, due to the occurrence of the SPR effect.

Singlemode sensors with thin metal films
54
4.2.2 Microstructured D-type fibers: intensity of electric field and
transmission coefficient
Figure 4.13a presents the intensity of the electric field z (𝐸𝑧) in the following
zones: core, thin metal layer and external medium in 1D dimension, for each
configuration. This figure shows that the maximum of 𝐸𝑧 occurs in the interface M/D
and the intensity in the triangular configuration is stronger in comparison to the other
two configurations (parabolic and conventional D-type optical fibers).
(a)
(b)
Figure 4.13 (a) Intensity of the electric field 𝑬𝒛 in 1D (V/μm) as function of the longitudinal fiber x at λ = 630 nm. (b) Attenuation as a function of wavelength for different external refractive indexes (next),
for three configurations of the SPR sensor, convectional (solid line), parabolic (dashed line) and triangular (dot line), where the dm = 45 nm and d = 4.5 µm.
In this case, instead of using equation 4.5 for calculating the transmission we used
equation 3.36 to calculate the loss in the end of the fiber, as function of the
wavelength, for all configurations, as shown in Figure 4.13b. In all configurations the

Singlemode sensors with thin metal films
55
wavelength that generates the SPR is the same, since the SPR wavelength depends
mainly on the metal type, its thickness and on the refractive index of the external
medium [45]. The intensity of the SPR deep changes for each configuration and the
highest deeps are as expected for the parabolic and triangular configurations. Even
though the effect is small for the configurations tested, this shows that we can fine
tune the intensity of the SPR deep by changing the configuration of the D-type optical
fiber.
The two new microstructured D-type fiber configurations presented higher
intensity of the electric field in the external medium and higher SPR intensity deep
(parabolic and triangular configuration) when compared with the conventional D-type
fiber. These results suggest new fiber configurations that include high refractive index
contrast microstructures, such as holes, provide a way of optimizing the performance
of SPR sensors based on optical fibers.
4.2.3 Microstructured D-type fibers: optimization of the parameters
of the SPR
A new configuration of fiber optical based in SPR can be realized and optimized,
being, therefore, necessary to perform a set of simulations. The optimization is carried
out focussing on the type and thickness of metal, the distance between the core and
the metal (residual cladding), the utilization of an overlayer with high refractive index,
the wavelength range of detection of the sensor, among others.
This subsection considers that the metal of the film is gold, because this material
is typically associated with the best sensitivity [71]. The optimization of the thickness
of the metal is performed, as shown in Figure 4.14. In terms of the results and in what
concerns the material thickness, the optimal point obtained by the simulation is when
a layer of 45 to 65 nm is used, which is normally the value used in literature [23]. From
Figure 4.14 we expect some variation in the sensitivity of the SPR sensor because each
thickness of the metal occurs in different intensity and wavelength.
Figure 4.14 Attenuation as a function of wavelength for different thicknesses of gold (Au) and for
three configurations of the SPR sensor, conventional (solid line), parabolic (dashed line) and triangular (dot line) where next = 1.38 and d = 4.5µm.

Singlemode sensors with thin metal films
56
The thickness of the metal is not considered in the optimization of the intensity of
the loss in our SPR sensor, because the thickness changes the loss intensity and
wavelength, simultaneously. The increase or decrease of the loss intensity without
changing the wavelength can be achieved by changing the residual cladding, d, as is
shown Figure 4.15.
Figure 4.15 Simulation of attenuation as function of the wavelength, for different values of residual cladding, d. In this simulation, only two configurations of the SPR sensor were studied, conventional
(solid line) and parabolic (dashed line) where dm = 45 nm and next = 1.38.
From Figure 4.14 and Figure 4.15 it is possible to optimize a sensor that works for
a wavelength operation near 660 nm and a metal thickness of 45 nm (Au), and choose
the appropriate residual cladding.
In case another wavelength operation range is required, one possible solution is to
apply an additional layer of a dielectric with a high refractive index, such as tantalum
pentoxide (Ta2O5) [68], [69], as shown in Figure 4.10.
4.3 PCF D-type sensor based in SPR.
4.3.1 Introduction of photonic crystal fibers
Another kind of SPR sensing configuration is based on photonic crystal fibers (PCFs).
While in the last section the refractive index contrast between the core and the
cladding results from a different doping of the silica, in PCF fibers there is no doping
and the contrast in refractive index between core and cladding results from the lower
refractive index of the cladding due to the presence of an array of air holes. Therefore,
these fibers are composed of a periodic array of air holes which surround a material,
normally SiO2, running along the entire length of the fiber and confining light in the
core (Figure 4.16). The array is characterized by the pitch, denoted by Λ, (center to
center distance between the holes) and the hole diameter dhole. The guiding
mechanism is a modified form of total internal reflection resulting from the strong
index contrast between silica and the holey cladding. They have extraordinary-index

Singlemode sensors with thin metal films
57
fiber properties compared to conventional step optical fibers, such as endless single-
mode operation, unusual chromatic dispersion, high birefringence, high or low non-
linearity, among others. It can be shown numerically that endlessly single mode (ESM)
guidance occurs when the geometry of the holey array satisfies the relation [118]:
4.0
d (4.6)
Additionally, the optical properties of silica-air PCFs are determined by the
position, size, and shape of the air holes, and can be extended by filling the holes with
materials such as liquid crystals [119] or metals [97], [120] etc., and consequently
have a number of advantages for sensing applications. There are many studies with
different configurations using PCFs and SPR [28], [121].
Examples of optical sensors combining photonic bandgap fiber and PCF with D-type
fibers can be found in references [25], [122]. In the first reference and for the
sensitivity study, the central core is replaced by a hollow core where the light guiding
mechanism is based on an effect called photonic bandgap. For the second reference
and for the sensitivity study, the distance between the metal and the core of the fiber
is analyzed.
In contrast to circular symmetric step-index fibers, the wave equation for PCF
cannot be solved analytically, because of the hexagonal symmetry and the strong
index-contrast between air and silica. Therefore, we have to use numerical techniques
and in the next subsection we show how to apply finite element modeling to compute
the propagation constants and modal field profiles.
4.3.2 Design of photonic crystal fibers
Again for the performance characterization of the SPR PCF D-type sensor we
compare it with the conventional SPR D-type fiber based on a singlemode configuration
(rco = 4 µm) where the edge of the fiber is placed at d = 4.05 µm, the refractive index
of the core is nco = 1.476 and for the cladding is ncl = 1.452, for a wavelength of 900
nm. In the case of the PCF D-type fiber, the configuration is dhole = 1.61 µm, Λ = 2.3
µm ( 4.0/ d , therefore, it is expected to have more than one mode. Although for
these conditions, the PCF supports more than one mode, in this analysis we consider
that only the fundamental mode is excited and leave for the next chapter the features
of SPR sensing with multiples modes.) and d = 3.2 µm. For both fibers the thickness of
the metal is dm = 45 nm, the external refractive index is next = 1.39 and the length of
the sensor is L = 1 mm, as shown in Figure 4.16.

Singlemode sensors with thin metal films
58
Figure 4.16 Schematic of the PCF D-type.
4.3.3 Loss of the conventional and PCF D-type fiber
Using Equation 3.73 we can compute the attenuation through the fiber as a function
of wavelength for the conventional and PCF D-type fiber (Figure 4.17), which is directly
related with the light that is applied to the SPR. The loss peak for the external
refractive index of 1.34 (red curve) occurs at the wavelength 521 nm, with a loss of
4.57 dB/mm and at 550 nm with a loss of the 1.10×10⁻² dB/mm, for conventional and
PCF D-type fiber, respectively. In the conventional D-type fiber, the loss is stronger
and the resonance occurs at lower wavelengths, when compared with the PCF D-type.
Figure 4.17 Attenuation as a function of wavelength for different external refractive indexes for the
conventional (solid line) and PCF (dashed line) D-type. L = 1 mm and dm = 45 nm.
It is interesting to note that in the considered PCF, light is strongly confined in the
center of the fiber, the evanescent field in the external medium is lower than in the

Singlemode sensors with thin metal films
59
conventional D-type, since the electric field that reaches the metal is low, causing
losses to be also low.
4.3.4 Sensitivity and resolution of the two configurations
Figure 4.17 also shows the variation of the attenuation as a function of the
wavelength for different external refractive indexes (next), for the two types of fiber
configurations. The results show a shift to the right in wavelength when the external
refractive index is increased.
Using the results of Figure 4.17 and equation 3.71, we can calculate the sensitivity
of the refractive index sensor, as shown in Table 4.2, which presents the sensitivity
for different values of the external refractive index for the two configurations.
Considering an experimental implementation, where a spectral variation of 0.1 nm can
be accurately detected and using equation 3.72, we can get the corresponding
refractive index sensing resolution as shown in Table 4.2.
Table 4.2 Sensitivity and resolution values for the refractive index optical fiber sensors based on
conventional and on PCF D-type fiber configurations.
Sensitivity (nm/RIU) Resolution (RIU)
Range of next Conventional PCF Conventional PCF
[1.33,1.34] 1.90×10³ 2.00×10³ 5.26×10⁻⁵ 5.00×10⁻⁵
[1.34,1.35] 2.00×10³ 2.40×10³ 5.00×10⁻⁵ 4.17×10⁻⁵
[1.35,1.36] 2.29×10³ 2.90×10³ 4.35×10⁻⁵ 3.45×10⁻⁵
The results from Table 4.2 show that the PFC D-type fiber configuration
demonstrates better results in sensitivity and resolution than the conventional D-type
fiber configuration. Although for the PCF fiber the performance of the sensor yields
better sensitivity and resolution, the level of losses in this fiber is considerably lower
(two orders of magnitude) than the conventional fibre and, therefore, it is harder to
detect the spectral signature of the surface plasmon resonance. On the other hand,
an enhancement of the performance of the studied PCF D-type sensor is expected
when the evanescent field in the metal is increased.
4.4 Proposals of PCF D-type sensors based in SPR.
In this section, we investigate how the removal of some of the holes in the fiber
can be used to increase the intensity of the electromagnetic field near the metal layer,
where the sensing occurs. Through this process it is possible to improve the sensitivity
and resolution of the sensor to variations of the external refractive index. Thus, we
compare the conventional D-type sensor (Figure 4.1) with our enhanced proposal of
the PCF D-type sensor, which is represented in Figure 4.18.

Singlemode sensors with thin metal films
60
Figure 4.18 Design of the enhanced proposal for the PCF D-type sensor based in SPR.
The configuration is similar to the PCF D-type sensor (Figure 4.16), but we removed
two of the holes between the center of the fiber and the metal, to increase the
electromagnetic field present near the metal. The parameters used are the same of
the PCF D-type sensor. The materials are calculated in the same way that they were
studied before.
4.4.1 Loss and distribution of the Poynting vector
Using equation 3.36, we can compute the attenuation through the fiber as a
function of the wavelength for the conventional and for the enhanced PCF D-type, as
shown in Figure 4.19.
Figure 4.19 Attenuation as a function of wavelength for D-type and enhanced D-type fibers. The
configurations had the following parameters: L = 1 mm, next = 1.39 and dm = 45 nm.
In Figure 4.19 the peak in each configuration occurs at the wavelength of 630 nm
with a loss of 4.90 dB/mm and at the wavelength of 842 nm with a loss of 109.11

Singlemode sensors with thin metal films
61
dB/mm, for conventional and enhanced PCF D-type fiber, respectively. The
conventional D-type fiber has a much weaker loss and the resonance occurs in lower
wavelengths when compared with the enhanced PCF D-type fiber.
The two configurations can also be compared in terms of the Poynting vector
distribution. Figure 4.20 shows the Poynting vector, with the arrow indicating the
transverse electric field ex and ey, of the two configurations, for the different values
of wavelength, as shown in Figure 4.19. The loss peaks of the two configurations
correspond to an increase of the optical power transferred from the core to the
external medium, which results from a strong optical tunneling through the metal film.
Although not confirmed by the simulations, these results suggest that the surface
plasmon modes in the film play a role in coupling the guided mode of the fiber to the
exterior [45].
A B C
D E F
Figure 4.20 Normalized Poynting vector distributions, overlayered by an arrow indicating the transverse electric field ex and ey, for the different wavelengths, indicated in Figure 4.19. The upper images are
for the conventional D-type fiber and lower images are for the enhanced PCF D-type.
A study of the normalized Poynting vector along a cutline in the symmetry plane of
the sensor for the fundamental mode of the enhanced PCF D-type fiber is shown in
Figure 4.21. Comparing it with Figure 4.5, it is possible to see that the Poynting vector
intensity in the external medium is stronger using the enhanced PCF D-type fiber, than
in the conventional D-type fiber, at the resonance wavelength (two fold increase).
These results appear to confirm the hypothesis of increase of the optical tunneling
through the metal, since the absence of the two holes in the enhanced PCF D-type
fiber promotes the delocalization of the field inside the fiber towards the metal film.

Singlemode sensors with thin metal films
62
Figure 4.21 Normalized Poynting vector amplitude along a cutline across the fiber core for the
different wavelengths indicated in Figure 4.19 for the enhanced PCF D-type fiber.
Figure 4.22 shows the variation of the attenuation as a function of the wavelength
for different external media (next), for both fiber types. This figure also shows a shift
to the right in wavelength when the external refractive index is increased. Again, the
values of the loss for the enhanced PFC D-type fiber are considerably higher when
compared with conventional D-type fiber, showing a higher interaction of the light
with the external medium.
Figure 4.22 Attenuation as a function of wavelength for different refractive indexes of external
medium for both configurations. The configurations had the following parameters: d = 4.05 μm and d = 3.2 μm for conventional (solid lines) and enhanced PCF D-type (dashed lines), respectively, L = 1
mm and dm = 45 nm.
These results suggest that PCF D-type fibers can be also used as optical sensors for
measuring refractive index of the external medium. Furthermore, the removal of
holes, like in the enhanced PCF D-type fiber, demonstrates that it is possible to
increase the sensing performance by engineering the interaction of the optical modes

Singlemode sensors with thin metal films
63
in the waveguide with surface plasmons of the metallic film, and ultimately the optical
losses of the fiber. Figure 4.22 shows that the enhanced PCF D-type fiber with low
external refractive index produce narrower resonance peaks, an effect which is
especially noticeable for next above 1.38. This puts a lower limit to the next, since above
this value one obtains wide resonance peaks, thus resulting in feeble optical signal and
low signal to noise ratios.
Using the results of Figure 4.22 and equation 3.71 we can calculate the sensitivity
of the refractive index sensor. Table 4.3 shows the sensitivity for different values of
the external refractive index for the two configurations. The results show that the
sensitivity of these types of sensors depends strongly on the range of the external
medium refractive index. The PCF D-type fiber technology demonstrates better results
in the sensitivity than the conventional D-type fiber. When the SPR occurs
concomitantly with an effective refractive index of the guided mode closer to the
external medium, the confinement of light in the fiber decreases even further. As a
result, the SPR effect increases and with it, the overall sensitivity of the sensor. Since
the effective refractive index of the guided mode for the PCF D- type fiber is lower
than for the conventional D-type fiber, it contributes to a higher sensitivity in the
[1.36 - 1.38] RI range. We have repeated the study of the variation of the external
refractive index for dm = 65 nm and obtained similar results in sensitivity with
dm = 45 nm, as shown in Table 4.3. We also observed that the sensitivity of the sensor
changes when we increased the metal thickness. For example in the [1.38, 1.39] RI
range the SPR sensor decreased the sensitivity in 2000 nm/RIU when the thickness of
the metal was increased by 20 nm.
Table 4.3 Sensitivity values for the refractive index optical fiber sensors based on conventional D-type
fiber and on the enhanced PCF D-type sensor
Sensitivity (nm/RIU) Resolution (RIU)
Range of next Conventional PCF -45nm PCF -65nm Conventional PCF -45nm PCF -65nm
[1.36,1.38] 2.40×10³ 5.20×10³ 5.30×10³ 4.20×10⁻⁵ 1.90×10⁻⁵ 1.90×10⁻⁴
[1.38,1.39] 2.80×10³ 10.2×10³ 8.20×10³ 3.60×10⁻⁵ 9.80×10⁻⁶ 1.20×10⁻⁴
In order to analyze the effect of the gold thickness fabrication tolerance, we
increased the gold thickness by 5% (45 nm + 2.25 nm) and found the variation in the
wavelength of the loss peak is Δλ = (842 nm - 850 nm) / 850 nm=-0.95 %. For the
sensitivity, considering the same tolerance and for the [1.38,1.39] RI range, the value
found was ΔS = (10.8×10³ nm/RIU - 10.2×10³ nm/RIU) / 10.2×10³ nm/RIU = 5.88 %.
These results show that the enhanced PCF D-type fiber configuration allows a
higher interaction of the light with the external medium, namely a two fold increase
of the Poynting vector intensity. Comparing both sensing configurations, for the range
of next [1.38, 1.39], the PCF D-type fiber sensor showed a higher performance,
enhancing the sensitivity from 2.8×10³ to 10×103 nm/RIU and the resolution from
3.6×10⁻⁵ to 9.8×10⁻⁶ RIU, with the conditions described.

Singlemode sensors with thin metal films
64
4.5 Conclusion
COMSOL Multiphysics was used to test and optimize computationally a sensing
configuration, with higher accuracy and considerable economy of time and resources.
Some SPR sensor configurations have been tested, namely: the conventional D-type
fiber, microstructured fiber with triangular and parabolic arrange of holes,
conventional PCF D-type fiber and the enhanced PFC D-type fiber. These new geometry
configurations presented the same or higher intensity distributions in the external
medium and higher SPR loss when compared with the conventional D-type fiber
(except in the case of the conventional PCF D-type fiber).
It was also possible to demonstrate the benefits of using COMSOL to improve the
performance of refractive index SPR D-type optical fiber sensors. The optimization of
the sensors can be performed through the variation of the metal thickness, the
distance of the metal to the center of the fiber and by the use of a high refractive
index layer. We concluded the metal thickness changes all the characteristics of the
sensors studied in this thesis, such as sensitivity, resolution, operation wavelength and
also the loss intensity. The distance d only changes the loss intensity. Finally, the high
refractive index overlayer alters the sensor operation wavelength. We studied
different positions for the air holes in the fiber and we encountered variation in the
sensor characteristics, which allowed us to optimize the singlemode SPR sensor.
Furthermore, these results demonstrated the importance of adequate engineer in
the integration of the guided modes of the fiber with the optical and plasmonic
structures of the device to increase the sensitivity. This approach is not limited to the
D-type fibers considered here but can be applied to many other optical and plasmonic
systems.

65
Chapter 5 Multimode sensors with thin metal films
The previous chapter investigated the improvements that can be introduced in the
conventional configuration of a SPR fiber sensor by introducing and optimizing a set of
holes in a D-type fiber to form a D-type photonic crystal fiber. The basic idea was to
promote the interaction between the light guided in the fiber (both by reducing the
distance between the core of the fiber), the metal interface and the exterior medium,
concentrating light in this region. This approach follows a trend in the scientific
community by introducing and optimizing metal-dielectric structures in the fiber that
can engineer and control the guided mode of light in the fiber that best interacts with
the metal layer. In general these designs make use of single mode fibers however,
considering multimode fibers introduces a new degree of freedom in the design,
namely the wide diversity of modes supported by the fiber, each with a unique
distribution of light intensity and capable of distinct interactions with the plasmons,
in principle resulting in various sensor performances. This raises therefore the question
of how the sensing performances of the individual modes are combined to generate
the overall sensor performance, and whether selecting a specific set of modes can
result in performance improvements. This chapter is devoted into answering this
question, and to do so, we investigate the occurrence of multiple modes found in a
plastic and silica multimode optical fibers and their effect on the SPR. We also
compare the sensitivity, resolution and the wavelength range when using the
fundamental mode or another higher mode.
5.1 Introduction to multimode fibers
The problem of multiple modes propagating in the optical fiber resulted in a SPR
sensor that suffered from modal noise [123]. To solve this problem Lin in [124]
proposed the use of a halogen light source and a subtractive mode method. Another
solution of this problem was proposed by Homola and Slaik [43] who use a singlemode
fiber. From there on, to use singlemode fibers has been the most natural choice for
the creation of SPR sensors based on optical fibers [6], [68], [70].
Therefore, the basic singlemode fiber has been the preference choice for optical
sensors based on optical fibers, in the past decades for the following reasons:

Multimode sensors with thin metal films
66
• Simplicity: only one mode is propagated into the fiber (fundamental mode),
the complexity of the simulation and experimentation of the sensor depends
on the detection of only one mode.
• Lower power loss: most of the signal attenuation is caused by the sensor
and not by optical dispersion in the fiber, allowing monitorization of
multiple sensors at longer distances.
• Greater distance: the monitorization or sensing of the sensor can be done
at long distance from the receptor, since, with only one mode, the total
dispersion of the sensing signal is reduced when compared to a multimode
solution.
• Multiplexing capability: the possibility to multiplex several sensors in
wavelength, using a short spectral window.
For SPR fiber sensors, the main approach consists in removing the cladding partially
or completely, so that the light can reach the metal/external interface medium to
create the condition of SPR. In these cases, the sensor sensing area depends both on
the size of the fiber core that is only a few micrometers and the on the length of the
fiber.
One solution to this problem is to work with fibers with a bigger core size
(multimode fibers) allowing to increase the sensing area and the sensor robustness.
Another solution is based on microstructured fiber or photonics crystal fiber (PCF),
which contain holes near the center of the fiber in whose internal surface can be
deposited a thin metal layer. This reduces the interaction distance between the guided
optical mode, the plamons and the external medium, without the need to produce
structural changes in the fiber, which may destroy it partially or totally. This proposal
can be a good solution but with a higher cost, more complex to fabricate with very
precise and expensive equipment. The utilization of multimode fiber can be an
interesting solution for the problem.
SPR multimode fiber sensors present some advantages and disadvantages when
compared with SPR singlemode fiber sensors:
• Bigger core: A bigger core introduces both advantages and difficulties in the
SPR fiber sensors because on one hand, it has a bigger sensing area, it has
a more robust configuration, but on the other hand, the modes that
propagate in the fiber have higher dispersion and consequently signal
attenuation and on top of it we still need to consider the extra signal
attenuation imposed by the SPR [122].
• Smaller transmission distance: The higher optical dispersion of this fiber
causes the maximum distance for the recuperation of the signal to drop
drastically.
• Multiplexing capability: there is less sensor wavelength multiplexing
capability due to the spectral width of each sensor signal.
• Cost: the cost of the multimode or singlemode fiber in glass is more or less
the same, the difference is on the emission and detection blocks, where
singlemode technology is more expensive.
In general, the multimode optical fiber employed is either based on glass or on
plastic. For low-cost SPR sensing systems, plastic optical fibers (POFs) are especially
advantageous due to their excellent flexibility, easy manipulation, great numerical

Multimode sensors with thin metal films
67
aperture, large diameter, and the fact that plastic can withstand smaller bend radii
than glass [109], [125].
5.2 Multimode fiber sensor based in SPR
In Erro! A origem da referência não foi encontrada. was presented an extensive
study of the different variations of the Kretschmann configuration, where light is
propagated in a singlemode optical fiber for the excitation of the surface plasmon. In
the case of multimode fiber the information found in literature is poor, because the
high dispersion and attenuation, the propagation of light in the fiber is worse. But,
with the evolution of technology and the interest of having low-cost sensors with
moderate sensitivity and resolution, work has been carried out in SPR on multimode
fibers [126].
The first SPR sensors based in multimode fibers were compose by a fiber where the
cladding was partly removed and a metal film was deposited around the exposed
section of fiber core [5]. The first multimode fiber based SPR sensors reached a
resolution of 5χ10-5 RIU [60].
Different configurations of SPR sensors based on plastic clad silica (PCS) fibers and
on multimode silica fibers have been studied in the last two decades, some examples
of configurations are the removed cladding [5], [59], [80], a side-polished fiber [124],
tip-polished fiber [95], [127] and tapered fiber [64], [65], [128]. These configurations
study and optimize different parameters of the SPR such as the thickness of the metal
[95], effect of the overlayer [128], length of the sensor [61], size of the core [59]. In
the case of the tapered, different angles and taper profiles [64], [65] among others,
where the principal aim is the optimization of the sensitivity and resolution of the
sensor.
Plastic Optical Fibers (POF) have same advantages in the context of multimode
fibers, since they can also resist smaller bend radii than glass and the refractive index
of the core is higher than glass. The first advantage allows increasing the robustness
of the sensor and the creation of the other configurations such as the U-shape [129].
The second advantage allows using the sensor to detect higher values of the external
medium refractive index (close to 1.49) [90].
Comparing the large applications and variation of the SPR glass optical fiber (GOF)
sensors, in recent years, the POF SPR sensors were placed aside, mainly because of
the difficulty of employing sol-gel techniques onto POF surface and the high dispersion
of the POF [130].
The few configurations of the POF SPR found in literature are like the
configurations SPR GOF sensor [48], [129], [131], [132]. Also, the optimization of the
SPR POF or multimode GOF in terms of the sensitivity, resolution, signal-noise, loss,
wavelength, range of the refractive index external medium follow a similar
methodology applied to the optimization of the SPR singlemode sensor. In the case of
the SPR multimode sensors, the existence of these different propagating modes in the
fiber is not widely studied, as well as the respective effect produced by the metal in
the behavior of each mode. The possibility of using different modes to optimize the
sensor performance introduces a possible new dimension in the optimization of the
sensor.

Multimode sensors with thin metal films
68
5.3 POF SPR sensor and effect of modal filtering
In this section, we present the work done in collaboration with Prof. Luigi Zeni, Dr.
Nunzio Cennamo, Dr. Pedro Jorge and Dr. Luis Coelho, and reported in [109] resulting
from a joint institutional collaboration between department of Industrial and
Information Engineering, Second University of Naples, the Institute for Systems and
Computer Engineering, Technology and Science (INESC-TEC) and with the Faculty of
Exact Sciences and Engineering, University of Madeira [109].
The experimental SPR sensor configurations are based on a side-polished POF
coated with a multi-layer element as shown in Figure 5.1 The effect of a Tapered-POF
Filter connected before or after the SPR sensor system is then tested for sensor
optimization.
Figure 5.1 Section view of the sensor system based on SPR in POF.
Figure 5.1 shows the schematic section view of SPR sensor system in POF. The
plastic optical fiber has a Polymethyl methacrylate (PMMA) core of 980 µm and a
fluorinated polymer cladding of 10 µm. Experimental evidence indicates that the
configuration with a fiber diameter of 1000 µm exhibits better performance in terms
of sensitivity and resolution but not in terms of SNR [35]. The refractive index (RI), in
the visible range of interest, is about 1.49 for PMMA, 1.41 for fluorinated polymer and
1.61 for Microposit S1813 photoresist (see layer arrangement in Figure 5.1).
5.4 Numerical simulation without tapered POF filter
To better understand the sensor’s behavior, a numerical model was implemented.
The design used in this numerical simulation is based in the configuration depicted in
Figure 5.1 but in this case without the photoresist, to reduce the number of elements
in the calculation. The material values were calculated using the Sellmeier equation
for the POF and the Drude model for the metal (Au).
One common analysis of SPR sensors is based on the transference matrices for
propagation of light in stratified media, originally derived to describe the operation of

Multimode sensors with thin metal films
69
SPR sensors using the Kretschmann configuration based on prisms [1]. From a
fundamental point of view, this is equivalent to consider a ray approximation of the
propagation modes inside the fiber and is valid if the modal structure of the fiber is
not too much affected by the change in cross section profile introduced by the
polishing. Then, the transmission along the sensing section of the fiber is affected by
the losses of light towards the exterior introduced by each reflection at the metallic
film.
However, for the sensor considered in this work, such approach is too crude
because the polishing process removes a significant part of the core which affects the
modal structure of that section of the fiber. This can be clearly identified in Figure
5.2 where is shown the impact on the intensity distribution of the LP02 (mode 56) and
LP04 (mode 16) modes introduced by the change from a circular to a cut profile with
the gold layer. It is important to notice that higher order modes are more affected by
the change in profile because for them, light propagates preferably at the edge of the
core and thus interacts more with the polished surface than lower order modes, which
propagate more closely to the center of the core.
Mode 56
Mode 16 (a) (b)
Figure 5.2 Numerical results for two modes LP02 (mode 56) and LP04 (mode 16) in POF. (a) POF without the cut, (b) POF with cut and gold layer.
A second effect is that this also promotes the interaction of higher order modes
with the surface plasmons on the metal and therefore these higher modes are more
affected by the SPR. Thus, and as can be seen in Figure 5.3a, the losses introduced to
higher order modes are much more striking, resulting in a stronger wavelength loss.
These results indicate that, the selection of excitation/detection of higher order
modes can therefore promote the enhancement of the plasmonic response of fiber
optic SPR based sensors.

Multimode sensors with thin metal films
70
(a)
Mode 59
Mode 57
Mode 53
Mode 50
Mode 47
Mode 42
(b)
Figure 5.3 (a) Attenuation as function of the wavelength for different modes when the RI of the external medium is 1.39. (b) The distribution of the light intensity of the sensor for different modes.
To complete the study of the numerical simulation of the POF sensor based in SPR,
the study of the sensor behaviour when exposed to different external refractive indices
is necessary, as shown in Figure 5.4. Figure 5.4a shows the behavior of the sensor for
mode 56 and for mode 16. Figure 5.4b is a magnification of Figure 5.4a for mode 56.

Multimode sensors with thin metal films
71
(a)
(b)
Figure 5.4 Attenuation as function of wavelength for different values of the external refractive index of the sensor for: (a) mode 16 (dashed line) and mode 56 (solid line), (b) magnification of the
mode 56 behavior.
Figure 5.4 shows the wavelength of the resonant peak is the same, independently
of the mode.
5.5 Experimental characterization of the POF SPR sensor
The fabricated optical sensor system was realized by removing the cladding of the
plastic optical fiber close to the half the fiber circumference, the buffer of Microposit
S1813 photoresist was spin coated on the exposed core, and finally a thin gold film
was deposited using a sputtering machine. The sample consisted in a plastic optical
fiber without jacket embedded in a resin block, with the purpose of easing the
polishing process. The polishing process was carried out with a 5 µm polishing paper
to remove the cladding and part of the core. After 20 complete strokes following a

Multimode sensors with thin metal films
72
“figure of eight” to completely expose the core, a 1µm polishing paper was used for
another 20 complete strokes with a “figure of eight” pattern. The implemented
sensing region was about 10 mm in length. The buffer of Microposit S1813 photoresist
was introduced by means of spin coating. The Microposit S1813 photoresist is deposited
in one drop (about 0.1 ml) on the center of the substrate. The sample is then spun at
6000 rpm for 60 seconds. The final thickness of photoresist buffer was about 1.5 µm.
Experimental results indicate that this configuration with the photoresist buffer layer
exhibits better performance in terms of detectable RI range and SNR [48]. Finally, a
thin gold film was sputtered by using a sputtering machine (Bal-Tec SCD 500). The
sputtering process was repeated twice with a current of 60 mA for a time of 35 seconds
(20 nm for step). The gold film so obtained was 60 nm thick and presented a good
adhesion to the substrate, verified by its resistance to rinsing in de-ionized water.
Measurements were carried out with an experimental setup arranged to measure
the transmitted light spectrum and characterized by a halogen lamp, illuminating the
optical sensor system, and a spectrum analyzer for spectral interrogation. The halogen
lamp employed exhibits a wavelength emission range from 360 nm to 1700 nm, while
the spectrum analyzer detection range was from 300 nm to 1100 nm.
In this work, three different POF sensor configurations are presented and
experimentally tested with spectral interrogation: first, the configuration without a
tapered POF filter (see Figure 5.1); second, the configuration with a tapered POF filter
at the input of the fiber optic SPR sensor system (see Figure 5.5); third, the
configuration with a tapered POF filter at the output of the POF, before the spectrum
analyzer and after the SPR sensor (see Figure 5.6). The tapered POF presents a PMMA
core of 980 µm, a fluorinated cladding of 10 µm, a taper ratio (ri/ro) of about 1.8 and
a taper region (Lt) of about 10mm in length.
Figure 5.5 Experimental configuration of the sensor system with tapered POF filter at the input of
the sensor system

Multimode sensors with thin metal films
73
Figure 5.6 Experimental configuration of the sensor system with tapered POF filter at the output of the
sensor system.
To obtain these tapers, the plastic optical fiber, without protective jacket, was
heated at 150°C and stretched with a motorized linear positioning stage until the taper
ratio reached 1.8.
5.5.1 Experimental configuration without tapered POF filter
Figure 5.7 reports the experimental SPR transmission spectra, obtained without the
tapered POF filter configuration (see Figure 5.1), normalized to the spectrum achieved
with air as the surrounding by the external medium, for seven different solutions
(aqueous environment) with RI ranging from 1.330 to 1.390. While the increasing RI
introduces a shift in the resonance peak, it also results in a broadening of the
resonance curve width, δλSW, together with a decrease of the total attenuation. In this
case, using the configuration without tapered POF filter, when the RI increases from
1.330 to 1.390 the resonance wavelength shift is 86.5 nm.
Figure 5.7 Experimentally obtained SPR transmission spectra, normalized to the air spectrum, for
different RI of the aqueous medium. Configuration without tapered POF filter.

Multimode sensors with thin metal films
74
5.5.2 Configuration with tapered POF filter before the SPR sensor
system
Figure 5.8 presents the SPR transmission spectra of the experimental configuration
with a tapered POF at the input of the SPR sensor (Figure 5.5). The SPR transmission
spectra, normalized to the spectrum achieved with air as the surrounding medium,
obtain the same solutions as in Figure 5.7 (RI ranging from 1.330 to 1.390).
Figure 5.8 Experimentally obtained SPR transmission spectra, normalized to the air spectrum, for different RIs of the aqueous medium. Configuration with tapered POF filter at the input of the SPR
sensor.
In this case, using the configuration with a tapered POF filter before the SPR sensor,
when the RI increases from 1.330 to 1.390, the resonance wavelength shift is of 94
nm, (an increase of 7.5 nm with respect to the configuration without tapered POF
filter). Similarly to the configuration without tapered POF filter, the resonance dip
rapidly decreases its depth as the RI increases.
5.5.3 Configuration with tapered POF filter after the SPR sensor
system
Figure 5.9 presents the SPR transmission spectra, normalized to the spectrum
achieved with air as the surrounding medium, when the experimental configuration
with a tapered POF at the output of the SPR sensor is used (Figure 5.6). The SPR
transmission spectra have been again obtained for the same solutions (RI ranging from
1.330 to 1.390).

Multimode sensors with thin metal films
75
Figure 5.9 Experimentally obtained SPR transmission spectra, normalized to the air spectrum, for different RIs of the aqueous medium. Configuration with tapered POF filter at the output of the SPR
sensor.
In this case, using the configuration with tapered POF filter after SPR sensor, when
the RI increases from 1.330 to 1.390 the resonance wavelength shift is of 98 nm(an
increase of 11.5 nm with respect to the configuration without tapered POF filter). In
this way, the sensor sensitivity increased.
5.6 Conclusion
Indeed, looking at the experimental results, the configuration with a tapered POF
filter at the output of the SPR sensor system exhibits better performance in terms of
sensitivity, when the RI of the aqueous environment increases. Considering the
numerical results, this behavior can be ascribed to the rejection of certain modes by
the tapered filter, at the sensor output, which results in an increasing of the resonance
depth.
On the other hand, filtering at the sensor input seems to have a significant impact
on the sensor behavior. This can be explained by the fact that, even if a reduced
number of modes is excited at the fiber input, the discontinuity encountered when
propagating from the cylinder section to the D-shaped section, creates the conditions
to re-excite the modes. The filtering effect is therefore cancelled by this excitation
process. For three experimental configurations for higher RI values, the experimental
results suggest that the best configuration is composed of the tapered POF filter at
the output (after) of the SPR sensor. Overall the results show that strategically placing
a simple taper acting as modal filter at the output of a multimode fiber SPR sensor
clearly improves its performance. The ability to extend the dynamic range to higher
RI is particularly attractive because it enables operation with high RI sensing layers
such as molecularly imprinted polymers [133]–[135].
Looking at the numerical results we observed that a variation of the loss intensity
is different for each mode but the central wavelength of the loss deep is the same for
all modes. These modes with higher loss have an intensity distribution pattern

Multimode sensors with thin metal films
76
characterized by having a large spot at the flat surface of the fiber core, as shown in
Figure 5.3 in the case of the modes 42 and 50.
Calculating the sensitivity, resolution and wavelength peaks for different values of
the next using the information of Figure 5.4b and equation 3.71, as shown in Table 5.1.
The comparison between the experimental (Figure 5.7) and the simulation (Figure 5.4)
indicates some differences in the results. Most of the differences comes from the fact
of not considering the photoresist layer in the simulations, since this layer is
responsible for a shift to longer wavelengths in the experimental results.
Table 5.1 Sensitivity, resolution and range of the wavelength for the POF D-type of the mode 16.
Sensitivity(nm/RIU) Resolution (RIU) Range λ (nm)
Range of next POF D-type mode 16
[1.33,1.34] 1.90×10³ 5.26×10⁻⁵ 512-531
[1.34, 1.35] 2.10×10³ 4.76×10⁻⁵ 531-552
[1.35, 1.36] 2.30×10³ 4.35×10⁻⁵ 552-575
[1.36, 1.37] 2.80×10³ 3.57×10⁻⁵ 575-603
[1.37,1.38] 3.10×10³ 3.23×10⁻⁵ 603-675
Three experimental configurations for SPR sensor in a POF platform, have been
implemented and experimentally tested. Numerical results were obtained validating
the experimental data previously discussed. The configuration with a tapered POF
filter at the output of the SPR sensor system exhibits a better performance in terms
of sensitivity, depth of the resonance and RI range. This phenomenon is more
significant for high RIs. Furthermore, it is also observed that in the standard
configuration the contrast of the resonance dip rapidly decreases as the RI increases,
limiting the operation range. Using the tapered POF filter at the output of the SPR
sensor, however, it is observed that the resonant dip shows an overall higher contrast
that is even increased for higher RI values. Therefore, the results presented clearly
demonstrate the feasibility of using simple modal filtering to improve the operation
range of SPR based sensors in multimode POF fiber.
Experimentally, we have tested three configurations that used a filter to remove
different sets of modes from the optical field going through the sensor. Nevertheless,
all sensing configurations exhibited the same resonance wavelength despite
differences in the loss, which are also observed in the simulations. The differences
between the experimental and the numerical results can be justified by not being able
to identify exactly which modes are filtered out experimentally from the sensor.
Instead, one only has information about the order of the modes that are filtered,
typically whether one is filtering the higher or the lower order modes. As a result of
this experimental indetermination, it is impossible to know exactly the contribution
from each mode to the total output spectrum. This lack of experimental information,
prevents us from knowing the exact weigh by which to combine the numerical results

Multimode sensors with thin metal films
77
obtained for each mode in order to emulate the experimental transmission and loss
curves. However, the numerical results are confirmed by the experimental results
since they present similar conclusions.

Multimode sensors with thin metal films
78

79
Chapter 6 Sensors with metamaterials
Until now we have considered only sensors composed of a thin meal film deposited
on the surface of a fiber. The quintessential aspect of the film is that the real part of
the permittivity of the metal must be negative to support surface plasmon. This is a
common property of metals and therefore different metals, like gold, silver, coper and
aluminum are normally used in SPR sensor. The differences in permittivity of several
metals determine most of the characteristics of the SPR sensors, namely the loss,
sensitivity, wavelength of operation, among others. Another alternative is to combine
multiple layers of different metals or combining metals with other materials that have
been shown to have improved sensing characteristics. The idea is that each of these
multiple layers influence each other, such that they work like an effective layer with
optical properties that are somewhat of an hybrid agglomeration of the optical
properties of the individual materials. This is then a metamaterial with unique optical
properties.
In this chapter, we define the method to determine the value of the permittivity
of the metamaterial and then we use it to create a SPR sensor. Also, we study the
sensitivity, resolution and operation wavelength of a D–type PCF SPR sensor with a
metamaterial and also compare it with a D-type PCF SPR sensor with a silver film. We
also propose a technique to calculate the thickness and the concentration of the
materials of the metamaterial to have a sensor working in the desired wavelength and
with the desired loss.
Metamaterials are artificial materials designed to have properties that are not
found in natural materials [136]. These metamaterials are composed by multiple
elements, usually metallic and dielectric components. Their properties depend not
only on the characteristics of their components and their relative abundancy, but also
depend on the geometry, typically arranged in repetitive patterns at sub-wavelength
scales [101]. One example of a structure of a metamaterial is shown in Figure 6.1.
Metamaterials gain their properties not only from their composition, but also from
their structures, giving them properties capable of manipulating the light: by blocking,
absorbing, improving or flexing the waves, in order to achieve benefits that go beyond
what is possible with conventional materials.

Sensors with metamaterials
80
Figure 6.1 Scanning electron microscopy (SEM) images of the fabricated metamaterial: (a) cross section
and (b) top view. Bright and dark spots correspond to Ag-filled and empty pores, respectively [99].
Many of the materials that have attracted significant research in optics are those
exhibiting a negative permittivity, for particular wavelengths [73], [137], [138]. One
of the potential applications of the negative permittivity of metamaterials is therefore
the possibility of being used in SPR sensors [73], [137].
6.1 SPR sensor based in metamaterials
There is abundant work in literature that study different metallic layers to optimize
SPR sensors (from controlling losses, to increasing sensitivity, among others) [62], [71],
[139]. The possible combinations of material layers used are not restricted to metals.
Also materials with high refractive index (HRI) can be used to control optical losses
and the sensor wavelength operation range [45]. The main problem with these
materials or with this combination of materials is the difficultny of controlling their
fabrication (including their thickness and roughness) and consequently the control of
their optical properties [140].
More recent works on SPR sensors, that combine different materials, have begun
to explore the use of optical metamaterials. These artificial materials combine two or
more materials to create a new artificial material which exhibits optical properties
that cannot be found in naturally occurring materials and which can be designed to
attain predefined performances [138]. These properties depend both on the optical
properties of their constituent materials, their relative abundance and the geometry
of the nano-structures used to combine them. This wide freedom available during
fabrication allows to develop metamaterials with almost customized optical properties
that can be used to optimize the performance of the sensor (e.g. loss, the light
wavelength range, the refractive index range detection, among others) to values
beyond that of conventional SPR sensors [73].
We pursue this approach and present a sensor based on SPR that combines a D-type
PCF fiber with a metamaterial (Al2O3 - Ag). The performance of the sensor is
investigated through simulations based on FEM using COMSOL Multiphysics [45]. The

Sensors with metamaterials
81
sensor analysis is focused on the percentage of each constituent of the metamaterial
and the layer thickness, which are the main parameters in determining it is optical
properties. The numerical simulation of new sensing SPR configurations allows select
the ones with the best performance to be fabricated, thus leading to a considerable
economy of time and resources, when compared to an exhaustive fabrication and test
of all possible designs.
6.2 Effective medium theory
Two of the most widely used effective medium approaches are the Maxwell–Garnett
theory (MGT) and the Bruggeman effective medium theory (EMT) [138].
The central formula in the Maxwell–Garnett theory (MGT) as defined in [138] is:
h
h
hmeta
hmeta f
22 1
1
(6.1)
where h is embedded in a host medium with relative permittivity 1 and f is the
volume filling fraction of the 1 material in the composite. Alternatively, the effective
permittivity meta can be expressed in an explicit way as [138]:
h
h
h
h
hmeta
f
f
21
221
1
1
1
1
(6.2)
Equation 6.1 is known as the Maxwell–Garnett formula, which describes the bulk
effective permittivity of a composite in terms of the permittivity of the inclusion 1
and the host dielectric constant h . For a metal-dielectric composite, we can view the
metal as the inclusion, while the dielectric component serves as the host. Although
the effective permittivity in MGT can reach the permittivities of the two constituents
(when the filling fraction approaches the two extreme values of f = 0 and f = 1),
equation 6.1 clearly shows that MGT treats the matrix and the inclusion in an
unsymmetrical manner. Therefore, before evaluating the effective parameters of a
two-phase composite using MGT, one constituent has to be considered the “host” and
the other the “inclusion.” This asymmetry is particularly strong when the difference
in the permittivities of the two materials is large. In fact, MGT provides a reasonable
estimation of the effective dielectric function only when the volume filling factor of
the inclusion is substantially less than 1.
In order to evaluate the effective parameters of a composite medium without
restricting the analysis only to the low- f cases, Bruggeman made a great improvement
to the Maxwell–Garnett theory by finding a way to treat the two constituent materials
in a symmetric fashion, thus overcoming many of the difficulties of MGT that we
discussed above. Bruggeman’s EMT is, arguably, the most widely known version among
a variety of mean-field theories.
We used the formula of Bruggeman as [138]:
0
2
22
1
11
m
mf
meta
metaf
(6.3)

Sensors with metamaterials
82
where εm is the dielectric constant of the metamaterial, εi, (i = 1, 2) is the refractive
index of each of the two types of inclusions with volume filling-ratios of f1 and
f2 = 1 – f1, respectively, and η is the form factor (η =2 for a spherical configuration and
η =1 for a cylindrical configuration).
Unlike the Maxwell–Garnett theory, the two components here are symmetrical with
respect to the exchange of roles of 1 and 2 . In other words, in the Effective Medium
Theory (EMT) both phases are considered to be embedded in the effective medium,
and there is no need to give preference to one phase over the other.
6.3 Metamaterials formed by Alumina and Silver (Al2O3 – Ag)
In our case, we adopt the Bruggeman EMT (BEMT) since it is more adequate when
the two materials have quite distinct permittivity, rather than the MGT, which
considers only materials with similar permittivity and η = 2. Other nanostructures of
Al2O3 - Ag can also be used, including silver nanowires or nanorods immersed in an
alumina matrix. In these cases, the same homogenization model can be used by
replacing the form factor η with the appropriate value according to the geometry of
the nanostructures. The general optical properties obtained for other metamaterials
are alike and therefore we focus here on the simplest form to fabricate [73].
The complex dielectric of the metamaterial results from the combination of
properties from its metal and dielectric components. As a result, the metamaterial
layer can be considered as an artificial metal layer capable of supporting effective
plasmonic modes. Using equation 6.3 we can calculate the complex dielectric of the
metamaterial as shown in Figure 6.2, for different concentrations of Ag.
Figure 6.2 shows the real (Figure 6.2a) and imaginary (Figure 6.2b) parts of the
metamaterial for the different concentrations or fill ratios of Ag and Al2O3, calculated
using the BEMT model. Like in the case of a pure silver film, the metamaterial films
with fill ratios up to 50% have a negative dielectric constant for the large majority of
the spectral range considered, which is a necessary condition to support surface
plasmons. In the case of a fill ratio of 50%, the metamaterial is close to an epsilon-
near-zero regime, situation where the effective medium approach may have a limited
validity.

Sensors with metamaterials
83
(a)
(b)
Figure 6.2 Complex dielectric (a) real part and (b) imaginary part of the metamaterial for concentrations of Ag of 100% (solid curve, corresponding to pure silver), 90% (dashed curve), 80%
(dotted curve) and 70% (dash-dotted curve) 60% (dash-double dotted curve) and 50% % (small dashed curve). The equivalent curve for alumina (Al2O3) is also presented for reference (small dotted curve).
6.4 Proposal SPR sensor based in a metamaterial
We consider the design of an optical sensor of refractive index composed of a PCF
fiber with a D-type profile, as described in Figure 6.3. The fiber is composed by a glass
core with refractive index ng, surrounded by an array of dielectric structures
(corresponding to the holes in the PCF fiber) with refractive index equal to 1. The
refractive index ng is calculated using Sellmeier’s equation (equation 3.25). It is
assumed that the space outside the fiber is filled with the analyte medium to be
studied, and having an external refractive index next. The distance between the center
of the fiber and the metamaterial layer is denoted by d - residual cladding, the

Sensors with metamaterials
84
thickness of metamaterial layer by dm, the diameter of the holes by dhole, and the
separation of the holes by Λ – pitch.
The conventional PCF is designed to confine light in the core. However, when
integrated within a D-type fiber, as is the case of the design described in Figure 6.3,
light is confined against the surface of the metal and thus promotes the interaction of
the core mode with the external medium. The interaction of the electromagnetic
modes with the external media is mediated by a metamaterial film that supports
surface plasmons, which improves the sensitivity of the sensor [20]. In this sensor we
replace the conventional metal with a metamaterial film composed of thin layers (sub-
wavelength) of silver and alumina (see the inset of Figure 6.3).
6.4.1 Metamaterial versus pure metal layers
In this subsection we compare the conventional sensor based on a PCF D-type with
a metamaterial and a metal layer (e.g. Ag) with the version based on a metamaterial
with 20% of Al2O3 and 80% of Ag, using equation 3.73 to compute losses per mm, as
function of the wavelength, for different values of the external refractive index. The
Figure 6.3 From left to right up: three dimensional representation of a section of the fiber sensor, transverse cross-section of the fiber sensor. From right to left down: detail of the
structure of the surface of the sensor indicating the position metamaterial film and a scheme of the thin metal-dielectric layers that compose the metamaterial.

Sensors with metamaterials
85
results are shown in Figure 6.4, where it is possible to identify a clear peak in
attenuation, typical of the SPR, which is not only strongly affected by the change in
external refractive index, but also is dramatically affected by the replacement of the
metal with a metamaterial layer. Indeed, these results show a red-shift of the peak in
wavelength for higher external refractive index. But what is relevant is that not only
the values of the losses for metamaterials are considerably higher, amounting to 40
dB/mm (instead of 10 dB/mm obtained with a pure metal layer) but also the operation
range in wavelength is around 700 nm (instead of 550 nm obtained with a pure metal
layer) for next = 1.30.
(a) 100%
550 nm 580 nm 650 nm
80%
700 nm 750 nm 800 nm
(b) Figure 6.4 (a) Attenuation as function of wavelength for different values of the external refractive
index, with two different layers, one with only Ag and the other with metamaterial with a concentration of 80% Ag and 20% Al2O3. (b) Distribution of the light in the region of the center of the fiber and the metal/metamaterial film for two concentrations of Ag (100% and 80%) and with 1.34 RI.
This suggests that metamaterials allow a stronger interaction between light in the
fiber and the external medium at higher wavelengths, closer to the 850 nm optical

Sensors with metamaterials
86
window and more adequate for integration in telecom optical fiber networks. It also
follows from these results that it is possible to optimize and balance the ranges of
operation of the sensor in both wavelength and external refractive index by choosing
the relative concentration of the metal in the metamaterial and the layer thickness.
For example, if the sensor is to work between 600 nm and 700 nm and measure
refractive indexes between 1.30 and 1.32 RIU instead of 1.35 and 1.36 RIU, then it is
possible to fine tune the concentration of Ag around 80% for optimal performance.
Figure 6.4b shows the distribution of the light in the region of the center of the
fiber of the metal or metamaterial. The intensity of light around the metal or
metamaterial and the coupling between the modes is higher in the metamaterial than
the metal, as verified by a higher loss with the metamaterial than with the metal, as
shown in Figure 6.4a.
Considering a spectral variation of 0.1 nm that can be accurately detected
experimentally, and using equations 3.71 and 3.72, the values of the sensitivity, sensor
resolution and spectral range of the refractive index sensor with the considered
metamaterial, for different ranges of variation of the external refractive index are
shown in Table 6.1.
Table 6.1 Sensitivity, resolution and range of the wavelength values for the refractive index optical
fiber sensor based on two materials (Ag and metamaterial).
Sensitivity (nm/RIU) Resolution (RIU) Range λ (nm)
Range of next
Ag Metamaterial Ag Metamaterial Ag Metamaterial
[1.30,1.32] 1.75×10³ 2.30×10³ 5.88×10⁻⁵ 4.35×10⁻⁵ 500-530 670-710
[1.32,1.34] 2.00×10³ 2.40×10³ 4.76×10⁻⁵ 4.17×10⁻⁵ 530-580 710-755
[1.34,1.36] 2.80×10³ 3.70×10³ 3.57×10⁻⁵ 2.70×10⁻⁵ 580-640 755-830
In Table 6.1 we also present the equivalent results for a sensor with a layer of pure
metal. Clearly, the sensor with the metamaterial outperforms its counterpart with
pure metal in all parameters even though the gains in resolution are marginal. As
expected from Figure 6.4, the major improvements are in terms of sensitivity (over
30%) and in wavelength operation range, especially for variation of the refractive index
in the range of [1.34,1.36] where the sensor can actually operate at 830 nm
6.4.2 Loss for different concentrations of Al2O3 and Ag
The previous section demonstrated the best performance of metamaterial sensors
when compared with their metal counterpart, and the increased freedom in designing
the sensor, associated with control of the concentrations of the different materials
that compose the metamaterial, as well as the layer thickness. This section addresses
the characterization of the sensor in terms of the first parameter. Figure 6.5 and Table
6.2 show the light loss through the sensor as function of the wavelength for
metamaterials with different concentrations of Ag – Al2O3. The results show a red-shift

Sensors with metamaterials
87
in wavelength of the resonance peak for decreasing concentrations of Ag similar to
those reported in previous studies [73].
Figure 6.5b shows the distribution of light in the region of the center of the fiber
and in the metamaterial film for two concentrations of Ag (75% and 65%). The
distribution of light intensity for both concentrations and at different wavelengths are
very similar but there are subtle differences when focusing our attention to the region
near the metal interface: the intensity gap between the core and the exterior of the
metal becomes sharper and the intensity outside increases for higher wavelengths,
indicating a change in the nature of the light interaction with the plasmons. The main
difference between the two concentrations is the wavelength at which this change in
(a)
75%
720 nm 740 nm 800 nm
65%
900 nm 960 nm 1040 nm
(b)
Figure 6.5 (a) Attenuation as function of wavelength for different metamaterial filling ratios for the PCF D-type configuration with next = 1.30 RIU. (b) Distribution of light in the region of the center of
the fiber and the metamaterial film for two concentrations of Ag (75% and 65%).

Sensors with metamaterials
88
light-plasmon interaction occurs, which is consistent with the resonance peaks
identified in Figure 6.5a.
Table 6.2 Information about the loss peak (αpeak), wavelength (λ), 3dB/mm the variation of the loss
( ) low and high wavelength with variation of loss 3dB (λL and λH, respectively) information about
narrow of the sensor, extracted from Figure 6.5
Concentration αpeak(dB/mm) λ (nm) (dB/mm) λL (nm) λH (nm) λH – λL (nm)
Al2O3 10% and Ag 90% 20.422 574 17.422 566.47 581.88 15.41
Al2O3 20% and Ag 80% 41.966 676 38.966 670.87 682.09 11.22
Al2O3 30% and Ag 70% 62.619 850 59.619 834.40 864.10 29.70
Al2O3 40% and Ag 60% 114.730 1115 111.730 1069.00 1159.91 90.91
From Table 6.2 we conclude that metamaterials with higher concentrations of Ag
produce narrower resonance peaks, an effect which is especially noticeable for Ag
concentration above of 70%. This puts a lower limit to the concentration of Ag, since
below this value one obtains wide resonance peaks and strong losses, thus resulting in
feeble optical signal and low signal to noise ratios. The best sensing performance
occurs for a metamaterial with 20% of Al2O3 and 80% the Ag, where the resonance peak
is relatively narrow and losses are not excessive. The transition between a narrow and
broad resonance identifiable in the loss spectrum described in Figure 6.5a for a
metamaterial with increased Al2O3 concentrations can be explained in terms of the
imaginary part of the dielectric constant, illustrated in Figure 6.2b. For pure silver,
the imaginary part for wavelengths above 0.3 microns grows monotonically, resulting
in a narrow SPR resonance at lower wavelengths. For a metamaterial with higher
concentrations of Al2O3, we notice the existence of a feature similar to a concave
protuberance in the spectrum of the imaginary part of the dielectric constant, which
allows more wavelengths to be near SPR resonance, thus broadening the loss peak
observed in Figure 6.5a and blue shifting it.
6.4.3 Loss for different thicknesses of the metamaterial
In this subsection we address the characterization of the metamaterial sensor in
terms of layer thickness. The metamaterial thickness is strongly constrained not only
by fabrication limitations, but also by the validity of the homogenization model used
to compute the optical properties of the metamaterial (see equation 6.3) and the fill
ratio f) and ultimately by the physical limitations of the nanoscale components of the
metamaterial to respond collectively to the optical field and behave as a single bulk
synthetic optical material. For example, if we consider the layered medium chosen in
this artigo it is not possible to have metamaterial layers of thicknesses of about a few
atoms as it would be in the case of a pure metal. Indeed, in such case it would be
impossible to pile up sufficient layers of both Ag and Al2O3 to obtain an intended value
of relative concentration. This could however be overcome by considering other types
of metamaterials, such as those composed of metal nanodisks embedded in a dielectric

Sensors with metamaterials
89
matrix [73] which would be able to cover the entire range of metal and dielectric
concentrations, even for layers with atomic thicknesses, by adjusting the radius and
average distance between the metal disks. Then the homogenization model would still
be valid but with a different value of form factor f.
Figure 6.6 describes the attenuation through the fiber as function of the
wavelength for different values of thickness of the metamaterial (dm) and shows a
slight red-shift in wavelength when the thickness of the metal is increased, although
for large thicknesses of the metal the shift is smaller than for short thicknesses.
Figure 6.6 Attenuation as function of wavelength for different thicknesses of the metamaterial PCF D-type configuration fiber with next = 1.32 RIU and Ag = 90%.
Figure 6.6 shows that the decrease of dm produces an increase of the intensity of
the loss, a phenomenon observed in pure metals [45]. This suggests that it is possible
to do some fine tuning of the sensor performance (such as the operation range and the
amount of losses) by adjusting the thickness of the metamaterial.
6.4.4 Optimization of the sensor
The two previous sections have shown that it is possible to improve the
performance of the sensor by controlling both the concentrations of Ag or Al2O3 and
thickness of the metamaterial. In this section we combine those results and discuss
how they can be used to design a sensor with optimized performance. In particular, it
was concluded that the increase in losses associated with decreasing the metal
concentration could be partially compensated with an increase in layer thickness. On
the other hand, both a decrease in metal concentration and an increase in layer
thickness would contribute to a red shift of the peak towards 850 nm. These
considerations suggest that the best design parameters to consider when optimizing
the sensor performance are, on one hand, the layer thickness and, on the other, the
amount of metal per area of the metamaterial film, rather than the actual
concentration of metal. A good estimate of the amount of metal per area can be

Sensors with metamaterials
90
obtained by the product between the thickness of the layer and the concentration of
Ag in the metamaterial, designated by σAg =%Ag ˟ dm.
In Figure 6.7 we have plotted the amount of attenuation of the resonance peak for
different values of the product between Ag concentration and thickness. Clearly, the
wide majority of these points fall along the same trend line, thus supporting our
hypothesis. This shows that the relevant parameter is the total cross section between
the optical field and the atoms of metal as the former crosses the layer. In other
words, the losses are approximately determined by the amount of metal atoms that
interact with the field per unit area and are somewhat independent of whether they
are all concentrated in a single metal layer or distributed along the metamaterial.
Therefore, the main effect of the metamaterial, when compared to a film of pure
metal with the same amount of atoms per unit of surface (and hence with a different
thickness) is to red shift the peak of the SPR resonance.
Figure 6.7 Attenuation peak as function of the relative concentration and thickness of the metamaterial with next = 1.30 RIU.
To verify this second conclusion, we plotted in Figure 6.8 the peak wavelength as
a function of σAg. In this case, the points corresponding to different thicknesses fall on
similar, yet parallel, trend lines.

Sensors with metamaterials
91
Figure 6.8 The wavelength peak of the attenuation as function of the relative concentration and thickness of the metamaterial for next = 1.30 RIU.
The conclusions from Figure 6.7 and Figure 6.8 can now be used in the design and
optimization of the sensor by allowing us to choose the thickness of the metamaterial
and concentration of Ag that yield the best performance for a given spectral range of
operation, as well as, for a specific range of measurement of next. For example, to
measure an external refractive index around 1.30 RIU using a sensor operating around
700 nm, it is possible to use Figure 6.8 to select a metamaterial thickness of, for
instance, 70 nm corresponding to σAg≈55 nm and a concentration of the Ag of
79%= σAg/dm = 55/70. The level of the attenuation at the peak can be estimated from
Figure 6.7 to be about 30 dB/nm. For different ranges of next, we need to consider the
effect of the external refractive index in the sensor performance as illustrated in
Figure 6.4.
6.5 Conclusion
The sensor design was composed of a PCF D-type fiber with metamaterial layer,
and demonstrated the possibility of controlling the losses and operation wavelength of
the sensor over a wide range by changing the relative fraction of the different
materials that compose the metamaterial.
From Table 6.2 we conclude that metamaterials with higher concentrations of Ag
produce narrower resonance peaks, an effect which is especially noticeable for Ag
concentration above 70%. This puts a lower limit to the concentration of Ag, as below
this value, one obtains wide resonance peaks and strong losses, thus resulting in feeble
optical signal and low signal to noise ratios. Figure 6.7 and Figure 6.8 permit to design
and optimize the sensor by allowing us to choose the thickness and concentration of
Ag that yield the best performance for a given spectral range of operation, as well as,
for a specific range of measurement of next.
These results indicate that the use of metamaterials provides not only a way of
improving the performance of SPR sensors on optical fibers, but also to adequately
control and customize the performance characteristics of the sensor. In practice, the

Sensors with metamaterials
92
metamaterial works as an artificial metal with optical properties that cannot be found
in natural materials and can be customized to design specifications of the sensor. The
analysis of the results provides a method of optimization for choosing the best
metamaterial parameters that can be applied in the engineering of these types of
sensors.

93
Chapter 7
Singlemode sensors with wires
In previous chapters we have considered the more conventional design for SPR
sensors, based on a planar metal film deposited on the surface of a fiber. Such
configurations has been extensively studied in literature and their fabrication
techniques are simple and well established [2]. However in the past decade, research
into SPR sensors has shifted into other types of sensor design, and among them into
the study of sensors based on metallic wires or introducing metallic components with
circular profiles. Although more complex than planar metal films, the mode structure
of the metallic wires is not too difficult to calculate, since it is mainly determined by
the cylindrical geometry of the metal and is therefore very similar to the mode
structure of the optical fiber itself.
In this chapter we look into a sensor design which combines a D-type fiber with a
single gold wire mounted on the flat surface of the fiber, parallel to the optical axis,
and we investigate how the geometrical parameters can be used to increase the
sensitivity to the external refractive index. The analysis, based on simulations using a
computer model built on Finite Element Method (FEM), implemented in COMSOL
Multiphysics [45] focus on loss, sensitivity, resolution and operation wavelength. Once
again, this approach allows us to test new sensing concepts and configurations with
considerable economy of time and resources, when compared to an exhaustive
fabrication and test of all possible designs.
Furthermore, in this chapter we define the method used to determine the multiple
modes supported by the metallic wires. In particular, we shall focus on the relevant
modes and investigate their optical properties. Based on this study, we propose a new
design for a SPR sensor based on metallic wire. In this configuration the wire is
incrusted in the surface of the cladding of the fiber, such that it is also in direct control
with the external medium.
We have investigated the optimal radius of the wire and the best distance
between the wire and the core in terms of loss and wavelength of the SPR. We tested
numerically this configuration of SPR sensor in terms of the sensitivity, resolution,
operation wavelength, and compared these results with the performance of a
convectional SPR sensor based on a planar metallic film.

Singlemode sensors with wires
94
7.1 SPR sensor based in metal wire
This high interest has been supported by the development of new fabrication
techniques of micro and nanoscale metallic structures, and have paved the way to the
development of new devices that use the localization of surface plasmons to better
control their properties and achieve higher sensing performances. These approaches
include metamaterials [99], nano and micro structures with different sizes and forms
[100], and their combination with other materials, in a myriad of optical devices,
including optical fibers [101]. The performance of these devices based on metallic sub-
micron structures depends strongly on the fine control and optimization of geometrical
parameters such as the dimensions or relative positions of the components, thus
promoting numerical simulations as the preferred method to explore new sensor
designs in order to reduce time and development costs [20], [97].
Today’s fabrication techniques offer many geometries for the metal components,
ranging from wires and disks to spheres and grooved surfaces, which can be used to
customize the modal dispersion of the plasmons and increase their coupling with light.
In particular, it is possible to couple the modes of a step-index fiber with those of a
metallic wire at certain wavelengths, when some of these modes become phase
matched. Also, metallic wires support multiple modes which permit an increased
number of resonant peaks [102], and result in sensors with different values of
sensitivity, operation wavelength and RI detection range, among others [55], [103].
Some new fabrication techniques (like spliced-fiber with pressure-filling [104], stack-
and-draw technique [105] or pressure assisted melt filling (PAMF) [106]) increased the
possibility of creation of new configurations with more complex geometries allowing
us to produce virtually any nano-structure on an optical fiber [28], [107].
Theoretical and experimental study of the plasmon modes on single wires have
begun in the 70s [141]. Many of the studies of the metallic wires focus on the study of
the two materials (Metal/Silica) [102], interacting with a singlemode fiber [105] or
with photonics crystal fibers (PCF), but without studying the possibility of the creation
of an SPR sensor.
SPR fiber sensors based on metallic wires can be found in the literature, for
instance, Luan [142] presented a microstructured SPR sensor where the silver wire is
placed on top of the fiber. Also in [74] Luan study another SPR sensor based on a wire
localized inside the hollow fiber. In these two cases the wire is completely exposed,
which has the drawback of reducing the robustness of the sensor. Lu [121] presented
another refractive index sensor based on a grapefruit photonic crystal fiber where the
holes are filled with silver wires.
7.2 Singlemode fiber sensor based in SPR with a metal wire on a D-type fiber
We consider the design of the refractive index optical sensor compounded of a D-
type fiber profile with a gold wire mounted on the flat surface, and thus replacing the
metallic film usually considered in literature [45]. The fiber is made up of a
conventional step index fiber compounded by the core, with silica doped with 16%
germanium (nco), and surrounded by a pure silica cladding (ncl), whose refractive

Singlemode sensors with wires
95
indexes were calculated using the Sellmeier equation (see equation 3.25). The
effective refractive index (nm) of gold is calculated using the Drude equation (see
equation 3.30). The wire is partially embedded on the surface of the fiber to improve
mechanical resistance of the device as well as the optical coupling both to the core
and to the external medium (as illustrated in Figure 7.1). In the computer model, the
space surrounding the fiber is filled with the analyte, characterized by an external
refractive index next. The relevant geometrical parameters are the distance between
the center of the fiber and the center of the metal d, the radius of the core rco and
the radius of gold wire rE.
Figure 7.1 Schematic of the SPR D-type fiber with a gold wire configuration, with the inset of zoom of the core and metal wire.
The study is based on the calculation of the guided modes taking into account both
the D-type fiber and the wire, referred as supermodes (SMs), since they correspond to
the hybridization of the individual modes of each of the structures that compose the
device taken isolated, namely the fundamental guided mode of the fiber and the
plasmon modes in the metal wire. All these modes are calculated numerically by
solving the wave equation for the Fourier components of the electric field (equation
3.73).
7.2.1 Description of the isolated modes and the supermodes
In this section we investigate the real and imaginary part of the refractive index of
the sensor in terms of the number and characteristics of the resonance peaks, and
compare the performance of the sensor with the configuration most commonly
described in literature, specifically a D-type fiber covered with a metal film [45].
Figure 7.2a shows the RI real part of the plasmon modes of the wire (m = 0, 1, 2)
and the fundamental mode of the optical fiber. Figure 7.2a also shows the RI imaginary
part of the sensor as function of the wavelength between 600 and 950 nm. The crossing
between the dispersion curves of the modes of the metal wire and the fundamental
mode of the fiber are indicated by squared dots. These correspond to the peaks
designated by the circular red dots in the imaginary part of the effective refractive
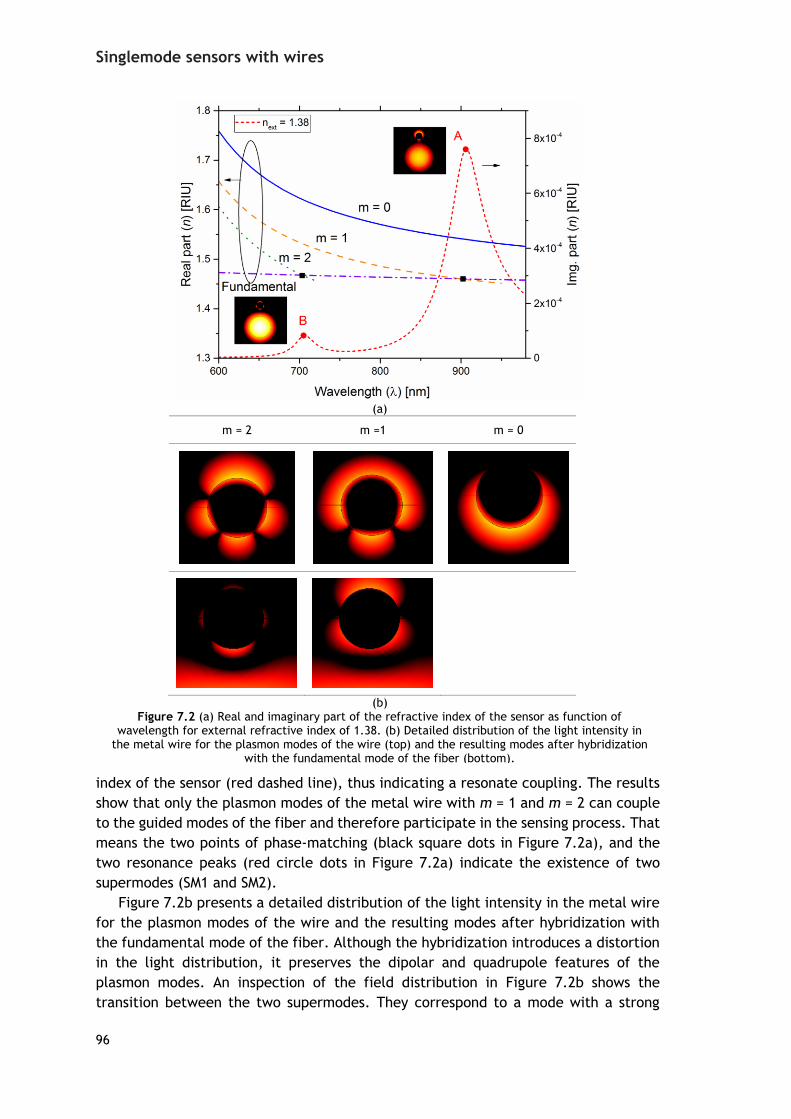
Singlemode sensors with wires
96
index of the sensor (red dashed line), thus indicating a resonate coupling. The results
show that only the plasmon modes of the metal wire with m = 1 and m = 2 can couple
to the guided modes of the fiber and therefore participate in the sensing process. That
means the two points of phase-matching (black square dots in Figure 7.2a), and the
two resonance peaks (red circle dots in Figure 7.2a) indicate the existence of two
supermodes (SM1 and SM2).
Figure 7.2b presents a detailed distribution of the light intensity in the metal wire
for the plasmon modes of the wire and the resulting modes after hybridization with
the fundamental mode of the fiber. Although the hybridization introduces a distortion
in the light distribution, it preserves the dipolar and quadrupole features of the
plasmon modes. An inspection of the field distribution in Figure 7.2b shows the
transition between the two supermodes. They correspond to a mode with a strong
(a)
m = 2 m =1 m = 0
(b) Figure 7.2 (a) Real and imaginary part of the refractive index of the sensor as function of
wavelength for external refractive index of 1.38. (b) Detailed distribution of the light intensity in the metal wire for the plasmon modes of the wire (top) and the resulting modes after hybridization
with the fundamental mode of the fiber (bottom).

Singlemode sensors with wires
97
dipolar moment (peak A) and another with a strong quadrupole moment (peak B),
which are illustrated in Figure 7.2b [102]. However, this coupling is not exclusive and
indeed each of the supermodes results from a combination of all three modes (a guided
mode and the two plasmon modes). In this work, we focus on SM1 (peak A,
corresponding to a mode with a high dipolar mode) because it has a better potential
for sensing due to the higher attenuation.
7.2.2 Effects of the different parameters
In literature the two main parameters considered in the study of the SPR D-type
fiber sensor with a metal film are the thickness (in our proposal, corresponding to the
radius of the wire) and the distance between the waveguide and the interface
metal/external refractive index [1]. In the case of the sensor with a metal film, the
study of the effect of these parameters and others are well detailed in literature [1].
In the case of the metal wires, some studies can be found. For example Schmidt in
[102] studied the effect of the diameter of the wire embedded in silica in the SPR,
while Luan in [142] positioned the wire in the external medium. However, no study
considers a wire anchored between the two media, namely the cladding and the
external medium, as illustrated in Figure 7.1.
Figure 7.3 presents the behavior of our sensor proposal with a metal wire anchored
between the two media for different distances of the metal wire relative to the center
of the core (Figure 7.3a) and for different values of the radius of the wire (Figure
7.3b). Figure 7.3a also shows the light intensity distribution along a cutplane of the
sensor.
In Figure 7.3a it is possible to observe that the intensity of the loss is reduced for
larger distances between the wire and the core, which is similar to the effect observed
in SPR D-type fiber sensors based on metallic films [45] when increasing the distance
between the core and the film. For the second peak (SM1), the values of d shorter
than 2 µm imply an excess of losses that limit a practical sensor, so we fix d = 2 µm,
which yields a value of loss similar to those found in literature [143].
The results in Figure 7.3b show a stronger shift in wavelength of the supermode
with dipolar moment (SM1) for larger wire radius, especially when compared with the
smaller wavelength shift observed for the supermode with quadripolar moment (SM2),
resulting in a higher sensitivity for supermode SM1. Comparing the shifts in wavelength
of the second peak (SM1) produced by changes of external refractive index in wires
with different radius, it is possible to conclude that the best sensitivities are obtained
for rE =300 nm. Therefore, the radius of the gold wire was set to be rE = 300 nm, which
is compatible with the current fabrication techniques [14, 18].
To identify the advantages of the metallic wire, we compare the performance of
our sensor with an analogous design also based on a D-type fiber but with a metal film
with 45 nm of thickness mounted on the flat surface. Indeed, in literature, the metal
films of these type of sensors range from 45 nm to 60 nm, depending on the fabrication
techniques and whether combine metal or other types of coupling layers, to further
boost performance [1], [143]. We have chosen the value of 45 nm to gauge the
improvement in sensing performance of our proposal against the best performing
sensor with a film without coupling layers [45], [143]. Both the reference sensor and

Singlemode sensors with wires
98
our proposal consider d = 2 µm and rco = 1 µm. For these structural parameters and for
next = 1.38 the wire supports three modes in the spectral range between 600 and
1000 nm and with two SMs, as shown in Figure 7.3 [102].
7.2.3 Resolution, sensitivity and operation range
We can calculate the Attenuation as a function of the wavelength for different
values of the external refractive index considering the propagation of light through a
fiber length of L = 1 mm, as shown in Figure 7.4. The figure shows the comparison
between the attenuation curves as function of wavelength for two configurations of
sensors, one with the metal wire (as described in Figure 7.1) and another where the
(a)
(b)
Figure 7.3 Attenuation curves as a function of wavelength for different distances between the center of the metal with the center of the fiber core (a) and for different radius of the metal (b). In the inset of Figure 7.3a, it is also shown the intensity of the electric field distribution along a
cutplane of the sensor, corresponding to the supermodes of the two peaks (SM2 and SM1).

Singlemode sensors with wires
99
wire is replaced by a metal layer/film with 45 nm of thickness, for different ranges of
the external refractive index, 1.30 to 1.34 and 1.36 to 1.40, shown in Figure 7.4a and
Figure 7.4b, respectively.
In Figure 7.4a the results show that the sensor with the metal layer only supports
one resonant peak for this spectral range, whereas the sensor with the metal wire
supports two, both of which can be strongly shifted in wavelength by a change in the
external refractive index. For the peak in the right, this shift is complemented by an
increase in the losses for higher refractive indexes. Figure 7.4b shows that for external
refractive indexes above 1.36 these effects are even stronger, indicating better
(a)
(b)
Figure 7.4 Comparison between the attenuation curves as function of wavelength for two configurations of sensors, one with the metal wire (dotted curves) (as described in Figure 7.1) and another where the wire is replaced by a metal layer/film with 45 nm of thickness (solid curves).
The external refractive index varies between 1.30 and 1.34 in Figure 7.4a and between 1.36 to 1.40 in Figure 7.4b.

Singlemode sensors with wires
100
sensitivities. Figure 7.4 also indicates that the design with the metallic wire provides
a stronger coupling (higher losses) between the plasmons modes with the external
medium and the fundamental mode than the design with a metallic film. In both cases,
the fine tuning of the amount of losses can be done by varying the spacing between
the metal and core, as shown before in [45] for the metal film and in Figure 7.3b for
the metal wire.
The values of sensitivity, sensor resolution and spectral operation range for the
two designs are presented in Table 7.1, for different intervals of external refractive
index.
Table 7.1 Sensitivity, resolution and range of wavelength values for the refractive index optical fiber sensors based on two forms of metal inclusions (film with 45 nm of thickness and wire with 300 nm of
radius).
Sensitivity (nm/RIU)
Resolution (RIU) Range λ (nm)
Range of next Film Wire Film Wire Film Wire
[1.30,1.32] 700 891 1.4×10⁻⁵ 1.1×10⁻⁵ 560-580 720-740
[1.32,1.34] 900 1437 1.1×10⁻⁵ 7.0×10⁻⁶ 580-600 740-770
[1.34,1.36] 1300 2562 7.7×10⁻⁶ 3.9×10⁻⁶ 600-620 770-820
[1.36,1.38] 2000 4287 5.0×10⁻⁶ 2.3×10⁻⁶ 620-660 820-900
[1.38,1.40] 3200 8437 3.1×10⁻⁶ 1.2×10⁻⁶ 660-720 900-1070
The sensitivity and the resolution were computed using equations 3.71 and 3.72,
respectively, and assuming that it is possible to detect experimentally a spectral
variation of 0.01 nm. The results clearly show that the sensor with the metallic wire
with 300 nm of radius outperforms its counterpart with a metallic film with 45 nm of
thickness in all situations, as expected from Figure 7.4.
7.3 Conclusion
The results in this chapter reinforce a new trend in the field of SPR sensors that
claim that replacing a metal film with a nanoscale metal structure can increase
tremendously the sensitivity of the sensor, not only by increasing the shift of the
plasmon resonance wavelength when the external refractive index changes, but also
the amount of losses that are also increased. The main advantage of nanoscales metal
structures is that they can support several plasmon modes which are strongly
dependent on the geometry and therefore are more dramatically affected by changes
in the boundary conditions of the field. Also, by carefully controlling the geometrical
parameters of the metal structure, such as size, it is possible to improve the
phase/dispersion matching between plasmon modes in the metal and the guided
modes in the fiber, producing a stronger coupling between them. As a result, the
supermodes that are produced by the hybridization of the plasmon and guides modes,

Singlemode sensors with wires
101
are strongly dependent on the external refractive index, which in turn ensures a
dramatic increase of the sensitivity of the sensor, relative to more conventional
configurations.
In particular, and comparing the configurations of Table 7.1, for the low values of
the external refractive index, for example next = [1.30, 1.32], the metallic wire D-type
fiber sensor showed a higher performance, enhancing the sensitivity from 700 to
892 nm/RIU, when compared with metallic film. For higher values of the external
refractive index (next = [1.38, 1.40]) our sensor presents a sensitivity of 8437 nm/RIU,
that compares with the 3200 nm/RIU obtained for the sensor based on the metal film,
and about 1.4 times better than the results obtained in reference [143] using Bk7,
where a sensitivity of 6000 nm/RIU was obtained. In terms of resolution, the design
based on the wire presents better values in all ranges, when compared with the metal
film configuration.
Finally, and as shown in Figure 7.2, the multiple modes supported by the metallic
wire permit to develop several sensors for different wavelengths of operation by using
distinct modes of resonance.

Singlemode sensors with wires
102

103
Chapter 8 Multimode sensors with wires
Throughout this thesis we have systematically investigated the main aspect and
design features that can contribute to an improvement in performance of SPR fiber
sensors. We started in Erro! A origem da referência não foi encontrada. with the
most basic and well studied configuration of this type of sensors, namely a sensor
composed of a thin film deposited on the side of a single mode fiber, and investigated
how the thickness of this film can be optimized. Then, in Erro! A origem da referência
não foi encontrada. we have shown that is possible in a multimode fiber to introduce
another important degree of freedom: the choice of the optical mode used for sensing.
In a multimode fiber the total sensitivity of the device results from average of the
distinct sensitivity of each of the modes supported by the fiber. In the previous
chapter, we have replaced the thin metal film in a singlemode fiber with a metal wire,
which can support multiple plasmonic modes. Again we have shown the importance of
selecting a specific mode to increase the sensor performance, but this time we have
looked into a choice of the most appropriated plasmonic mode. In this chapter we
combined the results of previous chapters and investigate a device that can support
both multiple optical and plasmonic modes.
Indeed when we look into the research reported in literature of the strong coupling
between the optical mode guided in the core of the fiber and the SPR modes supported
by the metal nanostructures that compose the sensors, we notice that much of the
focus is on the search for the geometry of the metal nanostructures that favor this
coupling and most only consider singlemode fibers. However, little has been
investigated in how to manipulate the nature of the guided modes to improve the
sensing performance, for example using higher order modes in a multimode core rather
than the fundamental mode supported by single mode fibers.
The study of the distribution of light in a multimode fiber and the contribution of
individual modes in the SPR effect has been not yet studied, because there is little
work in filtering particular modes in a multimode fiber. Fontana developed a
theoretical model to determine the distribution of light in a multimode fiber, but the
study is applied only in a few modes [127]. Mao et al. studied the modes found in a
multimode fiber SPR sensor and observed that, for different external refractive
indexes, all the modes presented a similar change in characteristic wavelength and
only a variation occurred in the amplitude of the loss. As a result, the calculation of
the sensitivity was performed for only one mode, since all the other modes presented
similar values [144]. Cennamo et al. reached the same conclusion in the numerical
simulation [109]. The problems with the numerical study of a multimode fiber SPR

Multimode sensors with wires
104
sensor are the large dimension of the model (core and film of the metal have hundreds
of μm), and the size of the elements in the mesh need to be at least 10 times inferior
of the wavelength of the sensor (a few nm), that means, very small size elements and
a fairly large number of them [45]. These two characteristics in conjunction are not
easy to simulate with the FEM, since it requires a lot of computing time and memory
to perform the study. One solution is to optimize the mesh so that the small elements
are located only in the important areas. The problem with this approach is an increase
of the computation of error.
The singlemode fiber SPR sensor with a metallic wire was presented in the previous
chapter and we have shown that the confined nature of the plasmon modes in
nanowires could provide a stronger coupling between light and the plasmons. Based
on those results shows on Erro! A origem da referência não foi encontrada., we
investigate, in this chapter, the occurrence of multiple modes found in a plastic and
silica multimode optical fiber and the effect of the SPR in some modes of interest. To
our knowledge, the study of a multimode fiber with a metallic wire to form an SPR
fiber sensor has not been studied yet. We also compare the sensitivity, resolution and
the wavelength range when using the fundamental mode or other higher mode.
8.1 Optimization of modal sensitivity in nanowire SPR
multimode sensor
In this section, we investigate some modes of interest found in a multimode fiber,
which in conjunction with a metallic wire are able to form an SPR sensor. We also
compare the sensitivity, resolution and the wavelength range of the SPR sensors when
using the fundamental mode or another higher mode of the multimode fiber.
8.1.1 Design parameters
We consider a D-Type, step-index core multimode fiber, where a wire of gold
(radius ≈ 300 nm), parallel to the core, is deposited [105]. The fiber arrangement is
shown in Figure 8.1.

Multimode sensors with wires
105
Figure 8.1 Schematic of the proposed SPR D-type multimode fiber.
The fiber structure is composed by a core (silica doped with 16% GeO2) with
refractive index nco and by a cladding (pure SiO2) with refractive index ncl, both
calculated using the Sellmeier equation 3.25. The complex refractive index of the wire
(gold) is denoted by nm and is obtained from the Drude model of equation 3.30. The
distance between the center of the core and the center of the wire is d. The radius of
the core is rco, the radius of the wire is rE and the refractive index of external medium
is next.
8.1.2 SPR in the multimode fiber
Using equation 3.36 with the parameters d = 5.5 µm, rE = 300 nm, rco = 5 µm and
next = 1.34, it is possible to obtain Figure 8.2. This figure shows the loss as function of
wavelength for different modes found in the multimode fiber. The modes are named
accordingly with the direction of the incident beam (p or s), number of rings and the
number of spots in the core border. For example, in Figure 8.2, the red dashed line is
mode MP,3,5. Also Figure 8.2 shows also the distribution of the light and the loss of six
modes found in the multimode fiber. From left to right the modes go from the
fundamental mode to the chosen higher order modes.

Multimode sensors with wires
106
Figure 8.2 Attenuation as a function of wavelength for different modes. The distribution of light intensity for each different mode is also presented.
These light distributions show that for higher order modes, the effect of the wire
in the light distribution is more noticeable due to the break of symmetry. For example,
mode MP,3,5 shows clearly a break in the symmetry of the light spot. This symmetry
break can produce an increase or a decrease in the RIU detection due to the different
energy that reaches the external medium. Also, we can observe that higher order
modes with a p-polarized (MP) present a higher magnitude of loss and a shift to longer
wavelengths when compared with the fundamental mode. The mode with a s-polarized
(MS) has a very low loss, but maintains a shift to the right when compared with the
fundamental mode.
8.2 Sensitivity of two modes in the SPR multimode fiber
In this section, we study the fundamental mode and MP,3,5 mode, considering only
one mode is propagated in the fiber at a certain time. Figure 8.3 shows the attenuation
as function of the wavelength for different values of external RI.
Figure 8.3a shows the behavior of the sensor for the fundamental and the MP,3,5
modes. Figure 8.3b is a magnification of Figure 8.3a for the fundamental mode. In this
case, the resonance occurs when the effective refractive index of the wire is equal to
the effective refractive index of the fiber [107]. Mode MP,3,5 has a maximum of loss of
9.5 dB/mm and the max loss of the fundamental mode is 0.62 dB/mm. In wavelength:
the shift of the sensor from 1.30 to 1.38 RI is 725 to 950 nm and 710 to 850 nm for the
MP,3,5mode and for the fundamental mode, respectively. In both parameters of
measurement (loss and wavelength shift) mode MP,3,5 presents better characteristics.
Figure 8.3c represents the distribution of light intensity for the mode MP,3,5 and the
fundamental mode.
Other parameters of comparison are the sensitivity, the resolution and operation
range of the detection of the sensor. The sensitivity and resolution can be calculated
using equation 3.71 and equation 3.72, respectively. The minimum value of the

Multimode sensors with wires
107
experimental detection considered was 0.01 nm. Using theses equations and the
information extracted from Figure 8.3a and Figure 8.3b we can build Table 8.1 showing
the sensitivity, resolution and range of wavelength for different values of the next.
Table 8.1 shows a better sensitivity, resolution and wavelength range for the mode
MP,3,5. The sensitivity for the [1.36, 1.38] range of next for the fundamental mode is
3110 nm/RIU, while for mode MP,3,5 is 5340 nm/RIU. To our knowledge, this
configuration presents one of the highest values for sensitivity found in literature, for
the considered RI range, using sensing configurations based on SPR fiber sensors with
a metal wire or film [107], [145].

Multimode sensors with wires
108
(a)
(b) (c)
Figure 8.3 Attenuation as function of wavelength for different values of the external refractive index for: (a) the fundamental mode (solid line) and the MP,3,5. (dashed line), (b) magnification of the fundamental mode behavior. (c) The distribution of light intensity for the MP,3,5 mode and the
fundamental mode.

Multimode sensors with wires
109
Table 8.1 Sensitivity, resolution and wavelength range for the fundamental and MP,3,5 modes
S(nm/RIU)
Resolution (RIU)
λ Range (nm)
Range of next
Fundamental MP,3,5
Fundamental MP,3,5
Fundamental MP,3,5
[1.30, 1.32]
680 910
1.47×10⁻⁵ 1.10×10⁻⁵
700-720 731-750
[1.32, 1.34]
1120 1580
8.93×10⁻⁶ 6.33×10⁻⁶
720-745 750-780
[1.34, 1.36]
1930 2860
5.18×10⁻⁶ 3.50×10⁻⁶
745-780 780-840
[1.36, 1.38]
3110 5340
3.22×10⁻⁶ 1.87×10⁻⁶
780-850 840-945
The challenge of this configuration is to cancel the noise caused by the multiple
modes that propagate in the core, which originates a low sensitivity and low loss.
Considering Cennamo et al. work in [109] it is possible to filter a group of modes,
which in our work will result in a sensor with increased performance, better sensitivity,
resolution and operation wavelength range.
8.3 Conclusion
The techniques more common to improve or to optimize the characteristics of the
SPR sensors are focused on the optimization of geometric parameters, like the distance
between core and the metal or the external medium, thickness of metal, type of
materials to generate the SPR, structure of the sensor, type of overlayer, among
others. In most of these cases, the fundamental mode is always present. The results
in this work show a new approach to optimize an SPR sensor, using the selection of
higher order modes in a multimode fiber. The higher order modes have characteristics
that can increase the interaction of the external medium with the waveguide (core),
because more optical power is localized in the core boundaries, at the same time the
metal wire change the conventional distribution of light in the multimode fiber.
This new approach permits to enhance the performance of the sensor by increasing
the sensitivity, resolution and operation wavelength range. Comparing the results of
Table 8.1, the MP,3,5 mode showed a higher performance when compared with the
fundamental mode, enhancing the sensitivity from 680 to 910 nm/RIU for next = [1.30,
1.32] and from 3110 to 5340 nm/RIU for next = [1.36, 1.38]. In terms of resolution, the
design based on the wire also presents better values in all ranges, showing a value of
1.87×10⁻⁶ for next = [1.36, 1.38]. The challenge of this approach is the required filtering
to select the appropriate modes to enhance the sensor operation.

110
Chapter 9 SPR sensor with wires for simultaneous measurement of refractive index and temperature
The previous chapters have pursued the optimization of SPR sensors in optical
fibres by exploring the coupling between light and plasmonic modes in different ways.
However one aspect has remained constant: SPR sensors are sensitive mainly to
refractive index of an external medium. Not surprisingly, many of the SPR sensors
designs targeted at measuring other physical, chemical or biological parameters are
based on finding ways for these parameters to affect the refractive index of a test
medium. Therefore, these SPR sensors measure a wide variety of parameters
indirectly.
However, one must not think that plasmons are only responsive to changes in the
optical properties of materials in the vicinity of the metal surface, since the electrical
characteristics of metals can also be altered by factors such as temperature. Indeed,
in real SPR sensors the measurement of refractive index is affected by the temperature
of the external medium, which may heat or cool down the metal, altering the density
of conduction electrons and ultimately changing the resonance conditions between
light and the plasmons. For most metals, this is a secondary effect but that can still
introduce readout errors in the values of the refractive index. The solution to this
problem is to measure simultaneously and independently both the external refractive
index and the temperature, and use the latter to calibrate dynamically the former. In
other words, to correct the measurement of refractive index by incorporating
information about the temperature.
In most situations the measurement of temperature is done using sensing principles
other than SPR. On the other hand, a recent trend in the field of optical sensing is the
attempt to integrate multiparameter sensing in a single device. However, most of
these are not constituted by a single sensor that measure different parameters but
rather a sequential or parallel combination of multiple sensors, each targeting a single
parameter. This is the same type of solution used in more sophisticated SPR sensors to
discount the impact of temperature from the measurements of refractive index, as
previously mentioned.
In this chapter we use the know-how acquired throughout this thesis to address
these issues and propose a design of a single fiber sensor that measures simultaneously

SPR sensor with wires for simultaneous measurement of refractive index
and temperature
111
and independently refractive index and temperature using SPR as sensing principle. In
more detail, we developed a sensor combining several metallic wires that exhibit
resonance peaks in different wavelengths. We show that one of these peaks is
practically only sensitive to the refractive index whereas the other practically only
responds to changes in temperature. This is achieved by allowing one wire to be
partially incrusted at the surface of the fiber cladding and in direct contact with the
external medium (this wire is responsible for the measurement of the external
refractive index), while the other wires are completely inside the fiber cladding (this
set of wires is responsible for the measurement of temperature). We follow the
approach detailed in Chapter 7 to investigate the coupling between the wires modes
and the single mode fiber for our SPR sensor, by studying the impact of the wire radius
and distance between the wire and the core in the sensor attenuation and on the
wavelength of resonance and ultimately in the sensor performance.
In this chapter we continue to use the method to determine the multiples modes
in the metallic wires with different peaks of resonance in different wavelengths, to
measure in each peak two parameters: the external refractive index and the
temperature. We have improved the method to define multiple peaks with multiple
wires.
9.1 Introduction of the SPR sensor for measurement of temperature
In the past years, there has been much research in the development of refractive
index sensors based on surface plasmon resonances (SPR) because of their high
sensitivity [1]. SPR sensors use the excitation of a charge-density oscillation (i.e.,
surface-plasmon wave) along the metal-dielectric interface by p-polarized light, which
satisfies certain resonance conditions dependent on the geometric and optical
properties of the components and of the analyte medium [25], [115], [146]. This type
of sensor is also used as a biosensor, and consists in one ligand layer, immobilized over
the metal, and the analyte flows across it; the changes in the refractive index of the
solution allow to characterize the analyte [33]. These sensors can also be adapted to
measure other parameters, such as temperature [28] and pressure [147], typically by
including components whose size and optical properties strongly depend on each of
the desired physical parameter [148]. One of the challenges remaining is the
development of simple sensing configurations that can measure simultaneously more
than one parameter, such as refractive index and temperature. In fact, the influence
of temperature in changing the dimensions and optical properties of the components
of the sensor has many times been considered to be an engineering problem that limits
the operation of the sensor. For this reason, there is a necessity to have simultaneous
measurement of temperature and refractive index.
Sensors based on SPR are notorious for having high sensitivity to variations of
refractive index, but the direct impact of temperature changes on the modal
structures of surface plasmons results from a combination of a small change in the
optical properties and the thermal expansion of the metal. These produces very small
wavelength shifts in the plasmon resonances when compared with those produced by

SPR sensor with wires for simultaneous measurement of refractive index
and temperature
112
changes in the refractive index. One solution is to use separate sensors to do
independent measurement of refractive index and of temperature, using distinct
sensing principles. Temperature measurements are usually based on sensor
components that have large thermo-optical or thermal expansion coefficients, usually
interferometric in nature and including optical fiber gratings, such as fiber Bragg
gratings (FBGs) and long-period fiber gratings (LPGs), as well as, multimode
interference and high-birefringence fiber loop mirrors [149], [150].
In SPR sensors, variations of temperature change many of the properties of the
fiber (via thermo-optic effect) and of the metal (via phonon–electron scattering along
with electron–electron scattering), thus affecting wavelength interrogation, and
therefore the sensitivity. In sensors supporting localized SPR, thermal expansion of the
different materials may alter dimensions and even further affect the operation of the
RI sensor [151].
In this chapter we address two main challenges: First to measure simultaneously
temperature and refractive index of the analyte medium; Second, to have plasmon
resonances that present strong dependency to just one of the physical parameters
under analysis and thus separate their measurement. In our proposal, we consider a
fiber sensor combining multiple metal wires and supporting several SPR resonances,
that allows us to use two wavelengths to measure both temperature and refractive
index simultaneously.
9.2 Consideration of temperature in the calculation
In Erro! A origem da referência não foi encontrada. we presented the equation
of Sellmeier and the model of Drude for the characterization of the materials in our
sensor, and considering the temperature does not change. In this section, we explain
the temperature model and the contributions from the thermo-optic effect in the fiber
and in the sensing layer. The calculations are done in two steps: first, we calculate
the optical properties of the different materials for a given temperature, including the
contributions of the phonon–electron scattering and the electron–electron scattering
in the case of the metal, and second, we use these values in a computer model based
on FEM and implemented in COMSOL to determine the solutions of the electromagnetic
field equations, corresponding to the optical modes of the sensor.
9.2.1 Sellmeier equation with temperature variation
We consider a fiber core of pure silica with a 16% doped GeO2-SiO2 glass and the
cladding is made out of pure silica. The dependence of the refractive index with
wavelength of pure silica and X doped with GeO2-SiO2 glass follows the Sellmeier
relation according to equation 3.25. The values of these parameters are represented
in Table 3.1. The effect of temperature in the fiber is defined using the thermo-optic
coefficient (1.28×10⁻⁵ K) [88], [151].
9.2.2 Drude model with temperature variation.
In describing the optical properties of the metal and its dependence on the
temperature we adopted the model by Alabastri in [152]. The complex and frequency-

SPR sensor with wires for simultaneous measurement of refractive index
and temperature
113
dependent dielectric function of any metal can be appropriately represented by the
Drude-Lorentz formula as function of the frequency (ω):
k
j i
f
Ti
TT
jj
pj
t
p
r
1)(
)(1),(
22
22
(9.1)
where the first and second term takes into account the contribution from the
conduction electrons. The influence of the temperature (T) is included in the
parameters )(Tt and )(Tp , which correspond to the total collision frequency and
plasma frequency, respectively. The third term describes the interband absorption where k is the number of oscillators with frequency ωj, strength fj, and lifetime 1/
j
, defined by the damping of each oscillator (j ). The values of these parameters for
gold are shown in Table 9.1 and are based in the Lorentz-Drude model [87].
Table 9.1 Values of the Lorentz-Drude Model parameters in electron volts [87].
Strength (jf ) f0 f1 f2 f3 f4 f5
Au 0.760 0.024 0.010 0.071 0.601 4.384
Damping ( j )
0 1 2 3 4 5
Au 0.0529 0.241 0.345 0.870 2.494 2.214
Frequency ( j) - ω1 ω2 ω3 ω4 ω5
Au - 0.415 0.830 2.969 4.304 13.32
The plasma frequency at ambient temperature is defined by:
2
*
004 Ne
mff pp
(9.2)
where N, m* and e represent the density, the effective mass and the charge of the
electrons, respectively, f0 is the oscillator strength (Table 9.1). The plasma frequency
varies with temperature due to volumetric effects according to:
2/1)(1)( 0
TTT epp (9.3)
where γe = 14.2×10⁻⁶ per K is the expansion coefficient of the metal (Au) and
T0 = 293.12 K is the room temperature, which is considered as the reference
temperature.
The total collision frequency is given by
)00 ()()( TTTt (9.4)
where 0 is the damping coefficient (Table 9.1) and )(T is the dependence of the
collision frequency at the temperature, which depends on two factors: phonon–electron scattering and electron–electron scattering. Their respective contributions are
cp and ce .

SPR sensor with wires for simultaneous measurement of refractive index
and temperature
114
The phonon–electron scattering can be modeled by using the Holstein model of
phonon-electron scattering [152]:
TT
z
D
cp
D
e
dzz
T
TT
/
0
45
01
45
2)( (9.5)
where TD = 170 K is the Debye temperature.
The electron–electron scattering frequency is modeled according to the model
proposed by Lawrence, based on the Born approximation and on the Thomas–Fermi
screening of the Coulomb interaction [152]. The corresponding result can be obtained
in terms of the Fermi energy (EF) of the metal electrons as:
2
2
24
46
1)(
hTk
hET B
F
ce (9.6)
where Γ = 0.55 is a constant, giving the average over the Fermi surface of the
scattering probability, Δ = 0.77 is the fractional Umklapp scattering, EF = 5.53 eV is
the Fermi energy, h is Planck’s constant and kB is Boltzmann’s constant. Thus equation
3.25 using the thermo-optic coefficient (1.28×10⁻⁵ K) optical parameter, together
with (9.1)– (9.6), completely represents the temperature-dependent dielectric
constant of the metal. Apart from its dielectric constant, the thermal expansion of
metal film, is also important. It should be noted that for the calculation of thermal
expansion of the film one should not use the linear thermal-expansion coefficient
(α = 1.42×10⁻⁵) of the bulk material. Since the wire may only expand into the normal
direction, one has to employ a corrected thermal-expansion coefficient α’ for the
expansion of the film thickness. The corresponding expression is
)1(
)1('
(9.7)
where μ = 0.44 is the Poisson number of metal. Since μ has a value in the vicinity of
0.3, α’ is almost twice the usual thermal-expansion coefficient α, which indicates the
importance of this correction [151].
9.3 Plasmonic measurement of refractive index and temperature based on a D-type fiber sensor with gold wires
We consider the design of a refractive index optical sensor composed of a D-type
fiber profile with a gold wire mounted on the flat surface, thus replacing the metallic
film usually considered in literature [45]. Three extra metal wires are implanted in
the fiber cladding (as illustrated in Figure 9.1). The fiber consists in a conventional
step index fiber compound by the core with silica doped with 16% germanium (nco) and
surrounded by a pure silica cladding (ncl). The top metal wire is partially embedded on
the surface of the fiber cladding, to improve mechanical resistance of the device as
well as optical coupling to both the core and the external medium, and this is the
external wire, with radius rE. The other three metal wires are placed around the core,

SPR sensor with wires for simultaneous measurement of refractive index
and temperature
115
embedded in the cladding to increase the sensitivity to temperature and not exposed
to the external medium. These are the internal wires, with the radius of each wire
being rI. In the computer model, the space surrounding the fiber set is filled with the
analyte, referred as the external refractive index next. The relevant geometrical
parameters are: the distance between the center of the fiber and the center of the
external wire and the internal wires defined as d and dI, respectively and the radius
of the fiber core rco.
Figure 9.1 Schematic of the proposed SPR D-type fiber.
The metal wire on the surface of the fiber (external wire) is in direct contact with
the analyte and therefore supports surface plasmon modes that are primarily sensitive
to changes in the external refractive index. On the other hand, the remaining wires
(internal wires) support surface plasmon modes that are influenced mainly by changes
in temperature, through their dependency on the optical properties of the metal.
The spectral characteristics of the plasmon modes supported on the external metal
wire and the associated resonance are determined mainly by the wire radius (rE) and
the boundary conditions imposed by the refractive index of the external medium. A
second plasmon resonances is supported by the remaining internal wires, which
depends mainly on their radius (rI), but also on their relative positions and distances
to core of the fiber. These three wires support more than one plasmon mode with
distinct sensitivities to temperature. One of the plasmon modes is selected
accordingly, to optimize the sensor performance. In terms of spectral features
observed in the imaginary part of the effective refractive index of the fiber sensor,
we are able to obtain two resonance peaks, the first peak is used to measure the
external refractive index and the second to measure the temperature.
9.3.1 Study of sensor behavior as function of the external refractive
index variation
In this section we study the behavior of the external refractive index sensor in
terms of sensitivity and resolution. In this study we have not considered the effect of
temperature, hence the results correspond only to the reference temperature. The

SPR sensor with wires for simultaneous measurement of refractive index
and temperature
116
sensor parameters used were = 2 µm, rco = 1 µm, the radius of the external gold wire
is rE = 300 nm.
Figure 9.2a shows the real part of the effective refractive index of the modes
supported by the wires and the fundamental mode of the fiber in the range between
600 to 1000 nm. In this spectral range there are three modes for the external wire
(identified with mE = 0, 1 and 2, depending on the dipole moment of the modes,
respectively with null, dipolar and quadripolar modes), which intercept the
fundamental mode of the fiber at two points (black squares in Figure 9.2a). Notice
that the mode of the external wire with mE = 0 does not couple with the fundamental
mode of the fiber, due to poor phase matching conditions, and it is necessary to work
with modes with higher m. Also, it is necessary to choose the radius of the internal
wires (rI) such that the corresponding resonances do not overlap with those associated
with the modes supported by the external wire. This produces a spectral separation of
the different resonances, which facilitates their independent measurement. In
particular, we have chosen rI = 500 nm, that supports two modes in the spectral range
between 600 to 1000 nm (identified with mI = 2 and 3, and corresponding to modes
with quadripolar and hexapolar moments, respectively), as shown in Figure 9.2. This
solution also intercepts the fundamental mode in two points (blue triangles in Figure
9.2a).
Figure 9.2a also shows the imaginary part of the effective refractive index of the
sensor (green dotted curve), which presents four resonances (green circles). At points
A and C, they correspond to the resonant coupling between the fundamental mode of
the fiber and the modes with mE = 2 and mE = 1, and at points B and D they correspond
to the resonant coupling between the fundamental mode of the fiber and the modes
with mI = 3 and mI = 2, respectively. The amplitude of the peaks selected for sensing
can be optimized by the distance between the internal wires and the fiber core,
therefore controlling the intensity of the coupling between the fundamental mode and
each of the internal wire modes. In our case, this optimization resulted in the value
dI = 4 µm. The characteristics of the resonance point D are studied in more detail in
the next section. Figure 9.2b and Figure 9.2c show the distribution of light intensity in
the fiber for the resonant wavelengths and illustrates the transition in their
characteristics.
In all four cases presented, we clearly identify the contribution from the
fundamental mode of the fiber, which determines the distribution of light at the
center, while the main differences occur near the wires. At wavelengths near
resonance A, the external wire supports a quadrupole mode (mE = 2), while the modes
in the internal wires present six intensity modes in the border of the metal, indicating
a predominant hexapolar mode (mI = 3). Near resonance B, the character of the mode
near the external wire transits to a strong dipolar moment. Resonances C and D

SPR sensor with wires for simultaneous measurement of refractive index
and temperature
117
correspond to an intensity distribution with strong dipolar moment near the external
wire and strong quadripolar moment near the internal wires. There is however a
(a)
A B
C D
(b)
Wires A B C D
External
Internal
(c) Figure 9.2 (a) Real part (solid line) and imaginary part (dot line) of the refractive index of the sensor as a function of wavelength for external refractive index of 1.38. Also, we represent the
dispersion curves of the metal wires for the external modes, mE (dashed line) and for the internal modes, mI (dashed-dot line). The crossings between the dispersion curves of the modes in the metal wires and the fundamental mode of the fiber are indicated by square and triangle dots created by the external wire (RI) and the internal wires (T), respectively and these points are represented by
the circular green circles in the imaginary part of the effective refractive index of the sensor (green dot line). (b) Distribution of light intensity in the sensor in the referred points. (c) Detail of the
distribution of light intensity near the external and the left internal wire in Figure 9.2b.

SPR sensor with wires for simultaneous measurement of refractive index
and temperature
118
significant difference in the light distribution of these resonances: while for resonance
C the electric field between the internal wires and the core changes sign, for
resonance D the sign is preserved. This is similar to the even and odd plasmon modes
produced by the coupling of surface plasmons located at opposite surfaces of a thin
metal film [153]. The practical difference between these two resonances is that while
resonance C is very sensitive to changes in the refractive index, resonance D is mainly
sensitive to temperature.
Figure 9.3 shows the attenuation as a function of wavelength for different values
of external refractive index, with a constant temperature, calculated according to
(equation 3.36). The sensitivity (S) and the resolution (R) of the sensor are expressed
in Table 9.2 and were obtained assuming that it is possible to detect experimentally a
spectral variation of 0.1 nm, using the data in Figure 9.3 and equations 3.71 and 3.72.
Figure 9.3 Attenuation as function of wavelength for different values of external refractive index with
four metallic wires, for d = 2 µm. The range of external refractive index is from 1.30 to 1.38. In the curve for next=1.38, the two peaks with higher wavelengths are partially overlapped, which makes at extremely difficult to measure the central wavelength for the weaker peak, and therefore limits the
range of operation of the sensor.
The sensitivity and resolution show a good sensor performance when compared
with other fiber sensors based on SPR in metal wires. For instance, Luan [142]
presented a refractive index sensor where a silver wire is placed on top of the fiber,
achieving a sensitivity of 2700 nm/RIU in the wavelength range from 698 to 728 nm for
next = 1.33 to 1.34. Although such a sensitivity value is slightly better than in our sensor,
it results from the wire being completely exposed, which has the drawback of reducing
the robustness of the sensor. Lu [121] presented another refractive index sensor based
on a grapefruit photonic crystal fiber where the holes are filled with silver wires with
a radius of 300 nm, reaching a sensitivity of 2400 nm/RIU for a variation of the external
refractive index between 1.33 and 1.335 RIU, for a wavelength of 635-650 nm,
respectively.

SPR sensor with wires for simultaneous measurement of refractive index
and temperature
119
Table 9.2 Sensitivity, resolution and range of the wavelength values for the refractive index optical fiber sensor.
Sensitivity (nm/RIU)
Resolution (RIU) Range λ (nm)
Range of next External wire rm = 300 nm
[1.30,1.32] 687.5 1.45×10⁻⁵ 720-740
[1.32,1.34] 1375 7.27×10⁻⁶ 740-770
[1.34, 1.36] 2437.5 4.10×10⁻⁶ 770-820
[1.36,1.38] 4062.5 2.46×10⁻⁶ 820-900
When comparing the results of this chapter (Table 9.2) with those obtained in
Chapter 7, we notice that they are not as good in terms of refractive index sensitivity,
because some of the design parameters are different. Indeed, in this chapter the main
concern has been with the development of multiparameter measurement using the
plasmonic modes, rather then optimizing the sensing performance to a single
parameter (such as the refractive index). As a result, it was necessary to find a
compromise between performance and parameter independence, and our choice was
to sacrifice part of the former in benefit of the later.
9.3.2 Optimization of the sensor
Figure 9.3 shows the attenuation of the guided mode per unit of length as a function
of wavelength for different values of external refractive index, which presents three
main peaks. The first, for low wavelengths is very weak and has little use for sensing
(P1). The second peak is the most intense and shifts towards longer wavelengths with
increasing external refractive index (P2), whereas the third at a higher wavelength
remains unchanged (P3). This peak however is much weaker than the second, a
problem which can be overcome either by changing the number of internal wires, or
by decreasing the distance between the core and internal wires. Another possibility is
to lower the intensity of the second peak by changing the distance of the core to the
external wire.
Increasing the number of internal wires can increase this loss peak. However,
structures with a larger number of wires can be more difficult the fabricate so, we
propose a second approach to increase the third peak, by reducing the distance
between the metal and the internal wires. Figure 9.4a shows the results for the
attenuation if the distance between internal wires and the core is reduced to 1 µm.
The reduction of this distance alters the coupling strength between the modes and, in
turn, not only shifts the central wavelength of the peaks but also changes their relative
amplitudes. However, the dependent character of the second peak (and independent
character of the third) on the external refractive index is preserved. The analysis also
shows that the range of measurement of RI of this sensor configuration is between 1.30
and 1.38, and is mainly determined by the geometry and dimensions of the components

SPR sensor with wires for simultaneous measurement of refractive index
and temperature
120
(specially the metal wires). For higher values of RI, the second and third peaks overlap
and it is hard to separate them in the spectrum. This problem can be resolved by
increasing the radius of the internal wires. Figure 9.4b shows the attenuation as
function of the wavelength when the radius of the internal wires is 550 nm. This new
radius changes only the third peak of resonance, from 975 nm to 1025 nm, when
compared with Figure 9.3. The first and second peaks maintain the same loss
magnitude and wavelength resonance.
(a)
(b) Figure 9.4 Attenuation as a function of wavelength for different values of external refractive index D-type for d = 2 µm, (a) dI = 3 µm (the distance between the internal wires and the core) and rI = 500 nm (radius of the internal wires) and for (b) dI = 4 µm and rI = 550 nm. The external refractive index varies
from 1.30 to 1.38.
Using different parameters, like the number of wires, the radius of the internal
and external wires and the different distance between the core and the internal and
external wires, it is possible to optimize the sensor. Our proposal for the sensing
configuration considers four wires (one external and three internal) localized

SPR sensor with wires for simultaneous measurement of refractive index
and temperature
121
symmetrically around the core, whose results are presented in Figure 9.2, Figure 9.3
and Figure 9.4 and with chosen configuration are the d = 2.5 µm, dI = 4 µm, rE = 300
nm (the radius of the external wire) and rI = 500 nm (the radius of the internal wires).
With this configuration and parameters, the sensor displays two main peaks with
similar amplitude, as well as, a fair peak separation, within a range of detection
between 1.30 and 1.34 (but not for 1.38).
9.3.3 Study of the sensor behavior as a function of temperature
In this section we present the behavior of the third peak as a function of
temperature. Also, we consider the ambient temperature and the effects of the
temperature in the properties of the materials, to be modeled according to equation
9.1.
Figure 9.5 shows the attenuation as a function of wavelength for different values
of temperature. The peak on the left corresponds to the second peak (P2) observed
in the previous figures, while the peak on the right corresponds to the third peak (P3).
The central wavelength of the peak on the left (which is strongly dependent on the
external RI) practically does not change with the temperature. Instead, the peak on
the right (which is almost independent on the external RI) exhibits a shift toward
longer wavelengths for higher temperatures.
Figure 9.5 Attenuation as a function of wavelength for different values of temperature sensor D-type. The external refractive index is 1.34 RIU. The configuration is d = 2.5 µm, dI = 4 µm, rE = 300 nm (the
radius of the external wire) and rI = 500 nm (the radius of the internal wires).
The sensitivity of the temperature sensor is calculated according to:
TS
peak
)( (9.8)
where T is the variation in temperature, and, using the data from Figure 9.5, we
obtain a sensitivity to changes in temperature of 3 pm/K for the peak on the left and
the 30 pm/K for the peak on the right. Although the sensitivity to changes in

SPR sensor with wires for simultaneous measurement of refractive index
and temperature
122
temperature of the latter peak is smaller than other temperature sensors based in SPR
found in the literature, it should be noted that in those cases the measurement of
temperature is assisted by other sensing principles (including thermal expansion of
interferometric components), whereas in our case the process is purely plasmonic.
Luan [107] used a microstructured optical fiber with a thin layer of silver deposited on
the internal surface of one hole, which is then filled with a large thermo-optic
coefficient liquid as a sensing medium. This configuration obtained a temperature
sensor with high sensitivity of 6.18 nm/K for wavelengths from 838 to 943 nm and with
a variation of the temperature from 26 ºC to 43 ºC (which represents a variation of the
refractive index of the thermo-optic coefficient liquid from 1.41 to 1.42). Sensors
without this type of components have less sensitivity (up to 70 pm/K) [154]. Our
configuration is very versatile in the sense that changing geometrical parameters (such
as the wire radius or the distance between the wires and the core), the number of
wires, among others, it is possible to customize the operation at parameters of the
sensor, including the range of measurement of the refractive index or the reference
wavelength of the sensor. This characteristic surpasses the limitations of other
proposals that are dependent on the specific properties of a test fluid [28], [107].
Table 9.3, summarizes the sensitivity coefficients of the two peaks, for refractive
index (Kn) and temperature (KT), taken from the information presented in Figure 9.3
and Figure 9.5.
Table 9.3 Sensitivity coefficients of the two peaks for refractive index and temperature.
Kn KT
2P 2093.1nm/RIU 3.4pm/K
3P 0 27.3pm/K
The dual response of the two sensing peaks as a function of the variation of the
wavelength sensor in terms of RI and temperature, allows writing a conditioned system
of two equations for Δn and ΔT, given in matrix form as:
3
2
,,
,,
,,
1
32
32
23 P
P
TT
nn
nT PP
PP
PP
KK
KK
KKT
n
(9.9)
where nP
K ,2,
TPK ,2
and TP
K ,3, the matrix elements, are the sensitivity coefficients of
the two peaks as a function of the refractive index and temperature, respectively, and represented in Table 9.3.
3
2
3.274.3
01.2093
14.57
1
P
P
T
n
(9.10)
This callibration matrix allows us to determine the temperature and refractive
index unequivocally, by processing the signals retrieved from the two peaks.
The values of the elements of the calibration matrix presented in Table 9.3 show
that it is strongly diagonaly dominant, and therefore a well conditioned matrix, which
will introduce low numerical errors when used to obtain the values of the RI and
temperature from the data obtained experimentally. This comes from the dependence

SPR sensor with wires for simultaneous measurement of refractive index
and temperature
123
of each peak to a specific sensing parameter (RI or temperature) thus reducing the
crosstalk between them.
9.4 Conclusion
These results pave the way for a new type of optical sensors that measure
simultaneously different parameters, including temperature and refractive index, via
plasmonic response, which explores both new geometries and other materials that can
further improve sensing performances.
We have demonstrated a sensor based in a D-type fiber using SPR with multiple
wires that allows the simultaneous measurement of temperature and refractive index,
by direct manipulation of the properties of the surface plasmon resonances supported
by the wires. In particular, this sensor presents two main measurement peaks, each
one resulting from a particular plasmon resonance, and mainly dependent on just one
of the two parameters measured, which facilitates the sensor calibration and promotes
more accurate measurements. Indeed, in our sensor proposal we verified that one
peak is very sensitive to the RI (4000 nm/RIU) and slightly responsive to temperature
(3 pm/K), whereas the other peak is only sensitive to temperature, specifically with a
sensitivity of 30 pm/K and no response to changes to the refractive index. Also, this
sensor proposal presents good performance parameters, including intensity of loss,
range of operation and spectral localization of the resonance peaks.
The optimization of the sensor parameters can be done with the variation of the
radius of the gold wires, number of the internal wires, distance between wires in the
core and distance between the external wire and the core, among other parameters.
We have also shown the possibility of manipulating the supermodes in the wires to
obtain a refractive index range detection between 1.30 to 1.38, with a clear distinction
of the two measurement peaks, while maintaining the same sensitivity to both
parameters (refractive index and temperature). Moreover, we also demonstrated that
changing the same geometric parameters also allows to customize the sensor to
measure in other ranges or to operate with other specifications, like the magnitude
and range of wavelength variation of the loss peaks, among others.
Unlike other proposals in literature that rely on the changes in refractive index
produced by variations of temperature in reference materials [107] or that use the
change of dimensions produced by the thermal expansion of interferometric
components [155], our sensor design relies on the changes produced on the modal
characteristics of the plasmons resulting from changes in the population of free
electrons, associated with the variation of the temperature. This approach allows us
to use the direct dependence of the plasmon resonances on temperature to measure
this parameter. On the other hand, the combination of wires with distinct natures
(specifically, external wires in contact with the exterior medium, and internal wires
that are shielded from the changes in the external refractive index), that support
plasmons resonances in distinct spectral regions, allows us to combine the
measurement of multiple parameters. To our knowledge, this has not yet been
described in literature and could, in principle, be extended to even more parameters.

SPR sensor with wires for simultaneous measurement of refractive index
and temperature
124
In short, we presented a sensor configuration capable of simultaneous
measurements the temperature and refractive index of the analyte medium, using
plasmon resonances that present strong dependency to just one of the measurements
and thus separate their measure. This work also has the aims to stimulate research
into the development of novel multiple parameters sensors, that use the direct
manipulation of the plasmon resonances as sensing principle.

SPR sensor with wires for simultaneous measurement of refractive index
and temperature
125

126
Chapter 10 Conclusions and outlook
Today’s optical sensors have moved away from the simplicity of the early days,
into higher degrees of sophistication and increasing performance. In particular, fiber
optical sensors relay on newer sensing principles, such as plasmonics, and integrate
many components at a nanoscale, from metal and dielectric structures. With the
development of newer artificial materials, such as metamaterials, this complexity will
increase even further, resulting in newer and innovative sensing designs, many of
which are still not feasible, using existing fabrication techniques, or are extremely
expensive and hard to produce, which implies that an exhaustive experimental test of
these designs is neither efficient nor wise in terms of resource management. In this
thesis we have used simulation tools to overcome these for optimize exiting sensing
designs and even to test novel sensing concepts. In particular, we showed how to
combine optical fiber technologies with metallic films and wires into optical fiber
sensors, allowing a synergy between the light transported in the silica fibers and
plasmon excitations supported by the metal structures, to measure the properties of
some external medium, typically the refractive index but also the temperature.
Many of these new ideas arise from the possibility to control the structure of the
fiber at a nanoscale, introducing for example nanowires or metamaterials, composed
of a mixture of metal and dielectrics, at scales inferior to both the wavelength of light
and the typical dimensions of optical fibers and their core. Although this challenge is
being solved by the constant improvements of fabrication techniques, it is not a lesser
challenge from the point of view of simulation, as it requires to model systems with
distinct materials casted into many components, with dimensions that can vary over
one or even two orders of magnitude. Moreover, at very small scales, the behavior of
light and the optical properties of matter can be quite different from those
experienced at the human and everyday scale. For example, surface plasmons become
strongly localized. The idea is precisely to use these micro and nanoscale behaviors to
improve sensing.
Let us go back to the questions raised in the introduction:
• Is this simulation approach effective in modelling different SPR D-Type fiber
configurations?
• How do the results of the simulations compare with the experimental data?
• How can we engineer the interactions between light and plasmons to
improve sensing performance?
• What kind of microstructures and new materials can be incorporated in the
sensors to help boost sensing performance?

Conclusion and outlook
127
• Can we integrate the characteristics of different SPR sensors measuring
distinct quantities in a single sensor?
Throughout this thesis we hope to have shown that:
• This simulation approach can be used to model different SPR D-type sensors,
by studying different types of fibers, materials, structures, modes, among
others.
• Simulations provide an easy and quick way of exploring the physical principles
in optical sensing and optimize them, while providing results which are in good
agreement with experimental data, as shown in Erro! A origem da referência
não foi encontrada..
• Changing the modes in the fiber and in the metallic wires improves
characteristics of the sensor like sensitivity, resolution, operational wavelength
and loss.
• The SPR sensor based in conventional PCF D-type fiber presented slightly better
sensitivity when compared with the conventional D-type fiber, but it is possible
to increase the performance of the PCF D-type fiber sensor by changing the
inner structure, as proposed in Erro! A origem da referência não foi
encontrada.. Also, when we use a new material, like metamaterial permitted
a SPR sensor with a specific intensity of the loss and operation range of
wavelength, that caused a variation in the sensitivity and resolution, but better
than the conventional SPR D-type with gold.
• A complete understanding and control of the physical properties of the
plasmons allow us to extend the current concept of SPR sensors, which today
are basically extremely sensitive refractive index sensors, into genuine
multiparameter SPR sensors, that can use SPR to measure directly both
refractive index and temperature, and perhaps in the near future even more
parameters.
10.1 Sensors with thin materials films
In Erro! A origem da referência não foi encontrada. we showed that the COMSOL
Multiphysics can be used to test and optimize, computationally, a sensing
configuration with high accuracy and considerable economy of time and resources.
It was also possible to demonstrate the benefits of using COMSOL to improve the
performance of refractive index SPR D-type optical fiber sensors. The optimization of
the sensors can be performed through the variation of the metal thickness, the
distance of the metal to the center of the fiber and by the use of a high refractive
index layer. We concluded the metal thickness changes all the characteristics of the
sensors studied in this thesis, such as sensitivity, resolution, operation wavelength and
also loss intensity, and the optimal relation of loss and sensitivity is when the thickness
of the metal is between 45 nm and 65 nm. The distance d only changes the loss
intensity. Finally, the high refractive index overlayer alters the sensor operation
wavelength, smaller thicknesses of the overlayer (20 nm to 30 nm) is the recommended
choice to allow light to reach the external medium. We also studied different positions

Conclusion and outlook
128
for the air holes in the fibers and we verified that the corresponding variation in the
sensor characteristics, which allowed us to optimize the singlemode SPR sensor.
A few SPR sensor configurations have been tested, showing that the conventional
SPR D-type sensor can be optimized in sensitivity, resolution, intensity of loss,
operation wavelength. Comparing the conventional SPR D-type sensor with the PCF D-
type sensor, we have:
• The SPR PCF D-type sensor was implemented with an increase in the sensitivity
of 600 nm/RIU, in the range of the next = [1.36,1.37] RIU, a redshift of 75 nm of
the peak of resonance, but with a decrease in the intensity of loss.
• By removing holes in the SPR PCF D-type sensor we optimized the former results
and increased the sensitivity of the sensor by 1800 nm/RIU, in the range of the
next = [1.36,1.38] RIU, with a high intensity of the loss and with a redshift of the
150 nm of the peak of resonance.
• The use of a high refractive index overlayer allows us to shift the operation
wavelength to 900 nm and the sensitivity of the sensor to 6783 nm/RIU in the
range of next = [1.367,1.390] RIU.
The SPR conventional D-type sensor with a overlayer presents a good sensitivity for
low values of next, but for high values of next the proposes SPR PCF D-type sensor present
a sensitivity highest of the 8000 nm/RIU in the range of next = [1.38,1.39] RIU. That
means different configurations, with different parameters, present different SPR
sensor characteristics, which can be quickly determined by using COMSOL Multiphysics
for SPR sensor optimization.
In Erro! A origem da referência não foi encontrada., we showed the numerical
and experimental behavior of the SPR POF D-type sensor and compared the respective
results. In particular, the sensitivity of the POF D-type sensor is similar to the
conventional D-type sensor presented in the previous chapter. The numerical
simulation show multiple modes are found and can be coupled with the plasmonic
mode. The multiple modes have different intensities of loss and we concluded that
the higher order modes presented a bigger loss since they have a bigger interaction
with the external medium than the lower order modes. This effect can be verified in
the experimental study, when we used a filter before or after the sensor head.
The numerical and experimental results were similar. The differences is on the
utilization or not of the photoresist, the number or modes used in the study, among
others.
In Erro! A origem da referência não foi encontrada. we showed a SPR D-type
sensor with a thin metamaterial and this sensor presents an improvement to the
conventional SPR D-type sensor with a thin gold film. We also presented a method to
optimize the sensor, dependent on the concentration of Al2O3 and Ag and on the
thickness of the metamaterial.
10.2 Sensors with wires
Chapter 7 and Erro! A origem da referência não foi encontrada. showed the
metallic wires can be used for SPR sensors. The principal characteristics of the wires
are the generation of multiple plasmonic modes. These plasmonic modes generate SPR

Conclusion and outlook
129
in different wavelengths, which allow the possibility of wavelength multiplexing for
measuring different physical parameters. The SPR D-type sensor has the external wire
localized between the cladding and the external medium, for the optimal compromise
between detection and robustness.
In Chapter 7 a singlemode SPR D-type wire sensor was studied. This sensor
presented an increase in the sensitivity of 2200 nm/RIU in the range of
next = [1.36,1.38] RIU, a redshift of 250 nm of the peak of resonance (from 625 nm to
825 nm) and an increase of the loss intensity when compared with the conventional
SPR D-type fiber. This sensor can be improved by using different plasmonic modes that
present a different sensitivity.
In Erro! A origem da referência não foi encontrada. a multimode SPR D-type wire
sensor was studied. In this case the plasmonic modes can be combined with different
multimode presented in the fiber to produce SPR at different wavelengths with
different characteristics. Therefore, the sensitivity of the sensor also depends on the
studied mode. In the range of next = [1.36,1.38] RIU we had:
• The fundamental mode has a sensitivity of 3110 nm/RIU and an operation range
from 780-850 nm.
• The mode Mp3,5 presented a sensitivity of 5340 nm/RIU and an operation range
from 840-945 nm.
The Mp3,5 mode presented a performance comparable with the SPR D-type fiber
sensor, with a overlayer and the SPR PCF D-type sensor. Again, appropriate filtering is
necessary to select a mode or a set of specific modes to create the optimized sensors.
10.3 Simultaneous measurement of refractive index and temperature
Finally, Erro! A origem da referência não foi encontrada. we showed a SPR D-
type sensor with multiple wires that combined the knowledge of the previous chapters
to make a sensor that measure simultaneously refractive index and temperature.
Indeed, in our sensor proposal, we verified that one peak is very sensitive to the RI
(4000 nm/RIU) and slightly responsive to temperature (3 pm/K), whereas the other
peak is only sensitive to temperature (30 pm/K), and practically no response to
changes to the refractive index. This configuration also permitted individual control
of the localization of the SPR wavelengths of the refractive index and temperature to
improve of the sensor control.
10.4 Outlook
In this thesis we have started from one of the current paradigms of optical fiber
sensors, namely those based on SPR, and asked the fundamental question: how can we
improve their performance, using changes in the more custom designs that can be
implemented, using fabrication techniques already existing or foreseeable in the near
future. The idea was to adopt an engineering approach and to rethink the existing
technology and understand how it can be improved. Using numerical simulations, we
have systematically examined the different aspects that influence sensor
performance, from the nature of the optical and plasmonic modes supported in these

Conclusion and outlook
130
sensors, to the influence of the optical properties of materials, and the geometry of
the sensor components. We have inclusively looked into metamaterials as a way to
develop artificial materials with customized properties that can overcome the
limitations offered by natural ones. This approach has allowed to push further the
performance of fundamental design of SPR based optical fiber sensors and even
propose new concepts, such as the multiparameter SPR sensor. It is clear that the idea
of multiparameter SPR sensing must be further developed. Temperature is an
important parameter to be added to the measurement of refractive index, since it is
determinant to the calibration of the sensor itself. However, other parameters could
in principle also be considered. Also, it is clear that coupling plasmons in different
metal structures can result in a collective response that is much more complex and
perhaps interesting for sensing than single plasmon modes. There is clearly still more
to be explored, since this thesis has only started to graze the surface of this topic and
initial results are promising.
However, after almost four years and as we finish this thesis it is clear that the
limits of SPR sensing technology can be pushed even further. Indeed, if fabrication
techniques allow to reduce the size of the metallic nanowires even further not only
we can make the localized surface plasmons more sensitive to parameters such as the
refractive index and temperature, but also to other parameters such as external
electromagnetic fields. Furthermore, in metal structures with sizes of a few
nanometers the plasmon modes start to gain a quantum and nonlinear character and
the models used to describe them must be reviewed. This paves the way for new
concepts in sensing and a challenge to develop adequate numerical models.

Conclusion and outlook
131

132
Bibliography
[1] B. Lee, S. Roh, and J. Park, “Current status of micro- and nano-structured optical fiber
sensors,” Opt. Fiber Technol., vol. 15, no. 3, pp. 209–221, Jun. 2009.
[2] S. Roh, T. Chung, and B. Lee, “Overview of the Characteristics of Micro- and Nano-
Structured Surface Plasmon Resonance Sensors,” Sensors, vol. 11, no. 12, pp. 1565–
1588, Jan. 2011.
[3] B. Liedberg, C. Nylander, and I. Lunstrom, “Surface plasmon resonance for gas detection
and biosensing,” Sensors and Actuators, vol. 4, pp. 299–304, 1983.
[4] B. Liedberg, C. Nylander, and I. Lundström, “Biosensing with surface plasmon resonance
— how it all started,” Biosens. Bioelectron., vol. 10, no. 8, pp. i–ix, Jan. 1995.
[5] R. C. Jorgenson and S. Yee, “A fiber optic chemical sensor based on surface plasmon
resonance,” Sensors Actuators B Chem., vol. 12, no. 3, pp. 213–220, 1993.
[6] R. Slavík, J. Homola, and E. Brynda, “A miniature fiber optic surface plasmon resonance
sensor for fast detection of staphylococcal enterotoxin B,” Biosens. Bioelectron., vol.
17, no. 6–7, pp. 591–595, Jun. 2002.
[7] J. Čtyroký, J. Homola, and M. Skalský, “Modelling of surface plasmon resonance
waveguide sensor by complex mode expansion and propagation method,” Opt. Quantum
Electron., vol. 29, no. 2, pp. 301–311, 1997.
[8] B. Lee, S. Roh, H. Kim, and J. Jung, “Waveguide-based surface plasmon resonance
sensor design,” in Photonic Fiber and Crystal Devices: Advances in Materials and
Innovations in Device Applications III, 2009, vol. 7420, p. 74200C.
[9] M. a Kaliteevski, V. V Nikolaev, and R. a Abram, “Calculation of the Mode Structure of
Multilayer Optical Fibers Based on Transfer Matrices for Cylindrical Waves,” Opt.
Spectrosc., vol. 88, no. 5, pp. 792–795, 2000.
[10] X. D. Hoa, M. Tabrizian, and A. G. Kirk, “Rigorous Coupled-Wave Analysis of Surface
Plasmon Enhancement from Patterned Immobilization on Nanogratings,” J. Sensors, vol.
2009, pp. 1–7, 2009.
[11] Y. Al-Qazwini, P. T. Arasu, and A. S. M. Noor, “Numerical investigation of the
performance of an SPR-based optical fiber sensor in an aqueous environment using
finite-difference time domain,” in 2011 2nd International Conference on Photonics,
2011, vol. 13, no. 7, pp. 1–4.
[12] M. Hautakorpi, M. Mattinen, and H. Ludvigsen, “Surface-plasmon-resonance sensor
based on suspended-core microstructured optical fiber,” in OECC/ACOFT 2008 - Joint
Conference of the Opto-Electronics and Communications Conference and the Australian
Conference on Optical Fibre Technology, 2008, vol. 16, no. 12, pp. 1–2.
[13] J. Homola, “Surface Plasmon Resonance Sensors for Detection of Chemical and
Biological Species,” Chem. Rev., vol. 108, no. 2, pp. 462–493, Feb. 2008.
[14] A. Otto, “Excitation of nonradiative surface plasma waves in silver by methode of
frustrated total reflection,” Z. Phys., vol. 216, no. 4, pp. 398–410, 1968.
[15] E. Kretschmann and H. Raether, “Radiative Decay of Non Radiative Surface Plasmons
Excited by Light,” Zeitschrift für Naturforsch. A, vol. 23, no. 12, pp. 2135–2136, Jan.
1968.
[16] J. R. Sambles, G. W. Bradbery, and F. Yang, “Optical excitation of surface plasmons:
An introduction,” Contemp. Phys., vol. 32, no. 3, pp. 173–183, May 1991.

Bibliography
133
[17] F. Villuendas and J. Pelayo, “Optical Fibre Device for Chemical Sensing Based on Surface
Plasmon Excitation,” Sensors Actuators A Phys., vol. 423, no. 1–3, pp. 1142–1145, 1990.
[18] M. Piliarik and J. Homola, “SPR Sensor Instrumentation,” in Surface Plasmon Resonance
Based Sensors, Springer S., vol. 4, 2006, pp. 95–116.
[19] M. Piliarik and J. Homola, “Surface plasmon resonance (SPR) sensors: approaching their
limits?,” Opt. Express, vol. 17, no. 19, pp. 16505–16517, Sep. 2009.
[20] D. F. Santos, A. Guerreiro, and J. M. Baptista, “SPR Microstructured D-Type Optical
Fiber Sensor Configuration for Refractive Index Measurement,” IEEE Sens. J., vol. 15,
no. 10, pp. 5472–5477, Oct. 2015.
[21] J. Homola, I. Koudela, and S. S. Yee, “Surface plasmon resonance sensors based on
diffraction gratings and prism couplers: sensitivity comparison,” Sensors Actuators B
Chem., vol. 54, no. 1–2, pp. 16–24, Jan. 1999.
[22] L. De Maria, M. Martinelli, and G. Vegetti, “Fiber-optic sensor based on surface plasmon
interrogation,” Sensors Actuators B Chem., vol. 12, no. 3, pp. 221–223, Apr. 1993.
[23] E. Klantsataya, P. Jia, H. Ebendorff-Heidepriem, T. Monro, and A. François, “Plasmonic
Fiber Optic Refractometric Sensors: From Conventional Architectures to Recent Design
Trends,” Sensors, vol. 17, no. 1, p. 12, Dec. 2016.
[24] H. Chen, S. Li, G. An, J. Li, Z. Fan, and Y. Han, “Polarization Splitter Based on d-Shaped
Dual-Core Photonic Crystal Fibers with Gold Film,” Plasmonics, vol. 10, no. 1, pp. 57–
61, Feb. 2015.
[25] Z. Tan, X. Hao, Y. Shao, Y. Chen, X. Li, and P. Fan, “Phase modulation and structural
effects in a D-shaped all-solid photonic crystal fiber surface plasmon resonance sensor,”
Opt. Express, vol. 22, no. 12, p. 15049, Jun. 2014.
[26] M. Tian, P. Lu, L. Chen, C. Lv, and D. Liu, “All-solid D-shaped photonic fiber sensor
based on surface plasmon resonance,” Opt. Commun., vol. 285, no. 6, pp. 1550–1554,
Mar. 2012.
[27] E. K., T. Gorman, H. Ademgil, S. Haxha, G. Robinson, and J. Oliver, “A Novel Compact
Photonic Crystal Fibre Surface Plasmon Resonance Biosensor for an Aqueous
Environment,” in Photonic Crystals - Innovative Systems, Lasers and Waveguides,
InTech, 2012.
[28] N. Luan, R. Wang, W. Lv, Y. Lu, and J. Yao, “Surface Plasmon Resonance Temperature
Sensor Based on Photonic Crystal Fibers Randomly Filled with Silver Nanowires,”
Sensors, vol. 14, no. 9, pp. 16035–16045, Aug. 2014.
[29] M. Skorobogatiy, “Microstructured and Photonic Bandgap Fibers for Applications in the
Resonant Bio- and Chemical Sensors,” J. Sensors, vol. 2009, pp. 1–20, 2009.
[30] K. Matsubara, S. Kawata, and S. Minami, “Multilayer system for a high-precision surface
plasmon resonance sensor,” Opt. Lett., vol. 15, no. 1, p. 75, Jan. 1990.
[31] J. S. Yuk and K. Ha, “Analysis of Immunoreactions on Protein Arrays by Using
Wavelength-Interrogation-Based Surface Plasmon Resonance Sensors,” Korean Phys.
Soc., vol. 45, no. 4, pp. 1104–1108, 2004.
[32] L.-M. Zhang and D. Uttamchandani, “Optical chemical sensing employing surface
plasmon resonance,” Electron. Lett., vol. 24, no. 23, p. 1469, 1988.
[33] R. Verma and B. D. Gupta, “A novel approach for simultaneous sensing of urea and
glucose by SPR based optical fiber multianalyte sensor,” Analyst, vol. 139, no. 6, p.
1449, 2014.
[34] R. K. Verma and B. D. Gupta, “Theoretical modelling of a bi-dimensional U-shaped
surface plasmon resonance based fibre optic sensor for sensitivity enhancement,” J.
Phys. D. Appl. Phys., vol. 41, no. 9, p. 95106, May 2008.
[35] N. Cennamo, D. Massarotti, R. Galatus, L. Conte, and L. Zeni, “Performance Comparison
of Two Sensors Based on Surface Plasmon Resonance in a Plastic Optical Fiber,” Sensors,
vol. 13, no. 1, pp. 721–735, Jan. 2013.
[36] C. Nylander, B. Liedberg, and T. Lind, “Gas detection by means of surface plasmon
resonance,” Sensors and Actuators, vol. 3, pp. 79–88, 1982.
[37] J. M. Brockman, B. P. Nelson, and R. M. Corn, “Surface plasmon resonance imaging
measurements of ultrathin organic films.,” Annu. Rev. Phys. Chem., vol. 51, no. 1, pp.
41–63, Oct. 2000.
[38] B. Sun, X. Wang, and Z. Huang, “Study on intensity-modulated surface plasmon
resonance array sensor based on polarization control,” in 2010 3rd International

Bibliography
134
Conference on Biomedical Engineering and Informatics, 2010, no. Bmei, pp. 1599–1602.
[39] H. Moayyed, I. T. Leite, L. Coelho, J. L. Santos, A. Guerreiro, and D. Viegas, “Analysis
of phase interrogation of SPR fiber optic sensors with characteristics tailored by the
application of different metal-dielectric overlays,” in 23rd International Conference on
Optical Fibre Sensors, 2014, vol. 9157, p. 91575E.
[40] A. A. Kruchinin and Y. G. Vlasov, “Surface plasmon resonance monitoring by means of
polarization state measurement in reflected light as the basis of a DNA-probe
biosensor,” Sensors Actuators B Chem., vol. 30, no. 1, pp. 77–80, Jan. 1996.
[41] X. Chen, “SPR sensor by method of electro-optic phase modulation and polarization
interferometry,” Chinese Opt. Lett., vol. 10, p. S12401, 2012.
[42] W. J. H. Bender, R. E. Dessy, M. S. Miller, and R. O. Claus, “Feasibility of a Chemical
Microsensor Based on Surface Plasmon Resonance on Fiber Optics Modified by Multilayer
Vapor Deposition,” Anal. Chem., vol. 66, no. 7, pp. 963–970, 1994.
[43] J. Homola and R. Slavik, “Fibre-optic sensor based on surface plasmon resonance,”
Electron. Lett., vol. 32, no. 5, p. 480, 1996.
[44] O. Frazão, J. M. T. Baptista, and J. L. Santos, “Recent Advances in High-Birefringence
Fiber Loop Mirror Sensors,” Sensors, vol. 7, pp. 2970–2983, 2007.
[45] D. F. Santos, A. Guerreiro, and J. M. Baptista, “Numerical investigation of a refractive
index SPR D-type optical fiber sensor using COMSOL multiphysics,” Photonic Sensors,
vol. 3, no. 1, pp. 61–66, Aug. 2013.
[46] M.-H. Chiu, C.-H. Shih, and M.-H. Chi, “Optimum sensitivity of single-mode D-type
optical fiber sensor in the intensity measurement,” Sensors Actuators B Chem., vol.
123, no. 2, pp. 1120–1124, May 2007.
[47] S.-F. Wang, M.-H. Chiu, and R.-S. Chang, “Numerical simulation of a D-type optical fiber
sensor based on the Kretchmann’s configuration and heterodyne interferometry,”
Sensors Actuators B Chem., vol. 114, no. 1, pp. 120–126, Mar. 2006.
[48] N. Cennamo, D. Massarotti, L. Conte, and L. Zeni, “Low Cost Sensors Based on SPR in a
Plastic Optical Fiber for Biosensor Implementation,” Sensors, vol. 11, no. 12, pp. 11752–
11760, Dec. 2011.
[49] A. J. C. Tubb, F. P. Payne, R. B. Millington, and C. R. Lowe, “Single-mode optical fibre
surface plasma wave chemical sensor,” Sensors Actuators B Chem., vol. 41, no. 1–3, pp.
71–79, Jun. 1997.
[50] D. Monzón-Hernández and J. Villatoro, “High-resolution refractive index sensing by
means of a multiple-peak surface plasmon resonance optical fiber sensor,” Sensors
Actuators B Chem., vol. 115, no. 1, pp. 227–231, May 2006.
[51] Ó. Esteban, F. B. Naranjo, N. Díaz-Herrera, S. Valdueza-Felip, M. C. Navarrete, and A.
González-Cano, “High-sensitive SPR sensing with Indium Nitride as a dielectric overlay
of optical fibers,” Sensors Actuators, B Chem., vol. 158, no. 1, pp. 372–376, 2011.
[52] M. Iga, A. Seki, and K. Watanabe, “Gold thickness dependence of SPR-based hetero-core
structured optical fiber sensor,” Sensors Actuators B Chem., vol. 106, no. 1, pp. 363–
368, Apr. 2005.
[53] M. Erdmanis, D. Viegas, M. Hautakorpi, S. Novotny, J. L. Santos, and H. Ludvigsen,
“Comprehensive numerical analysis of a surface-plasmon-resonance sensor based on an
H-shaped optical fiber,” Opt. Express, vol. 19, no. 15, p. 13980, Jul. 2011.
[54] H. Suzuki, M. Sugimoto, Y. Matsui, and J. Kondoh, “Effects of gold film thickness on
spectrum profile and sensitivity of a multimode-optical-fiber SPR sensor,” Sensors
Actuators B Chem., vol. 132, no. 1, pp. 26–33, May 2008.
[55] A. Hassani and M. Skorobogatiy, “Design criteria for microstructured-optical-fiber-based
surface-plasmon-resonance sensors,” J. Opt. Soc. Am. B, vol. 24, no. 6, pp. 1423–1429,
Jun. 2007.
[56] B.-H. Liu, Y.-X. Jiang, X.-S. Zhu, X.-L. Tang, and Y.-W. Shi, “Hollow fiber surface
plasmon resonance sensor for the detection of liquid with high refractive index.,” Opt.
Express, vol. 21, no. 26, pp. 32349–57, 2013.
[57] J. Homola and M. Piliarik, “Surface Plasmon Resonance (SPR) Sensors,” in Surface
Plasmon Resonance Based Sensors, J. Homola, Ed. Berlin, Heidelberg: Springer Berlin
Heidelberg, 2006, pp. 45–67.
[58] A. K. Sharma and B. D. Gupta, “Fibre-optic sensor based on surface plasmon resonance
with Ag–Au alloy nanoparticle films,” Nanotechnology, vol. 17, no. 1, pp. 124–131, Jan.

Bibliography
135
2006.
[59] M. Kanso, S. Cuenot, and G. Louarn, “Sensitivity of Optical Fiber Sensor Based on Surface
Plasmon Resonance: Modeling and Experiments,” Plasmonics, vol. 3, no. 2–3, pp. 49–57,
Sep. 2008.
[60] C. Ronot-Trioli, A. Trouillet, C. Veillas, and H. Gagnaire, “Monochromatic excitation of
surface plasmon resonance in an optical-fibre refractive-index sensor,” Sensors
Actuators A Phys., vol. 54, no. 1–3, pp. 589–593, Jun. 1996.
[61] Y. S. Dwivedi, A. K. Sharma, and B. D. Gupta, “Influence of Design Parameters on the
Performance of a Surface Plasmon Sensor Based Fiber Optic Sensor,” Plasmonics, vol.
3, no. 2–3, pp. 79–86, Sep. 2008.
[62] A. K. Sharma and B. D. Gupta, “Comparison of Performance Parameters of Conventional
and Nano-plasmonic Fiber Optic Sensors,” Plasmonics, vol. 2, no. 2, pp. 51–54, Jun.
2007.
[63] A. K. Sharma and G. J. Mohr, “Theoretical understanding of an alternating dielectric
multilayer-based fiber optic SPR sensor and its application to gas sensing,” New J. Phys.,
vol. 10, no. 2, p. 23039, Feb. 2008.
[64] R. K. Verma, A. K. Sharma, and B. D. Gupta, “Surface plasmon resonance based tapered
fiber optic sensor with different taper profiles,” Opt. Commun., vol. 281, no. 6, pp.
1486–1491, Mar. 2008.
[65] R. K. Verma, A. K. Sharma, and B. D. Gupta, “Modeling of Tapered Fiber-Optic Surface
Plasmon Resonance Sensor With Enhanced Sensitivity,” IEEE Photonics Technol. Lett.,
vol. 19, no. 22, pp. 1786–1788, Nov. 2007.
[66] S.-F. Wang, M.-H. Chiu, J.-C. Hsu, R.-S. Chang, and F.-T. Wang, “Theoretical analysis
and experimental evaluation of D-type optical fiber sensor with a thin gold film,” Opt.
Commun., vol. 253, no. 4–6, pp. 283–289, Sep. 2005.
[67] M. H. Chiu and C. H. Shih, “Searching for optimal sensitivity of single-mode D-type
optical fiber sensor in the phase measurement,” Sensors Actuators, B Chem., vol. 131,
no. 2, pp. 596–601, May 2008.
[68] R. Slavík, J. Homola, J. Čtyroký, and E. Brynda, “Novel spectral fiber optic sensor based
on surface plasmon resonance,” Sensors Actuators B Chem., vol. 74, no. 1–3, pp. 106–
111, Apr. 2001.
[69] R. Slavik, J. Homola, and J. Čtyroký, “Miniaturization of fiber optic surface plasmon
resonance sensor,” Sensors Actuators B Chem., vol. 51, no. 1–3, pp. 311–315, Aug. 1998.
[70] M. Piliarik, J. Homola, Z. Maníková, and J. Čtyroký, “Surface plasmon resonance sensor
based on a single-mode polarization-maintaining optical fiber,” Sensors Actuators, B
Chem., vol. 90, no. 1–3, pp. 236–242, Apr. 2003.
[71] A. K. Sharma and B. D. Gupta, “On the performance of different bimetallic combinations
in surface plasmon resonance based fiber optic sensors,” J. Appl. Phys., vol. 101, no.
9, p. 93111, May 2007.
[72] J. C tyroky, J. Homola, and M. Skalsky, “Tuning of spectral operation range of a
waveguide surface plasmon resonance sensor,” Electron. Lett., vol. 33, no. 14, p. 1246,
1997.
[73] I. T. Leite, P. Fernandes, A. Hierro-rodríguez, J. M. Teixeira, P. A. S. Jorge, and A.
Guerreiro, “Analysis of a fibre-optic sensor design based on SPR in nanowire
metamaterial films,” 23rd Int. Conf. Opt. Fibre Sensors, vol. 9157, no. 4, pp. 1–4, 2014.
[74] N. Luan and J. Yao, “High Refractive Index Surface Plasmon Resonance Sensor Based on
a Silver Wire Filled Hollow Fiber,” IEEE Photonics J., vol. 8, no. 1, pp. 1–9, Feb. 2016.
[75] G. Nemova and R. Kashyap, “Theoretical model of a planar integrated refractive index
sensor based on surface plasmon-polariton excitation,” Opt. Commun., vol. 275, no. 1,
pp. 76–82, Jul. 2007.
[76] Y. Y. Shevchenko and J. Albert, “Plasmon resonances in gold-coated tilted fiber Bragg
gratings.,” Opt. Lett., vol. 32, no. 3, pp. 211–213, 2007.
[77] A. Hassani and M. Skorobogatiy, “Surface plasmon resonance-like integrated sensor at
terahertz frequencies for gaseous analytes,” Opt. Express, vol. 16, no. 25, p. 20206,
Dec. 2008.
[78] R. Saikia et al., “Fiber-Optic pH Sensor Based on SPR of Silver Nanostructured Film,” in
AIP Conference Proceedings, 2009, vol. 1147, no. 1, pp. 249–255.
[79] C. R. Zamarreño, M. Hernáez, I. Del Villar, C. Fernandez-Valdivielso, F. J. Arregui, and

Bibliography
136
I. R. Matias, “Optical fiber pH sensor fabrication by means of indium tin oxide coated
optical fiber refractometers,” Phys. status solidi, vol. 7, no. 11–12, pp. 2705–2707, Nov.
2010.
[80] S. K. Mishra and B. D. Gupta, “Surface plasmon resonance based fiber optic pH sensor
utilizing Ag/ITO/Al/hydrogel layers,” Analyst, vol. 138, no. 9, p. 2640, Nov. 2013.
[81] K. F. Bohren and D. R. Huffman, Absorption and Scattering of Light by Small Particles.
2004.
[82] L. Novotny and B. Hecht, Principles of Nano-Optics (second edition), Cambridge.
Cambridge, 2012.
[83] J. F. Schenck, “The role of magnetic susceptibility in magnetic resonance imaging: MRI
magnetic compatibility of the first and second kinds,” Med. Phys., vol. 23, no. 6, p.
815, 1996.
[84] F. A. Hopf and G. I. Stegeman, Applied classical electrodynamics, vol. 1: Linear. Krieger
Pub Co; Reprint edition, 1985.
[85] P. G. Etchegoin, E. C. Le Ru, and M. Meyer, “An analytic model for the optical properties
of gold,” J. Chem. Phys., vol. 125, no. 16, p. 164705, Oct. 2006.
[86] K. Oughstun and N. Cartwright, “On the Lorentz-Lorenz formula and the Lorentz model
of dielectric dispersion: addendum,” Opt. Express, vol. 11, no. 21, pp. 2791–2, 2003.
[87] A. D. Rakić, A. B. Djurišić, J. M. Elazar, and M. L. Majewski, “Optical properties of
metallic films for vertical-cavity optoelectronic devices,” Appl. Opt., vol. 37, no. 22,
pp. 5271–5283, Aug. 1998.
[88] J. W. Fleming, “Dispersion in GeO_2–SiO_2 glasses,” Appl. Opt., vol. 23, no. 24, p. 4486,
1984.
[89] I. H. Malitson, F. V. J. Murphy, and W. S. Rodney, “Refractive index of synthetic
sapphire,” Josa, vol. 48, no. 1, pp. 72–73, 1958.
[90] T. Ishigure, E. Nihei, and Y. Koike, “Optimum refractive-index profile of the graded-
index polymer optical fiber, toward gigabit data links.,” Appl. Opt., vol. 35, no. 12, pp.
2048–2053, Apr. 1996.
[91] P. B. Johnson and R. W. Christy, “Optical constants of the noble metals,” Phys. Rev. B,
vol. 6, no. 12, pp. 4370–4379, 1972.
[92] A. W. Snyder and J. D. Love, Optical Waveguide Theory. Boston, MA: Springer US, 1984.
[93] N. Catarino, Diana, Viegas, “Sensing Devices Based on Micro-Optic Tecnology,”
Faculdade de Ciências da Universidade do Porto, 2010.
[94] S. A. Maier, Plasmonics: Fundamentals and Applications, vol. 1, no. 8. Boston, MA:
Springer US, 2007.
[95] H. Suzuki, M. Sugimoto, Y. Matsui, and J. Kondoh, “Effects of gold film thickness on
spectrum profile and sensitivity of a multimode-optical-fiber SPR sensor,” Sensors
Actuators B Chem., vol. 132, no. 1, pp. 26–33, May 2008.
[96] R. K. Verma, A. K. Sharma, and B. D. Gupta, “Surface plasmon resonance based tapered
fiber optic sensor with different taper profiles,” Opt. Commun., vol. 281, no. 6, pp.
1486–1491, Mar. 2008.
[97] P. Uebel, M. a Schmidt, H. W. Lee, and P. S. J. Russell, “Polarisation-resolved near-
field mapping of a coupled gold nanowire array,” Opt. Express, vol. 20, no. 27, p. 28409,
Dec. 2012.
[98] J.-L. Tang, S.-F. Cheng, W.-T. Hsu, T.-Y. Chiang, and L.-K. Chau, “Fiber-optic
biochemical sensing with a colloidal gold-modified long period fiber grating,” Sensors
Actuators B Chem., vol. 119, no. 1, pp. 105–109, Nov. 2006.
[99] I. T. Leite et al., “Exciting the optical response of nanowire metamaterial films on the
tip of optical fibres,” Phys. status solidi - Rapid Res. Lett., vol. 7, no. 9, pp. 664–667,
Sep. 2013.
[100] W. Q. Hu, E. J. Liang, P. Ding, G. W. Cai, and Q. Z. Xue, “Surface plasmon resonance
and field enhancement in #-shaped gold wires metamaterial,” Opt. Express, vol. 17, no.
24, p. 21843, Nov. 2009.
[101] I. T. Leite et al., “Ag-nanowire metamaterials: spectral reflectance analysis and
homogenization models,” in 8th Iberoamerican Optics Meeting and 11th Latin American
Meeting on Optics, Lasers, and Applications, 2013, vol. 8785, p. 8785FL.
[102] M. A. Schmidt and P. S. Russell, “Long-range spiralling surface plasmon modes on
metallic nanowires,” Opt. Express, vol. 16, no. 18, p. 13617, Sep. 2008.

Bibliography
137
[103] B. Shuai, L. Xia, Y. Zhang, and D. Liu, “A multi-core holey fiber based plasmonic sensor
with large detection range and high linearity,” Opt. Express, vol. 20, no. 6, pp. 5974–
5986, Mar. 2012.
[104] H. W. Lee et al., “Pressure-assisted melt-filling and optical characterization of Au nano-
wires in microstructured fibers,” Opt. Express, vol. 19, no. 13, pp. 12180–12189, Jun.
2011.
[105] H. K. Tyagi et al., “Plasmon resonances on gold nanowires directly drawn in a step-
index fiber,” Opt. Lett., vol. 35, no. 15, pp. 2573–2575, Aug. 2010.
[106] C. Jain, A. Tuniz, K. Reuther, T. Wieduwilt, M. Rettenmayr, and M. A. Schmidt, “Micron-
sized gold-nickel alloy wire integrated silica optical fibers,” Opt. Mater. Express, vol.
6, no. 6, pp. 1790–1799, Jun. 2016.
[107] N. Luan, C. Ding, and J. Yao, “A Refractive Index and Temperature Sensor Based on
Surface Plasmon Resonance in an Exposed-Core Microstructured Optical Fiber,” IEEE
Photonics J., vol. 8, no. 2, pp. 1–8, Apr. 2016.
[108] R. Otupiri, E. K. Akowuah, and S. Haxha, “Multi-channel SPR biosensor based on PCF for
multi-analyte sensing applications,” Opt. Express, vol. 23, no. 12, pp. 15716–15727,
Jun. 2015.
[109] N. Cennamo et al., “Modal Filtering for Optimized Surface Plasmon Resonance Sensing
in Multimode Plastic Optical Fibers,” IEEE Sens. J., vol. 15, no. 11, pp. 6306–6312, Nov.
2015.
[110] D. Felipe Santos, A. Guerreiro, and J. Manuel Baptista, “Simultaneous plasmonic
measurement of refractive index and temperature based on a D-type fiber sensor with
gold wires,” IEEE Sens. J., vol. 17, no. 8, pp. 1–1, Apr. 2017.
[111] M. Benounis, N. Jaffrezic-Renault, J. P. Dutasta, K. Cherif, and A. Abdelghani, “Study
of a new evanescent wave optical fibre sensor for methane detection based on
cryptophane molecules,” Sensors Actuators, B Chem., vol. 107, no. 1 SPEC. ISS., pp. 32–
39, 2005.
[112] F. M. Araújo, L. a Ferreira, J. L. Santos, and F. Farahi, “Temperature and strain
insensitive bending measurements with D-type fibre Bragg gratings,” Meas. Sci.
Technol., vol. 12, no. 7, pp. 829–833, 2001.
[113] O. Frazao, P. Jorge, J. M. Baptista, and J. L. Santos, “Optical refractometer based on a
Hi-Bi D-type fiber loop mirror,” in 2008 IEEE Sensors, 2008, pp. 957–960.
[114] M.-H. Chiu, S.-F. Wang, and R.-S. Chang, “D-type fiber biosensor based on surface-
plasmon resonance technology and heterodyne interferometry,” Opt. Lett., vol. 30, no.
3, p. 233, Feb. 2005.
[115] J. Homola, H. B. Lu, G. G. Nenninger, J. Dostálek, and S. S. Yee, “A novel multichannel
surface plasmon resonance biosensor,” Sensors and Actuators, B: Chemical, vol. 76, no.
1–3. pp. 403–410, Jun-2001.
[116] P. Uebel, “Metal filled optical fibers - photonics and plasmonics on the nanoscale,”
Friedrich-Alexander-Universität Erlangen-Nürnberg Metal, 2013.
[117] D. Christensen and D. Fowers, “Modeling SPR sensors with the finite-difference time-
domain method,” Biosens. Bioelectron., vol. 11, no. 6–7, pp. 677–684, 1996.
[118] T. a Birks, J. C. Knight, and P. S. J. Russell, “Endlessly single-mode photonic crystal
fiber,” Opt. Lett., vol. 22, no. 13, p. 961, 1997.
[119] S. M. Kuo, Y. W. Huang, S. M. Yeh, W. H. Cheng, and C. H. Lin, “Liquid crystal modified
photonic crystal fiber (LC-PCF) fabricated with an SU-8 photoresist sealing technique
for electrical flux measurement,” Proc. IEEE Int. Conf. Micro Electro Mech. Syst., vol.
19, no. 19, pp. 803–806, Sep. 2010.
[120] S.-J. Park et al., “Nanosilver Colloids-Filled Photonic Crystal Arrays for
Photoluminescence Enhancement,” Nanoscale Res. Lett., vol. 5, no. 10, pp. 1590–1595,
Oct. 2010.
[121] Y. Lu et al., “Grapefruit Fiber Filled with Silver Nanowires Surface Plasmon Resonance
Sensor in Aqueous Environments,” Sensors, vol. 12, no. 12, pp. 12016–12025, Aug. 2012.
[122] N. Luan, R. Wang, W. Lv, and J. Yao, “Surface plasmon resonance sensor based on D-
shaped microstructured optical fiber with hollow core,” Opt. Express, vol. 23, no. 7, p.
8576, Apr. 2015.
[123] J. Homola, “Present and future of surface plasmon resonance biosensors,” Anal.
Bioanal. Chem., vol. 377, no. 3, pp. 528–539, Oct. 2003.

Bibliography
138
[124] H.-Y. Lin, W.-H. Tsai, Y.-C. Tsao, and B.-C. Sheu, “Side-polished multimode fiber
biosensor based on surface plasmon resonance with halogen light,” Appl. Opt., vol. 46,
no. 5, p. 800, Feb. 2007.
[125] N. Cennamo, L. Coelho, A. Guerreiro, P. A. S. Jorge, and L. Zeni, “SPR sensors in POF:
a new experimental configuration for extended refractive index range and better SNR,”
in 23rd International Conference on Optical Fibre Sensors, 2014, vol. 9157, p. 915759.
[126] J. Homola, S. S. Yee, and G. Gauglitz, “Surface plasmon resonance sensors: review,”
Sensors Actuators B Chem., vol. 54, no. 1–2, pp. 3–15, Jan. 1999.
[127] E. Fontana, “A novel gold-coated multimode fiber sensor,” IEEE Trans. Microw. Theory
Tech., vol. 50, no. 1, pp. 82–87, 2002.
[128] R. Jha, R. K. Verma, and B. D. Gupta, “Surface Plasmon Resonance-Based Tapered Fiber
Optic Sensor: Sensitivity Enhancement by Introducing a Teflon Layer Between Core and
Metal Layer,” Plasmonics, vol. 3, no. 4, pp. 151–156, Dec. 2008.
[129] V. M. Muñoz-Berti et al., “Low cost plastic optical fiber sensor based on surface plasmon
resonance,” in Fourth European Workshop on Optical Fibre Sensors, 2010, vol. 7653, p.
765327.
[130] Y. Jin and A. M Granville, “Polymer Fiber Optic Sensors – A Mini Review of their Synthesis
and Applications,” J. Biosens. Bioelectron., vol. 7, no. 1, pp. 1–11, 2016.
[131] R. Galatus, N. Cennamo, and E. Voiculescu, “Optimal Design of D-Type Plastic Fibers for
Best Sensitivity of SPR Sensors,” Adv. Eng. Forum, vol. 8–9, pp. 563–573, Jun. 2013.
[132] N. Cennamo and L. Zeni, “Bio and Chemical Sensors Based on Surface Plasmon
Resonance in a Plastic Optical Fiber,” in Optical sensors - New developments and
practical applications, InTech, 2014, pp. 119–140.
[133] N. Cennamo, G. D’Agostino, R. Galatus, L. Bibbò, M. Pesavento, and L. Zeni, “Sensors
based on surface plasmon resonance in a plastic optical fiber for the detection of
trinitrotoluene,” Sensors Actuators B Chem., vol. 188, pp. 221–226, Nov. 2013.
[134] A. M. Shrivastav, S. K. Mishra, and B. D. Gupta, “Fiber optic SPR sensor for the detection
of melamine using molecular imprinting,” Sensors Actuators B Chem., vol. 212, pp. 404–
410, Jun. 2015.
[135] N. Cennamo, L. De Maria, G. D’Agostino, L. Zeni, and M. Pesavento, “Monitoring of Low
Levels of Furfural in Power Transformer Oil with a Sensor System Based on a POF-MIP
Platform,” Sensors, vol. 15, no. 4, pp. 8499–8511, Apr. 2015.
[136] R. S. Kshetrimayum, “A brief intro to metamaterials,” IEEE Potentials, vol. 23, no. 5,
pp. 44–46, 2004.
[137] D. F. Santos, A. Guerreiro, and J. M. Baptista, “SPR optimization using metamaterials
in a D-type PCF refractive index sensor,” Opt. Fiber Technol., vol. 33, pp. 83–88, Jan.
2017.
[138] W. Cai and V. Shalaev, Optical Metamaterials, Springer., vol. 10, no. 6011. New York,
NY: Springer New York, 2010.
[139] K.-S. Lee, J. M. Son, D.-Y. Jeong, T. S. Lee, and W. M. Kim, “Resolution Enhancement
in Surface Plasmon Resonance Sensor Based on Waveguide Coupled Mode by Combining
a Bimetallic Approach,” Sensors, vol. 10, no. 12, pp. 11390–11399, Dec. 2010.
[140] P. R. West, S. Ishii, G. V. Naik, N. K. Emani, V. M. Shalaev, and A. Boltasseva, “Searching
for better plasmonic materials,” Laser Photon. Rev., vol. 4, no. 6, pp. 795–808, Nov.
2010.
[141] C. a. Pfeiffer, E. N. Economou, and K. L. Ngai, “Surface polaritons in a circularly
cylindrical inferface: Surface plasmons,” Phys. Rev. B, vol. 10, no. 8, pp. 3038–3051,
1974.
[142] N. Luan and J. Yao, “Surface Plasmon Resonance Sensor Based On Exposed-Core
Microstructured Optical Fiber Placed With A Silver Wire,” IEEE Photonics J., vol. 8, no.
1, pp. 1–8, Feb. 2016.
[143] J. Dostálek et al., “Surface plasmon resonance biosensor based on integrated optical
waveguide,” Sensors Actuators B Chem., vol. 76, no. 1–3, pp. 8–12, Jun. 2001.
[144] P. Mao et al., “Design and optimization of surface plasmon resonance sensor based on
multimode fiber,” Opt. Quantum Electron., vol. 47, no. 6, pp. 1495–1502, Jun. 2015.
[145] L. Coelho, J. M. M. M. de Almeida, J. L. Santos, R. A. S. Ferreira, P. S. André, and D.
Viegas, “Sensing Structure Based on Surface Plasmon Resonance in Chemically Etched
Single Mode Optical Fibres,” Plasmonics, vol. 10, no. 2, pp. 319–327, Apr. 2015.

Bibliography
139
[146] G. An, S. Li, W. Qin, W. Zhang, Z. Fan, and Y. Bao, “High-Sensitivity Refractive Index
Sensor Based on D-Shaped Photonic Crystal Fiber with Rectangular Lattice and Nanoscale
Gold Film,” Plasmonics, vol. 9, no. 6, pp. 1355–1360, Dec. 2014.
[147] A. Belahmar and A. Chouiyakh, “Investigation of Surface Plasmon Resonance and Optical
Band Gap Energy in Gold / Silica Composite Films Prepared by RF-Sputtering,” Nanosci.
Technol., vol. 2, no. 2, pp. 81–84, 2016.
[148] Y. Zhao, Z.-Q. Deng, and H.-F. Hu, “Fiber-Optic SPR Sensor for Temperature
Measurement,” IEEE Trans. Instrum. Meas., vol. 64, no. 11, pp. 3099–3104, Nov. 2015.
[149] T. Hu, Y. Zhao, and A. ning Song, “Fiber optic SPR sensor for refractive index and
temperature measurement based on MMF-FBG-MMF structure,” Sensors Actuators, B
Chem., vol. 237, pp. 521–525, 2016.
[150] C. Gouveia, G. Chesini, C. M. B. Cordeiro, J. M. Baptista, and P. A. S. Jorge,
“Simultaneous measurement of refractive index and temperature using multimode
interference inside a high birefringence fiber loop mirror,” Sensors Actuators B Chem.,
vol. 177, pp. 717–723, Feb. 2013.
[151] A. K. Sharma and B. D. Gupta, “Influence of temperature on the sensitivity and signal-
to-noise ratio of a fiber-optic surface-plasmon resonance sensor,” Appl. Opt., vol. 45,
no. 1, pp. 151–161, Jan. 2006.
[152] A. Alabastri et al., “Molding of Plasmonic Resonances in Metallic Nanostructures:
Dependence of the Non-Linear Electric Permittivity on System Size and Temperature,”
Materials (Basel)., vol. 6, no. 11, pp. 4879–4910, Oct. 2013.
[153] J. Homola and M. Piliarik, “Surface Plasmon Resonance (SPR) Sensors,” in Springer Ser
Chem Sens Biosens, vol. 4, 2006, pp. 45–67.
[154] T. Srivastava, R. Das, and R. Jha, “Highly Sensitive Plasmonic Temperature Sensor Based
on Photonic Crystal Surface Plasmon Waveguide,” Plasmonics, vol. 8, no. 2, pp. 515–
521, Jun. 2013.
[155] Feng Xiao, D. Michel, Guangyuan Li, Anshi Xu, and K. Alameh, “Simultaneous
Measurement of Refractive Index and Temperature Based on Surface Plasmon Resonance
Sensors,” J. Light. Technol., vol. 32, no. 21, pp. 4169–4173, Nov. 2014.


