Page 1
Retrospective Theses and Dissertations Iowa State University Capstones, Theses andDissertations
2005
A numerical approach to model and predict theenergy absorption and crush mechanics within along-fiber composite crush tubeLeon Pickett Jr.Iowa State University
Follow this and additional works at: https://lib.dr.iastate.edu/rtd
Part of the Aerospace Engineering Commons, and the Applied Mechanics Commons
This Dissertation is brought to you for free and open access by the Iowa State University Capstones, Theses and Dissertations at Iowa State UniversityDigital Repository. It has been accepted for inclusion in Retrospective Theses and Dissertations by an authorized administrator of Iowa State UniversityDigital Repository. For more information, please contact [email protected] .
Recommended CitationPickett, Leon Jr., "A numerical approach to model and predict the energy absorption and crush mechanics within a long-fibercomposite crush tube " (2005). Retrospective Theses and Dissertations. 1766.https://lib.dr.iastate.edu/rtd/1766
Page 2
NOTE TO USERS
This reproduction is the best copy available.
®
UMI
Page 4
A numerical approach to model and predict the energy absorption and crush mechanics
within a long-fiber composite crush tube
by
Leon Pickett, Jr.
A dissertation submitted to the graduate faculty in
partial fulfillment of the requirements for the degree of
DOCTOR OF PHILOSOPHY
Major: Engineering Mechanics
Program of Study Committee: Vinay Dayal, Major Professor
Dale Chimenti Thomas McDaniel
David Hsu Derrick Rollins
Iowa State University
Ames, Iowa
2005
Copyright © Leon Pickett Jr., 2005. All rights reserved.
Page 5
UMI Number: 3200453
INFORMATION TO USERS
The quality of this reproduction is dependent upon the quality of the copy
submitted. Broken or indistinct print, colored or poor quality illustrations and
photographs, print bleed-through, substandard margins, and improper
alignment can adversely affect reproduction.
In the unlikely event that the author did not send a complete manuscript
and there are missing pages, these will be noted. Also, if unauthorized
copyright material had to be removed, a note will indicate the deletion.
UMI UMI Microform 3200453
Copyright 2006 by ProQuest Information and Learning Company.
All rights reserved. This microform edition is protected against
unauthorized copying under Title 17, United States Code.
ProQuest Information and Learning Company 300 North Zeeb Road
P.O. Box 1346 Ann Arbor, Ml 48106-1346
Page 6
11
Graduate College
Iowa State University
This is to certify that the doctoral dissertation of
Leon Pickett, Jr.
has met the dissertation requirements of Iowa State University
Maj Professor
For the Major Program
Signature was redacted for privacy.
Signature was redacted for privacy.
Page 7
iii
DEDICATION
This dissertation is dedicated to my entire family (no exceptions); especially my mother,
Barbara; my wife, LaTasha and my children, Akilah and Hasan.
Page 8
IV
TABLE OF CONTENTS
CHAPTER 1 : GENERAL INTRODUCTION 1
Fundamental Theories 1
Composites 1
Composite Fibers 1
Composite Matrices 2
Highlights & Advantages 2
Composite Usage 3
Crash worthiness 4
Constitutive Equations 5
Engineering Constants 5
Composite Laminate Plate Theory 7
Laminate Constitutive Equations 8
Effective Moduli (Smeared Properties) 11
Finite Element Analysis 11
Composite Failure Mechanics 16
Fracture Mechanics 17
Literature Review 19
Energy Absorption Crushing Mechanics 19
Initiation of stable composite crushing modes 21
Fiber Orientation, Geometry and Velocity Effects 23
Fiber Orientation Effects 23
Geometry Effects 24
Velocity Effects 25
Organization of the Thesis 27
References 28
CHAPTER 2: FINITE ELEMENT MODEL OF A DYNAMIC COMPOSITE CRUSH EVENT 31
Abstract 31
Introduction 31
Methodology 35
Materials 35
Tube Dimensions 37
Impact Characteristics 37
Specimens 37
Computation of Energy Absorption 39
Page 9
V
Finite Element Model 39
Results and Discussion 40
Effect of Angle, 0, on solution convergence 43
Evaluation of Solution Time 44
Conclusions 45
References 46
CHAPTER 3: THE EFFECT OF PLY ANGLE ON ENERGY ABSORPTION OF A CIRCULAR
GLASS/EPOXY CRUSH TUBE 48
Abstract 48
Introduction 48
Methodology 53
Numerical Solution 53
FEA Model 54
Materials 54
Tube Dimensions 55
Finite Elements 55
Impact Characteristics 55
Post-Processing 56
Computation of Energy Absorption 56
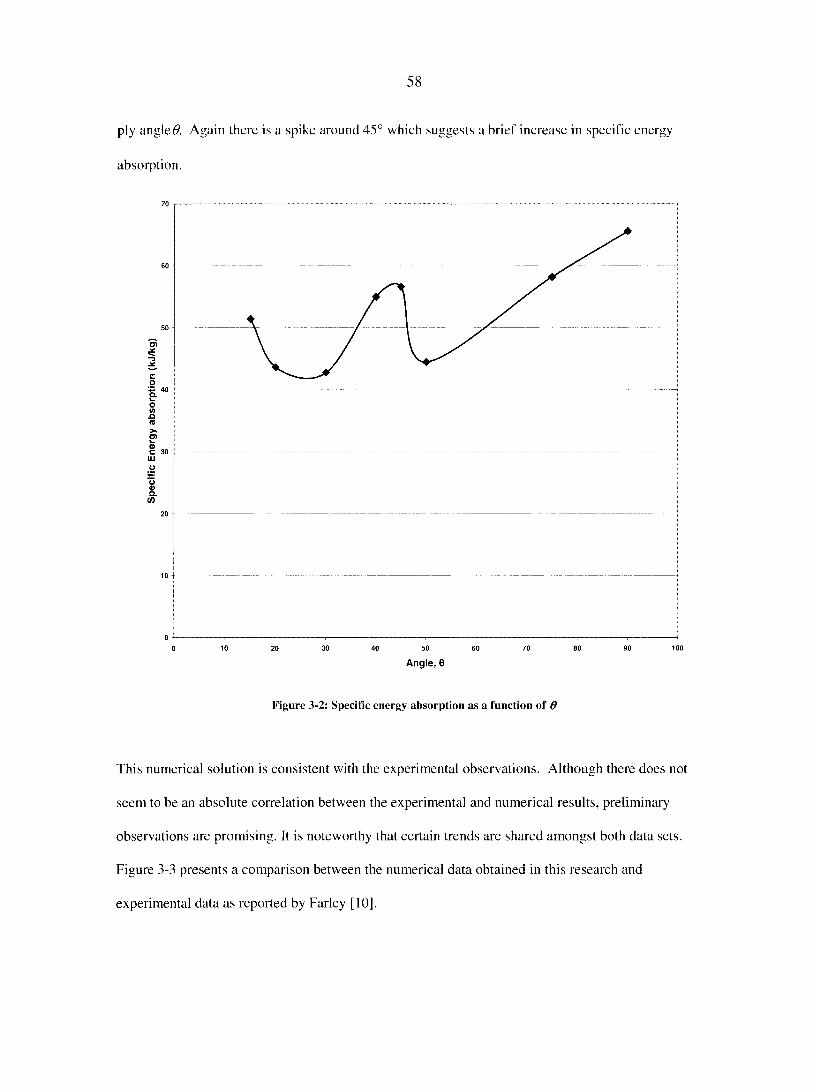
Results and Discussion 56
Conclusions 66
References 66
CHAPTER 4: THE EFFECT OF IMPACT VELOCITY ON ENERGY ABSORPTION OF A CIRCULAR
GLASS/EPOXY CRUSH TUBE 68
Abstract 68
Introduction 68
Methodology 71
Finite Element Model 71
Materials 72
Tube Dimensions 73
Impact Characteristics 73
Post-Processing 73
Computation of Energy Absorption 74
Results and Discussion 74
Impact Velocity and Impact Energy 74
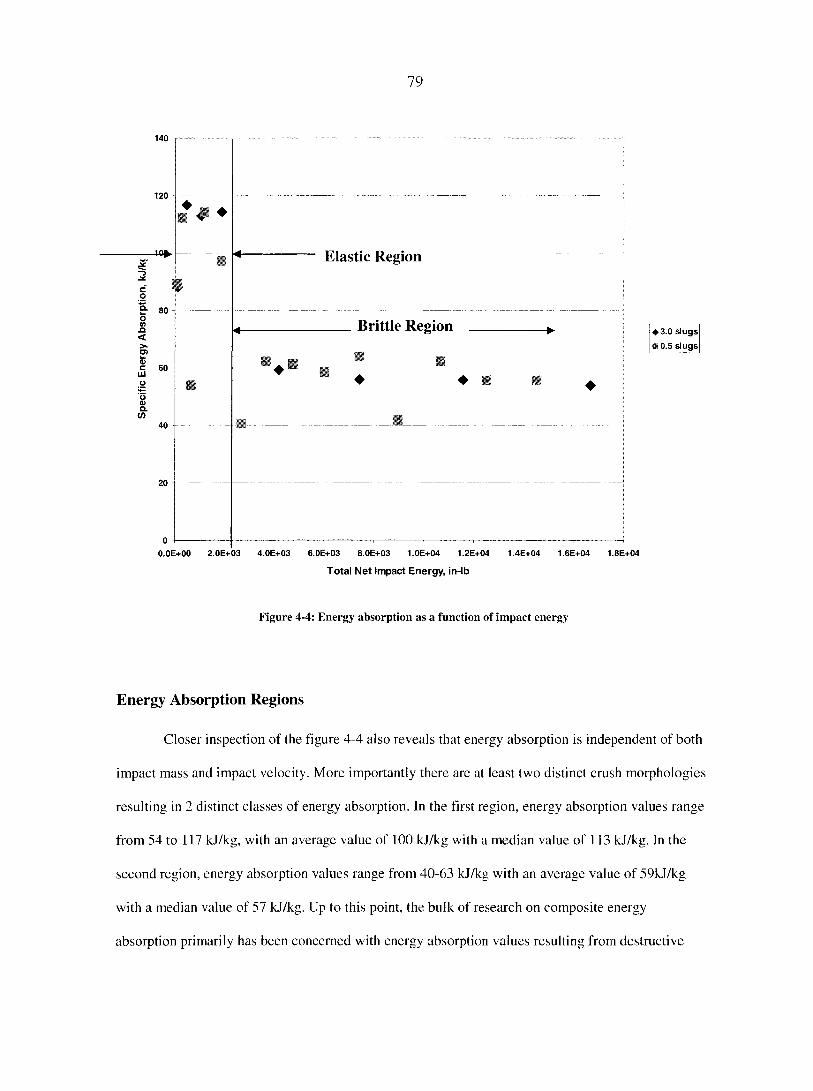
Energy Absorption Regions 79
Page 10
VI
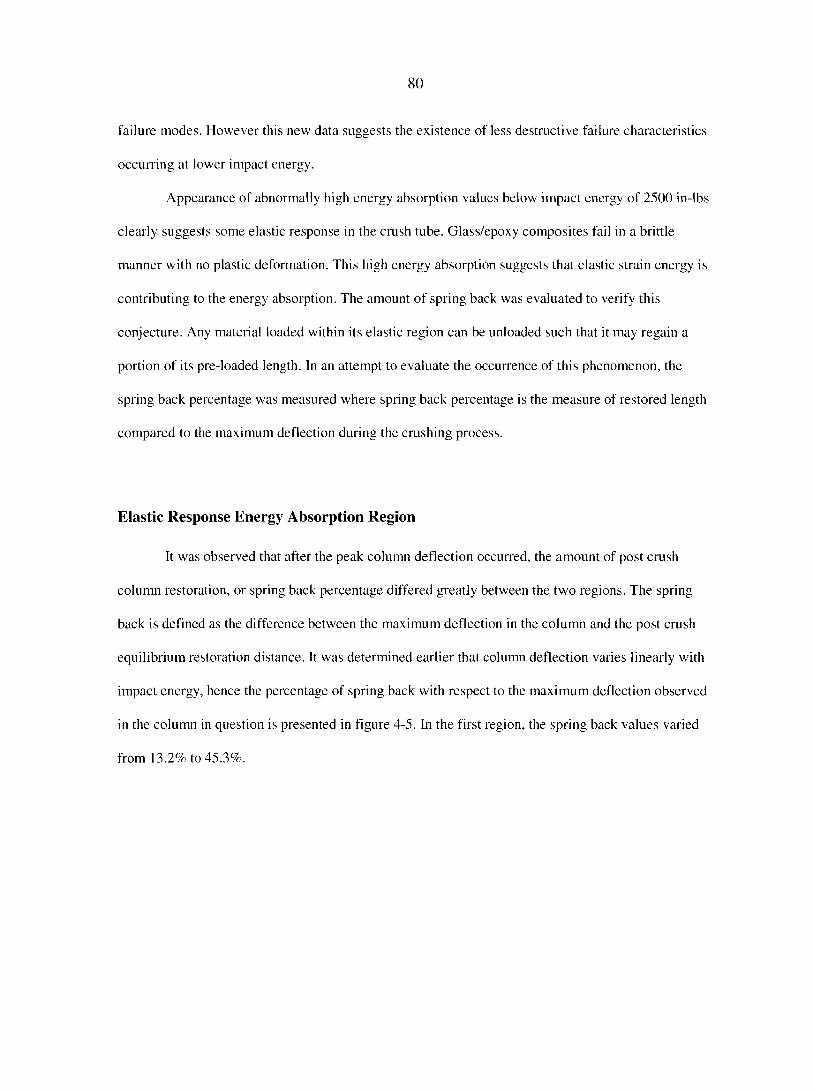
Elastic Response Energy Absorption Region 80
Brittle Response Energy Absorption Region 81
Conclusions 84
References 84
CHAPTER 5: THE EFECT OF TUBE GEOMETRY ON ENERGY ABSORPTION OF A CIRCULAR
GLASS/EPOXY CRUSH TUBE 87
Abstract 87
Introduction 87
Methodology 91
Finite Element Model 91
Materials 92
Tube Dimensions 92
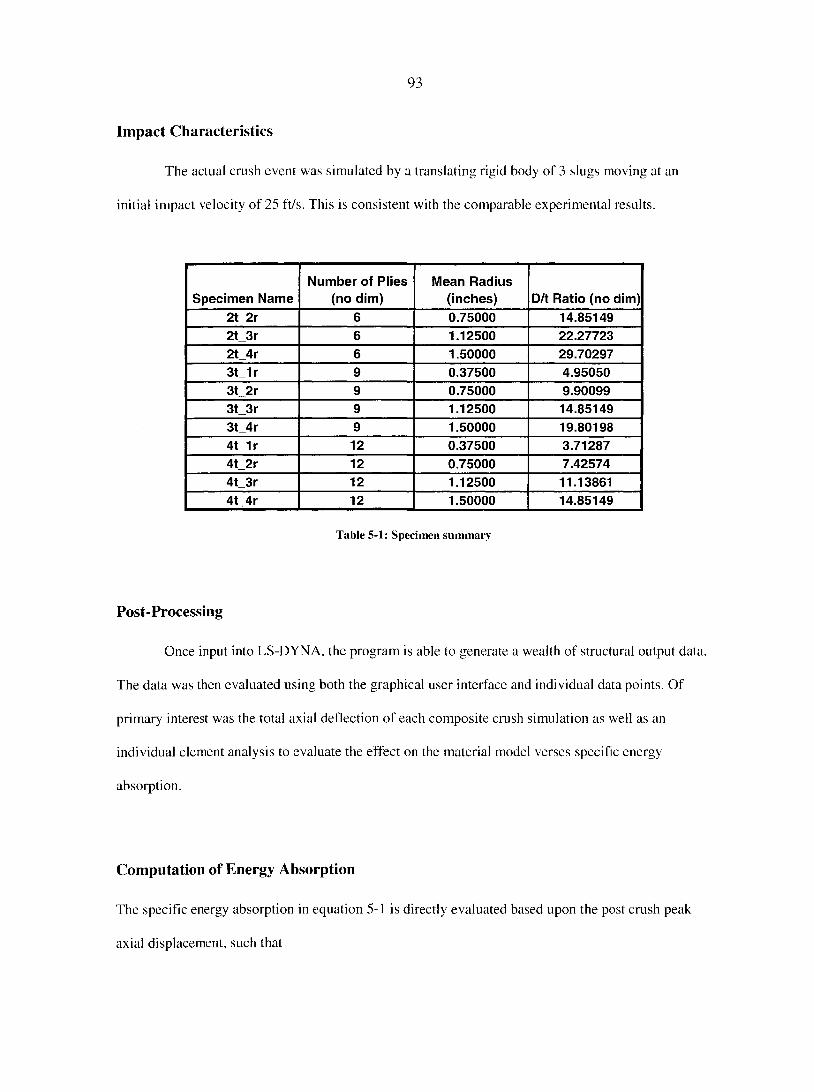
Impact Characteristics 93
Post-Processing 93
Computation of Energy Absorption 93
Results and Discussion 94
Preliminaries 95
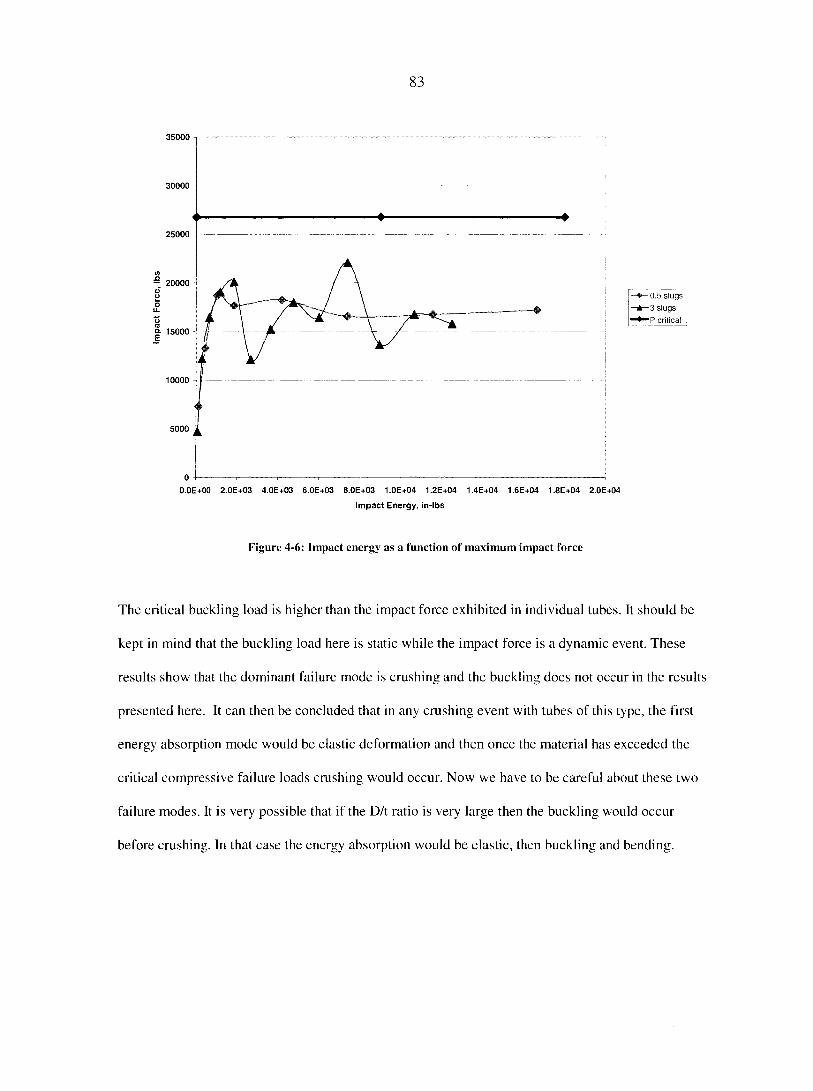
Critical Buckling Load 95
Effect of Tube Radius 97
Effect of Number of Plies 100
D/t Ratio 103
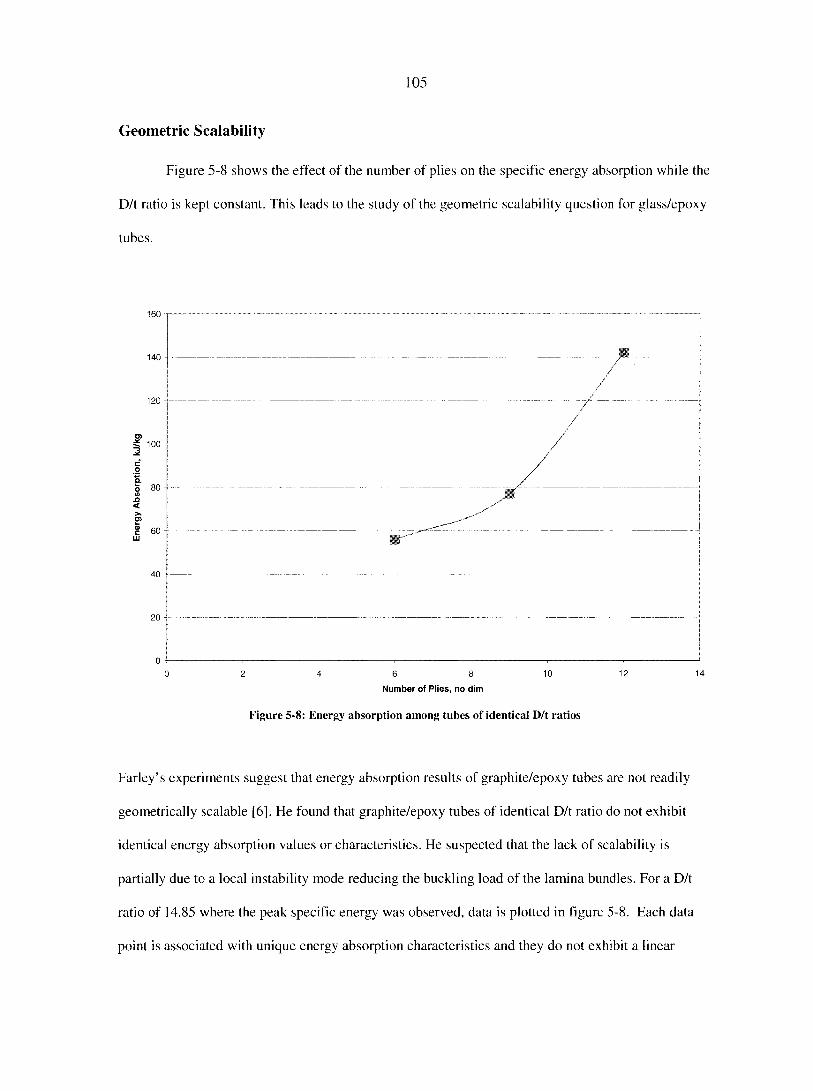
Geometric Scalability 105
Conclusions 106
References 107
CHAPTER 6: GENERAL CONCLUSIONS 110
APPENDIX 113
ANSYS Preprocessor Input Deck 113
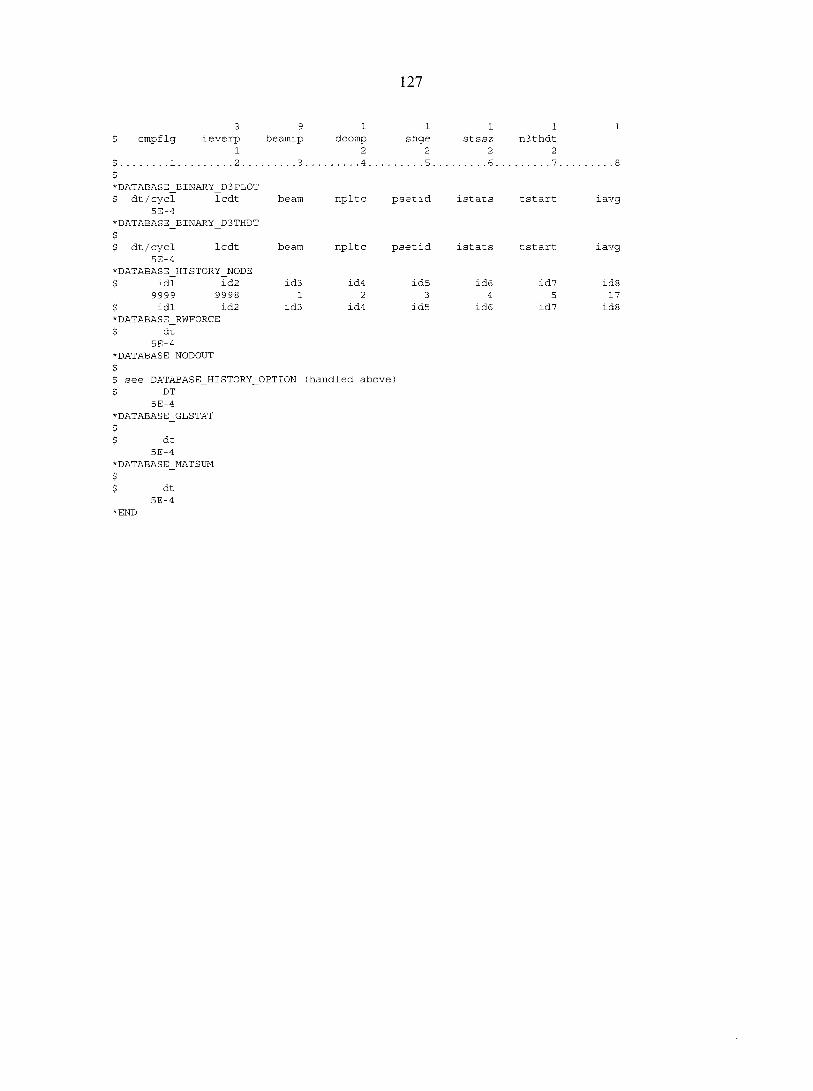
Typical LS-DYNA Input Deck 115
Page 11
1
CHAPTER 1: GENERAL INTRODUCTION
Fundamental Theories
Composites
Composite materials are engineered materials that consist of two or more materials that
together produce desirable properties that cannot be achieved with any of the constituents alone.
There is no chemical bonding between the constituents of the composites. By this general definition,
it is clear that there are numerous examples of composites, many of which commonly occur in nature.
Long fiber structural composites consist of high strength and high modulus fibers surrounded by a
matrix material. In these composites, fibers are the principal load carrying members. The matrix
material keeps the fibers together, acts as a load transfer medium between fibers, and protects fibers
from being exposed to the environment. For the purposes of this dissertation, the term composite is
meant to refer to a specific type of long fiber structural composite comprised of glass fibers within an
epoxy matrix.
Composite Fibers
In the construction of advanced composites there are a wide variety of fibers available to suit
an even wider variety of applications. As such, different fibers may have different morphology,
material, size and shape. Fibers are generally stiffer and stronger than the same material in bulk form.
The reason for the excellent stiffness and strength properties is due to near perfect molecular chains
with no grain boundaries. These fibers have very small cross sections ranging from 3 to 147 |im,
which naturally results in a very high length to diameter ratio [1],
Page 12
9
Composite Matrices
Polymers, metals and ceramics have all been successfully employed as matrix materials in the
fabrication of advanced composites. Among these materials, polymers are most commonly used in
advanced composites. These polymeric materials are further subdivided into thermoplastics and
thermosets. Thermoplastic polymers have the advantage of softening upon heating and can be
reshaped with heat and pressure. Thermoplastics offer the potential for higher toughness and higher
volume, low cost processing. Thermoplastics have a useful temperature rang upwards of 225°C.
Conversely, thermoset polymers become cross-linked during fabrication and do not soften upon
reheating. The most common thermoset polymer matrix materials are polyesters, epoxies, and
polymides. Epoxies are relatively inexpensive but have better moisture resistance and lower shrinkage
on curing [1].
Highlights and Advantages
Although initially sought and developed because of their potential for lighter structures, today
composites have evolved into the "chosen" material for many reasons other than the opportunity to
reduce weight. Many composites are now found to exhibit both high specific stiffness and high
specific strength as compared with traditional engineering materials, including: aluminum and steel.
These properties are significant in that they lead to improved performance and reduce energy
consumption; both of which are key aspects in the design of most engineering structures. Since
composites are fabricated structures, they can be engineered to meet the specific demands of
particular applications. Thus, more efficient structures can be fabricated with much less material
waste. Many composites can also be fabricated to have superior fatigue life as compared to traditional
Page 13
engineering materials. In fact, it is primarily for this reason that composites are finding increased
application in the aircraft industry. The directional thermal expansion coefficient of composites
allows us to design composites, which exhibit very low cyclic thermal expansion properties. This is
extremely advantageous in applications where thermal expansion is a consideration. Composites,
depending on the selection of the matrix materials, can be fabricated to be entirely resistant to
moisture and chemical corrosion. This leads to a substantial reduction in maintenance costs and an
increase in useful life. With the obvious exception of metal matrix composites, composites are usually
electrically non-conducting. However, on the other hand, copper matrix composites are now under
consideration for high temperature applications because of their high thermal conductivity. Today
with advanced manufacturing techniques, composites can be tailored to exact standards and
components can be fabricated with low material waste. Depending on the application, these
efficiencies in many cases directly lead to substantial cost savings. Pound for pound, composites are
generally more expensive than traditional materials; however upon evaluating the cumulative benefits
mentioned over the lifetime of the application, composites usage may lead to an overall costs savings
[1].
Composite Usage
Composite materials have seen extensive use in a number of select fields. Composites are
very attractive to the aircraft industry because of their specific stiffness, specific strength, design
tailorablity and fatigue resistance. In the athletic and recreational equipment field, composites are
being used in golf clubs, hockey sticks, helmets, fishing rods, boats and racecars. In the military and
law enforcement, composites have long been used to manufacture bulletproof vests. The medical,
construction, electronic and automotive industries have seen increased applications for composites.
Page 14
4
Of these, the automotive industry represents a tremendous opportunity to incorporate the use of
composites.
Crashworthiness
A structural material's ability to absorb impact energy is generally referred to as the
"crashworthiness" of the structure. In passenger vehicles, current legislation [2] requires that vehicles
be designed such that, in the event of an impact at speeds up to 15.5m/s (35mph) with a solid,
immovable object, the occupants of the passenger compartment should not experience a resulting
force that produces a net deceleration greater than 20g. Additionally, it is imperative that crashworthy
structures are designed to crush in a fairly predictable and controlled manner. Traditionally, these
crash structures have been constructed from structural steel. Although clearly useful as structural
members, steel and other metals also come with relatively higher weight trade-offs and can ultimately
lead to undesirable inertial effects as it pertains to crash events.
In an attempt to overcome these negative inertial effects, lighter weight structural materials
are beginning to be evaluated for crashworthiness. Foremost among these materials are long-fiber
structural composites. Composite materials represent superior specific energy absorption when
compared to most isotropic materials. In metals, all the energy is absorbed in plastic deformation,
while in composites the fracture energy is dominant. A closer look at the corresponding stress-strain
curves shows that for all high-performance composites, this relationship is essentially linear in nature.
In comparison, metals exhibit a distinctly linear stress-strain relationship followed by a large range
where the metal experiences plastic deformation before failure. The lesson from the comparisons of
the stress strain behavior is that materials, which are essentially elastic to failure (composites,
ceramics), might be considered to have no capacity for energy absorption since no plastic deformation
energy is available to satisfy such requirements. However, various experiments have found that
Page 15
5
elastic, brittle materials can be very effective energy absorbers. Nevertheless, the full extent to which
this is possible is still being researched.
Constitutive Equations
To evaluate the capacity for a composite to manage impact energy, a closer look at its
mechanics is warranted. The generalized Hooke's law relates stresses to strains in an orthogonal
coordinate system [1], For composites, the relationships between stress and strain are linear with the
most general form being
( T i j = C i j k l £ k l 1 " ̂
where Ojj is the stress tensor, ey is the strain tensor, and Cijkl is the stiffness tensor, a 4,h order tensor
with 81 elastic constants. This linear elastic stress-strain constitutive relationship is called the
Generalized Hooke's law. For an orthotopic material, these 81 constants can be reduced to 9
independent constants;
C„ C„ 0 0 0 "
C,2 C,, C,] 0 0 0
Cy C„ 0 0 0 J,
0 0 0 C44 0 0
0 0 0 0 Q, 0
0 0 0 0 o c„,
Engineering Constants
The simplest form of the constitutive equations is obtained when they are written in terms of
stiffness and compliance coefficients, C(/ and 5% , respectively [1], However, properties that are
actually measured are called the engineering constants which relate measured stress to strains, which
can be easily related to the stiffness and compliance coefficients. We now define the material
[C] =
Page 16
6
coordinates 1-2 which are aligned with the fiber directions and x-y, any arbitrary coordinate system as
shown in Fig. 1-1
Finally, we then arrive at the constitutive equations in principal material coordinates for an
orthotropic material
V X S;, 0 0 0 ~
e2 Sr. s32 0 0 0 o2
A Sn s2, S i3 0 0 0
Ï4 0 0 0 S44 0 0 T,
7, 0 0 0 0 5» 0
A 0 0 0 0 0 V
Compliance coefficients come from the stress-strain relationships, i.e.
In compact form, the stress strain relation can be written as
Fig. 1-1 Material coordinate (1-2) and general coordinate (x-v) systems.
M=[s]M 1-5
Furthermore, the inverse of [S] yields [C] such that
M= [cM 1-6
where [C] = [>S]
Page 17
7
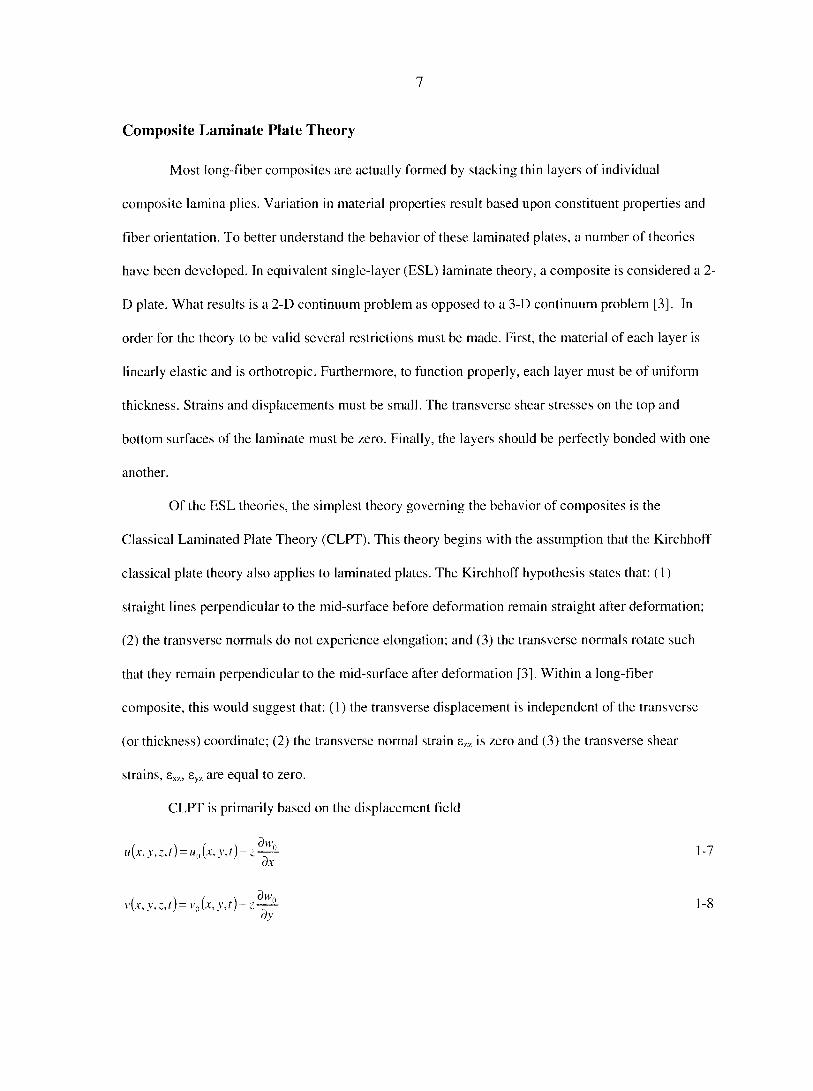
Composite Laminate Plate Theory
Most long-fiber composites are actually formed by stacking thin layers of individual
composite lamina plies. Variation in material properties result based upon constituent properties and
fiber orientation. To better understand the behavior of these laminated plates, a number of theories
have been developed. In equivalent single-layer (ESL) laminate theory, a composite is considered a 2-
D plate. What results is a 2-D continuum problem as opposed to a 3-D continuum problem [3]. In
order for the theory to be valid several restrictions must be made. First, the material of each layer is
linearly elastic and is orthotopic. Furthermore, to function properly, each layer must be of uniform
thickness. Strains and displacements must be small. The transverse shear stresses on the top and
bottom surfaces of the laminate must be zero. Finally, the layers should be perfectly bonded with one
another.
Of the ESL theories, the simplest theory governing the behavior of composites is the
Classical Laminated Plate Theory (CLPT). This theory begins with the assumption that the Kirchhoff
classical plate theory also applies to laminated plates. The Kirchhoff hypothesis states that: (1)
straight lines perpendicular to the mid-surface before deformation remain straight after deformation;
(2) the transverse normals do not experience elongation; and (3) the transverse normals rotate such
that they remain perpendicular to the mid-surface after deformation [3], Within a long-fiber
composite, this would suggest that: (1) the transverse displacement is independent of the transverse
(or thickness) coordinate; (2) the transverse normal strain azz is zero and (3) the transverse shear
strains, axz, eyz are equal to zero.
CLPT is primarily based on the displacement field
u ( x , y , z , t ) = u „ (x, y , t ) — z — — 1 -7 d x
v ( x , \ \ z , t ) = v n ( x , y , t ) - z ^ ~ ' - 8 d y
Page 18
8
w ( x . y , z , t ) = w f l ( x , y j ) 1-9
where ( i t 0 , v 0 . w 0 ) are the displacement components along the ( x , y , z ) coordinate directions,
respectively, of a point on the mid-plane (z = 0). The displacement field (equations 1-7 and 1-8)
implies that straight lines normal to the xy-plane before deformation remain straight and normal to the
mid-surface after deformation. The Kirchhoff assumption amounts to neglecting both transverse shear
and transverse normal effects; thus, deformation is entirely due to bending and in-plane stretching [3],
Although they exist as a simplified form of the 3-D problem, the ESL models often provide a
sufficiently accurate description of global response for thin to moderately thick laminates (gross
deflections, critical buckling loads, and fundamental vibration frequencies and associated mode
shapes). However, it should be noted that there are some distinct disadvantages when compared to 3-
D formulations. The plate assumption only works for thin shells and as the composite laminate
becomes thicker, the accuracy of the global response predicted by the ESL models decreases.
Additionally, when approaching regions of intense loading or geometric and material discontinuities,
the ESL models are often incapable of accurately describing the states of stress and strain. In both
cases, 3-D theories are preferred [3],
Laminate Constitutive Equations
With the introduction of CLPT, we clearly see there is a much more efficient means of
expressing the constitutive equations. The underlyi7ng assumptions of 2-D plate theory allow us to
apply the general constitutive relations in determining the specific laminate constitutive relations that
govern long-fiber structural composites [1]. It is often the case in the analysis of composites that a
condition of plane stress, Fig. 1-2, actually exists or is a very good approximation. Thus the need to
develop constitutive equations for plane stress. We start with the 3-D constitutive equation (equation
Page 19
9
1-2) for a single layer (lamina) of a unidirectional composite with a fiber orientation, 6, relative to the
global coordinates. Furthermore, 2-D CLPT requires that 033=123=13,=0.
(a) (b)
Figure 1-2: (a) 3-D and (b) 2-D states of stress
Thus, in principal material coordinates, the 3-D constitutive equations become:
~ Q u Q n 0 " .= 62, Q 2 2 0 e 2
r ! 2 . 0 0 C? 6 6 _ 7. 2 .
such that the stiffness terms may again be represented using engineering constants:
612 — 62 v N E 2 _ v2]E }
1 -- V, n V-> ] 1 — Ui I V, '
Q22
1-^21^12
Q b b = ̂ ,2
-12
1-13
1-14
Having clearly defined the plane stress constitutive equation in principal material coordinates,
we can now define the lamina stress-strain relations by performing 2-D transformations about the z
(out of plane) axis, such that
Page 20
10
where the corresponding transformation matrices for stress and stain respectively are
1-15
[71 =
m ~ i r 2 m n
n 2 m 2 - 2 m n
— m n n u i m 2 — n 2
1-16
where for plane stress problems m = c o s 6 and n = s i n d , and 6 is the direction of the fiber from the x-
axis.
Here we now may introduce the plane stress transformed reduced stiffness matrix: Q - [ R ] ' \ Q § T ]
c r r
r
Q \ \ 612 Gift
Q \ 2 0 2 2 Q l b
Q \ b Q l b Q b b
1-17
We may now write the equations for the in plane components of stress in terms of the transformed
stiffness coefficients. The laminate constitutive relation can be written as,
\ N
1 M
A B
B D 1 -18
where
Aj = XX^/, k ~ - 1-19
B i j W -4-J 1-20
1-21
Thus, the relationship between the applied stress resultants (force/unit length, [N], and moment/unit
length, [M]) and the mid-surface strains and curvatures can be written as;
>/ yvv • =
A1 A2 At.
A 2 A2 A»
At ^26 A*.
BU BN BLB
BN B22 B2B
B\B B2H BB6
1-22
Page 21
11
>/ ~BU BL2 K MR
• = 6, 2 B22 s2„ B2B BBH
f o £v
< - +
v " A-.
D u
D,:
D„
A, DU
D2 D2(
A„
*"v /r.„
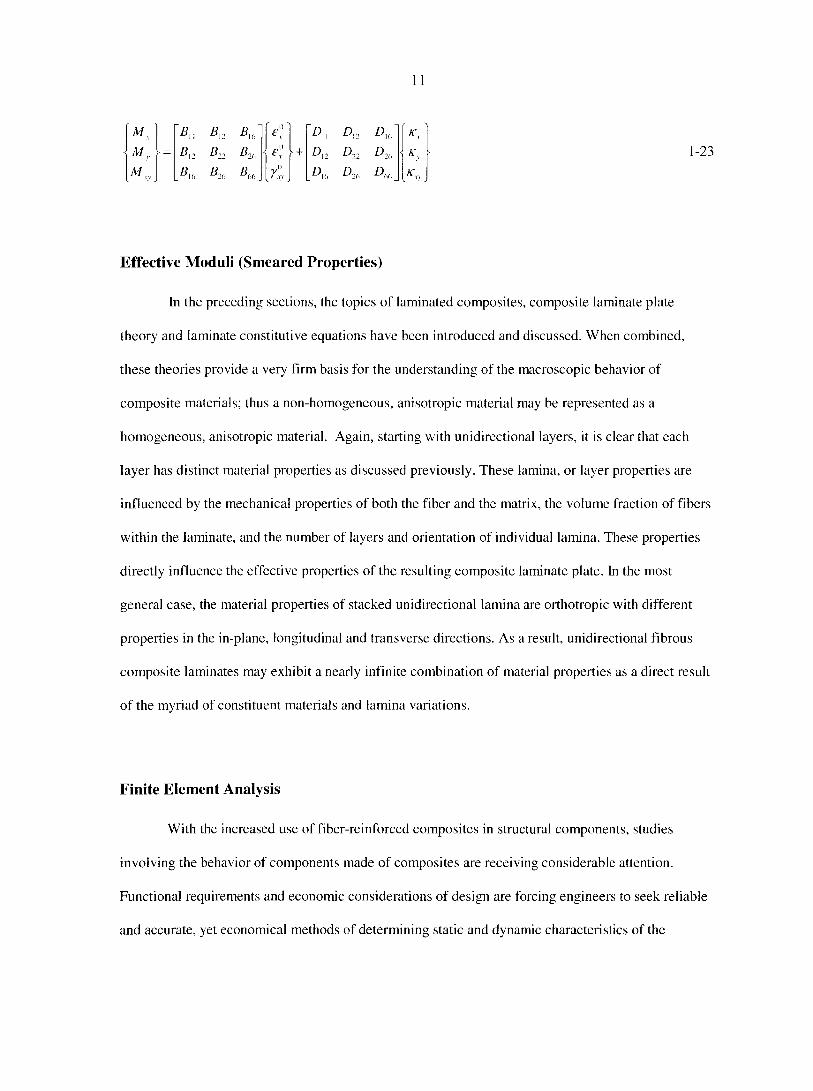
-23
Effective Moduli (Smeared Properties)
In the preceding sections, the topics of laminated composites, composite laminate plate
theory and laminate constitutive equations have been introduced and discussed. When combined,
these theories provide a very firm basis for the understanding of the macroscopic behavior of
composite materials; thus a non-homogeneous, anisotropic material may be represented as a
homogeneous, anisotropic material. Again, starting with unidirectional layers, it is clear that each
layer has distinct material properties as discussed previously. These lamina, or layer properties are
influenced by the mechanical properties of both the fiber and the matrix, the volume fraction of fibers
within the laminate, and the number of layers and orientation of individual lamina. These properties
directly influence the effective properties of the resulting composite laminate plate. In the most
general case, the material properties of stacked unidirectional lamina are orthotopic with different
properties in the in-plane, longitudinal and transverse directions. As a result, unidirectional fibrous
composite laminates may exhibit a nearly infinite combination of material properties as a direct result
of the myriad of constituent materials and lamina variations.
Finite Element Analysis
With the increased use of fiber-reinforced composites in structural components, studies
involving the behavior of components made of composites are receiving considerable attention.
Functional requirements and economic considerations of design are forcing engineers to seek reliable
and accurate, yet economical methods of determining static and dynamic characteristics of the
Page 22
12
structural components. The analytical study and design of composite materials requires knowledge of
anisotropic elasticity, structural theories and failure/damage criteria. Unlike isotropic materials,
anisotropic materials exhibit complicated mechanical behavior. The partial differential equations
governing composite laminates of arbitrary geometries and boundary conditions cannot be solved in
closed form; therefore, the use of numerical methods facilitates the solution. Among the numerical
methods available for the solution of differential equations defined over arbitrary domains, the finite
element method (FEM) is the most effective method. Finite element analysis of a structural problem
is a numerical analysis of the mathematical model used to represent the behavior of the structure [4],
In FEM, the solution domain is divided into a number of discrete elements. The
displacements within an element are generally the unknown field variables that are expressed in terms
of unknown nodal values. The governing load displacement relations for each element are written.
These equations are then assembled maintaining continuity between the elements and equilibrium at
the nodes. Finally, the boundary conditions are applied and the solution obtained for the load
displacement relationship for the entire structure. This may be achieved by first expressing each
displacement component in terms of trial coordinate functions, usually expressed as polynomials, the
number of unknown coefficients depending on the number of nodal degrees of freedom of the
element as shown:
u = A c 1-24
in which u = [«r u r u _ ] r , c is a vector whose scalars are element spatial coordinates and A is a
matrix of unknown coefficients. These coefficients are determined from element boundary conditions
yielding the relationship that expresses displacements within the element to their unknown nodal
values:
u = N u 1-25
where the superscript, <?, refers to element-wise values and N are the shape functions. For a three-
dimensional element, the shape function matrix N has 3 rows and its number of columns is equal to
Page 23
13
the total degrees of freedom of the element. This matrix may also be obtained directly by employing
suitable interpolation functions [4],
The strain displacement relationships from the strain matrix, e, are next generated using
equation 1-25
by differentiating the appropriate displacement components. The matrix B is the strain displacement
matrix which relates strain to displacement. It has six rows and its number of columns is equal to the
number of degrees of freedom of the element [4],
The principle of stationary total potential energy, V, can be simply stated as that of all
displacement states satisfying compatibility and boundary conditions; those that also satisfy
equilibrium make the total potential energy assume a stationary value. For a stable structure, the value
of V is always a minimum, which is also expressed as
V = U - W 1-27
in which (J is the internal strain energy and W is the potential of the external forces. Assuming that
the body is subjected to time-varying external forces, the displacements, strains, and stresses within a
finite element will all be functions of time. Then the strain energy of an element is given as
neglecting terms independent of elastic displacements and noting that s T D e T = ̂ £>£\ Equation 1-29
may finally be written in terms of element nodal displacements by beginning with equation 1-26:
£ = B i t ' 1-26
1-28
which reduces to
j'erC£dV - J£TC£TdV - J£TC£,dV 1-29
1-31
Page 24
14
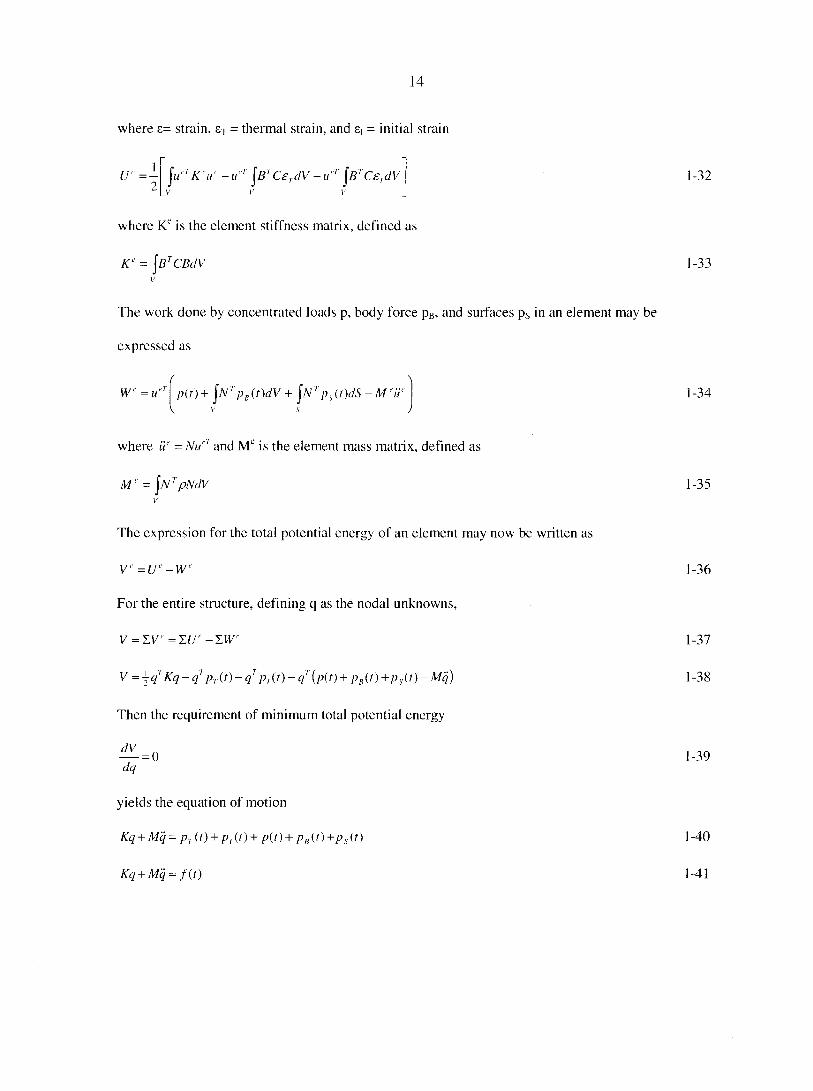
where e= strain, &, = thermal strain, and e, = initial strain
U c = - j u ' T K ' u ' - u ' T \ B T C £ T d V - u ' T jBT C £ , d V
where Kc is the element stiffness matrix, defined as
K' = jVcfcW y
The work done by concentrated loads p, body force pB, and surfaces ps in an element may be
expressed as
W = u
x I'
where i l e - N u e ' and Mc is the element mass matrix, defined as
M
1-32
1-33
1-34
1-35
The expression for the total potential energy of an element may now be written as
V e = U ' - W
For the entire structure, defining q as thé nodal unknowns,
V = X V = X U " - X W r
V = j q T K q — q T p T ( t ) — q T p , ( t ) - q T ( p { t ) + p B ( t ) + p s ( t ) - M q )
Then the requirement of minimum total potential energy
rfV- = 0 d q
yields the equation of motion
K q + M q = p r ( t ) + p , ( ? ) + p ( t ) + p B ( t ) + p s ( t )
K q + M q = f ( t )
1-36
1-37
1-38
1-39
1-40
1-41
Page 25
15
where the matrices and vectors refer to the entire structure and furthermore, K = stiffness matrix, P ,
thermal load, and Pt = inertia load. Most structures are characterized by the presence of structural as
well as viscous damping, in which case equation 1-41 takes the following form:
K ( \ + i g ) q + C D q + M q = f ( t ) 1-42
in which CD is viscous damping and equals aK+|3M, if the damping is proportional, and a and (5 are
the proportionality constants. For spinning structures with viscous damping the dynamic equations of
motion can be written as
+ + = 1-43
or
(^ + ^. + ̂ + (Q+Cg)g + M^ = /(f) 1-44
where KE =elastic stiffness matrix, KG= geometric stiffness matrix, incorporating the effect of in-
plane stretching on out-of-plane motion and K = centrifugal stiffness matrix. All matrices in the
preceding formulation except Cc are symmetric and usually highly banded. The matrix Cc is skew
symmetric being similarly banded. The associated matrix equation of free vibration may be written in
the general form as
K q + C q + M q = 0 1-45
where the definitions for K, C, and M depend on the problem type. Similarly, the un-damped equation
of free vibration takes the form
K q + M q = 0 1-46
and similar equations are encountered for structural instability or buckling problems. For static
problems, the matrix equation reduces simply to
K q = f 1-47
Clearly, the numerical analysis of a structural system consists of two distinct yet related solution
procedures. First, a finite element model of the system yields a set of algebraic equations that are then
Page 26
16
solved by employing a suitable numerical procedure. Because of the very nature of finite element
discretization, the resulting equations tend to be rather large in size, as well as highly banded for
many practical problems. An economical solution of such problems poses as much a challenge to an
analyst as the process of discretization itself [4],
Composite Failure Mechanics
As it pertains to composite materials, the topic of material failure is not as absolute as it is for
isotropic materials. Since composites are comprised of individual composite lamina, each layer has its
own failure events associated with it. In regards to characterizing composite failure, it is noteworthy
to point out that composites experience local failures and final failure; thus "first failure" does not
necessarily correspond to "final failure." The local failures are referred to as "damage," and the
development of additional local failures with increasing load or time is called "damage accumulation"
[1].
Fibrous composite materials fail in a variety of mechanisms at the fiber/matrix (micro) level.
Micro-level failure mechanisms include: fiber fracture, fiber buckling, fiber splitting, fiber pullout,
fiber/matrix debonding, matrix cracking, and radial cracks. At the laminate level, micro-level
mechanisms occur as lamina failures in the form of transverse cracks in planes parallel to the fibers,
fiber-dominated failures in planes perpendicular to the fibers, and delamination between layers of the
laminate.
Transverse fiber fracture, or the breaking of a continuous fiber into two or more distinct
segments, is the most catastrophic of failure mechanisms as the fibers are typically the primary load-
carrying component. Fiber failure may be the result of tensile or compressive stresses. Fiber fracture
occurs under tensile load when the maximum allowable axial tensile stress (or strain) of the fiber is
exceeded. Fiber pullout occurs when the fiber fractures and is accompanied by fiber/matrix
Page 27
debonding. Matrix cracking occurs when the strength of the matrix is exceeded. Fiber kinking occurs
when the axial compressive stress causes the fiber to buckle. The critical buckling stress for a fiber
embedded in a matrix is a function of the properties of the fiber and the matrix (which provides lateral
support to the fiber). Fiber splitting and radial interface cracks occur when the transverse or hoop
stresses in the fiber or inter-phase region between the fiber and the matrix reaches its ultimate value
[1].
There is no single theory that accurately predicts failure at all levels of analysis, for all
loading conditions, and for all types of composite materials. While some failure theories have a
physical basis, most theories represent attempts to provide mathematical expressions which give a
"best fit" of the available experimental data, recognizing the practical limits of data collections and
the limits of mathematical representations that are practical from a designer's point of view. From the
standpoint of a structural designer, it is desirable to have failure criteria which are applicable at the
level of the lamina, the laminate, and the structural component. Failure at these levels is often the
consequence of an accumulation of various micro-level failures which coalesce and result in the final
failure [1],
These micro failure events are critical, essential elements which comprise the macroscopic
failure theories. There are many macroscopic failure theories (some general, others highly
specialized) that have been proposed for composites. The most notable of the general theories include
the maximum stress, maximum strain, Tsai-Hill, tensor polynomial and Tsai-Wu failure criteria.
Fracture Mechanics
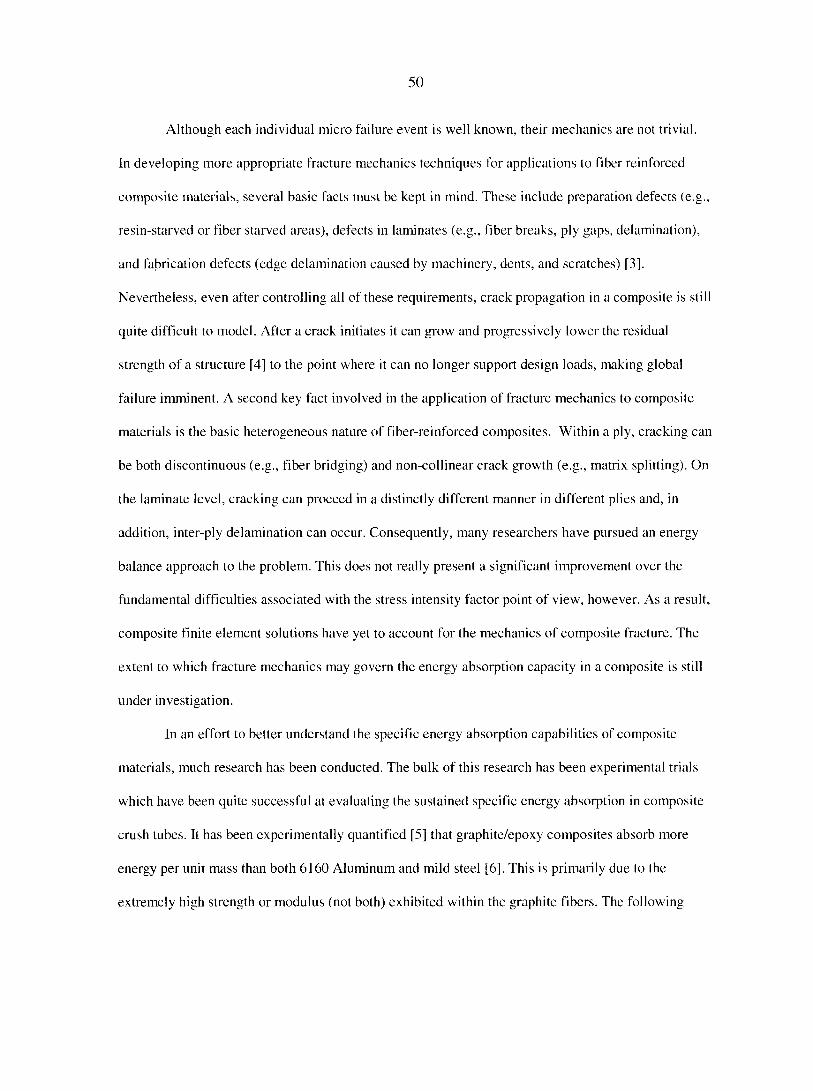
Although each individual micro failure event is well known, their mechanics are not trivial.
Fracture mechanics in particular governs the formation of interlaminar and intralaminar cracking and
Page 28
18
how these ensuing cracks propagate [5], Kannien states the basic equation of linear elastic fracture
mechanics common in work on composites is
where K , is a material independent function of the crack size, a , the component dimensions, b , and
the applied stress am., while KIc is a material property that can depend upon temperature, T, and
loading rate, &.
where ay is the corresponding yield stress; however this is not so in a composite. As a result, actual
fracture in a composite routinely violates this requirement. In developing more appropriate fracture
mechanics techniques for applications to fiber reinforced composite materials, several basic facts
must be kept in mind. These include preparation defects, laminates defects, and fabrication defects.
Nevertheless, even after controlling all of these requirements, crack propagation in a composite is still
quite difficult to model. After a crack initiates it can grow and progressively lower the residual
strength of a structure [6] to the point where it can no longer support design loads, making global
failure imminent. A second key fact involved in the application of fracture mechanics to composite
materials is the basic heterogeneous nature of fiber-reinforced composites. Within a ply, cracking can
be both discontinuous and non-collinear crack growth. On the laminate level, cracking can proceed in
a distinctly different manner in different plies and, in addition, inter-ply delamination can occur.
Thus, equation 1-48 is ill equipped to cope with these complexities. Consequently, many researchers
have pursued an energy balance approach to the problem. This does not really present a significant
improvement over the fundamental difficulties associated with the stress intensity factor point view,
however. As a result, composite finite element solutions have yet to account for the mechanics of
composite fracture. The extent to which fracture mechanics may govern the energy absorption
capacity in a composite is still unknown.
1-48
For metals, the crack length is required to be large in comparison to the value of %
Page 29
19
Literature Review
Energy Absorption Crushing Mechanics
The energy absorption characteristics of both metals and composites have been the subject of
extensive research [7-19]. Most of the work has been experimental in nature. A very convenient
shape for the crush studies on composites is the circular tube. The large moment of inertia of this
shape is able to prevent the buckling and the crushing mechanism is used for the absorption of large
impact loads. Using composite crush tubes, Farley [7] was able to identify the primary and secondary
crushing initiators involved in a composite crush event and how they relate to energy absorption. In
tubes composed of brittle fiber reinforcement, the catastrophic failure mode occurs when the lamina
bundles do not bend or fracture due to the formation of very short (less than 1 ply thickness)
interlaminar cracks. This leads to a very high peak load/post failure load, which is then followed by a
low post failure load/peak load. As a result, the actual magnitude of energy absorbed is much less and
the peak load is too high with respect to the resulting sustained crushing load value. As would be
imagined, catastrophic failure modes are not of interest to the design of crash worthy structures.
Structures designed to react to loads produced by catastrophically failing energy absorbers are heavier
than structures designed to react to loads produced by progressively failing energy absorbers.
Composite material energy absorption mechanisms have only recently become well known.
The ideal crushing behavior for a tube would be for the crushing to start at the point of application of
the load and then progressively travel along the tube. The important thing is that the entire tube
material crushes for the maximum energy absorption. Farley theorized that the main crushing
initiators that occur within a crush structure are; transverse shearing, lamina bending, local buckling,
and a combination of these. Brittle fracturing results when both the transverse shearing and lamina
bending modes occur during the same crush event.
Page 30
Transverse shearing, also known as fragmentation, is typically seen within brittle fiber
reinforcement tubes. This mode is characterized by the creation of partial lamina bundles. These
bundles result when short (less than a lamina's thickness) interlaminar cracks form. Mechanisms like
interlaminar crack growth and fracturing of lamina bundles control the crushing process for
fragmentation. The main energy absorption occurs as a result of the fracturing of these lamina
bundles
Lamina bending, otherwise known as the splaying mode, is typically seen within brittle fiber
reinforcement tubes. This mode is characterized by the formation of very long lamina bundles. These
bundles result when interlaminar and intralaminar cracks reach a length of more than 10 lamina
thicknesses. Within this mode, very long interlaminar, intralaminar, and parallel-to-fiber cracks
characterize the splaying mode. The lamina bundles do not fracture. In this case, energy absorption is
due to crack propagation, bending and bundle friction. Specifically, the main energy absorbing
mechanism is matrix crack growth. Two secondary energy absorption mechanisms related to friction
occur in tubes that exhibit splaying mode.
Local buckling, or progressive folding, is characterized by folding of the tube walls. This is
the primary means by which metals absorb energy. The progressive folding mode is characterized by
the formation of local buckles. This mode is exhibited by both brittle and ductile fiber reinforced
composite material. Mechanisms such as plastic yielding of the fiber and/or matrix control the
crushing process for progressive folding.
Brittle Fracturing is in fact a hybrid initiator, which combines both the transverse shearing
and lamina bending modes. This is the mode of primary interest because this is the means by which
long fiber composite materials absorb energy. It is characterized by the formation of lamina bundles
of moderate length. These bundles result from the formation of interlaminar cracks whose lengths are
between 1 and 10 laminate thickness. In this case energy absorption is due to fracture, friction and
bending of the bundles.
Page 31
21
Initiation of Stable Composite Crushing Modes
One of the most difficult aspects of the energy absorption of composite crush tubes is
controlling the crush initiation [7], There are two main types of loading surface geometries for axially
loaded tubes. These crush tubes are either chamfered or un-chamfered (flat-ended). Flat-ended tubes
made from brittle materials are likely to fail by catastrophic brittle fracture. Provided buckling modes
are avoided, the brittle fracture strength of a tube, oc, coincides with the strength of the material and is
an upper limit to the strength of the tube by failure in any mode. In composite tubes, complete
separation across the fracture plane may not occur at failure. This results in interpénétration of the
two halves of the tube and some residual load bearing capacity. In other words, the ensuing failure
mode and behavior of flat-ended tubes impacted in an axial crush is completely catastrophic and thus
results in a highly inefficient and highly unpredictable failure event. The resulting energy absorption
is relatively low. Clearly this type of failure is of little value in structures that are required to collapse
in a controlled way and absorb large amounts of energy.
To maximize the amount of energy absorption, it is necessary to have a means to control the
crushing process. This is accomplished by initiating the ensuing crash by forcing the crushing process
to begin at a desired location in a desired mode that facilitates a stable crushing event. Progressive
crushing can often be induced in tubes made from brittle material by initiating, or 'triggering' fracture
at one end of the tube at stresses below oc. This is accomplished by creating a 30°, 45° or 60° chamfer
at the top load surface. This chamfer forces the crushing to initiate at this surface and leads to a much
more stable sustained crushing load which propagate through the tube. A stable zone of microfracture
then propagates down the tube. The most straightforward method of triggering is to chamfer one end
of the tube. Crushing then initiates in the highly stressed region at the tip of the chamfer due to stress
concentration and this develops into a stable crush zone located at the top of the tube. The ensuing
Page 32
22
sequence of events depends on the chamfer angle. Figure 1-3 illustrates that local fracture occurs at
the crash front and at Pmax, a sharp load relaxation occurs which is followed by the formation of the
crush zone.
Peak Crushing Loads, Pt
j — •— Flat Top Edge i
j-flfr-Chamfered Top Edge]
Average Crushing Loads
Deflection, in
Figure 1-3: Typical load-deflection curve of a composite crush tube
The size of the load drop depends on the chamfer angle and is reduced to zero at some angles. Further
crushing occurs at approximately constant load, P , and the appearance of the crush zone remains
unchanged apart for small details.
Page 33
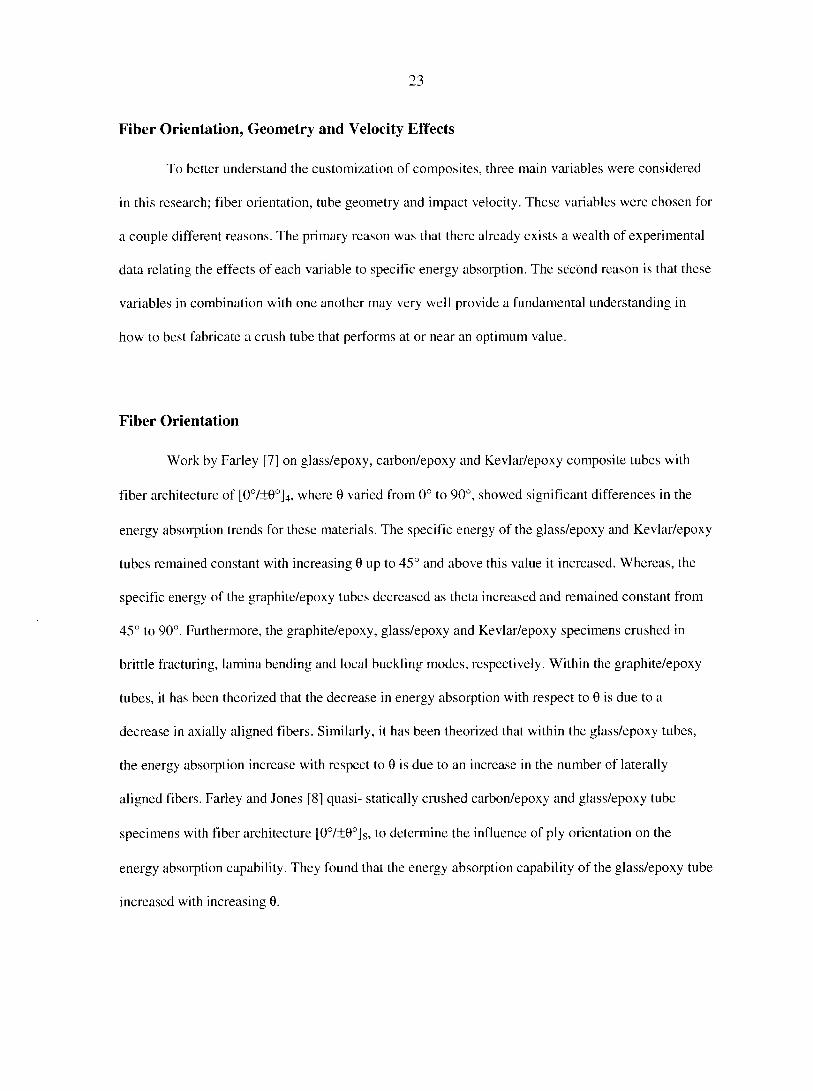
Fiber Orientation, Geometry and Velocity Effects
To better understand the customization of composites, three main variables were considered
in this research; fiber orientation, tube geometry and impact velocity. These variables were chosen for
a couple different reasons. The primary reason was that there already exists a wealth of experimental
data relating the effects of each variable to specific energy absorption. The second reason is that these
variables in combination with one another may very well provide a fundamental understanding in
how to best fabricate a crush tube that performs at or near an optimum value.
Fiber Orientation
Work by Farley [7] on glass/epoxy, carbon/epoxy and Kevlar/epoxy composite tubes with
fiber architecture of [O°/±0°]4, where 0 varied from 0° to 90°, showed significant differences in the
energy absorption trends for these materials. The specific energy of the glass/epoxy and Kevlar/epoxy
tubes remained constant with increasing 0 up to 45° and above this value it increased. Whereas, the
specific energy of the graphite/epoxy tubes decreased as theta increased and remained constant from
45° to 90°. Furthermore, the graphite/epoxy, glass/epoxy and Kevlar/epoxy specimens crushed in
brittle fracturing, lamina bending and local buckling modes, respectively. Within the graphite/epoxy
tubes, it has been theorized that the decrease in energy absorption with respect to 0 is due to a
decrease in axially aligned fibers. Similarly, it has been theorized that within the glass/epoxy tubes,
the energy absorption increase with respect to 0 is due to an increase in the number of laterally
aligned fibers. Farley and Jones [8] quasi- statically crushed carbon/epoxy and glass/epoxy tube
specimens with fiber architecture [O°/±0°]s, to determine the influence of ply orientation on the
energy absorption capability. They found that the energy absorption capability of the glass/epoxy tube
increased with increasing 0.
Page 34
24
Based upon this sampling of findings, it would appear that the literature search generally
revealed that the fiber orientations that enhance specific energy absorption of the composite materials
requires them to either: increase the number of fractured fibers; increase the material deformation;
increase the axial stiffness; or increase the lateral support to the axial fibers.
Geometry
It was found that model geometry, plays a significant role in the absorption of energy. Farley
[10] investigated the geometrical scalability of graphite/epoxy and Kevlar/epoxy, [±45°]N tubes by
quasi-statically crush testing them. In this study, all circular cross section graphite/epoxy tubes
exhibited a progressive brittle fracturing mode. The diameter to thickness (D/t) ratio was determined
to affect the energy absorption capability of the composite materials. As the D/t ratio increased, the
specific energy absorption decreased. This increase was attributed to a reduction in interlaminar
cracking in the crush region of the tube. Thornton and Harwood [14] studied the effect of tube
dimensions. It was found that carbon/epoxy tubes exhibited large changes in their energy absorption
characteristics as tube diameter, D, wall thickness, t, and D/t ratio varied. Furthermore, it was
discovered that depending on the relative density, defined as the ratio of the volume of the tube to that
of a solid of the same external dimensions, the tube crushing became unstable when the relative
density registered below a critical value. This relative density value was 0.025 for carbon/epoxy and
0.045 for glass/epoxy tubes. Furthermore, the specific energy was found to be essentially independent
of tube dimensions for the tubes that crushed in a stable manner. Fairfull [15] and Fairfull and Hull
[16] studied the effects of specimen dimensions on the specific energy of glass cloth/epoxy tubes.
Here, it was discovered that the specific energy decreased with increasing diameter. The specific
energy, for a given diameter, initially increased with decreasing D/t ratio up to 5. Below this value, it
decreased. Based upon their findings, it was concluded that there could not be a universal
Page 35
25
relationship to predict energy absorption capability. For graphite/epoxy and Kevlar/epoxy tubes,
Farley[11] found that tube width to wall thickness ratio (w/t) was a factor that influenced the energy
absorption capability of composite materials. The findings of this study indicates that energy
absorption generally increased with decreasing w/t ratio: For graphite/epoxy tubes having w/t ratios in
the range of 20 to 50, changes in crushing mode occurred, resulting in a decrease in energy absorption
capability as w/t ratio decreased. Both graphite/epoxy tubes and Kevlar/epoxy tubes crushed in a
progressive and stable manner. All graphite/epoxy tubes exhibited a lamina bending crushing mode
while Kevlar/epoxy tubes exhibited a local buckling crushing mode.
In short, most of the literature generally revealed that the crush zone fracture mechanisms are
influenced by the tube dimensions. Specifically it is suggested that by changing the tube dimensions,
the crush mechanisms can be changed. This would imply that tube dimensions play a significant role
in specific energy absorption. However, to date, the full extent of this relationship has not been
quantified. Furthermore, it should be noted that some disagreement within the field exists.
Additionally, it can be concluded from the experimental literature that when holding everything else
constant, hollow tubes with circular cross-sections have the highest overall specific energy absorption
capability followed by square and rectangular cross-sections.
Velocity
Upon initial review of the pertinent literature, it is noted that some distinction should be made
when comparing the results of quasi-static loading to dynamic impact loading. In quasi-static testing,
the tube specimen is crushed at constant speed. Here the energy absorbed is the area under the load-
displacement curve. However, load in this case is just the specimen's reaction to it being crushed. It
does not have a deceleration term because the crushing process is taking place at a constant speed.
The measurement of the time quantity is not worthwhile because one actually controls the rate of
Page 36
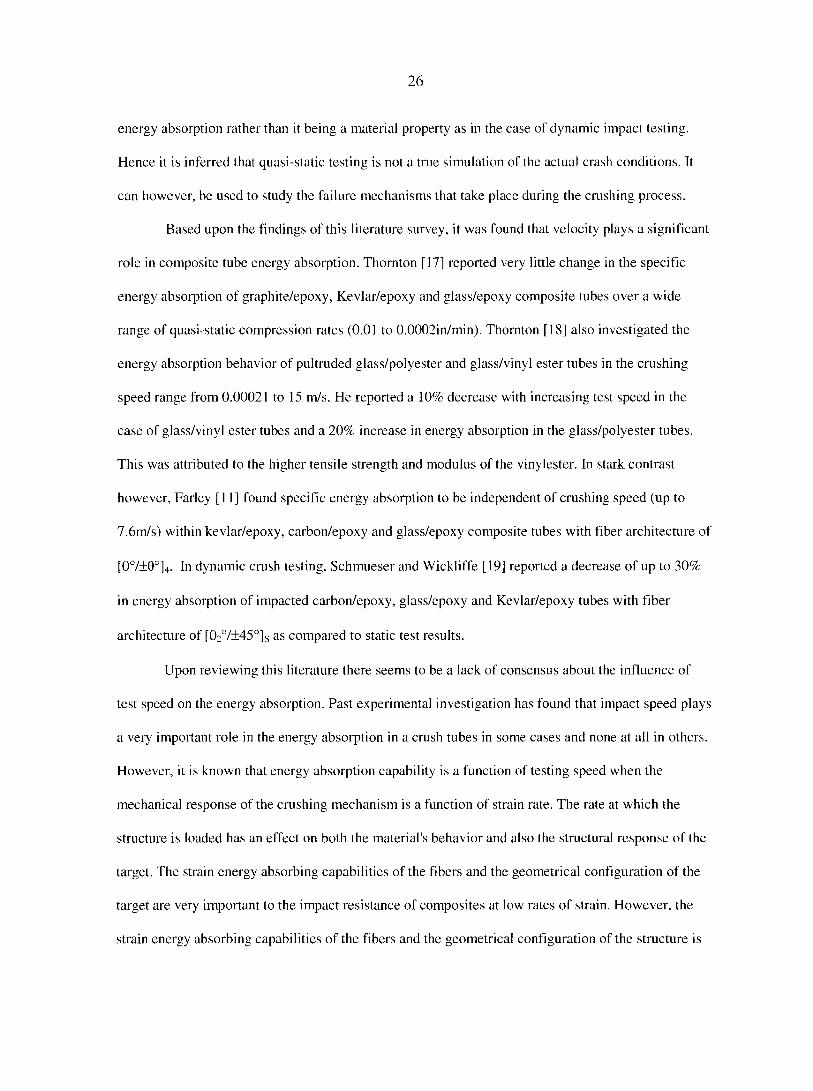
26
energy absorption rather than it being a material property as in the case of dynamic impact testing.
Hence it is inferred that quasi-static testing is not a true simulation of the actual crash conditions. It
can however, be used to study the failure mechanisms that take place during the crushing process.
Based upon the findings of this literature survey, it was found that velocity plays a significant
role in composite tube energy absorption. Thornton [17] reported very little change in the specific
energy absorption of graphite/epoxy, Kevlar/epoxy and glass/epoxy composite tubes over a wide
range of quasi-static compression rates (0.01 to 0.0002in/min). Thornton [18] also investigated the
energy absorption behavior of pultruded glass/polyester and glass/vinyl ester tubes in the crushing
speed range from 0.00021 to 15 m/s. He reported a 10% decrease with increasing test speed in the
case of glass/vinyl ester tubes and a 20% increase in energy absorption in the glass/polyester tubes.
This was attributed to the higher tensile strength and modulus of the vinylester. In stark contrast
however, Farley [11] found specific energy absorption to be independent of crushing speed (up to
7.6m/s) within kevlar/epoxy, carbon/epoxy and glass/epoxy composite tubes with fiber architecture of
[O°/+0O]4. In dynamic crush testing, Schmueser and Wickliffe [19] reported a decrease of up to 30%
in energy absorption of impacted carbon/epoxy, glass/epoxy and Kevlar/epoxy tubes with fiber
architecture of [02o/±45o]s as compared to static test results.
Upon reviewing this literature there seems to be a lack of consensus about the influence of
test speed on the energy absorption. Past experimental investigation has found that impact speed plays
a very important role in the energy absorption in a crush tubes in some cases and none at all in others.
However, it is known that energy absorption capability is a function of testing speed when the
mechanical response of the crushing mechanism is a function of strain rate. The rate at which the
structure is loaded has an effect on both the material's behavior and also the structural response of the
target. The strain energy absorbing capabilities of the fibers and the geometrical configuration of the
target are very important to the impact resistance of composites at low rates of strain. However, the
strain energy absorbing capabilities of the fibers and the geometrical configuration of the structure is
Page 37
27
less important at very high rates of strain since the structure responds in a local buckling mode. What
is important is the magnitude of energy dissipated in delamination, debonding and fiber pullout.
Organization of the Thesis
This research is aimed at the computational modeling of the crush of a circular tube. The
crush has been performed on the software LS-DYNA. Effect of various parameters such as the
element size, fiber angle, tube geometry and the impact velocity on the specific energy absorption
have been studied and the results are presented.
The thesis has been written in the paper format. Brief description of the contents of each
chapter is as follows.
Chapter 1 is an introduction to the topic and to the fundamental theories used in the work. It
also contains the relevant literature search.
Chapter 2 deals with the sensitivity analysis of the Finite Element models. The element size
has a strong impact on the results and this study was performed to arrive at the element size where the
element size is no more a factor in the calculation of energy absorption.
Chapter 3 reports the work where the fiber angel in the tubes is changed, keeping other
factors such as tube diameter and thickness constant.
Chapter 4 deals with the effect of the impact velocity on the energy absorption of a circular
tube.
Chapter 5 is a paper on the effects of the tube geometry on the energy absorption of a circular
tube. Here the tube diameters and the tube thickness are changed and energy absorption calculated.
Chapter 6 has a collection of the compendium of observations and conclusions of this
research. It also contains the limitations of this work and suggestions for further research.
Page 38
28
References
1. Herakovich, Carl T., 1998: Mechanics of Fibrous Composites. John Wiley and Sons, Inc., New
York.
2. Jacob, George C., 2002: "Energy Absorption in Polymer Composites for Automotive
Crashworthiness" Journal of Composite Materials, 36:813-850.
3. Reddy, J.N., 1996: Mechanics of Laminated Composite Plates: Theory and Analysis. CRC Press,
Boca Raton, FL.
4. Gupta, Kajal K., 2000: Finite Element Multidisciplinarv Analysis. American Institute of
Aeronautics and Astronautics, Inc., Reston, VA.
5. Kannien, Melvin F. and Carl H. Popelar, 1985: Advanced Fracture Mechanics. Oxford University
Press, New York.
6. Dayal, Vinay and V. K. Kinra, 1991 : "Leaky Lamb Waves in an Anisotropic Plate II - NDE of
Matrix Cracks in Fiber-Reinforced Composites," Journal of the Acoustical Society of America, 89(4)
Pt.l: 1590-1598.
7. Farley, Greg L„ 1987: "Energy Absorption of Composite Materials and Structures," Proceedings of
the 43rd American Helicopter Society Annual Forum, St. Louis, 613-627.
Page 39
29
8. Farley, Greg L. and Robert M. Jones, 1989: "Energy Absorption Capability of Composite Tubes
and Beams," NASA TM-101634, AVSCOM TR-89-B-003.
9. Farley, Greg L. and Robert M. Jones, 1986: "Crash Energy Absorbing Composite Sub-Floor
Structure," 27th AIAA/ASME/ASCE/AHS Structures, Structural Dynamics and Materials
Conference.
10. Farley, Greg L., 1986: "Effect of Specimen Geometry on the Energy Absorption Capability of
Composite Materials," Journal of Composite Materials, 20: 390-400.
11. Farley, Greg L., 1989: "Energy Absorption Capability and Scalability of Square Cross Section
Composite Tube Specimens," US Army Research and Technology Activity -AVSCOM, 1-17.
12. Farley, Greg L., 1983: "Energy Absorption of Composite Materials," Journal of Composite
Materials, 17, 267-279.
13. Thornton, P.H. and P.J. Edwards, 1982: "Energy Absorption in Composite Tubes," Journal of
Composite Materials, 16: 521-545.
14. Thornton, P.G. and J.J. Harwood, 1985: "Fiber Reinforced Plastic Composites for Energy
Absorption Purposes," Composites Science and Technology, 24: 275-298.
15. Farifull, A.H., 1986: "Scaling Effects in the Energy Absorption of Axially Crushed Composite
Tubes," PhD Thesis, University of Liverpool, UK,.
Page 40
30
16. Fairfull, A.H. and D. Hull, 1987: " Effects of Specimen Dimensions on the Specific Energy
Absorption of Fiber Composite Tubes," Proceedings of the ICCM, 3.36-3.45.
17. Kindervater, C M., 1983: "Energy Absorbing Qualities of Fiber Reinforced Plastic Tubes,"
National Specialists Meeting, Composite Structures of the American Helicopter Society, Philadelphia,
PA.
18. Thornton, P.H., 1990: "The Crush Behavior of Pultruded Tubes at High Strain Rate," Journal of
Composite Materials, 24: 594-615.
19. Schmuesser, D.W. and L.E. Wickliffe, 1987: "Impact Energy Absorption of Continuous Fiber
Composite Tubes," Journal of Engineering Materials and Technology, 109: 72-77.
Page 41
31
CHAPTER 2: FINITE ELEMENT MODEL OF A DYNAMIC
COMPOSITE CRUSH EVENT
Abstract
This paper investigates the ability to use commercially available numerical modeling tools to
approximate the energy absorption capability of long-fiber composite crush tubes. The motivation for
the work comes from the need to reduce the significant cost associated with experimental trials. This
study is significant since it provides a preliminary analysis of the suitability of LS-DYNA to
numerically characterize the crushing behavior of a dynamic axial impact crushing event. This paper
evaluates the influence of element size on the convergence of a solution. The ultimate goal is to begin
to provide deeper understanding of a composite crush event and ultimately create a successful
predictive methodology. The sensitivity of the element size on the energy absorbed is studies and an
element size has been achieved below which the effect of the size is very small.
Introduction
Composite materials are engineered materials that consist of two or more materials that
together produce desirable properties that cannot be achieved with any of the constituents alone. Long
fiber structural composites consist of high strength and high modulus fibers generally surrounded by a
weak matrix material. In these composites, fibers are the principal load carrying members.
Increasingly, composites are seeing more use in load bearing structural designs. In many new
applications the motivation to use composites is due largely to their energy absorption capability. The
subject of study of this paper is the energy absorption of long fiber structural composite comprised of
glass fibers within an epoxy matrix.
Page 42
32
As it pertains to composite materials, the topic of material failure is not as absolute as it is for
isotropic materials. Each lamina in a composite laminate has its own failure events associated with it.
In regards to characterizing composite failure, it is noteworthy to point out that composites experience
local failures and final failure; thus "first failure" does not necessarily correspond to "final failure."
The local failures are referred to as "damage," and the development of additional local failures with
increasing load or time is called "damage accumulation" [1]. While some failure theories have a
physical basis, most theories represent attempts to provide mathematical expressions which give a
"best fit" of the available experimental data. From the standpoint of a structural designer, it is
desirable to have failure criteria which are applicable at the level of the fiber-matrix interface, the
lamina, the laminate, and the structural component. Failure at these levels is often the consequence of
an accumulation of various micro-level failures which coalesce and result in the final failure [1],
These micro failure events are critical, essential elements which comprise the macroscopic failure
theories. Although each individual micro failure event is well known, their mechanics are not trivial.
In addition to composite failure theory, energy is absorbed via interlaminar and intralaminar crack
growth within a composite.
Fracture mechanics in particular, governs the formation of interlaminar and intralaminar
cracking and how these ensuing cracks propagate [2], Kannien states the basic equation of linear
elastic fracture mechanics common in work on composites to be
where K, is a material independent function of the crack size, a, the component dimensions, b, and
the applied stress, oac, while Klc is a material property that can depend upon temperature, T, and
loading rate, <7. For metals, the crack length is required to be large in comparison to the value of
fracture in a composite routinely violates this requirement [3], As a result, composite finite element
2-1
where cry is the corresponding yield stress; however this is not so in a composite. Actual
Page 43
33
solutions have yet to account for the mechanics of composite fracture. The extent to which fracture
mechanics may govern the energy absorption capacity in a composite is still unknown.
With the increased use of fiber-reinforced composites in structural components, studies
involving the behavior of components made of composites are receiving considerable attention.
Functional requirements and economic considerations of design are forcing engineers to seek reliable
and accurate, yet economical methods of determining static and dynamic characteristics of the
structural components. The analytical study and design of composite materials requires knowledge of
anisotropic elasticity, structural theories and failure/damage criteria. Unlike isotropic materials,
anisotropic materials exhibit complicated mechanical behavior. The partial differential equations
governing composite laminates of arbitrary geometries and boundary conditions cannot be solved in
closed form; therefore, the use of numerical methods facilitates the solution. Among the numerical
methods available for the solution of differential equations defined over arbitrary domains, the finite
element method (FFM) is the most effective method. Finite element analysis of a structural problem
is a numerical analysis of the mathematical model used to represent the behavior of the structure [4],
In the FEM, the solution domain is divided into a number of discrete elements. The
displacements within an element are generally the unknown field variables that are expressed in terms
of unknown nodal values. The governing load displacement relations for each element are written.
These equations are then assembled maintaining continuity between the elements and equilibrium at
the nodes. Finally, the boundary conditions are applied and the solution obtained for the load
displacement relationship for the entire structure. The displacement field can be expressed as:
u = Nue 2-2
where the superscript, e, refers to element-wise values and N are the shape functions, being functions
of the position coordinates. The strain displacement relationships from the strain matrix, 8, are given
by
e = Bu' 2-3
Page 44
34
by differentiating the appropriate displacement components. The matrix B is the strain displacement
matrix which relates strain to displacement. Application of the principal of minimization of the total
potential energy yields the equation of motion
Kg + Cg + My = /(f) 2-4
where the matrices and vectors refer to the entire structure and furthermore M is the mass matrix, K is
the stiffness matrix, C is the damping matrix and f(t) is the load vector which is comprised of thermal,
inertia!, body and traction loads. The associated matrix equation of free vibration may be written in
the general form as
Kq + Cq + Mq- 0. 2-5
The numerical analysis of a structural system consists of two distinct, yet related solution procedures.
First, a finite element model of the system yields a set of algebraic equations that are then solved by
employing a suitable numerical procedure. Because of the very nature of finite element discretization,
the resulting equations tend to be rather large in size, as well as highly banded for most practical
problems. An economical solution of such problems poses as much a challenge to an analyst as the
process of discretization itself [4],
For a dynamic FEM problem, N is not unique, it is in fact a function of the entire time history
of the nodal displacements [4], As a result, equation 2-3 becomes:
ux = N{m)u
u t = N{cu)q'e'm 2-6 ,i(Ul
and equation 2-5 becomes
[A*!, — (A/U — ff-, ) — fiJ4 (M 2 — A*4)— ...](/ = 0 2-7
where q is the amplitude of the nodal deformation, and M0 and K0 are the static mass and stiffness
matrices. The other higher order terms constitute the dynamics correction. Usually, the first 3 terms
are sufficient for analysis. The result is a quadratic eigenvalue problem of the form:
Page 45
35
(A-A8-A-C}?=:0 2-8
where X=û)2. These elements and their solutions are commonly referred to as finite dynamic elements
(FDE) and the dynamic element method (DEM), respectively. Their solutions usually require higher
order shape functions to achieve satisfactory convergence [4], Second or third order shape functions
usually give good results in static analyses; however, higher order shape functions may be required
for dynamic problems. As can be expected, use of higher order polynomial shape functions increases
the computational time of the analysis. Since this model employs constant stress/strain elements, an
attempt was made to approximate the effect of increasing the "effective" polynomial order of the
element shape function. This was done by employing an increasing number of constant stress/strain
elements in the model.
For the purposes of gaining a better general understanding of how composites absorb energy
and characterizing the ability of composites to absorb energy, experimental research has been very
useful. However according to the observations of Farley [5], the behavior of the lamina bundles are
directly affected by the length that these cracks propagate. It is theorized that these segmented
composite columns (or bundles) not only react differently based upon the length of the cracking, but
also absorb differing amounts of energy. Experimentally, the energy absorption associated with
fragmentation (fracture of short lamina bundles) is notably larger than the energy absorption
associated with splaying, which constitutes bending of longer lamina bundles. However, the extent to
which crack propagation, in addition to other energy absorption modes, specifically affects energy
absorption is still unknown.
There have been some noteworthy efforts in the attempt to use finite element analysis codes
to arrive at a predictive methodology to determine the energy absorption in composite crush tubes.
Sigalas and Kumosa [6] have been successful in modeling the sequence of events leading to
progressive crushing of composite tubes. By limiting the crush behavior to the splaying mode only,
Hamada and Ramakrishna [7] were successful in crafting a finite element model for predicting the
Page 46
36
energy absorption capability of a composite crush tube which progressively crushed in the splaying
mode only.
Stacking sequence can play an important role in maximizing the specific energy absorption
within a multi-layered laminate. Although the need for the development for a complete finite element
model to predict composite energy absorption has been widely researched and widely accepted, it is
unknown as to how much energy absorption is associated with each constituent failure event. This
paper is one in a series of papers that attempts to approximate the energy absorption using classical
laminated plate theory and existing finite element method capabilities. In an attempt to arrive at a
predictive methodology to determine the sustained specific energy absorption in a glass/epoxy thin
walled composite tube, the dynamic finite element analysis tool, LS-DYNA has been used.
Methodology
Materials
Graphite/epoxy long fiber structural composite tubes absorb more energy per unit mass than
any other structural long fiber composite; however, graphite fibers are relatively expensive. As a
result, e-glass fibers may prove to be a reasonable and affordable alternative in many experiments. It
is for this reason that e-glass fibers were selected. The matrix material used in this study was epoxy
resin. Epoxy resin is one of the most common thermoset polymer matrix materials. Epoxies are
relatively inexpensive but have better moisture resistance and lower shrinkage on curing. The
resulting composite employs a fiber volume fraction of 62%. This is consistent with the make up of a
typical e-glass/epoxy composite used experimentally [8],
Page 47
37
Tube Dimensions
The tube dimensions were chosen to be fairly comparable to existing experimental data. The
tubes were nominally 4" in length, 1.5" in mean diameter, D , and 6 plies thick. Each ply was of
0.0125" nominal thickness. AD/t ratio of 14.85 was used. Each FEA tube had a simulated chamfer
to help initiate a stable crush.
Impact Characteristics
The actual crush event was simulated by a translating rigid body of 3 slugs moving at an
initial impact velocity of 25 ft/s. This is consistent with the comparable experimental results.
Specimens
The specimens evaluated in this study mirrored those used in a prior experimental study
conducted by Farley [8], Each tube was 6 plies thick and was constructed of E2 glass fibers and
epoxy resin. The six plies had a stacking sequence of [O°/±0/O°/±0]T, where 0 was 15°, 20°, 30°, 40°,
45°, 50°, 75° or 90°. The 0° refers to the axial direction of the cylinders. Each LS-DYNA input deck
was pre-processed using ANSYS, such that each tube was evaluated using 256, 832, 1728, 2944,
4480 and 6336 elements. Because polynomial elements were not available, the number of elements
per solution was increased. As the number of elements increases, the model is able to be refined. By
increasing the number of elements, it was analogous to incrementally increasing the effective shape
function of the element.
Page 48
38
Total number Chamfer Elements Through Thickness Elements
of elements in Aspect Ratio Aspect Ratio Effective Shape model Length (in) Height (in) (no dim) Length (in) Height (in) (no dim) Function (no dim)
256 0.2926 0.0125 23.41 0.2926 0.3925 1.34 0th order 832 0.1470 0.0125 11.76 0.1470 0.1963 1.33 1 st order
1728 0.0981 0.0125 7.85 0.0981 0.1308 1.33 2nd order 2944 0.0736 0.0125 5.89 0.0736 0.0981 1.33 3rd order 4480 0.0589 0.0125 4.71 0.0589 0.0785 1.33 4th order 6336 0.0491 0.0125 3.93 0.0491 0.0654 1.33 5th order 8512 0.0421 0.0125 3.37 0.0421 0.0561 1.33 6th order
Table 2-1: Element Selection Summary
The boundary conditions were selected to simulate the experimental impact loading. The bottom of
the tube was modeled as clamped and the upper chamfered edge impacted was constrained in the
hoop and radial directions [8]. The axial energy load was delivered via an impact mass dropped from
a prescribed height to generate the desired amount of mechanical energy. A 45° chamfer was modeled
into the top surface to trigger a more stable sustained crushing event. This chamfer was approximated
by a step change in the ply thickness. The schematic of the ply arrangement is shown in figure 2-1.
LS-DYNA was then used to compute the resulting deformation of a number of crush tubes.
L t
Î
t t
Figure: 2-1: The chamfer formation in finite element code, t is the ply thickness.
Page 49
39
Computation of Energy Absorption
The specific energy absorption, Es,„ shown in equation 2-9 is directly evaluated based upon
the post crush peak axial displacement, such that
where E t is the net impact kinetic energy, p is the material density and V is the volume of material
displaced during and axial tube crush. In other words the specific energy absorption can be defined as
the energy absorption per unit mass of the tube.
Finite Element Model
The numerical solution was obtained using the LS-DYNA software suite. LS-DYNA [9] is a
general-purpose finite element code for analyzing the large deformation dynamic response of
structures. The main solution methodology is based on explicit time integration. Spatial discretization
is achieved by the use of four-node quadratic elements. The elements have through the thickness
integration points so that the stresses in individual plies can be calculated.
The material model used by LS-DYNA is based on Classical Laminate Plate Theory (CLPT).
It allows for the "stacking" of several "layers" of plies which may have arbitrary fiber orientation.
Each ply is permitted its own failure criteria by use of its own integration point. Within this model,
the primary means of energy absorption occurs as a result of matrix failure, fiber failure and laminate
delamination. It is important to note that although this theory has been extremely accurate within the
static realm, Farley [5] theorized that there are distinct differences in the failure mechanics in
dynamic failure. Most notably, he states that in addition to energy absorption via the failure modes of
CLPT, dynamic crush events experience energy absorption due to fiber and matrix fracture, bundle
friction, interlaminar crack formation and intralaminar crack formation. However, as stated
Page 50
40
previously, the scope of this work is to evaluate the ability/usefulness of the LS-DYNA CLPT to
numerically approximate the dynamic response observed experimentally.
Results and Discussion
The first objective was to evaluate the influence of element size on the convergence of a
solution. This was performed by checking where the solution achieved a steady state value. The
influence of the element size is an important aspect to study for several reasons. This paper is written
from the vantage point of a design engineer. As such, one of the prime considerations involved in the
engineering design process is design cost and accuracy. Quite simply, the longer the design-phase the
higher the design, development and production cost. However, even more important is the accuracy
of the solution. The use of an increasing number of elements should, in theory, increase the accuracy
of the results at the cost of time.
As shown in figure 2-2, there was marked improvement in the crush modeling as the number
of elements increased.
xyx^ v vo (a) (b) (c) (d) (e)
Figure 2-2: Axial crush effect with number of element (a) pre-crush, (b) 256, (c) 832, (d) 1728, and (e) 2944 elements.
Page 51
41
For the purposes of evaluation, a solution was considered stable when the subsequent solutions'
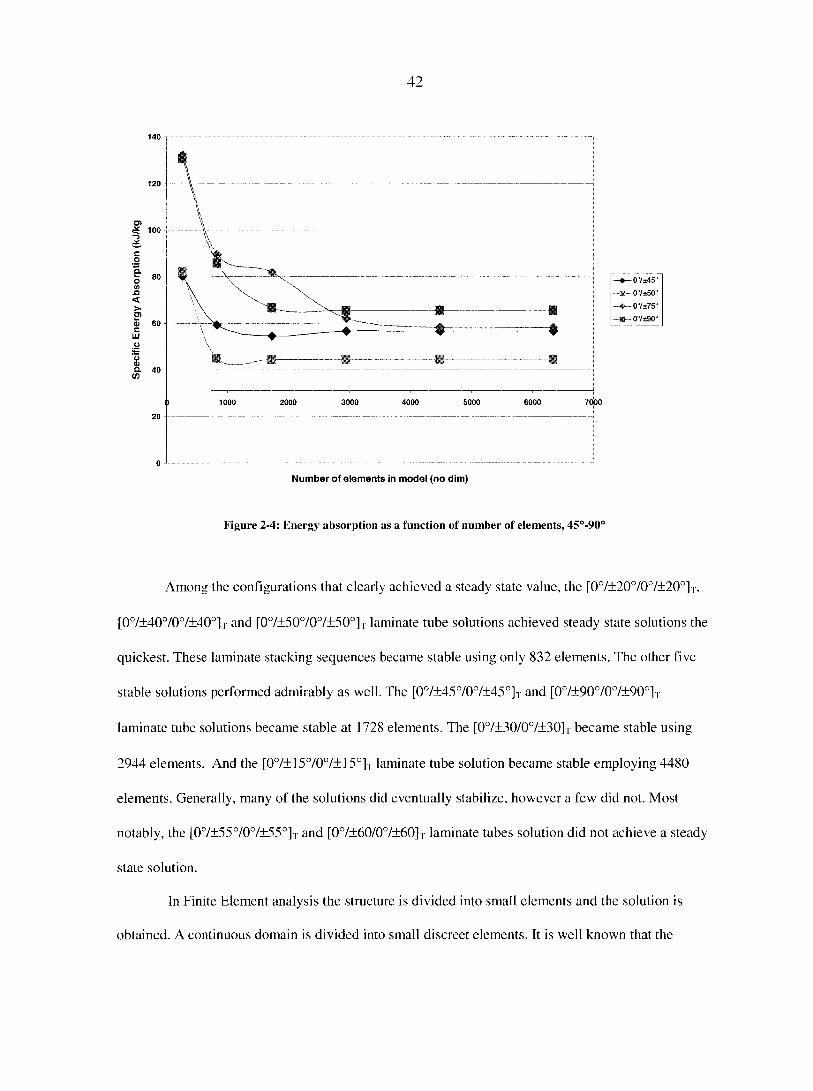
energy absorption does not change by more than 2%. Figures 2-3 and 2-4 show the specific energy
absorption of circular tubes of various stacking sequences as a function of number of elements.
70
40
30 1000 2000 4000 5000 7000 HI
Number of elements in model (no dim)
Figure 2-3: Energy absorption as a function of number of elements, 15°-40°
Page 52
42
140
120
I 100
c O B
1 < > 2 0) 60 C LU O
01 O. 40 V)
1000 2000 3000 4000 5000 6000 7000
20
Number of elements in model (no dim)
Figure 2-4: Energy absorption as a function of number of elements, 45°-90°
Among the configurations that clearly achieved a steady state value, the [0°/±20o/07±20°]T,
[07±40707±40°]T and [07±50707±50°]T laminate tube solutions achieved steady state solutions the
quickest. These laminate stacking sequences became stable using only 832 elements. The other five
stable solutions performed admirably as well. The [0o/±45o/0o/±45o]T and [0°/±9070o/±90o]T
laminate tube solutions became stable at 1728 elements. The [07±30/07±30]T became stable using
2944 elements. And the [07±15707+15°]T laminate tube solution became stable employing 4480
elements. Generally, many of the solutions did eventually stabilize, however a few did not. Most
notably, the [07±55707±55°]T and [07±60/07±60]T laminate tubes solution did not achieve a steady
state solution.
In Finite Element analysis the structure is divided into small elements and the solution is
obtained. A continuous domain is divided into small discreet elements. It is well known that the
Page 53
43
smaller the elements used, the better and more stable the solution. When the element size is reduced
the approximation of the solution is over a smaller region and hence is a better solution. The smaller
elements are able to approximate the rapidly changing stress field in this analysis. This is especially
critical in the region where the stresses change rapidly and failure is imminent. As the element size is
reduced the solution approaches convergence. This is due for a couple of reasons; both of which
contribute to artificially increasing the elastic modulus of the material in question. A closer inspection
of Table 2-1 shows that for the 256, 832 and 1728 element solutions, the aspect ratios of the chamfer
elements are 23, 12 and 8 respectively. As a result an increase in the perceived material modulus is
observed. This is compounded by the fact that a coarser mesh, independent of the effects of aspect
ratio, also results in an increase in the effective stiffness seen within the model.
Effect of Angle, 0, on Solution Convergence
It was observed that not all stacking sequences converged to a steady state solution. This non-
convergence is related to the angle of the plies. As the ply angles increase the convergence becomes
difficult. An explanation could be that as the angles increase the circumferential strength increases
and the axial stiffness decreases. The loading on the element is very strongly directional and we have
to resort to extremely small elements to get a good convergence. It would appear that the angle, 9,
within the stacking sequence has a noticeable effect on the convergence of a steady state solution.
Where most solutions below 45° in the [O7±0/O°/±0]T stacking sequence converged, some above 45°
did not. It has been documented experimentally [8] that energy absorption in [O7±0/O7±0]T
composite tubes increases as 0 increases. This is due to the increase in circumferential stiffness and
strength of the glass/epoxy composite layers when 0 increases. As 0 increases, it is known that energy
absorption increases. This is due to an increase in the number of laterally aligned fibers in the hoop
direction. Because fibers in the hoop direction are much stronger in tension than in compression, the
Page 54
44
increase in energy absorption is very noticeable. This translates into an increased stiffness. It is
possible that as the lateral strength increases, this increase adversely affects the energy absorption in
tubes of high lateral strength.
Evaluation of Solution Time
In regards to solution time, the relationship exhibited was fairly linear as sh. The average
solution time for a 4480 element (27,360 degrees of freedom) solution was approximately 2 days.
Figure 2-5 shows the effect of the number of elements on the average solution time and average
percent error with respect to the converged value. The solution time increases almost linearly with the
number of element but the percent error drops vary rapidly in the beginning but then becomes
asymptotic and converges to a low value.
Page 55
45
45.00% 3 12:00:00
40.00%
3 0:00:00
35.00%
2 12:00:00 30.00%
25.00%
2 0:00:00
20.00'
Û. 1 12:00:00
15.00%
10.00% 1 0:00:00
5.00%
0 12:00:00
0.00%
-5.00% 0 0:00:00
2000 5000 1000 3000 4000 6000 7000 0 Number of Elements
Fig. 2-5: The effect of the number of elements on the average solution time and average percent error with respect to
the converged value.
Conclusions
The effect of the number of elements is very significant in the convergence of the solution.
Initially, as the number of elements reduces to about 2000 the percent error reduces rapidly. Beyond
this the increase in the number of elements does not affect the percent error. The solution
convergence time is essentially linear with the increase in the number of elements. Based upon this
numerical study, it has been found that for the basic geometry of this composite crush analysis, 4480
Page 56
46
elements are sufficient in achieving a steady-state solution irrespective of stacking sequence. This
corresponds to a maximum aspect ratio of 4.7 and a maximum element size of 4.62e"3 in2.
References
1. Herakovich, Carl T., 1998: Mechanics of Fibrous Composites. John Wiley and Sons, Inc., New
York.
2. Kannien, Melvin F. and Carl H. Popelar, 1985: Advanced Fracture Mechanics, Oxford University
Press, New York.
3. Dayal, Vinay and V. K. Kinra, 1991: "Leaky Lamb Waves in an Anisotropic Plate II - NDE of
Matrix Cracks in Fiber-Reinforced Composites," Journal of the Acoustical Society of America, 89(4)
Pt.l: 1590-1598.
4. Gupta, Kajal K., 2000: Finite Element Multidisciplinarv Analysis, American Institute of
Aeronautics and Astronautics, Inc., Reston, VA.
5. Farley, Greg L., 1992: "Crushing Characteristics of Continuous Fiber Reinforced Composite
Tubes," Journal of Composite Materials, 26: 37-50.
6. Sigalas, J and M. Kumosa, 1991: "Trigger Mechanism in Energy Absorbing Glass Cloth/Epoxy
Tubes," Composites Science and Technology, 40: 265-287.
Page 57
47
7. Hamada, H and S. Ramakrishna, 1997: "FEM Method for Prediction of Energy Absorption
Capability of Crashworthy Polymer Composite Materials," Journal of Reinforced Plastics and
Composites, 16: 226-242.
8. Farley, Greg L, 1983: "Energy Absorption of Composite Materials," Journal of Composite
Materials, 17: 267-279.
9. Livermore Software Corporation, 2003: LS-DYNA Keyword User's Manual. Livermore Software
Technology Corporation.
Page 58
48
CHAPTER 3: THE EFFECT OF PLY ANGLE ON ENERGY
ABSORPTION OF A CIRCULAR GLASS/EPOXY CRUSH TUBE
Abstract
Past research has conclusively shown that long fiber structural composites possess superior
specific energy absorption characteristics as compared to steel and aluminum structures. However,
physical testing of composites is costly and time consuming. As a result, numerical solutions are
desirable as an alternative to experimental testing. Up until this point, very little numerical work has
been successful in predicting the energy absorption of composite crush structures. This research
chronicles some preliminary efforts to better understand the mechanics essential in pursuit of this
goal. This research is one in a series of investigations that evaluates the degree of suitability and
validity of employing a numerical method to model the dynamic crushing of long fiber structural
composites. This paper investigates the effect of ply orientations on the specific energy absorption in
a glass/epoxy composite crush tube.
Introduction
As a whole, composites have several additional advantages over traditional materials.
Primarily, they are lighter and relatively stronger than many of the traditional metals that they replace.
This affords engineers the opportunity to make much stronger and safer products. There are quite a
few different types of materials that are classified as composites; however, for the purposes of this
research, the term composites will be used to describe long fiber-reinforced composites with an epoxy
matrix. As it pertains to the analysis of composites, their material behavior differs greatly from
isotropic materials. Classical laminate plate theory (CLPT) has provided a great deal of insight into
Page 59
49
characterizing the static behavior of composite laminates. Particularly, CLPT has been very useful in
providing accurate analyses in the areas of transverse particle impact damage and damage from
various combinations of static loading [1],
In the most general of terms, a structural material's ability to absorb impact energy is
generally referred to as the "crashworthiness" of the structure. In passenger vehicles, current
legislation [2] requires that vehicles be designed such that, in the event of an impact at speeds up to
15.5m/s (35mph) with a solid, immovable object, the occupants of the passenger compartment should
not experience a resulting force that produces a net deceleration greater than 20g. Additionally, it is
imperative that crashworthy structures are designed to crush in a fairly predictable and controlled
manner. Traditionally, these crash structures have been constructed from structural steel. Although
clearly useful as structural members, steel and other metals also come with relatively higher weight
trade-offs and can ultimately lead to undesirable inertial effects as it pertains to crash events.
Since composites are comprised of individual layers of composite sheets, called lamina, each
layer has its own failure events associated with it. In regards to characterizing composite failure, it is
noteworthy to point out that composites experience local failures and final failure; thus "first failure"
does not necessarily correspond to "final failure" [3]. There is no single theory that accurately
predicts failure at all levels of analysis, for all loading conditions, and for all types of composite
materials. From the standpoint of a structural designer, it is desirable to have failure criteria which are
applicable at the level of the lamina, the laminate, and the structural component. Failure at these
levels is often the consequence of an accumulation of various micro-level failures which coalesce and
result in the final failure [3]. These micro failure events are critical, essential elements which
comprise the macroscopic failure theories. There are many macroscopic failure theories that have
been proposed for composites. The most notable of the general theories include the maximum stress,
maximum strain, Tsai-Hill, tensor polynomial and Tsai-Wu failure criteria.
Page 60
50
Although each individual micro failure event is well known, their mechanics are not trivial.
In developing more appropriate fracture mechanics techniques for applications to fiber reinforced
composite materials, several basic facts must be kept in mind. These include preparation defects (e.g.,
resin-starved or fiber starved areas), defects in laminates (e.g., fiber breaks, ply gaps, delamination),
and fabrication defects (edge delamination caused by machinery, dents, and scratches) [3],
Nevertheless, even after controlling all of these requirements, crack propagation in a composite is still
quite difficult to model. After a crack initiates it can grow and progressively lower the residual
strength of a structure [4] to the point where it can no longer support design loads, making global
failure imminent. A second key fact involved in the application of fracture mechanics to composite
materials is the basic heterogeneous nature of fiber-reinforced composites. Within a ply, cracking can
be both discontinuous (e.g., fiber bridging) and non-collinear crack growth (e.g., matrix splitting). On
the laminate level, cracking can proceed in a distinctly different manner in different plies and, in
addition, inter-ply delamination can occur. Consequently, many researchers have pursued an energy
balance approach to the problem. This does not really present a significant improvement over the
fundamental difficulties associated with the stress intensity factor point of view, however. As a result,
composite finite element solutions have yet to account for the mechanics of composite fracture. The
extent to which fracture mechanics may govern the energy absorption capacity in a composite is still
under investigation.
In an effort to better understand the specific energy absorption capabilities of composite
materials, much research has been conducted. The bulk of this research has been experimental trials
which have been quite successful at evaluating the sustained specific energy absorption in composite
crush tubes. It has been experimentally quantified [5] that graphite/epoxy composites absorb more
energy per unit mass than both 6160 Aluminum and mild steel [6], This is primarily due to the
extremely high strength or modulus (not both) exhibited within the graphite fibers. The following
Page 61
51
research has borne out some very useful relationships regarding the effects of fiber properties and
fiber ply orientations.
In the most general sense, there are four major findings in regards to the effect of the fiber
properties on energy absorption. Experimental trials involving the static crushing of both glass/epoxy
and graphite/epoxy composites by Farley [5] suggest a decrease in the density of a fiber causes an
increase in the specific energy absorption. Additionally, he found that the higher the strain to failure
of a fiber, the higher the specific energy absorption. It is also noteworthy to point out that another
experimental study found that when fiber reinforced tubes crush in similar modes, energy absorption
is much more sensitive to changes in the fiber failure strain than changes in the fiber stiffness.
However, Schmueser and Wickliffe [7] found that both graphite and glass tubes exhibited brittle
failure modes which consist of fiber splitting and ply delamination. They further theorized that with
respect to aramid fibers (which exhibit ductile, progressive folding energy absorption modes), the
relative lower strain to failure is the culprit. These conflicting results clearly indicate there is some
disagreement in whether glass and graphite fibers actually (1) exhibit the same crushing behaviors
with respect to one another; (2) fail in different crush modes with respect to one another and; (3) are
influenced by ply orientations differently with respect to one another.
In an attempt to better understand how composite laminate stacking sequence influences
specific energy absorption with a glass/epoxy composite, a literature search was conducted. Of the
numerous findings, the most noteworthy items can be summarized as four main ideas. Energy
absorption within a composite crush structure is enhanced when one of four events occur. Specific
energy absorption is increased when (1) the axial stiffness of the composite is increased; (2) the
lateral stiffness of the composite is increased; (3) the number of fractured fibers is increased; and (4)
the composites experience an increase in material deformation. Perhaps what stand out most among
these findings are the obvious contradictions of the first two and the simplicity of the latter two. For
Page 62
52
this reason, this paper takes a closer look at the seemingly dueling premises of the effects of both
axially and laterally aligned fibers.
A closer inspection of the supporting data suggests that the energy absorption capacity in
glass/epoxy tubes appears to be primarily influenced by the amount of lateral support present which is
directly determined by fiber orientation [5], whereas, energy absorption in graphite/epoxy tubes is
primarily affected by the amount of axial stiffness in the tube. Again the axial stiffness is directly
determined by fiber orientation. In the case of the filament wound tubes, for some strange reason it
appears that energy absorption is influenced by both axial stiffness and lateral support. To study these
aforementioned associations, this paper will focus on the influence of axial and lateral effects on
energy absorption. The results of this work will hopefully lead to the next steps of creating and
proving a predictive methodology for this type of energy absorption.
Because of the ability for composites to be fabricated according to specific applications, the
stacking sequence plays an increasing role in maximizing the specific energy absorption within a
multi-layered laminate. This layering directly influences the energy absorption capability of the
composite tube. It is of great importance to discern if the experimental relationship between laminate
stacking sequence and energy absorption is observed in the numerical prediction during this phase of
research. Although the need for the development for a complete FEM to predict composite energy
absorption has been widely researched and widely accepted, it is unknown as to how much energy
absorption is associated with each constituent failure event. This paper is one in a series of papers that
attempts to approximate the energy absorption using CLPT and existing FEM capabilities. In an
attempt to arrive at a predictive methodology to determine the sustained specific energy absorption in
a glass/epoxy thin walled composite tube, the dynamic FEA tool, LS-DYNA was used.
Page 63
53
Methodology
Numerical Solution
The numerical solution initially begins with finite element analysis and laminate constitutive
relations. Laminate constitutive equations provide an efficient, yet highly effective, means of
characterizing the behavior of a 3-D composite structure as if the composite were composed of
several layers of 2-D plates. When the means of characterizing the general mechanical response of a
laminated composite are provided, FEA can then be performed. Numerous FEA programs exist for
the numerical analysis of composites. These programs primarily use discretization and numerical
approximation to simulate structural and material response. However, very few of these techniques
incorporate the layered analysis resulting from the laminate constitutive equations to model
composite material behavior. Even fewer consider the complex highly coupled response to structural
loads exhibited by anisotropic materials.
Currently FEA composite material models are quite capable of predicting and simulating the
propagation of interlaminar and intralaminar crack propagation; although these algorithms are usually
performed in fracture analyses only. Although less significant during static analysis, the complex
secondary effects of interlaminar and intralaminar crack propagation are notably absent in many FEA
composite material models. LS-DYNA is among the FEA software suites incapable of incorporating
these secondary effects of composite inter and intralaminar cracking. However the laminate
constitutive equation based material models offered by LS-DYNA have demonstrated a high degree
of accuracy within the realm of quasi-static analyses.
Page 64
54
FEA Model
The numerical solution was obtained using LS-DYNA [9] which is a general-purpose finite
element code for analyzing the large deformation dynamic response of structures. The main solution
methodology is based on explicit time integration. In this work we have chosen four-node quadratic
layered solid elements.
The material model used by LS-DYNA is based on classical laminate plate theory (CLPT). It
allows for the "stacking" of several "layers" of plies which may have any arbitrary fiber orientation.
Each ply is permitted its own response by use of its own integration point. Within this model, the
primary means of energy absorption occurs as a result of matrix failure, fiber failure and laminate
delamination. It is important to note that although this theory has been extremely accurate within the
static realm, Farley [8] theorized that there are distinct differences in the failure mechanics when
compared to the dynamic and realm. Most notably, he states that in addition to energy absorption via
the failure modes of CLPT, energy is also absorbed via fiber and matrix fracture, bundle friction,
interlaminar crack formation and intralaminar crack formation in a dynamic crush event. However, as
stated previously, the scope of this work is to evaluate the ability and usefulness of the LS-DYNA's
CLPT material model to numerically calculate and compare with the dynamic response observed
experimentally.
Materials
Graphite/epoxy long fiber structural composite tubes absorb more energy per unit mass than any
other structural long fiber composite; however, graphite fibers are relatively expensive. As a result,
E-glass fibers may prove to be a reasonable and affordable alternative in many experiments. It is for
this reason that E-glass fibers were selected. The matrix material used in this study was epoxy resin.
Epoxy resin is one of the most common thermoset polymer matrix materials. Epoxies are relatively
Page 65
55
inexpensive but have better moisture resistance and lower shrinkage on curing. Maximum use
temperatures of epoxies are in the vicinity of 175°C. The resulting composite employs a fiber volume
fraction of 62%. This is consistent with the make up of a typical E-glass/epoxy composite used
experimentally. [10]
Tube Dimensions
The tube dimensions were chosen to be comparable to existing experimental data. The tubes
were nominally 4" in length, 1.5" in mean diameter,!) , and are 6 plies thick. Each ply was of
0.0125" nominal thickness. D /t has a value of 14.85, where t is the total wall thickness. Each FEA
tube had a simulated chamfer to help initiate a stable crush. Within the FEA model the simulated
chamfer consisted of step down uniform thickness plate element in contrast to the actual variable
thickness cross-sectional geometry of a "real" chamfer. This was also successful in avoiding
numerical instabilities. Each tube contained 6 plies, with a stacking sequence of [07±6707±6°]T,
where 6 was 15°, 30°, 45°, 60°, 75° or 90°.
Finite Elements
Each tube was preprocessed using 4480 elements. It has been documented [11] that 4480
elements yield stable and reliable solution.
Impact Characteristics
The actual crush event was simulated by a translating rigid body of 3 slugs moving at an
initial impact velocity of 25 ft/s. This is consistent with the comparable experimental results.
Page 66
56
Post-Processing
Once input into an LS-DYNA input deck, the program is able to generate a wealth of
structural output data. The data was then evaluated using both the graphical user interface and
individual data points. Of primary interest was the total axial deflection of each composite crush
simulation as well as an individual element analysis to evaluate the effect on the material model
verses specific energy absorption.
Computation of Energy Absorption
The specific energy absorption, Esp, in equation 3-1 is directly evaluated based upon the post
crush peak axial displacement, such that
where E, is the net impact kinetic energy, p is the material density and V is the volume of material
displaced during and axial tube crush.
Results and Discussion
In this analysis, preliminary evaluation of the performance of the LS-DYNA program was
favorable. Although physical characteristics of the experimentally observed crushing behavior were
missing, the algorithms of the numerical solution executed without any instabil ities. It was
observed that as the angle,#, increased, the energy absorption increased and the crush deflection
decreased. These preliminary observations were promising precursors to the evaluation of the effect
of fiber ply orientation on specific energy absorption.
Based on previous experimental work, it is observed that in ply orientations of
[O7±07O7±0°]t, generally the energy absorption values are steady for 6greater than 45° and increase
Page 67
57
fairly linearly as 0 approaches 90°. Presented in figure 3-1 is the crush distance as the ply angle 0is
increased from 10° to 90°.
C 1.50
U 1.00
Angle, 6
Figure 3-1 : Crush distance as a function of 0
It is notable to observe that generally as the angle increases, the column height deflection dips around
45°. It rises up again rapidly and then the crush heights decrease fairly linearly up to 90°. Although
there appears to be some differences there is some significant agreement between the experimental
and numerical data. We will later try to explain this anomaly in the observations. Based upon the
behavior exhibited between 0and crush height, it is to be expected that the energy absorption
generally increases. Figure 3-2 shows the variation of the specific energy absorption as a function of
Page 68
58
ply angle ft Again there is a spike around 45° which suggests a brief increase in specific energy
absorption.
0 = 40
2-
1
? a>
& m
0 10 20 30 40 50 60 70 80 90 100
Angle, 0
Figure 3-2: Specific energy absorption as a function of 6
This numerical solution is consistent with the experimental observations. Although there does not
seem to be an absolute correlation between the experimental and numerical results, preliminary
observations are promising. It is noteworthy that certain trends are shared amongst both data sets.
Figure 3-3 presents a comparison between the numerical data obtained in this research and
experimental data as reported by Farley [10].
Page 69
59
•Numerical
"Experimental
10 20 30 40 50 60
Angle, 6
70 80 90 100
Figure 3-3: Experimental [10] and numerical specific energy absorption as a function of 0
Generally, the numerical data is comparable to the experimental values. As the angle increases
beyond 45°, there is a sharp increase of specific energy absorption with respect to ply angle6. For 6
less than or equal to 45°, the experimental data suggests a very flat slope; in comparison, the
numerical value fluctuates significantly within this range. Observe also that the experimental data
suggests an increase in the absorbed at 30°.
Considering the limitations inherent in the numerical model, it was very promising that there
was some notable agreement with regard to experimental results. More importantly however the
discrepancy gives rise to the opportunity to explore the mechanics involved in composite energy
absorption. It was experimentally suggested that both the axial and lateral moduli play significant
Page 70
60
roles in composite energy absorption, thus we will re-visit the question of equivalent laminate
properties.
When a composite laminate is used as a structural material, the individual properties of the
fibers, matrix, and the lamina are not important. As a structural component, the overall behavior of
the laminate is of interest. The elastic moduli and the fiber orientation of each ply contribute to the
overall stiffness and strength of the laminate. Fig. 3-7 presents the axial, lateral, and the shear
modulus for a [O7±07O7±0°]T laminate as the ply angle 6 changes.
8.00E+06
7.OOE+06
6.00E+06
S 5.00E+06
o 4.00E+06
£ 3.00E+06
2.OOE+06
1.00E+06
0.00E+00
Angle, 0
Axial
Lateral
Shear
Figure 3-4: [O°/±9°/O°/±0°]T composite plate effective elastic moduli as a function of 0
Axial stiffness increases and the lateral stiffness decreases as a function of 6. The important
observation is that the shear modulus reaches a maximum at 6equal to 45° and is lowest at both 0°
Page 71
61
and 90°. Figure 3-5 presents the axial to lateral stiffness ratios as the ply angle ft changes. This shows
that the relative stiffness, axial/lateral, is maximum at ft equal to 0" and minimum at ft equal to 90°.
3.00
2.50
.1 2.00 "U o c
I 1.50
I « £ 1.00
0.50
0.00
Axial/Lateral
Lateral/Axial
10 20 30 40 50 60 70 80 90 100
Angle, 8
Figure 3-5: Ratio of elastic moduli as a function of 0
These laminate properties allow us to determine the tube's effective modulus which in turn is
used to then evaluate stresses, strains and failure events. In the CLPT material model, this is
important because it assumes there are only five failure mechanisms available to absorb energy.
Page 72
62
Since isotropic materials have no preference for orientation, the determination of material
strength is straightforward [12]. The determination of composite strength is based on failure criteria,
analogous to the von Mises criterion, where the interaction between stresses plays an important role.
This quadratic interaction criterion is the basis for evaluating failure in a composite material, and can
be represented in stress space as;
F I JAJAJ + F IAJ = 1 3-2
The coefficients Fy, and Fj can be easily related to the in-plane strengths of the lamina in tension,
compression and shear. Fiber orientation has a profound effect on the strength of the resultant
composite in each direction. It is these theories: stiffness and strength respectively, working in
concert that formulate the basis for investigating how ply orientations affect energy absorption.
Compression load in the axial direction results in tensile stress in the lateral direction. When
there are no fibers in the lateral direction then the loads have to be taken by the matrix and the fibers
at an angle. More fibers in the lateral direction increase its lateral strength and the tube is more
resistant to crushing. This of course, is the relationship exhibited experimentally between 6and
energy absorption. It would suggest that within a glass/epoxy composite, the composite should
become more resistant to axial crushing as more fibers are oriented in the lateral direction (90°). The
sensitivity of energy absorption due to the composite moduli was evaluated to study this. Figures 3-6
and 3-7 present the energy absorption as a function of axial and lateral modulus, respectively; no clear
relationship of observed.
Page 73
63
4.5E+06 5.0E+06 5.5E+06 6.0E+06
Axial Elastic Modulus, psi
Figure 3-6: Energy absorption as a function of Effective Axial Modulus
Page 74
64
I55 O V) S < > Ui
UJ 50 O H= 'S a (Z)
• •
40 -
2.0E+06 2.5E+06 3.0E+06 3.5E+06 4.0E+06 4.5E+06 5.0E+06 5.5E+06 6.0E+06 6.5E+06
Lateral Elastic Modulus, psi
Figure 3-7: Energy absorption as a function of effective lateral modulus
Figure 3-8 shows the energy absorption as a function of the ratio of axial/lateral modulus and a trend
emerges very clearly. If modulus ratio is small the energy absorption is large and as the ratio
increases the energy absorption reaches a low value.
Page 75
65
70
60
50
40
n <
S> 30
5" 20
10
O.OE+OO 5.0E-01 1.0E+00 1.5E+00 2.0E+00
Axial to Lateral Modulus ratio
2.5E+00 3.0E+00
Figure 3-8: Energy absorption as a function of axial to lateral modulus ratio
Now we will re-visit the question of the dip in the energy absorption curve at an angle of 45°. We
have seen that the shear modulus is highest at an angle of 45°. This means that at this angle the
laminate of has its highest torsional stiffness. This stiffness results in the reduction of crush height
and an increase in the specific energy absorption. Again, the question is why this phenomenon is not
observed in the actual cylinders? Our conjecture is that the epoxy has a strain rate dependent response
and this visco-elastic response tends to rotate the fibers. The fibers do not fracture but rotate, thus
reducing the energy absorption.
Page 76
66
Conclusions
A study of the ply angle on the specific energy response has been presented. Beyond an angle
of 45°, a very good correlation is observed between the numerical results presented here and
experimental results presented elsewhere. The response of the cylinder is not only dependent on the
axial and lateral stiffness but also on the shear stiffness and strength, which reach maximum at a fiber
angle of 45°. The discrepancy between the experimental and numerical below 45° angle samples can
be attributed to the visco-elastic behavior of the epoxy. Further work in this area has to be done to
better understand and quantify this phenomenon.
References
1. Reddy, J.N., 1996: Mechanics of Laminated Composite Plates: Theory and Analysis, CRC Press,
Boca Raton, FL.
2. Jacob, George C., 2002: "Energy Absorption in Polymer Composites for Automotive
Crashworthiness Journal of Composite Materials," 36:813-850.
3. Herakovich, Carl T., 1998: Mechanics of Fibrous Composites, John Wiley and Sons, Inc., New
York.
4. Dayal, Vinay and V. K. Kinra, 1991 : "Leaky Lamb Waves in an Anisotropic Plate II - NDE of
Matrix Cracks in Fiber-Reinforced Composites," Journal of the Acoustical Society of America, 89(4)
PU: 1590-1598.
5. Farley, Greg L., 1986: "Effect of Fiber and Matrix Maximum Strain on the Energy Absorption of
Composite Materials," 20: 322-334.
6. Thornton, P H., 1979: "Energy Absorption of Composite Structures," Journal of Composite
Materials, 13: 247-262.
Page 77
67
7. Schmuesser, D.W. and L.E. Wickliffe, 1987: "Impact Energy Absorption of Continuous Fiber
Composite Tubes," Journal of Engineering Materials and Technology, 109: 72-77.
8. Farley, Greg L. and Robert M. Jones, 1992: "Crushing Characteristics of Continuous Fiber
Reinforced Composite Tubes," Journal of Composite Materials, 26: 37-50.
9. Livermore Software Corporation, 2003: LS-DYNA Keyword User's Manual, Livermore Software
Technology Corporation.
10. Farley, Greg L., 1983: "Energy Absorption of Composite Materials," Journal of Composite
Materials, 17: 267-279.
11. Pickett, Leon and Vinay Dayal, 2006: "Finite Element Model of a Dynamic Composite Crush
Event," Chapter 2 of this thesis.
12. Tsai, Stephen W. and Thomas H. Hahn, 1980: Composite Materials, Technomic Publishing,
Lancaster, Pa.
Page 78
68
CHAPTER 4: THE EFFECT OF IMPACT VELOCITY ON
ENERGY ABSORPTION OF A CIRCULAR GLASS/EPOXY
CRUSH TUBE
Abstract
Dynamic crushing behavior of composite tubes has been experimentally found to be
influenced by impact velocity, tube geometry and ply orientations. This research attempts to
investigate the possibility of constructing a predictive methodology to determine the energy
absorption capability of a composite crush tube. The motivation for the work comes from the need to
be provided a lower cost alternative to the fabrication and destructive testing of composite crush
structures. This research is one in a series of investigations that evaluates the degree of suitability and
validity of employing a numerical method to model the dynamic crushing of long fiber structural
composites. This paper investigates the effect of impact velocity on the specific energy absorption in
a glass/epoxy composite crush tube.
Introduction
Over the years, long fiber, reinforced composites have been steadily integrated into many of
our everyday products. Among the industries that have seen far reaching successful integration of
composites is the aerospace industry and the sporting goods. Within the aerospace industry, the use of
composites have led to the significant reduction of component parts and decreased weight.
Automotive industry has also started taking a keen interest in the use of composites in their structures.
However, the auto industry primarily uses composites in the semi-structural or decorative parts; hood,
decklids, doors and bumpers. Based largely in part to the overwhelming success of composite use in
Page 79
69
the aerospace industry, automotive composites are now seeing increasing use as load bearing
structural members. Composite's energy absorption capability is one of the main motivator for the
increased automotive applications.
The ability to absorb impact energy and be survivable for the occupants is called the
"crashworthiness" of the structure. Current legislation for automobiles requires that vehicles be
designed such that, in the event of an impact at speeds up to 15.5m/s (35mph) with a solid,
immovable object, the occupants of the passenger compartment should experience a resulting force
that produces a net deceleration less than 20g. Within the aerospace industry, many rotary aircraft
specify specific low impact crashworthiness requirements that are more easily facilitated by the use of
composites [1],
Since composites are anisotropic and changes in stacking sequence influence macroscopic
material properties, these infinite configurations lead to infinite unique energy absorption
characteristics. This is compounded by the fact that there are several combinations of unique fiber and
matrix materials that can be combined to form unique composites, each with unique material
properties. Full understanding of these numerous combinations would involve great expense and time
in any experimental research therefore a numerical solution may be an inexpensive alternative.
However, it is important to note that the analytical study and design of composite materials requires
knowledge of anisotropic elasticity, structural theories, failure/damage criteria and fracture
mechanics.
In a crush event it has been theorized that during axial compression of composite tubes, both
interlaminar and intralaminar cracking play an integral role in the energy absorption process. This is
very consistent with what is observed during experimental testing. Fracture mechanics in particular
governs the formation of interlaminar and intralaminar cracking and how these ensuing cracks
propagate [2], These cracks, in turn, cause the formation of lamina bundles which may fracture or
bend, depending on the loads experienced by each bundle. It is of great significance to note the
Page 80
absence of fracture mechanics into composite laminate plate elements in standard commercially
available FEA software packages.
Compared to most popular isotropic metals, composites have a much higher specific energy
absorption capacity; meaning that they absorb more energy per unit mass. The energy absorption
mechanisms of composites have only recently become well known and much work is to be done to
fully understand them. Farley [3] has theorized that there are three main crushing initiators involved
in most crush events and the fourth is a hybrid crushing initiator which is the primary means which
long fiber structural composites absorb energy. This mode is characterized by the formation of lamina
bundles of moderate length during impact. As a result, composite energy absorption is due to fracture,
friction and bending of the fiber bundles. Conversely metals, when subject to a compressive load,
experience a buckling crush mode. This is primarily due to the high degree of plasticity exhibited.
Predictable progressive folding, stable post crushing integrity and virtually unchanged material
properties characterize this mode. The resulting specific energy absorption however, is noticeably
lower than that exhibited by high performance structural composites.
Extensive experimental research has borne out some very useful relationships regarding the
effects of fiber properties, ply orientations, impact velocity and tube geometry [1]. In most of this
work there seems to be a lack of consensus about the influence of impact velocity on the energy
absorption. Past experimental investigation has found that in some cases the impact velocity plays a
very important role in the energy absorption in a crush tube while none at all in others. However, it is
observed that energy absorption capability is a function of testing speed when the mechanical
response of the crushing mechanism is a function of strain rate. Finally, it has been experimentally
determined that the velocity at which the structure is loaded has an effect on the material's crushing
behavior [4], It is theorized that this is driven by a decrease in composite fracture toughness as
velocity increases.
Page 81
Up to now, all insights gained have been through experimental work. For the purposes of
gaining a better general understanding of how composites absorb energy and characterizing the ability
of composites to absorb energy, both experimental and limited numerical research has been very
useful. Among the numerical methods available for the solution of differential equations defined over
arbitrary domains, the finite element method (FEM) is the most effective method [5], There have been
some noteworthy efforts in the attempt to use finite element analysis codes to arrive at a predictive
methodology to determine the energy absorption in composite crush tubes [6,7]. Although the need
for the development for a complete finite element method to predict composite energy absorption has
been widely researched and widely accepted, it is unknown as to how much energy absorption is
associated with each constituent failure event. This paper is one in a series of papers that attempts to
approximate the energy absorption using composite laminated plate theory and existing finite element
method capabilities. In an attempt to arrive at a predictive methodology to determine the sustained
specific energy absorption in a glass/epoxy thin walled composite tube, the dynamic finite element
analysis tool, LS-DYNA [8] was used. Specifically, this work investigates the capability of LS-
DYNA in discerning the influence of impact speed on the specific energy absorption within a
glass/epoxy composite crush tube.
Methodology
Finite Element Model
The numerical solution was obtained using the LSDYNA software suite. LS-DYNA is a
general-purpose finite element code for analyzing the large deformation dynamic response of
structures. The main solution methodology is based on explicit time integration. Spatial discretization
is achieved by the use of four-node quadrilateral elements. The material model used by LSDYNA is
based on classical laminate plate theory. It allows for the "stacking" of several "layers" of plies which
Page 82
may have arbitrary ply orientations. Each ply is permitted its own response by use of its own
integration point. Within this model, the primary means of energy absorption occurs as a result of
matrix failure, fiber failure and laminate delamination. It is important to note that although this theory
has been extremely accurate within the static realm, Farley theorized that there are distinct differences
in the failure mechanics when compared to the dynamic realm. Mo7st notably, he states that in
addition to energy absorption via the failure modes of CLPT, in a dynamic crush event energy is also
absorbed via fiber and matrix fracture, bundle friction, interlaminar crack formation and intralaminar
crack formation. However, as stated previously, the scope of this work is to evaluate the ability and
usefulness of the LS-DYNA composite material model to numerically predict the dynamic response
observed experimentally. Each 'virtual" tube investigated in this work was preprocessed using 4480
composite shell elements. It has been documented that 4480 elements yield a very stable solution
without excessive computational costs [9],
Materials
Graphite/epoxy long fiber structural composite tubes absorb more energy per unit mass than
any other long fiber structural composite; however, graphite fibers are relatively expensive. As a
result, E-glass fibers may prove to be a reasonable and affordable alternative in many experiments. It
is for this reason that E-glass fibers were selected. The matrix material used in this study was epoxy
resin. Epoxy resin is one of the most common thermoset polymer matrix materials. Epoxies are
relatively inexpensive but have better moisture resistance and lower shrinkage on curing. Maximum
use temperatures of epoxies are in the vicinity of 175°C. The resulting composite employs a fiber
volume fraction of 62%. This is consistent with the make up of a typical E-glass/epoxy composite
used experimentally [10].
Page 83
73
Tube Dimensions
The tube dimensions were chosen to be comparable to existing experimental data. The tubes
were nominally 4" in length, 1.5" in mean diameter and 6 plies thick. Each ply was of .0125" nominal
thickness. D /t has a value of 14.85 where t is the wall thickness. Each finite element tube had a
simulated 45° chamfer to help initiate a stable crush. This chamfer was approximated by a step
change in the ply thickness in contrast to the actual variable thickness cross-sectional geometry of a
"real" chamfer. This was successful in avoiding numerical instabilities.
Impact Characteristics
The actual crush event was simulated by the creation of a translating rigid body. In this study,
the rigid body had a mass of nominally 3 or Vi slugs. For the 3-slug impact study, the velocity varied
from 2.5 to 50 ft/s. For the '/z-slug impact study, the velocity varied from 5 to 100 ft/s. This is
consistent with the comparable experimental results [4],
Post-Processing
Once input into LS-DYNA, the program is able to generate a wealth of structural output data.
The data was then evaluated using both the graphical user interface and individual data points. Of
primary interest was the total axial deflection of each composite crush simulation as well as an
individual element analysis to evaluate the effect on the material model verses specific energy
absorption.
Page 84
74
Computation of Energy Absorption
The specific energy absorption, Esp, is directly evaluated based upon the post crush peak axial
displacement, such that
where E, is the net impact kinetic energy, p is the material density and V is the volume of material
displaced during and axial tube crush.
Results and Discussion
Preliminary evaluation of the performance of the LSDYNA program was favorable. Although
physical characteristics of the experimentally observed crushing behavior were missing, the
algorithms of the numerical solution executed without any numerical instabilities. Generally, it was
observed that as impact velocity increased, energy absorption values became more stable. These
preliminary observations were promising precursors to the evaluation of the effect of impact
velocities and impact energies on the energy absorption capacity of glass/epoxy composite crush
tubes.
Impact Velocity and Impact Energy
Although there has yet to be clear consensus, there has been extensive experimental
evaluation on the effect of impact velocity on specific energy absorption [4, 11-13]. As a result of this
notable discrepancy the first task was to evaluate what, if any, effect velocity has on energy
absorption within a numerical solution. Figure 4-1 shows the energy absorption as a function of
impact velocity. It is observed that within both the 3-slug and '/z-slug data sets, high absorption takes
place at low impact velocities and then the absorption reduces to a lower value with little variation.
Page 85
75
The relationship between the impact velocity and energy absorption is not very clear from this data
set; neither is the effect of increasing the impact velocity.
120
100
§ 80
<
O c LU
40
20
• •
• 3.0 slugs
#0.5 slugs
2 3 4 5 6
Impact Velocity, in/s
Figure 4-1: Energy absorption as a function of velocity
In Figure 4-2, the impact velocity is plotted as a function of crush height. Distinctly similar
phenomenon is observed within the 3-slugs and '/2-slug data sets respectively. Both trend lines are
clearly characterized as 2nd order behavior such that they are governed by the basic equation that
Z = til'2 where a has values of 0.39 s2/ft and 0.056 s2/ft for the Vi slug and 3 slug trend lines,
respectively.
Page 86
76
2.50
y = 0.389x - 0.0612x(
R2 = 0.9987
y ^O.OSSSx2* 0.0112X
R2 = 0.9589 J 2.00
1.50
1.00
0.50
0.00
2 4 6 0 1 3 5 7
Impact Velocity, in/s
• 3.0 slugs
• 0.5 slugs
Poly. (3.0 slugs)
Poly (0.5 slugs)
Figure 4-2: Crush height as a function of impact velocity
From these line equations we clearly conclude that there are two unique relationships characterizing
each trend line simultaneously. Preliminarily, this would seem to suggest that impact velocity plays
some role on the net deflection of a composite crush tube. However, revisiting the general curve
equation, it is immediately interesting that its form leads to a familiar and fundamental observation.
The kinetic energy for a body of known mass, m, and initial velocity, v is
E = /2m\r . 4-2
Furthermore, for every velocity, v, in each data set, there exists an impact energy En such that both
correspond to an identical crush height z-,. Therefore it is clear that
Page 87
77
Z\i=c\Eu=a\vl 4-3
and
z2i = C2E2i = a2vl 4-4
Here subscripts 1 or 2 correspond to the Vi or 3-slug data sets, respectively. Note that the 3-slug
(nominal) mass is exactly 6.25 times larger than the Vi (nominal) slug mass,
m, = 6.25»!,. 4-5
Finally recognizing that a] = 5.75a,, it is clear that the ensuing relationship between z and E, is
essentially linear, and C, = 1=1,357e 4 slug/lb and C2 = 125aZ = 1,3572e"4 slug/lb. The /m, ^
predicted value for both C, and C2 compare favorably to the actual values taken directly from figure
4-3.
2.50
2.00
1.50 -
0.50
0.00
y = 1.35717E-04X
R2 = 9.58673E-01
y = 1.35237E-C
R2 = 9.97732E
• 0.5 slugs
• 3.0 slugs
Linear (3.0 slugs)
Linear (0.5 slugs)
O.OE+O 2.0E+3 4.0E+3 6.0E+3 8.0E+3 1.0E+4 1.2E+4 1.4E+4 1.6E+4 1.8E+4
Total Net Impact Energy, in-lb
Figure 4-3: Crush height as a function of impact energy
Page 88
Moreover, the actual relationship is indeed linear as predicted. Most importantly, Q and C2 have an
8% difference with respect to one another. Although not conclusive, this indeed suggests a fairly
strong relationship between crush height and impact energy. As a result, this would suggest that
impact velocity is much less significant in influencing energy absorption than impact energy.
Figure 4-4 shows a much clearer relationship between energy absorption and impact energy.
Again, the higher initial energy values are associated with impact energies less than 2500 in-lb.
Moreover for initial impact energies greater than this, energy absorption stabilizes at a constant value.
Additionally, this threshold appears to be universal to both data sets. In short, specific energy
absorption is far less dependent on impact velocity as is on impact kinetic energy. Although not yet
completely quantified, a much clearer relationship results when evaluating the effect of impact energy
on the total sustained specific energy absorption of the glass/epoxy long fiber composite crush tubes.
Page 89
79
140 -i
120
Elastic Region
80
60
Brittle Region
40
• 3.0 slugs
• 0.5 slugs
20
0 4 1 —I r- , , ! !
0.0E+00 2.0E+03 4.0E+03 6.0E+03 8.0E+03 1.0E+04 1.2E+04 1.4E+04 1.6E+04 1.8E+04
Total Net Impact Energy, in-lb
Figure 4-4: Energy absorption as a function of impact energy
Energy Absorption Regions
Closer inspection of the figure 4-4 also reveals that energy absorption is independent of both
impact mass and impact velocity. More importantly there are at least two distinct crush morphologies
resulting in 2 distinct classes of energy absorption. In the first region, energy absorption values range
from 54 to 117 kJ/kg, with an average value of 100 kJ/kg with a median value of 113 kJ/kg. In the
second region, energy absorption values range from 40-63 kJ/kg with an average value of 59kJ/kg
with a median value of 57 kJ/kg. Up to this point, the bulk of research on composite energy
absorption primarily has been concerned with energy absorption values resulting from destructive
Page 90
failure modes. However this new data suggests the existence of less destructive failure characteristics
occurring at lower impact energy.
Appearance of abnormally high energy absorption values below impact energy of 2500 in-lbs
clearly suggests some elastic response in the crush tube. Glass/epoxy composites fail in a brittle
manner with no plastic deformation. This high energy absorption suggests that elastic strain energy is
contributing to the energy absorption. The amount of spring back was evaluated to verify this
conjecture. Any material loaded within its elastic region can be unloaded such that it may regain a
portion of its pre-loaded length. In an attempt to evaluate the occurrence of this phenomenon, the
spring back percentage was measured where spring back percentage is the measure of restored length
compared to the maximum deflection during the crushing process.
Elastic Response Energy Absorption Region
It was observed that after the peak column deflection occurred, the amount of post crush
column restoration, or spring back percentage differed greatly between the two regions. The spring
back is defined as the difference between the maximum deflection in the column and the post crush
equilibrium restoration distance. It was determined earlier that column deflection varies linearly with
impact energy, hence the percentage of spring back with respect to the maximum deflection observed
in the column in question is presented in figure 4-5. In the first region, the spring back values varied
from 13.2% to 45.3%.
Page 91
81
50%
45% -
40%
*
E "D O c
35% <
•• s 30% O)
</)
o 25%
° 20%
I S 15% CL
10%
5%
0%
Elastic Region
Brittle Region | *3.0 slugs
• 0.5 slugs
0.0E+00 2.0E+03 4.0E+03 6.0E+03 8.0E+03 1.0E+04 1.2E+04 1.4E+04 1.6E+04 1.8E+04
Total Net Impact Energy, in-lb
Figure 4-5: Spring back percentage as a function of impact energy
The results show that below an impact energy of 2,500 in-lbs there is significant spring back, while
above 2500 in-lbs the spring-back percentage practically goes to zero. This shows that the two
regions represent different types of energy absorption phenomenon. This threshold, not
coincidentally, corresponds to the impact energy threshold previously identified.
Brittle Response Energy Absorption Region
The phenomenon of elastic response is a plausible explanation in characterizing this first
energy absorption region. However the next question is: What is the limit of this relationship? This
Page 92
82
problem can be approached from two different aspects. The first is the logical extension of elastic
loading; an investigation of where ultimate strength occurs. The second possible answer comes from
the buckling phenomenon. The critical buckling load, NCr, from the eigenvalue problem of a thin
walled composite tube gives, is given by:
where ft is the axial frequency, Dn is the bending stiffness in the axial direction, n is the
circumferential full wave number, D/2 is the bending stiffness in the axial-radial plane, D66 is the
bending stiffness in the normal direction, D2? is the bending stiffness in the radial direction, r is the
radius of the cylinder, E0 is the effective radial stiffness of the composite layers, t is the total shell
thickness, Gxg is the effective shear modulus of the composite layers, vM is the effective Poisson's
ratio in the axial-radial plane, and Ex is the effective axial stiffness of the composite layers [14].
Infinite numbers of buckling loads exist for a tube, each of which is associated with unique axial and
circumferential wave frequencies. It is noteworthy to point out that the critical buckling load is not
always associated with the lowest axial (where m=l) and lowest circumferential (where n=0)
frequencies. To find the critical buckling load it is necessary to evaluate equation 4-6 among a range
of m and n. The critical buckling load is the lowest buckling load irrespective of the values of m or n.
For a 4" column with a mean radius of % ", the lowest theoretical load of 26,800 lbs occurs
where n=0 and m=8. This value is then compared to the peak crushing load exhibited in each column.
It is observed that Ncr exceeds the peak loads found in the test columns as shown in figure 4-6.
+ 2/32tr{Dn + 2Dbh)+ n* D,
/?V + 4-6
Page 93
83
35000 T
30000
25000
20000
S- 15000
10000 -
5000
-0.5 slugs
-3 slugs
•P critical
0.0E+00 2.0E+03 4.0E+03 6.0E+03 8.0E+03 1.0E+04 1.2E+04 1.4E+04 1.6E+04 1.8E+04 2.0E+04
Impact Energy, in-lbs
Figure 4-6: Impact energy as a function of maximum impact force
The critical buckling load is higher than the impact force exhibited in individual tubes. It should be
kept in mind that the buckling load here is static while the impact force is a dynamic event. These
results show that the dominant failure mode is crushing and the buckling does not occur in the results
presented here. It can then be concluded that in any crushing event with tubes of this type, the first
energy absorption mode would be elastic deformation and then once the material has exceeded the
critical compressive failure loads crushing would occur. Now we have to be careful about these two
failure modes. It is very possible that if the D/t ratio is very large then the buckling would occur
before crushing. In that case the energy absorption would be elastic, then buckling and bending.
Page 94
84
Conclusions
We have presented here the crush of a glass-epoxy composite tube failure under compressive load.
The effect of the initial impact energy has been studied in detail. The initial impact energy has a
profound effect on the crush failure energy absorption mode. For the tubes used in this study, the
energy absorption at low impact energies is mainly due to the elastic strain energy. This has been
confirmed by the elastic spring back study. Finally, for all tubes, the buckling load was higher than
the crush load it can be concluded that the energy absorption was due to compressive crushing.
References
1. Jacob, George C., 2002: "Energy Absorption in Polymer Composites for Automotive
Crashworthiness Journal of Composite Materials," 36:813-850.
2. Reddy, J.N., 1996: Mechanics of Laminated Composite Plates: Theory and Analysis. CRC Press,
Boca Raton, FL.
3. Farley, Greg L. and Robert M. Jones, 1992: "Crushing Characteristics of Continuous Fiber
Reinforced Composite Tubes," Journal of Composite Materials, 26: 37-50.
4. Farley, Greg L., 1991 : "The Effects of Crushing Speed on the Energy Absorption Capability of
Composite Tubes," Journal of Engineering Materials and Technology, 25: 1314-1329.
5. Gupta, Kajal K., 2000: Finite Element Multidisciplinary Analysis. American Institute of
Aeronautics and Astronautics, Inc., Reston, VA.
Page 95
85
6. Sigalas, J and M. Kumosa, 1991 : "Trigger Mechanism in Energy Absorbing Glass Cloth/Epoxy
Tubes," Composites Science and Technology, 40: 265-287.
7. Hamada, H and S. Ramakrishna, 1997: "EEM Method for Prediction of Energy Absorption
Capability of Crashworthy Polymer Composite Materials," Journal of Reinforced Plastics and
Composites, 16: 226-242.
8. Livermore Software Corporation, 2003: LSDYNA Kevword User's Manual. Livermore Software
Technology Corporation.
9. Pickett, Leon and Vinay Dayal, 2006: "Finite Element Model of a Dynamic Composite Crush
Event," Chapter 2 of this thesis.
10. Farley, Greg L, 1983: "Energy Absorption of Composite Materials," Journal of Composite
Materials, 17: 267-279.
11. Thornton, P.H. and P.J. Edwards, 1982: "Energy Absorption in Composite Tubes," Journal of
Composite Materials, 16: 521-545.
12. Thornton, P.H., 1990: "The Crush Behavior of Pultruded Tubes at High Strain Rate," Journal of
Composite Materials, 24: 594-615.
13. Schmuesser, D.W. and L.E. Wickliffe, 1987: "Impact Energy Absorption of Continuous Fiber
Composite Tubes," Journal of Engineering Materials and Technology, 109: 72-77.
Page 96
86
14. Tatting, Brian, 1998: "Analysis and Design of Variable Stiffness Composite Cylinders," PhD
Thesis, Virginia Polytechnic Institute and State University.
Page 97
87
CHAPTER 5: THE EFECT OF TUBE GEOMETRY ON ENERGY
ABSORPTION OF A CIRCULAR GLASS/EPOXY CRUSH TUBE
Abstract
In experimental testing, composite crush structures have been found to experience decreasing
energy absorption capability as the diameter to thickness ratio of the tube increases. Geometry, along
with impact velocity and fiber stacking sequence, play important roles in influencing the overall
specific energy absorption in a composite crush event. Because of the cost associated with
experimental destructive testing, numerical alternatives have been investigated. This research
attempts to investigate the feasibility of constructing a numerical methodology to determine the
energy absorption capability of a composite crush tube, where the ultimate goal is to construct a
predicative methodology based upon the validation of the engineering mechanics governing the
dynamic response of composite crush tubes. The effect of the tube geometry on the specific energy
absorption in a glass/epoxy composite tube has been studied here.
Introduction
As composite research and technology continues to grow, so does their use in an increasing
number of applications. Composites have several advantages over traditional materials. Primarily,
they are lighter and relatively stronger than many of the traditional metals that they replace. This
affords engineers the opportunity to make much stronger and safer products. There are quite a few
different types of materials that are classified as composites; however, for the purposes of this
research, the term composites will be used to describe long fiber-reinforced composites with an epoxy
matrix. As it pertains to the analysis of composites, their material behavior differs greatly from
isotropic materials. Among the industries that have seen far reaching successful integration of
Page 98
composites is the aerospace industry. Within the aerospace industry, the use of composites have led to
the significant reduction of component parts and decreased weight. In the auto industry, however, the
primary use of composites has been semi-structural or decorative parts; primarily, hood, decklids,
doors and bumpers. Based largely in part to the overwhelming success of composite use in the
aerospace industry, automotive composites are seeing increasing use as load bearing structural
members. This increased use of composites in many new applications is due largely to composite
energy absorption.
In passenger vehicles the ability to absorb impact energy and be survivable for the occupants
is called the "crashworthiness" of the structure. Current legislation for automobiles requires that
vehicles be designed such that, in the event of an impact at speeds up to 15.5m/s (35mph), the
occupants of the passenger compartment should not experience a resulting force that produces a net
deceleration greater than 20g. Use of composite materials in the aerospace industry is also facilitating
the crashworthiness requirements [1], Compared to most popular isotropic metals, composites have a
much higher specific energy absorption capacity; meaning that they absorb more crush energy per
unit mass. Metals, when subject to a compressive load, experience a buckling crush mode. This is
primarily due to the high degree of plasticity exhibited. Predictable progressive folding, stable post
crushing integrity and virtually unchanged material properties characterize this isotropic crushing
mode. The resulting specific energy absorption is noticeably lower than that exhibited by high
performance structural composites.
In regards to the particulars of composite material energy absorption, their energy absorption
mechanisms have only recently become well known. Farley [2] has theorized that there are three main
crushing initiators involved in most crush events and the fourth is a hybrid crushing initiator. This 4th
initiator or brittle fracturing is the primary means which long fiber structural composites absorb
energy. This mode is characterized by the formation of lamina bundles of moderate length during
impact. As a result, composite energy absorption is due to fracture, friction and bending of the fiber
Page 99
bundles. Analytically, composite laminate plate theory (CLPT) has provided a great deal of insight
into characterizing the static behavior of composite laminates. Particularly, classical laminate plate
theory has been very useful in the study of transverse particle impact damage and damage from
various combinations of static loading [3].
The bulk of the research in this area has been experimental work, which has been quite
successful at evaluating the sustained specific energy absorption in composite crush tubes. Crush
tubes, due to their high moment of inertia, do not fail in buckling but absorb the impact load in the
crushing mode. Using these tubes, it has been experimentally quantified [4] that graphite/epoxy
composites absorb more energy per unit mass than both 6160 aluminum and mild steel. This is
primarily due to the extremely high strength or modulus (not both) exhibited in the fibers.
Additionally, it is of some importance that extensive experimental research has borne out some very
useful relationships regarding the effects of fiber properties, stacking sequences, impact velocity and
tube geometry. Most of the literature generally revealed that the tube dimensions influence the crush
zone fracture mechanisms. Specifically it is suggested that by changing the tube dimensions, the
crush mechanisms can be controlled [5], This would imply that tube dimensions play a significant
role in specific energy absorption. It has been experimentally determined by Farley [6] that tube
geometry has an effect on energy absorption of both graphite/epoxy and Kevlar/epoxy tubes.
Specifically it has been documented that as the diameter to tube-thickness-ratio increases, a decrease
in energy absorption is experienced in both graphite/epoxy and Kevlar tubes. This is primarily due to
an increase in the formation of interlaminar cracking. It remains to be seen if a similar response is
present in glass/epoxy tubes.
For the purposes of gaining a better general understanding of how composites absorb energy
and characterizing the ability of composites to absorb energy, experimental research has been very
useful. However, at the same time, these research endeavors require notable capital expenditures due
to a variety of reasons. Composites are anisotropic and changes in stacking sequence influence
Page 100
90
macroscopic material properties; these infinite configurations lead to an infinite number of unique
energy absorption profiles. This is compounded by the fact that there are several combinations of
unique fiber and matrix materials that can be combined to form a unique composite with unique
material properties. A numerical solution to this problem would greatly reduce the cost of traditional
experimental endeavors. The success of the preceding experimental trials may lead to the next steps
of creating and proving a predictive methodology for this type of energy absorption.
It is important to note that the analytical study and design of composite materials requires
knowledge of anisotropic elasticity, structural theories and failure/damage criteria. Unlike isotropic
materials, anisotropic materials exhibit complicated mechanical behavior. Upon closer investigation
of the expected behavior, it has been observed that during axial compression of composite tubes both
interlaminar and intralaminar cracking play an integral role in the energy absorption process. These
cracks, in turn, cause the formation of lamina bundles which may fracture or bend, depending on the
application of the loading experienced by each bundle. In regards to commercially available finite
element analysis software packages, there are none that incorporate these fracture mechanics into
composite laminate plate elements.
The use of numerical methods facilitates the solution of composite behavior, and failure
mechanics equations for problems of practical importance. The finite element method (FEM) is the
most effective and industry accepted method for the solution of structural analysis [7], There have
been some noteworthy efforts in the attempt to use finite element analysis codes to arrive at a
predictive methodology to determine the energy absorption in composite crush tubes [8, 9], Although
the need for the development for a complete finite element model to predict composite energy
absorption has been widely researched and widely accepted, it is unknown as to how much energy
absorption is associated with each constituent failure event. This paper is one in a series of papers that
attempts to approximate the energy absorption using CLPT and existing finite element method
capabilities. In an attempt to ultimately arrive at a predictive methodology to determine the sustained
Page 101
91
specific energy absorption in a glass/epoxy thin walled composite tube, the dynamic finite element
analysis tool, LS-DYNA was used.
Methodology
Finite Element Model
The numerical solution was obtained using LS-DYNA software suite. This software is chosen
because of its availability, acceptance by the industry and convenience of use. The main solution
methodology is based on explicit time integration. An implicit solver is currently available with
somewhat limited capabilities including structural analysis [10]. The material model used by LS
DYNA is based on composite laminate plate theory. It allows for the "stacking" of several "layers" of
plies with arbitrary ply orientations. Each ply is permitted its own response by use of its own
integration point. Within this model, the primary means of energy absorption occurs as a result of
matrix failure, fiber failure and laminate delamination. It is important to note that although this theory
has been extremely accurate within the static realm, Farley theorized that there are distinct differences
in the failure mechanics when compared to the dynamic and realm. Most notably, he states that in
addition to energy absorption via the failure modes of CLPT, in a dynamic crush event energy is also
absorption via fiber and matrix fracture, bundle friction, interlaminar crack formation and
intralaminar crack formation.
The immediate objective of this research is to study the effect of the tube size on the energy
absorption under a compressive load. The model of the tube is approximated by small elements. The
size of the elements dictates the accuracy and stability of the solution process. The results presented
here are for a tube divided into 4480 elements. For the details of arriving at this number interested
reader is referred to [11].
Page 102
92
Materials
Graphite/epoxy long fiber structural composite tubes absorb more energy per unit mass than
other structural long fiber composite. The high cost of graphite fibers dictates that E-glass fibers may
prove to be a reasonable and affordable alternative. It is for this reason that E-glass fibers were
selected in this work. The matrix material used in this study was epoxy resin. Epoxy resin is one of
the most common thermoset polymer matrix materials. Epoxies are relatively inexpensive and have
better moisture resistance and lower shrinkage on curing. Maximum use temperatures of epoxies are
in the vicinity of 175°C. The resulting composite employs a fiber volume fraction of 62%. This is
consistent with the make up of a typical E-glass/epoxy composite used experimentally [12].
Tube Dimensions
The tube dimensions were chosen to be fairly comparable to existing experimental data;
while also chosen to span a reasonable spectrum of values. The tubes were nominally 4"in length;
V/2", 2'/4" and 3" in mean diameter and 3, 6, 9 or 12 plies thick. Each ply was of 0.0125" nominal
thickness. Depending on the geometry of the tube in question, the diameter to thickness ratio varied
from a minimum value of 3.71 to a maximum value of 59.41 (Table 5-1). Each finite element
modeled tube had a simulated chamfer to help initiate a stable crush. Within the finite element model,
the simulated chamfer consisted of a uniform thickness, step-wise, decreasing plate element in
contrast to the actual variable thickness cross-sectional geometry of a "real" chamfer. These slight
modifications were successful in avoiding numerical instabilities within the finite element analysis.
Each tube contained 3n plies, with a stacking sequence of [0°/±45o]nT, where n=l, 2, 3 or 4.
Page 103
93
Impact Characteristics
The actual crush event was simulated by a translating rigid body of 3 slugs moving at an
initial impact velocity of 25 ft/s. This is consistent with the comparable experimental results.
Number of Plies Mean Radius Specimen Name (no dim) (inches) D/t Ratio (no dim)
2t_2r 6 0.75000 14.85149
2t„3r 6 1.12500 22.27723 2t_4r 6 1.50000 29.70297 3t_1r 9 0.37500 4.95050
3t„2r 9 0.75000 9.90099
3t„3r 9 1.12500 14.85149 3t_4r 9 1.50000 19.80198
4t„1r 12 0.37500 3.71287 4t_2r 12 0.75000 7.42574 4t_3r 12 1.12500 11.13861
4t 4r 12 1.50000 14.85149
Table 5-1: Specimen summary
Post-Processing
Once input into LS-DYNA, the program is able to generate a wealth of structural output data.
The data was then evaluated using both the graphical user interface and individual data points. Of
primary interest was the total axial deflection of each composite crush simulation as well as an
individual element analysis to evaluate the effect on the material model verses specific energy
absorption.
Computation of Energy Absorption
The specific energy absorption in equation 5-1 is directly evaluated based upon the post crush peak
axial displacement, such that
Page 104
94
*>-•%
where £/ is the net impact kinetic energy, p is the material density and V is the volume of material
displaced during and axial tube crush.
Results and Discussion
Preliminary evaluation of the performance of the LS-DYNA program was favorable and the
numerical algorithms of the numerical solution executed as expected. There were no numerical
instabilities or other problems. Generally, it was observed that as cross-sectional area increased, the
energy absorption increased and the crush deflection decreased; however, this was not entirely
universal. These preliminary observations were promising precursors to the evaluation of the effect of
diameter, the effect of number of plies, D/t ratio and geometric scalability.
Page 105
95
Preliminaries
160.00
140.00
120.00
100.00
B 80.00
60.00
40.00
20.00
0.00
O.OE+OO 1.OE-O1 2.0E-01 3.0E-01 4.0E-01 5.0E-01 6.0E-01 7.0E-01 8.0E-01 9.0E-01
Crush Volume, inches
Figure 5-1: Specific energy absorption as a function of total tube volume crushed
Equation 5-1, suggests that geometry will have an effect on energy absorption in a composite
crush tube. Since both the impact energy and tube density is held constant, the energy absorption
should decrease linearly with crush volume. Figure 5-1 shows the variation of energy absorption as a
function of the crush volume and the almost linear decrease is observed. This deviation from the
linear can be explained by the onset of buckling in such tubes.
Critical Buckling Load
Pickett and Dayal [13] have demonstrated the distinct classes of composites energy
absorption modes. Buckling occurs when an axial load is applied on the composite tube. For a
composite tube, the critical buckling load per unit length is given as
Page 106
96
ft D\\ +2p1n2(D i2+2Dbt)+"* P2.
P'r2 +
P2Eeh ^ \
5-2
where /? is the axial frequency, Dn is the bending stiffness in the axial direction, n is the
circumferential full wave number, Dl2 is the bending stiffness in the axial-radial plane, D66 is the
bending stiffness in the normal direction, D22 is the bending stiffness in the radial direction, r is the
radius of the cylinder, Eg is the effective radial stiffness of the composite layers, t is the total shell
thickness, Gxe is the effective shear modulus of the composite layers, v,M is the effective Poisson's
ratio in the axial-radial plane, and Ex is the effective axial stiffness of the composite layers [14].
The critical buckling load is strongly influenced by tube diameter, radius and length. Figure
5-2 shows the variation of the critical buckling load with an increase in the D/t ratio. For tubes of
varying geometries, the critical buckling load decreases as the diameter to thickness ratio increases
and asymptotically approaches a steady state value. The lower the D/t ratio of the column, the greater
is its ability to resist an axial force. Additionally it is noteworthy to point out that tubes of similar D/t
ratios have nearly identical theoretical critical buckling loads. This variation in buckling load may in
turn influence the energy absorption capacity in a composite tube. When the D/t ratio is small,
buckling will not occur and energy absorption will take place mainly due to the elastic energy
absorption and the compressive crush. As the D/t ratio increases the crush will be preceded by
buckling. The crushing will not take place and the failure will be due to the tension and compressive
failure of the tube when it bends in the plane of the wall, due to buckling. In a circular tube, the
buckling takes place in such a manner that the sine waves of wall bending are produced. In a bent
section the main energy absorption will take place at the fold. The areas above and below the fold will
bend and not crush. It is not difficult to see that this folding failure energy would take place over
much less material of the tube and hence the amount of energy absorbed will be reduced.
Page 107
97
4.50E+04
X
3.50E+04
x *-
• 3 Plies
me Plies
9 Plies
X12 Plies
1.00E+04
5.00E+03 -
O.OOE+OO -i 1 1 1 1 1 1 i
0 10 20 30 40 50 60 70
D/t ratio (no dimensions)
Figure 5-2: Theoretical critical buckling load as a function of D/t ratio
Effect of Tube Radius
Presented in figure5-3 is the variation in crush height as the radius of the tube is changed
from 0.4 inch to 1.5 inch. The three curves are plotted for three different ply numbers. It was
observed that the trendlines for 6, 9 and 12 ply tubes displayed a nonlinear inverse relationship as
radius increased.
Page 108
98
3.00
2.50
2.00
1.00
" *
6 Plies
9 Plies
12 Plies
0.50
0.00 , , • 1 ! 1 : i
0.00 0.20 0.40 0.60 0.80 1.00 1.20 1.40 1.60
Radius, in
Figure 5-3: Crush height as a function of tube radius for different thickness tubes.
As the number of plies increase, the tube thickness increases and the crush height decreases. It is also
expected that the crush height will decrease as the radius increases. This is attributed to the increase
in materia] mass as the cross-sectional area increases. Buckling theory of elastic hollow tubes
suggests that as the mean diameter increases, the crush height decreases. This is due to the increase in
the column's ability to resist an axial load.
Figure 5-4 shows the variation of the specific energy absorbed as a function of the radius. The
6 and 9 ply tubes show a maxima and then decrease. The 12 ply tube curve keeps increasing but our
conjecture is that if the radius is increased further this curve will also reach a maxima and then
decrease. The reason for this is next discussed.
Page 109
99
140
100
o 80
c 60
40
0.00 0.20 0.40 0.60 0.80
Radius, in
—6 Plies
9 Plies
12 Plies
1.00 1.20 1.40 1.60
Figure 5-4: Energy absorption as a function of tube radius.
We base our observations on the following. Revisiting buckling theory, we see that
NCr =—r + C2 r
5-3
where C, and C2 are unique constants. This suggests that as the radius increases, the critical buckling
load asymptotically approaches C2 or:
NCr ~ "
fa % + n 4 Eg
5-4
Furthermore, as radius increases, the cross-sectional area increase is governed by a linear relationship,
A = 2m 5-5
In short, it is expected that energy absorption increases as tube radius increases. However,
this relationship is not linear. In fact, these equations suggest the existence of three distinct energy
Page 110
100
absorption regions. First, the initial elastic deformation region, second, the compressive crushing, and
finally the failure associated with buckling. The order of the compressive crush and buckling will
exchange depending on the tube radius and thickness.
Effect of Number of Plies
Based on buckling theory, as thickness increases, D/t reduces and the buckling load increases.
As a result, energy absorption changes considerably as the number of layers increases. Figure 5-5
shows the relation between crush height and the number of plies for fixed diameter tubes. Most
interesting is the individual behavior of each trendline as we add plies. Evaluating the influence of
increasing radius (holding R constant), on crush height, an inverse relationship is observed. It
suggests an asymptote relationship between crush height and number of plies such that the asymptote
value of each trendline results in a non-zero minimum height.
Page 111
101
4 6 8 10
Number of Lamina Plies, no dim
IB- 3/4 inch
9/8 inch
> 3/2 inch
Figure 5-5: Crush height as a function of tube thickness
Figure 5-6 presents the relation between energy absorption and number of plies.
Page 112
102
160
140
120
• 3/8 inch
—Wr~ 3/4 inch
9/8 inch
3/2 inch
o 4 , , , , , ,
0 2 4 6 8 10 12 14
Number of Plies, no dim
Figure 5-6: Energy absorption as a function of tube thickness
Each trendline clearly exhibits a peak value at unique locations in their respective trendline.
For example with increase in the number of plies in a 3/2 radius tube (4th trendline), the maximum
energy absorption occurs when there are 12 plies; or the 4th data point. For a 9/8-inch tube (3rd
trendline) the maximum energy value occurs with 9 plies (3rd data point). A subtle, yet distinct pattern
emerges. Each of these tubes have the same D/t ratios such that
V" y/" ?" —— = = — = 14.85m/m 5-6
3 plies 6 plies 9 plies 12 plies
We will now further investigate the effect of the ratio of mean tube diameter to tube wall thickness,
D/t.
Page 113
D/t Ratio
It has already been shown in Fig. 5-2 that lower D/t results in higher critical buckling load.
Farley reports [6] that for both graphite/epoxy and Kevlar/epoxy tubes, a reduction in tube D/t results
in an increase in energy absorption and ultimately an increase in sustained crushing load. He
attributes the increase to a reduction in interlaminar cracking in the crushed region of the tube. As the
length and number of interlaminar cracks decreases, the buckling load of the associated lamina
bundles increases. Although Farley's study was limited to the performance of graphite/epoxy and
Kevlar/epoxy tubes, it is anticipated that glass/epoxy tubes will be influenced by D/t ratio in a manner
very similar to graphite/epoxy tubes. This assumption is primarily based on the findings of
Schmuesser and Wickliffe [15]. It has been experimentally determined that a decrease in the density
of a fiber causes an increase in the specific energy absorption. Comparing the densities of glass (sp.
gr. 2.5-2.6) relative to graphite (sp. gr. 1.8), we clearly see that graphite has a lower density [16].
Furthermore, glass fiber, (3.5-4.5%) have higher strain to failure, as compared to graphite fibers (0.5-
2.4%). However, the elastic modulus of glass (73-87 GPa) being lower than graphite (276-380 GPa)
the total energy absorbed by the elastic part of the graphite will be higher than for the glass.
Page 114
140 -
120 -
60
40
104
15 20 25
D/t ratio, no dim
30
Figure 5-7: Energy absorption as a function of D/t ratio
Figure 5-7 depicts the variation of the specific energy absorption as a function of the D/t
ratio. Unlike Farley's work for graphite/epoxy [6] a distinct peak in strain energy absorbed is
observed at 14.85 for glass/epoxy tubes. For lower D/t the energy absorption reduces. This can be
attributed to the lower elastic strain energy of the glass fibers as compared to the graphite fibers as
discussed in the previous paragraph. When the D/t is lower, the major energy absorption mechanism
is elastic strain energy and this difference results in the reduction in the absorbed energy unlike
Farley's results which are for graphite/epoxy composites.
Page 115
105
Geometric Scalability
Figure 5-8 shows the effect of the number of plies on the specific energy absorption while the
D/t ratio is kept constant. This leads to the study of the geometric scalability question for glass/epoxy
tubes.
140
120
100
80
60
40
20
: 4 6 8 10
Number of Plies, no dim
Figure 5-8: Energy absorption among tubes of identical D/t ratios
Farley's experiments suggest that energy absorption results of graphite/epoxy tubes are not readily
geometrically scalable [6]. He found that graphite/epoxy tubes of identical D/t ratio do not exhibit
identical energy absorption values or characteristics. He suspected that the lack of scalability is
partially due to a local instability mode reducing the buckling load of the lamina bundles. For a D/t
ratio of 14.85 where the peak specific energy was observed, data is plotted in figure 5-8. Each data
point is associated with unique energy absorption characteristics and they do not exhibit a linear
Page 116
106
relationship. Farley had also observed a similar relationship for graphite/epoxy tubes. Thus it is clear
that this numerical solution shows that the behavior exhibited by the glass/epoxy is not geometrically
scalable. Moreover, both the experimental and numerical data suggests that for identical D/t ratios, as
D increases, the energy absorption capability also increases.
Based upon the implication that similar D/t ratios have essentially the same theoretical critical
buckling load, it should be expected that they should not be geometrically scalable. This is due to the
fact that although each tube has the same critical buckling and D/t proportions, their radii are unique.
As a result, as both tube diameter and tube thickness increase proportionally, the cross-sectional area
increase is of course governed by equation 5-5. As a result each tube of increasing diameter and
thickness also has considerably more material volume to resist the critical buckling load. Therefore it
should be expected that as both diameter and thickness increase at the same rate, their energy
absorption is likely to increase (depending of course on the energy absorption region the tube is
instantaneously undergoing). Thus, tubes of identical D/t ratio should not be expected to be scalable.
Conclusions
We have addressed the question of the effect of the geometry on the specific energy
absorption in glass/epoxy composite tubes. The main conclusions of this work are as follows. The
specific energy absorption is a function of the tube radius and the results show that the absorption
reaches a peak and subsequently drops off. This phenomenon can be attributed to the combination of
crushing failure and the onset of in-plane buckling of the tube wall when the radius becomes large.
Number of plies or the wall thickness increase shows a unique peak for various diameters and as the
diameter increases the energy absorption increases. Thus we see the relationship of both the diameter
and the thickness and hence we have next studied the effect of the D/t ratio on the specific energy
absorption. It was observed that the specific energy absorption peaked at a value of 14.85. Above this
value the energy absorption dropped. This could be attributed to the lowering of the critical buckling
Page 117
107
load as the D/t increases. On the other hand, when the D/t reduces the elastic deformation dominates
and then the energy absorption again reduces. This has been seen to be true from the elastic bounce
back study in chapter 4.
References
1. Jacob, George C., 2002: "Energy Absorption in Polymer Composites for Automotive
Crashworthiness" Journal of Composite Materials, 36:813-850.
2. Reddy, J.N., 1996: Mechanics of Laminated Composite Plates: Theory and Analysis, CRC Press,
Boca Raton, FL.
3. Herakovich, Carl T., 1998: Mechanics of Fibrous Composites. John Wiley and Sons, Inc., New
York.
4. Thornton, P H., 1979: "Energy Absorption of Composite Structures," Journal of Composite
Materials, 13: 247-262.
5. Ramakrishna, S and H. Hamada, 1998: "Energy Absorption Characteristic of Crashworthy
Structural Composite Materials," Key Engineering Materials, 141-143: 585-620.
6. Farley, Greg L., 1986: "Effect of Specimen Geometry on the Energy Absorption Capability of
Composite Materials," Journal of Composite Materials, 20: 390-400.
7. Gupta, Kajal K., 2000: Finite Element Multidisciplinary Analysis, American Institute of
Aeronautics and Astronautics, Inc., Reston, VA.
Page 118
108
8. Sigalas, J and M. Kumosa, 1991: "Trigger Mecahnism in Energy Absorbing Glass Cloth/Epoxy
Tubes," Composites Science and Technology, 40: 265-287.
9. Hamada, H and S. Ramakrishna, 1997: "FEM Method for Prediction of Energy Absorption
Capability of Crashworthy Polymer Composite Materials," Journal of Reinforced Plastics and
Composites, 16: 226-242.
10. Livermore Software Corporation, 2003: LS-DYNA Keyword User's Manual. Livermore Software
Technology Corporation.
11. Pickett, Leon and Vinay Dayal, 2006: "Finite Element Model of a Dynamic Composite Crush
Event," Chapter 2 this thesis.
12. Farley, Greg L., 1983: "Energy Absorption of Composite Materials," Journal of Composite
Materials, 17: 267-279.
13. Pickett, Leon and Vinay Dayal, 2006: "The Effect of Impact Velocity on Energy Absorption of a
Circular Glass/Epoxy Crush Tube," Chapter 4 this thesis.
14. Tatting, Brian, 1998: Analysis and Design of Variable Stiffness Composite Cylinders," PhD
Thesis, Virginia Polytechnic Institute and State University.
15. Schmuesser, D.W. and L.E. Wickliffe, 1987: Impact Energy Absorption of Continuous Fiber
Composite Tubes," Journal of Engineering Materials and Technology, 109: 72-77.
Page 119
109
16. Farley, Greg L., 1986: "Effect of Fiber and Matrix Maximum Strain on the Energy Absorption
a Composite Material," 20: 322-334.
Page 120
110
CHAPTER 6: GENERAL CONCLUSIONS AND FUTURE WORK
In order to establish a sound numerical methodology it was first important to verify the
mechanics involved in a dynamic crush event. Experimental research has revealed the mechanics of
how long fiber composite tubes crush in a dynamic event. However, the analytical methods that are
currently used to solve composite crushing do not fully account for all the physical characteristics of
true crushing. Thus it was necessary to build an analytical model that could more accurately reflect
dynamic composite crushing mechanics. The most likely start was to build upon the mechanics that
have laid a firm foundation for the analytical methods currently used. Beginning with this premise,
this study has begun to build a new predictive methodology based upon composite laminated plate
theory.
In chapter 2, a finite element methodology was developed. It was demonstrated that the effect
of the number of elements is very significant in the convergence of the solution. The solution
convergence time is essentially linear with the increase in the number of elements. Based upon this
numerical study, it has been found that for the basic geometry of this composite crush analysis, 4480
elements are sufficient in achieving a steady-state solution irrespective of stacking sequence. This
corresponds to a maximum aspect ratio of 4.7 and a maximum element size of 5.89 e "inches by
7.85e"2inches or 4.62e"3 inches2.
Having a methodology in place, the validity of the underlying mechanics was then evaluated.
In chapter 3 a study of the effect of fiber stacking sequence on the specific energy response has
shown that for glass/epoxy tubes, there is some correlation between numerical results presented here
and experimental results presented elsewhere. Particularly it has been noted in this study that beyond
an angle of 45°, a very good correlation is observed between the experimental and numerical results.
It has been established that the response of the cylinder is not only dependent on the axial and lateral
stiffness, but also on the shear stiffness and strength, which are maximum at an angle of 45°. The
Page 121
I l l
discrepancy between the experimental and numerical results below 45° angle samples can be
attributed to the viscoelastic behavior of the epoxy. It is theorized that incorporating the viscoelastic
behavior into the finite element model with lead to better correlation. Further work in this area has to
be done to better understand and quantify this phenomenon.
It has also been experimentally determined that impact velocity is an important factor
influencing the energy absorption. The numerical study in chapter 4 also supports the experimental
finding that there is indeed a threshold value which characterized two distinctly different energy
absorption regions. The first region, corresponding to low impact energies, features a significant
amount of strain energy crushing. The second region experiences crushing failure due to high impact
energy. This is analogous to the experimental findings which suggest the existence of a velocity
threshold. Furthermore, this work conclusively illustrates that impact energy is a far more reliable
driver for energy absorption than impact velocity. Thus, for the tubes used in this study the energy
absorption at low velocities is mainly due to the elastic strain energy. This has been confirmed by the
elastic spring back study. Finally, for all tubes, the buckling load was higher than the crush load;
therefore, it can be concluded that the energy absorption was due to compressive crushing.
In chapter 5, this numerical study has also addressed the question of the effect of the
geometry on the specific energy absorption in glass/epoxy composite tubes. The specific energy
absorption is a function of the tube radius and the results show that the absorption reaches a peak and
subsequently drops off. This phenomenon can be attributed to the combination of crushing failure and
the onset of in-plane buckling of the tube wall when the radius becomes large. Number of plies or the
wall thickness increase shows a unique peak for various diameters and as the diameter increases the
energy absorption increases. It was observed that the specific energy absorption peaked at a D/t value
of 14.85. As D/t ratio decreased or increased, the energy absorption values dropped. It is noteworthy
to point out that this phenomenon was not witnessed in the experimental data. This could be attributed
to the lowering of the critical buckling load as the D/t increases. On the other hand, when the D/t
Page 122
112
reduces the elastic deformation dominates and then the energy absorption again reduces. This has
been seen to be true from the elastic bounce back study in chapter 4. It is therefore clear that there is
some noticeable disagreement between the numerical and experimental data. However, the
fundamental mechanics are clear. Critical buckling load should vary as tube geometry specifically the
D/t ratio varies. This suggests that, it is plausible to distinctly see up to three crushing regions: strain
energy, brittle fracturing and buckling. This did not occur in the experimental study, most likely due
to the impact energy values at which the tubes were crushed. Thus it is inconclusive if the numerical
and experimental data sets are indeed at odds. Further experimental to numerical correlation is
warranted.
Thus this numerical study was able to capture the fundamental behavioral response of
glass/epoxy composite tubes subject to changes in fiber stacking sequence, impact energy and tube
geometry. However it is notable that an absolute and universal relationship linking the numerical and
experimental results was not established. This is primarily due to the absence of additional key
principles that need to be incorporated into the numerical model. Thus although a firm foundation
has been established, this endeavor is not yet complete.
The implications of this work are many. In its current state, this work can be extremely useful
in aiding experimental research. By using these codes in their current incarnation, one can better
refine the range of fiber stacking sequence, impact energy and tube geometry to investigate
experimentally. Ultimately this work will proved the basis for creating a holistic methodology for
numerically predicting energy absorption in composite crush tubes irrespective of fiber stacking
sequence, impact energy or tube geometry.
Page 123
113
APPENDIX
ANSYS Preprocessor Input Deck
/PREP7 ET,1,SHELLS3 K , 3 , 0 , 0 , 4 . 0 / 1 2 K,4,0,0,5.5/12 K,21,0,0.75/12,3.9875/12 K,22,0,0.75/12,4.0/12 K,23,0,0.75/12,3.975/12 K , 2 4 , 0 , 0 . 7 5 / 1 2 , 3 . 9 8 7 5 / 1 2 K, 25,0,0.75/12,3.962 5/12 K, 26,0,0.75/12,3.975/12 K, 27,0,0.75/12,3.95/12 K,28,0,0.75/12,3.9625/12 K , 2 9 , 0 , 0 . 7 5 / 1 2 , 3 . 9 3 7 5 / 1 2 K,30,0,0.75/12,3.95/12 K, 31,0,0.75/12,3.925/12 K , 3 2 , 0 , 0 . 7 5 / 1 2 , 3 . 9 3 7 5 / 1 2 LSTR, 21, 22 LSTR, 23, 24 LSTR, 25, 26 LSTR, 27, 28 LSTR, 29, 30 LSTR, 31, 32 LSTR, 3, 4 FLST,2,1,4,ORDE,1 FITEM,2,6 FLST,8,2,3 FITEM,8,3 FITEM,8,4 AROTAT,P51X, , , , , ,P51X, ,360, , FLST,2,1,4,ORDE,1 FITEM,2,5 FLST,8,2,3 FITEM,8,3 FITEM,8,4 AROTAT,P5IX, , , , , ,P51X, ,360, , FLST,2,1,4,ORDE,1 FITEM,2,4 FLST,8,2,3 FITEM,8,3 FITEM,8,4 AROTAT,P51X, , , , , ,P51X, ,360, , FLST,2,1,4,ORDE,1 FITEM,2,3 FLST,8,2,3 FITEM,8,3 FITEM,8,4 AROTAT,P5IX, , , , , ,P51X, ,360, , FLST,2,1,4,ORDE,1 FITEM,2,2 FLST,8,2,3 FITEM,8,3 FITEM,8,4 AROTAT,P5IX, , , , , , P51X, ,360, , FLST,2,1,4,ORDE,1 FITEM,2,1 FLST,8,2,3 FITEM,8,3 FITEM,8,4 AROTAT,P51X, , , , , ,P51X, ,360, , K,51,0,0.75/12 K, 52,0,0.75/12,3.925/12 LSTR, 51, 52
Page 124
FLST,2,1,4,ORDE,1 FITEM,2,74 FLST,8,2,3 FITEM,8,3 FITEM,8,4 AROTAT,P51X, , , , , ,P51X, ,360 LESIZE,ALL, , ,20, ,1, , ,1, FLST,5,24,4,ORDE,24 FITEM,5,1 FITEM,5,2 FITEM,5,3 FITEM,5,4 FITEM,5,5 FITEM,5,6 FITEM,5,8 FITEM,5,9 FITEM,5,10 FITEM,5,19 FITEM,5,20 FITEM,5,21 FITEM,5,30 FITEM,5,31 FITEM,5,32 FITEM,5,41 FITEM,5,42 FITEM,5,43 FITEM,5,52 FITEM,5,53 FITEM,5,54 FITEM,5,63 FITEM,5,64 FITEM,5,65 CM,_Y,LINE LSEL, , , ,P51X CM, __Y1, LINE CMSEL,,_Y
LESIZE,_Y1, , ,1, , , , ,1 FLST,5,4,4,ORDE,4 FITEM,5,74 FITEM,5,75 FITEM,5,76 FITEM,5,77 CM, _Y, LINE LSEL, , , ,P51X CM, _Y1, LINE CMSEL, , _Y ! * LESIZE,_Y1, , ,50, , , , ,1 LLIST,ALL, , , AMESH,21,24,1 AMESH,17,20,1 AMESH,13,16,1 AMESH,9,12,1 AMESH,5,8, 1 AMESH,1,4, 1 AMESH,25,28,1 NLIST,ALL, , , , NODE,NODE,NODE elist,all,,,0,0 LLIST,ALL, , , NUMMRG,ALL, , , ,LOW NUMCMP,ALL NWRITE, '4480_6ply_n3q' , EWRITE, ' 44 80__6ply_e3q' , SAVE, HL44 80_6ply3q,db,
Page 125
115
Typical LS-DYNA Input Deck
*KEYWORD *TITLE 2 56 ELEMENTS 0+/-45 3/4 INCH CONSTRAINED TOP *NODE $NODE,X,Y,Z 9999,0.0,0.0,0.333334 9998,0,0,0 1,0.OOOOOE+OO,6.25000E-02,0.33229167
-6.25000E-02,0.00000E+00,0.33229167 -2.39177E-02,5.77425E-02,0.3 322 916 7 -4.41942E-02,4.41942E-02,0.33229167
.774 2 5E-02,2.39177E-02,0.33229167
9, 10 11
12 13 14 15 16 17 18
19 20 21
2 2 23 24 25 2 6 27 28 29 30 31 32 33 34 35 36 37 38 39 40 41 42 43 44 45 46 47 48 49 50 51 52 53 54 55 56 57 58
-5 . -6.25000E-02,0.OOOOOE+OO,O.33333333 0.00000E+00,6.25000E-02,0.33333333 -2.3 9177E-02,5.77425E-02,0.33333333 -4.41942E-02,4.41942E-02,0.33333333 - 5.77425E-G2,2.39177E-02,0.33333333 0.OOOOOE+OO,-6.25000E-02,0.33229167 -5.77425E-C2, - 2.39177E-02,0.33229167 -4.41942E-02,-4.41942E-02,0.33229167 -2.3 9177E-C2, - 5.77425E-02,0.33229167 0.OOOOOE+OO,-6.25000E-02,0.33333333 -5.77425E-02,-2.39177E-02,0.33333333 -4.41942E-02,-4.41942E- 02,0.33333333 -2.39177E-02,-5.77425E-02,0.33333333 6.250008-02,0.0 00 0 0E+0 0,0.33229167 3 9177E-02,-5.774 2 5E-02,0.3 322 916 7 41942E-02,-4.41942E-02,0.33229167 77425E-02,-2.3 9177E-02,0.33229167 25000E-02,0.00000E+00,0.33333 333
5.774 2 5E-02,0.33333333 4.41942E-02,0.33333333 2.3 9177E-02,0.33333333
77425E-02,2.39177E-02,0.3322 9167 41942E-02,4.41942E-02,0.33229167
5.77425E-02,0.3322 9167 2.3 9177E-02,0.33333333 4.41942E- 02,0.33333333 5.77425E-02,0.33333333 6.25000E-02,0.33125000
-6.250 0 0E-02,0.OOOOOE+OO,0.33125000 -2.3 9177E-02,5.77425E-02,0.3312 50 0 0
41942E-02,0.33125000 39177E-02,0.33125000
0.000 0 0E+0 0,-6.25000E-02,0.33125000 -5.77425E-02,-2.39177E-02,0.33125000 -4.41942E-02,-4.41942E-02,0.33125000 -2 .39177E-02,-5.774 2 5E-02,0.33125000 6.25000E-02,0.OOOOOE+OO,0.33125000 2.39177E-02,-5.774 2 5E-02,0.33125000 4.41942E-02,-4.41942E-02,0.33125000 5.7742 5E-02,-2.39177E-02,0.33125000 5.77425E-02,2.39177E-02,0.33125000 4.41942E-02,4.41942E-02,0.33125000 2.3 9177E-02,5.7 742 5E-02,0.33125000 0.00000E+00,6.25000E-02,0.33020833 -6.25000E-02,0.00000E+00,0.33020833 -2.39177E-02,5.77425E-02,0.33020833 -4.41942E-02,4.41942E-02,0.33 020833 -5.77425E-02,2.39177E-02,0.3 302 08 3 3 0.00000E+00,-6.25000E-02,0.33020833 -5.77425E-02,-2.3 9177E-02,0.33020833 -4.4194 2E-02,-4.41942E-02,0.33020833 -2.39177E-02, - 5.77425E-02,0.33020833 6.25000E-02,0.OOOOOE+OO,0.33020833
3 9177E-02, 41942E-02, 7 7425E-02,
3 9177E-02, 77425E-02, 4194 2E-02, 3 917 7E-02, OOOOOE+OO,
-4.41942E-02,4. -5.77425E-02,2.
Page 126
116
59 60 61 62
63 64 65 6 6
67 6 8
69 70 71 72 73 74 75 76 77 78 79 8 0
81 8 2 83 84 85 8 6 87 8 8
89 90 91 92 93 94 95 96 97 98 99 100
101
102 103 104 105 106 107 108 109 110 111 112
2.39177E-02, - 5 . 77425E-02,0 . 33020833 4.41942E-02,-4.41942E-02,0.33020833 5.7742 5E- 02,- 2.39177E-02,0.33020833 5.77425E-02,2.39177E-02,0.33020833 4.41942E-02,4 .41942E-02,0 . 33020833 2.3 9177E-02,5.77425E-02,0.33020833 0.OOOOOE+OO,6 -25000E-02,0.32916667 -6.25000E-02,0 . OOOOOE+OO,0.3 2 91666 7 -2.39177E-02,5.77425E-02,0.32916667 -4.41942E-02,4.41942E-02,0.32916667 -5.774 25E-02,2 .39177E-02,0 .32 916667 0.OOOOOE + OO,-6.25000E-02,0.32916667 -5.77425E-02,-2.39177E-02,0.32916667 -4.41942E-02, - 4.41942E-02,0.32916667 -2.39177E-02,-5.77425E-02,0.32916667 6.25000E-02,0.OOOOOE+OO,0.32916667 2.39177E-02, - 5.77425E-02,0.32916667 4.41942E-02,-4 .41942E-02,0 . 3 2 916 6 67 5.77425E-02,-2 .39177E-02,0.32 916667 5.77425E-02,2 .39177E-02,0 . 3 2 91666 7 4.41942E-02,4.41942E-02,0.32916667 2.3 917 7E-02,5.77425E-02,0 . 32916667 0.OOOOOE+OO,6 . 25000E-02,0.32812500 -6.25000E-02,0 .OOOOOE+OO,0.32812500 -2.39177E-02, 5.77425E-02,0 .32 812 500 -4.41942E-02,4.41942E-02,0.32812500 -5.77425E-02,2.39177E-02,0.32 812 50 0 0.OOOOOE+OO,-6.25000E-02,0.32 812 5 00 -5.77425E-02, -2.39177E-02,0 . 32812500 -4.41942E-02, -4.41942E-02,0 . 32812500 -2.39177E-02, -5.77425E-02,0 .32 812 500 6.25000E-02,0.OOOOOE+OO,0.32812500 2.39177E-02,-5.77425E-02,0 . 32 812 50 0 4.41942E-02,-4.41942E-02,0.32812500 5.774 25E-02,-2.39177E-02,0 . 32812500 5.77425E-02,2.39177E-02,0 .32812500 4.41942E-02,4.41942E-02,0 . 32 812 50 0 2.39177E-02,5.77425E-02,0.32812500 0.OOOOOE+OO,6.25000E-02,0.32708333 -6.25000E-02,0 . OOOOOE+OO,0 . 32708333 -2.39177E-02,5. 77425E-02,0.32 70 83 3 3 -4.41942E-02,4.41942E-02,0.32 708333 -5.77425E-02,2.39177E-02,0.32708333 0.OOOOOE+00,-6.25000E-02,0.32708333 -5.7 742 5E-02,-2.39177E-02,0.32708333 -4.4194 2E-02,-4.41942E-02,0.32708333 -2.39177E-02,-5.77425E- 02,0.32708333 6.2500OE-02,0.OOOOOE+OO,0 .32708333 2.39177E-02, -5.77425E-02,0 . 32708333 4.41942E-02, -4.41942E-02,0 .32708333 5.77425E-02,-2.39177E-02,0 .32708333 5.77425E-02,2.39177E-02,0.32 70 83 3 3 4.41942E-02,4.41942E-02,0 . 32708333 2.39177E-02,5.77425E-02,0.32708333
113 0 . OOOOOE+OO,6 25000E-02, 114 -6 .25000E-02, 115 -2 .3 9177E-02, 5 . 77425E-02, 116 -4 .41942E-02, 4 . 41942E-02, 117 - 5 .77425E-02, 2 .39177E-02, 118 -6 .25000E-02, 0 . OOOOOE+OO, 0 . 03270833 119 -6 .25000E-02, 0 .OOOOOE+OO, 0 . 06541667 120 -6 .25000E-02, 0 . OOOOOE+OO, 0 . 09812500 121 -6 . 25000E-02, 0 .OOOOOE+OO, 0 . 13083333 122 -6 .25000E-02, 0 . OOOOOE+OO, 0 . 16354167 123 -6 .25000E-02, 0 .OOOOOE+OO, 0 . 19625000 124 -6 .25000E-02, 0 . OOOOOE+OO, 0 .22895833 125 -6 .25000E-02, 0 . OOOOOE+OO, 0 .26166667 126 -6 -25000E-02, 0 . OOOOOE+OO, 0 .29437500 127 0 . OOOOOE+OO,6 .25000E-02,0 . 03270833
Page 127
128 123 130 131 132 133 134 135 136 137 138 139 140 141 142 143 144 145 146 147 148 149 150 151 152 153 154 155 156 157 158 159 160 161
162 163 164 165 166 167 168 169 170 171 172 173 174 175 176 177 178 179 180 181 182 183 184 185 186 187 188 189 190 191 192 193 194 195 196
117
O.OOOOOE+OO, 0 .OOOOOE+OO, 0 .OOOOOE+OO, 0 .OOOOOE+OO, O.OOOOOE+OO, O.OOOOOE+OO, .OOOOOE+OO, . OOOOOE+OO, -2.3 9177E-02 -2.3 917 7E-02 -2 .39177E-02 -2.39177E- 02 -2.3 9177E-02 -2.39Î77E-O2 -2.3 9177E- 02 -2.39177E-02 -2 .39177E-02 -4.41942E-02 -4.4194 2E-02 -4 .41942E-02 -4 .41942E-02 -4 .41942E-02 -4 . 41942E-02 -4.4Î942E-O2 -4.41942E-02
Ï . 41942E-02 5.77425E-02
- 5.77425E-02 -5.77425E-02 -5 . 77425E-02 -5 . 77425E-02 - 5.7742 5E-02 5.77425E-02
- 5.774 2 5E-02 - 5.77425E-02 O.OOOOOE+OO, -5 . 77425E-02 -4 . 41942E-02 -2 . 39177E-02 0.OOOOOE+OO, O.OOOOOE+OO, O.OOOOOE+OO, O.OOOOOE+OO, 0.OOOOOE+OO, O.OOOOOE+OO, 0.OOOOOE+OO,-
0.OOOOOE+OO,-0.OOOOOE+OO,-3.774 2 5E-02,
- 5.774 2 5E~ 02, -5.7742 5E-02, ).77425E-02,
-5.77425E-02, - 5.774 2 5E-02, ).77425E-02,
- 5.774 2 5E-02, - 5.7 7425E-02, -4.41942E-02, -4.41942E-02, -4.41942E-02, -4.41942E-02, t.41942E-02,
-4.41942E-02, -4.41942E-02,
: .41942E-02, : .41942E-02,
-2.3 9177E-02, - 2.3 9177E-02, -2.39177E-02,
25000E-02,0.06541667 25000E-02,0.09812500 25000E-02, 2 5 0 0 OE-02, 25000E-02,
13083333 16354167 19625000
25000E-02,0.22895833 25000E-02,0.26166667 25000E-02,0.29437500
03270833 06541667
09812500 13083333 16354167 19625000 22895833 26166667 29437500
. 09812500 , 13083333 .16354167 . 19625000
,5.77425E-02 ,5.77425E-02 ,5.7742 5E- 02,0.09812500 ,5.77425E-02,0.13083333 ,5.774 2 5E-02, 0.16 3 5416 7 ,5.77425E-02,0.19625000 ,5.77425E-02,0.22895833 ,5.77425E-02,0.26166667 ,5.77425E-02,0.29437500 ,4.41942E-02,0.032 70 833 ,4.41942E-02,0.06541667 ,4.41942E-02,0 ,4 . 41942E- 02,0. ,4 . 41942E-02,0. ,4.41942E- 02,0. ,4.41942E-02,0. ,4.41942E- 02,0. ,4.41942E-02,0. ,2.39177E-02,0.03270833 ,2 . 3 9177E-02,0.0 65416 67 ,2.3 9177E-02,0 ,2.39177E-02,0 ,2.39177E-02,0 ,2 . 39177E-02,0 ,2. 39177E-02,0.22895833 ,2 .3 9177E-02,0.26166 667 ,2 . 39177E-02,0.29437500 -6 . 2500OE-02, , -2.3 9177E- 02, ,-4.41942E-02, , - 5.7742 5E-02, -6.2500OE-02,0.03270833 -6.25000E-02,0.06541667 -6.25000E-02,0.09812500 -6 .25000E-02,0.13083333 -6 .25 0OOE-02,0.16 35416 7 -6 . 25000E-02,0.19625000 -6 .25000E-02,0.22895833 -6.2500OE-02,0.26166667 -6.2 500 0E-02,0.294 375 00 ,-2 . 3 9177E-02,0.0 32 7 083 3 ,-2.39177E-02,0.06541667 ,-2 .3 9177E-02,0.09812500 , -2 . 39177E-02,0.13083333 ,-2.39177E-02,0 ,-2.39177E-02,0 , -2.3 9177E-02,0.22895833 ,-2.39177E-02,0.26166667 ,-2 . 39177E-02,0.29437500 ,-4 . 41942E-02,0.03270833 ,-4 .41942E-02,0.06541667 ,-4.41942E-02,0 ,-4.41942E-02,0 ,-4.41942E-02,0 ,-4.41942E-02,0 -4.41942E-02,0 -4.41942E-02,0.26166667 -4.4194 2E-02,0.29437500 -5.7742 5E- 02,0.032 70833 - 5.7742 5E-02,0.0654166 7 -5 . 77425E-02,0.09812500
. 16354167
.19625000
.09812500 . 13083333 , 16354167 . 19625000 ,22895833
Page 128
118
197 -2.39177E-02 -5 . 77425E-02 0.13083333 198 -2.3 9177E- 02 - 5.774 25E-02, 0.16354167 199 -2.39177E-02 - 5.774 25E-02, 0 . 19625000 200 -2.39177E-02 - 5.774 2 5E- 02, 0.22895833 201 -2.39177E-02 -5.774 2 5E-02, 0.26166667 202 -2.3 9177E-02 - 5.774 2 5E- 02, 0.29437500 203 6 .25000E -02, 204 2 .39177E -02, 5.7742 5E-02, 205 4 .41942E -02, - 4.41942E-02, 206 5 .77425E -02, - 2.3 9177E-02, 207 6 .2 5 00 OE -02,0.OOOOOE+OO,0 03270833 208 6 .25000E -02,0.OOOOOE+OO,0. 06541667 209 6 .250 0 OE -02,0.OOOOOE+OO,0. 09812500 210 6 .25000E -02,0.OOOOOE+OO,0. 13083333 211 6 .25000E -02,0.OOOOOE+OO,0. 16354167 212 6 .2500 OE -02,0.OOOOOE+OO,0. 19625000 213 6 .25000E -02,0.OOOOOE+OO,0. 22895833 214 6 .25000E - 0 2 ,0.OOOOOE+OO,0. 26166667 215 6 .25000E - 0 2 , C .OOOOOE+OO,0. 29437500 216 2 .39177E -02, -5 . 77425E-02,0 .03270833 217 2 .39177E -02, -5.7 74 2 5E-02,0 . 06541667 218 2 .39177E -02, -5.77425E-02,0 .09812500 219 2 .39177E -02, 5.7 742 5E-02,0 . 13083333 220 2 .39177E -02, -5.77425E-02,0 .16354167 221 2 .3 9177E -02, -5.7742 5E-02,0 .19625000 222 2 .39177E -02, -5.774 2 5E-02,0 .22895833 223 2 .39177E -02, -5.7742 5E-02,0 . 26166667 224 2 .39177E -02, -5.77425E-02,0 .29437500 225 4 .41942E -02, -4.41942E-02,0 .03270833 226 4 .41942E -02, -4.41942E-02,0 . 06541667 227 4 .419428 -02, -4.41942E-02,0 .09812500 228 4 .41942E -02, -4.41942E-02,0 . 13083333 229 4 .41942E -02, -4.4194 2E-02,0 . 16354167 230 4 .41942E -02, -4.41942E-02,0 . 19625000 231 4 .41942E 02, -4.41942E-02,0 .22895833 232 4 . 41942E- 02, -4.41942E-02,0 . 26166667 233 4 . 41942E- 02, -4.41942E-02,0 .29437500 234 5 . 77425E- 02, -2.39177E-02,0 .03270833 235 5 .77425E- 02, -2.3 9177E- 02,0 . 06541667 236 5 .77425E- 02, -2.39177E-02,0 . 09812500 237 5 77425E- 02, -2.39177E-02,0 . 13083333 238 5 . 77425E-02, -2.39177E-02,0 .16354167 239 5 77425E-02, -2.3917 7E-02,0 . 19625000 240 5 77425E-02, -2.39177E-02,0 .22895833 241 5 77425E-02, -2.3 917 7E-02,0 . 26166667 242 5 77425E-02, -2.39177E-02,0 .29437500 243 5 77425E-02,2 .3 917 7E-02, 244 4 41942E-02,4 .41942E-02, 245 2 39177E-02, 5 .77425E-02, 246 5 77425E-02,2 .39177E-02,0. 33270833 247 5 77425E-02, 2 .39177E-02,0. 36541667 248 5 77425E-02, 2 .39177E-02,0.09812500 249 5 77425E-02,2 .39177E-02,0.13083333 250 5 77425E-02, 2 .39177E-02,0.16354167 251 5 77425E-02,2 .39177E-02,0.19625000 252 5 77425E-02,2 .3 9177E- 02,0.22895833 253 5 77425E-02,2 .39177E-02,0.26166667 254 5 77425E-02,2 .39177E-02,0.29437500 255 4 41942E-02,4 .41942E-02,0.03270833 256 4 41942E-02,4 .41942E-02,0.06541667 257 4 41942E-02,4 .41942E-02,0.09812500 258 4 41942E-02,4 .41942E-02,0.13083333 259 4 41942E-02,4 .41942E-02,0.16354167 260 4 41942E-02,4 .41942E-02,0.19625000 261 4 41942E-02,4 .41942E-02,0.22895833 262 4 41942E-02,4 .4194 2E-02,0.26166667 263 4 41942E-02,4 .41942E-02,0.29437500 264 2 39177E-02, 5 77425E-02,0.03270833 265 2 39177E-02,5 7742 5E- 02,0.06541667
Page 129
119
266,2.39177E-02,5.77425E-02,0.09812500 2 67,2.3 9177E-02,5.7 742 5E-02,0.13 083333 268,2.39177E-02,5.77425E-02,0.16354167 269,2.39177E-02,5.77425E-02,0.19625000 270,2.3 9177E-02,5.77425E-02,0.22895833 271,2.39177E-02,5.77425E-02,0.26166667 272,2.39177E-02,5.77425E-02,0.29437500 * ELEMENT_SHELL $ ELEM,pid,ni,n2,n3,n4 1 , 2 , 4 , 5 , 1 0 , 9 2 , 2 , 9 , 8 , 3 , 4 3,2,8,7,1,3 4,2,5,2,6,10 5.2.13.14.18.17 6, 2, 17,16,12,13 7 , 2 , 1 6 , 6 , 2 , 1 2 8.2.14.11.15.18 9 , 2 , 2 1 , 2 2 , 2 6 , 2 5 10 2 2 5 , 2 4 , 2 0 , 2 1 11 2 24,15,11,20 12 2 22,19,23,26 13 2 28,29,32,31 14 2 31,30,27,28 15 2 30,23,19,27 16 2 2 9 , 1 , 7 , 3 2 17 3 37 ,34 , 2 , 5 18 3 5, 4 , 3 6 , 3 7 19 3 4 , 3 , 3 5 , 3 6 20 3 3, 1,33,35 21 3 41 38 11,14 22 3 14 13 40,41 23 3 13 12 39,40 24 3 12 2, 34,39 25 3 45 42 19,22 26 3 22 21 44,45 27 3 21 20 43,44 28 3 20 11 38,43 29 3 48 33 1,29 30 3 29 28 47,48 31 3 28 27 46,47 32 3 27 19 42,46 33 4 35 33 49,51 34 4 51 52 36,35 35 4 52 53 37,36 36 4 53 50 34,37 37 4 39 34 50,55 38 4 55 56 40,39 39 4 56 57 41,40 40 4 57 54 38,41 41 4 43 38 54,59 42 4 59 60 44,43 43 4 60 61 45,44 44 4 61 58 42,45 45 4 46 42 58,62 46 4 62 63 47,46 47 4 63 64 48,47 48 4 64 49 33,48 49 5 69 66 50, 53 50 5 53 52 68,69 51 5 52 51 67,68 52 5 51 49 65,67 53 5 73 70 54,57 54 5 57 56 72,73 55 5 56 55 71,72 56 5 55 50 66,71 57 5 77 74 58,61 58 5 61 60 76, 77 59 5 60 59 75,76 60 5 59 54 70,75
Page 130
120
61
62 63 6 4 6 5 66 67 68 6 9 70 71 72 73 74 75 7 6 77 7 8 79 80 81 82
8 3 8 4 8 5 86 87
, 5 , 8 0 , 6 5 , 4 9 , 6 4 , 5 , 6 4 , 6 3 , 7 9 , 8 0 , 5 , 6 3 , 6 2 , 7 8 , 7 9 , 5 , 6 2 , 5 8 , 7 4 , 7 8 , 6 , 6 7 , 6 5 , 8 1 , 8 3 , 6 , 8 3 , 8 4 , 6 8 , 6 7 , 6 , 8 4 , 8 5 , 6 9 , 6 8 , 6 , 8 5 , 8 2 , 6 6 , 6 9 , 6 , 7 1 , 6 6 , 8 2 , 8 7 ,6,87,88,72,71 , 6 , 8 8 , 8 9 , 7 3 , 7 2 , 6 , 8 9 , 8 6 , 7 0 , 7 3 , 6,75,70,86,91 , 6 , 9 1 , 9 2 , 7 6 , 7 5 , 6 , 9 2 , 9 3 , 7 7 , 7 6 , 6 , 9 3 , 9 0 , 7 4 , 7 7 , 6 , 7 8 , 7 4 , 9 0 , 9 4 , 6 , 9 4 , 9 5 , 7 9 , 7 8 ,6,95,96,80,79 , 6 , 9 6 , 8 1 , 6 5 , 8 0 ,1,83,81,97,99 , 1 , 9 9 , 1 0 0 , 8 4 , 8 3 ,1,100,101,85,84 ,1,101,98,82,85 , 1 , 8 7 , 8 2 , 9 8 , 1 0 3 , 1 , 1 0 3 , 1 0 4 , 8 8 , 8 7 ,1,104,105,89,88
8 8 , 1 , 1 0 5 , 1 0 2 , 8 6 , 8 9 8 9 , 1 , 9 1 , 8 6 , 1 0 2 , 1 0 7 90.1.107.108.92.91 9 1 . 1 . 1 0 8 . 109.93.92 9 2 . 1 . 1 0 9 . 1 0 6 . 9 0 . 9 3 93,1,94,90,106,110 9 4 . 1.110.111.95.94 95, 1,111,112,96,95 9 6 , 1 , 1 1 2 , 9 7 , 8 1 , 9 6 97,1,113,115,136,127 9 8 , 1 , 1 1 5 , 1 1 6 , 1 4 5 , 1 3 6 99,1,116,117,154,145 100.1.117.114.118.154 101,1,127,136,137,128 1 0 2 . 1 . 136.145.146, 137 103.1.145.154.155.146 104.1.154.118.119.155 105.1.128.137.138, 129 106.1.137.146.147, 138 107.1.146.155.156.147 108.1.155.1 1 9 . 1 2 0 . 1 5 6 109.1.129.138.139, 130 110.1.138.147.148, 139 111,1,147,156,157, 148 112.1.156.1 2 0 . 1 2 1 . 1 5 7 113.1.130.139.140.131 114.1.139.148.149, 140 115.1.148.157.158.149 116,1,157,121,122, 158 117.1.131.140.141.132 118.1.140.149.150.141 119.1.149.158.159.150 120.1.158.122.123.159 121,1,132,141,142, 133 122.1.141.150.151.142 1 2 3 . 1 . 1 5 0 . 1 5 9 . 1 6 0 . 1 5 1 124.1.159.123.124.160 125.1.133.142.143.134 126.1.142.151.152.143 127.1.151.160.161.152 128.1.160.124.125.161 129.1.134.143.144.135
Page 131
130 131 132 133 134 135 136 137 138 139 140 141 142 143 144 145 146 147 148 149 150 151 152 153 154 155 156 157 158 159 160 161 162 163 164 165 166 167 168 169 170 171 172 173 174 175 176 177 178 179 180 181 182 183 184 185 186 187 188 189 190 191 192 193 194 195 196 197 198
121
1 143 152 153 144 1 152 161 162 153 1 161 125 126 162 1 135 144 99, 97 1 144 153 100 99 1 153 162 101 100 1 162 126 98, 101 1 114 164 176 118 1 164 165 185 176 1 165 166 194 185 1 166 163 167 194 1 118 176 177 119 1 176 185 186 177 1 185 194 195 186 1 194 167 168 195 1 119 177 178 120 1 177 186 187 178 1 186 195 196 187 1 195 168 169 196 1 120 178 179 121 1 178 187 188 179 1 187 196 197 188 1 196 169 170 197 1 121 179 180 122 1 179 188 189 180 1 188 197 198 189 1 197 170 171 198 1 122 180 181 123 1 180 189 190 181 1 189 198 199 190 1 198 171 172 199 1 123 181 182 124 1 181 190 191 182 1 190 199 200 191 1 199 172 173 200 1 124 182 183 125 1 182 191 192 183 1 191 200 201 192 1 200 173 174 201 1 125 183 184 126 1 183 192 193 184 1 192 201 202 193 1 201 174 175 202 1 126 184 103 98 1 184 193 104 103 1 193 202 105 104 1 202 175 102 105 1 163 204 216 167 1 204 205 225 216 1 205 206 234 225 1 206 203 207 234 1 167 216 217 168 1 216 225 226 217 1 225 234 235 226 1 234 207 208 235 1 168 217 218 169 1 217 226 227 218 1 226 235 236 227 1 235 208 209 236 1 169 218 219 170 1 218 227 228 219 1 227 236 237 228 1 236 209 210 237 1 170 219 220 171 1 219 228 229 220 1 228 237 238 229 1 237 210 211 238 1 171 220 221 172 1 220 229 230 221
Page 132
122
199 1 2 2 9 238 2 3 9 2 3 0
200 1 238 211 212 239 201 1 172 221 222 173 202 1 221 230 231 222 203 1 230 239 240 231 204 1 239 212 213 240 205 1 173 222 223 174 206 1 222 231 232 223 207 1 231 240 241 232 208 1 240 213 214 241 209 1 174 223 224 175 210 1 223 232 233 224 211 1 232 241 242 233 212 1 241 214 215 242 213 1 175 224 107 102 214 1 224 233 108 107 215 1 233 242 109 108 216 1 242 215 106 109 217 1 203 243 246 207 218 1 243 244 255 246 219 1 244 245 264 255 220 1 245 113 127 264 221 1 207 246 247 208 222 1 246 255 256 247 223 1 255 264 265 256 224 1 264 127 128 265 225 1 208 247 248 209 226 1 247 256 257 248 227 1 256 265 266 257 228 1 265 128 129 266 229 1 209 248 249 210 230 1 248 257 258 249 231 1 257 266 267 258 232 1 266 129 130 267 233 1 210 249 250 211 234 1 249 258 259 250 235 1 258 267 268 259 236 1 267 130 131 268 237 1 211 250 251 212 238 1 250 259 260 251 239 1 259 268 269 260 240 1 268 131 132 269 241 1 212 251 252 213 242 1 251 260 261 252 243 1 260 269 270 261 244 1 269 132 133 270 245 1 213 252 253 214 246 1 252 261 262 253 247 1 261 270 271 262 248 1 270 133 134 271 249 1 214 253 254 215 250 1 253 262 263 254 251 1 262 271 272 263 252 1 271 134 135 272 253 1 215 254 110 106 254 1 254 263 111 110 255 1 263 272 112 111 256 1 272 135 97,112
$ $$$$$$$$$$$$$$$$$$$$$$$$$$$$$$$$$$$$$$$$$$$$$$$$$$$$$$$$$$$$$$$$$$$$$$$$$$$$$$$$ $ $$ 5 CONSTRAINTS AND BOUNDARY CONDITIONS $ $$$$$$$$$$$$$$$$$$$$$$$$$$$$$$$$$$$$$$$$$$$$$$$$$$$$$$$$$$$$$$$$$$$$$$$$$$$$$$$$ $ * BOUNDARY_S PC_NODE $nid,cid,dofx,dofy,dofz,dofrx,dofry,dof rz $Final decision is to have constraints at top and bottom (fixed) OR just bottom 1,0,1,1,0,0,0,0
Page 133
123
2,0,1 1, 0 0 , 0 , 0 3,0,1 1, 0 0,0,0 4,0,1 1, 0 0,0,0 5,0,1 1, 0 0,0,0 6,0,1 1, 0 0,0,0 7,0,1 1, 0 0,0,0 8,0,1 1, 0 0,0,0 9,0,1 1, 0 0,0,0 10 0 1 1 0 0 0 0 11 0 1 1 0 0 0 0 12 0 1 1 0 0 0 0 13 0 1 1 0 0 0 0 14 0 1 1 0 0 0 0 15 0 1 1 0 0 0 0 16 0 1 1 0 0 0 0 17 0 1 1 0 0 0 0 18 0 1 1 0 0 0 0 19 0 1 1 0 0 0 0 20 0 1 1 0 0 0 0 21 0 1 1 0 0 0 0 22 0 1 1 0 0 0 0 23 0 1 1 0 0 0 0 24 0 1 1 0 0 0 0 25 0 1 1 0 0 0 0 26 0 1 1 0 0 0 0 27 0 1 1 0 0 0 0 28 0 1 1 0 0 0 0 29 0 1 1 0 0 0 0 30 0 1 1 0 0 0 0 31 0 1 1 0 0 0 0 32 0 1 1 0 0 0 0 33 0 1 1 0 0 0 0 34 0 1 1 0 0 0 0 35 0 1 1 0 0 0 0 36 0 1 1 0 0 G 0 37 0 1 1 0 0 0 0 38 0 1 1 0 0 0 0 39 0 1 1 0 0 0 0 40 0 1 1 0 0 0 0 41 0 1 1 0 0 0 0 42 0 1 1 0 0 0 0 43 0 1 1 0 0 0 0 44 0 1 1 0 0 0 0 45 0 1 1 0 0 0 0 46 0 1 1 0 0 0 0 47 0 1 1 0 0 0 0 48 0 1 1 0 0 0 0 49 0 1 1 0 0 0 0 50 0 1 1 0 0 0 0 51 0 1 1 0 0 0 0 52 0 1 1 0 0 0 0 53 0 1 1 0 0 0 0 54 0 1 1 0 0 0 0 55 0 1 1 0 0 0 0 56 0 1 1 0 0 0 0 57 0 1 1 0 0 0 0 58 0 1 1 0 0 0 0 59 0 1 1 0 0 0 0 60 0 1 1 0 0 0 0 61 0 1 1 0 0 0 0 62 0 1 1 0 0 0 0 63 0 1 1 0 0 0 0 64 0 1 1 0 0 0 0 65 0 1 1 0 0 0 0 66 0 1 1 0 0 0 0 67 0 1 1 0 0 0 0 68 0 1 1 0 0 0 0 69 0 1 1 0 0 0 0 70 0 1 1 0 0 0 0
Page 134
124
71, 0, 1 ,1,0,0 , 0 , 0 72, 0, 1 ,1,0,0 ,0,0 7 3 , 0 , 1 ,1,0, 0 , 0 , 0 74, 0, 1 ,1,0, 0 ,0,0 75, 0, 1 ,1,0, 0 , 0 , 0 7 6 , 0 , 1 ,1,0, 0 ,0,0 77, 0, 1 ,1,0, 0 , 0 , 0 7 8 , 0 , 1 ,1,0, 0 ,0,0 7 9 , 0 , 1 ,1,0, 0 , 0 , 0 8 0 , 0 , 1 ,1,0, 0 ,0,0 81, 0, 1 ,1,0,0 ,0,0 8 2 , 0 , 1 ,1,0, 0 , 0 , 0 8 3 , 0 , 1 ,1,0, 0 ,0,0 8 4 , 0 , 1 ,1,0, 0 ,0,0 85,0, 1 ,1,0, 0 ,0,0 8 6 , 0 , 1 ,1,0, 0 , 0 , 0 8 7 , 0 , 1 ,1,0, 0 , 0 , 0 8 8 , 0 , 1 ,1,0, 0 , 0 , 0 8 9 , 0 , 1 ,1,0, 0 , 0 , 0 9 0 , 0 , 1 ,1,0, 0 ,0,0 91, 0, 1 ,1,0, 0 , 0 , 0 92, 0, 1 ,1,0, 0 , 0 , 0 9 3 , 0 , 1 ,1,0, 0 ,0,0 9 4 , 0 , 1 ,1,0, 0 ,0,0 9 5 , 0 , 1 ,1,0, 0 ,0,0 9 6 , 0 , 1 ,1,0, 0 ,0,0 113, 0 1,1,1 1,1,1 114, 0 1,1,1 1,1,1 115, 0 1,1,1 1,1,1 116,0, 1,1,1 1,1,1 117,0, 1,1,1, 1,1,1 163,0,1,1,1, 1,1,1 1 6 4 , 0 1,1,1, 1,1,1 165,0, 1,1,1 1,1,1 166,0, 1,1,1, 1,1,1 2 0 3 , 0 1,1,1 1,1,1 2 0 4 , 0 1,1,1, 1,1,1 205, 0 1,1,1 1,1,1 2 0 6 , 0 1,1,1, 1,1,1 2 4 3 , 0 1,1,1 1,1,1 244, 0 1,1,1 1,1,1 245, 0, 1, 1, 1, 1,1,1 *PART $ BASE $ pid
1 $ *PART $ 1 ply $ pid
2 $ *PART $ 2 plies $ pid
3 $ *PART $ 3 plies $ pid
4 $ *PART $ 4 plies
sid 1
sid 2
sid 3
sid 4
mid eosid hgid 10 0
mid eosid hgid 10 0
mid eosid hgid 10 0
mid eosid hgid 10 0
grav adpopt tmid 0 0 0
grav adpopt tmid 0 0 0
grav adpopt tmid 0 0 0
grav adpopt tmid 0 0 0
Page 135
125
$ pid sid 5 5
$ *PART $ 5 plies $ pid sid
6 6 *SECTION_SHELL $ base mateial $1 SECID ELFORM
1 16 $2 tl t2 .0084167 .0084167
$ bl b2 0.0 -45.0
$ *SECTION_SHELL $ 1 ply $1 SECID ELFORM
2 16 $2 tl t2 .0014028 .0014028
$ bl b2 0 . 0
$ *SECTION_SHELL $ 2 plies $1 SECID ELFORM
3 1 6 $2 tl t2 .0028056 .0028056
bl 0 . 0
b2 -45.0
mid 1
mid 1
shRF . 833333
t3 .0084167
b3 45 . 0
shRF . 833333
t3 .0014028
b3
shRF .833333
t3 . 0028056
b3
eosid 0
eosid 0
NIP 6 . 0
t4 .0084167
b4 0 . 0
NIP 1.0
t4 . 0014028
b4
NIP 2 . 0
t4 .0028056
b4
hgid 0
hgid 0
PROPT 3.0
nloc
b5 -45.0
PROPT 3 . 0
nloc
b5
PROPT 3 . 0
nloc
b5
grav 0
grav 0
QR/IRID 0 . 0
marea
b6 45 . 0
QR/IRID 0 . 0
marea
b6
QR/IRID 0 . 0
marea
adpopt 0
adpopt 0
ICOMP 1
ICOMP 1
ICOMP 1
tmid 0
tmid 0
SETYP
SETYP
b6
*SECTION_SHELL $ 3 plies $1 SECID
4 $2 tl .0042083
$ bl 0 . 0
$ *SECTION_SHELL $ 4 plies $1 SECID
5 $2 tl
. 0056111 $ bl
0 . 0 $ *SECTION_SHELL $ 5 plies $1 SECID ELFORM
6 16 $2 tl t2 .0070138 .0070138
$ bl b2 0.0 -45 . 0
*MAT_COMPOSITE_FAILURE_ $ Material 59 $ 1 2. . .
$1
$ 2
ELFORM 16
t2 .0042083
b2 -45 . 0
ELFORM 16 t2
. 0056111 b2
-45.0
shRF . 833333
t3 0042083
b3 45 . 0
ShRF . 833333
t3 0056111
b3 45 . 0
NIP 3 .0 t4
.0042083 b4
NIP 4 . 0 t4
.0056111 b4
0 . 0
shRF .833333
t3 0070138
b3 45.0
SHELL MODEL
NIP 5 . 0 t4
. 0070138 b4
0 . 0
PROPT 3 . 0 nloc
b5
PROPT 3.0
nloc
b5
PROPT 3 . 0
nloc
b5 -45 . 0
QR/IRID 0 . 0
marea
b6
QR/IRID 0 . 0
marea
b6
QR/IRID 0 . 0
marea
b6
5 . ec
3 . 697E+8 aopt 3 . 0 a2
6 .
prba 0 . 09201
macf
a3
ICOMP 1
ICOMP 1
ICOMP 1
7 . pea
0.09201
SETYP
SETYP
SETYP
mid ro 1 4.113928
gab gbc
ea eb 1.117E+9 3 . 697E+8
gca kf 1.218E+8 1.320E+8 1.218E+8
prcb 0.400
$3 xp yp zp al
Page 136
126
$4 vl v2 v3 dl 0 0 1 0
$5 tsize alp soft fbrt IE- 8 1.02E-5 . 94 . 94
$6 xc xt yc yt $ 1.191E+7 2.549E+7
2.381E+7 3.499E+7
2 .381E+6 4 .406E+6
7.310E+5 1.008E+6
d2 0
ycfac(sr) 0.5
sc 1.504E+6 1.008E+6
d3 0
sf(??)
beta 9 0 . 0
*RIGIDWALL PLANAR MOVING FORCES $ 1 2 3. . $1
$ 2
$D
$E
NSID NSIDEX BOXID OFFSET 0 0 0 0
xt yt zt xh yh zh f ric
0 0 . 333334 0 0 0 0 .32 mass vo
3.0843 25 . 0 soft ssid nl n2 n3 n4
0 0 *RIGIDWALL_PLANAR_FORCES $ $ 1 2
9 9 9 9
wvel
$1 NSID NSIDEX BOXID OFFSET 0 0 0 0
$2 xt yt zt xh yh zh f ric
0 0 0 0 0 1 0.4 $E scft ssid nl n2 n3 n4
0 0 9998 *LOAD_BODY_ GENERALIZED $ Nl N2 LCID DRLCID XC YC ZC
1 9999 1 $ AX YX ZX OMX OMY OMZ
$ f t/s2 32.2
$ *DEFINE CURVE $ LCID
1 $ $ ABSCISSA ORDINATE
0 . 0 1 . 0 1 . 0 1.0
*CONTACT AUTOMATIC SINGLE SURFACE $ I- 2 . . . 3 . . . 4 . . 5 . . 6. . 7 . $1 ssid msid sstyp mstyp sboxid mboxid spr
0 0 0 0 $2 fs fd dc vc vdc penchk bt
.40 .32 $3 sf S sfm sst mst sf st sfmt f sf
*CONTROL ENERGY $ hgen rwen slnten rylen
2 2 2 2 *CONTROL SHELL $ wrpang esort irnxx istupd theory bwc miter
15 1 16 $ rotascl intgrd lamsht
$ *CONTROL TERMINATION $ endtim endcyc dtmin endeng endmas
1.8E-2 $ *CONTROL OUTPUT $ NPOPT NEECHO NREFUP IACCOP OPIFS IPNINT IKEDIT
$ ^DATABASE EXTENT BINARY
wvel
mpr
dt
vsf
pro]
neiph neips maxint strflg sigflg epsflg rltflg
IFLUSH 99999
engflg
Page 137
127
cmpflg 3
ieverp 1 2 .
beamip 1
dcomp 2 4 .
1 shge
2 . . . . 5 .
1 stssz
2
6 .
1 n3thdt
2 7 .
beam
beam
id3 1
id3
npltc psetid
npltc
id4 2
id4
*DATABASE_BINARY_D3PLOT $ dt/cycl ledt
5E-4 *DATABASE_BINARY_D3THDT $ $ dt/cycl lcdt
5E-4 *DATABASE_HISTORY_NODE $ idl id2
9999 9998 $ idl id2 *DATABAS E_RWFORCE $ dt
5E-4 *DATABAS E_NODOUT $ $ see DATABASE HISTORY OPTION (handled above $ DT
5E-4 *DATABAS E_GLS TAT $ $ dt
5E-4 *DATABASE_MATSUM $ $ dt
5E-4 *END
istats
psetid
ids
3 id5
id6 4
id6
tstart
tstart
id7 5
id7
lavg
lavg
id8 17 id8