A numerical investigation of local web buckling strength and behaviour of coped beams with slender web *Michael C. H. Yam 1) , Ke Ke 2) , Angus C. C. Lam 3) , Cheng Fang 4) , and K. F. Chung 5) 1), 2) Department of Building and Real Estate, The Hong Kong Polytechnic University, Hung Hom, Kowloon, Hong Kong, China 3) Department of Civil and Environmental Engineering, University of Macau, Macau, China 4) Department of Structural Engineering, School of Civil Engineering, Tongji University, Shanghai, China 5) Department of Civil and Environmental Engineering, The Hong Kong Polytechnic University, Hung Hom, Kowloon, Hong Kong, China 1) [email protected]ABSTRACT In this paper, a numerical investigation of the local web buckling strength and behaviour of top flange coped beams with slender web is presented. The nonlinear finite element (FE) models used in the study were validated by the test results obtained from the literature. Subsequently, a parametric study using the validated FE models was conducted to further examine the effects of various parameters on the local web buckling strength and behaviour of coped beams with slender web. Models considering various initial imperfections, web slenderness ratios, cope details, and end-plates dimensions were analysed. The applicability of current design equations for predicting the local web buckling strength of coped beams with slender web was also evaluated. The FE results show that with increasing cope length to beam depth ratio, the post- buckling behaviour of coped beams with slender web is evident, accompanied with a stable load carrying capacity after buckling occurs. The predictions of the local web buckling strength of top flange coped beams with slender web by the current design equations are generally conservative. 1) Associate Professor 2) Research Associate 3) Assistant Professor 4) Assistant Professor 5) Professor
Transcript
A numerical investigation of local web buckling strength and
behaviour of coped beams with slender web
*Michael C. H. Yam 1), Ke Ke2), Angus C. C. Lam3), Cheng Fang4), and K. F. Chung5)
1), 2)
Department of Building and Real Estate, The Hong Kong Polytechnic University, Hung Hom, Kowloon, Hong Kong, China
3)Department of Civil and Environmental Engineering, University of Macau, Macau,
China 4)
Department of Structural Engineering, School of Civil Engineering, Tongji University, Shanghai, China
5) Department of Civil and Environmental Engineering, The Hong Kong Polytechnic
University, Hung Hom, Kowloon, Hong Kong, China 1)
In this paper, a numerical investigation of the local web buckling strength and behaviour of top flange coped beams with slender web is presented. The nonlinear finite element (FE) models used in the study were validated by the test results obtained from the literature. Subsequently, a parametric study using the validated FE models was conducted to further examine the effects of various parameters on the local web buckling strength and behaviour of coped beams with slender web. Models considering various initial imperfections, web slenderness ratios, cope details, and end-plates dimensions were analysed. The applicability of current design equations for predicting the local web buckling strength of coped beams with slender web was also evaluated. The FE results show that with increasing cope length to beam depth ratio, the post-buckling behaviour of coped beams with slender web is evident, accompanied with a stable load carrying capacity after buckling occurs. The predictions of the local web buckling strength of top flange coped beams with slender web by the current design equations are generally conservative.
1)
Associate Professor 2)
Research Associate 3)
Assistant Professor 4)
Assistant Professor 5)
Professor
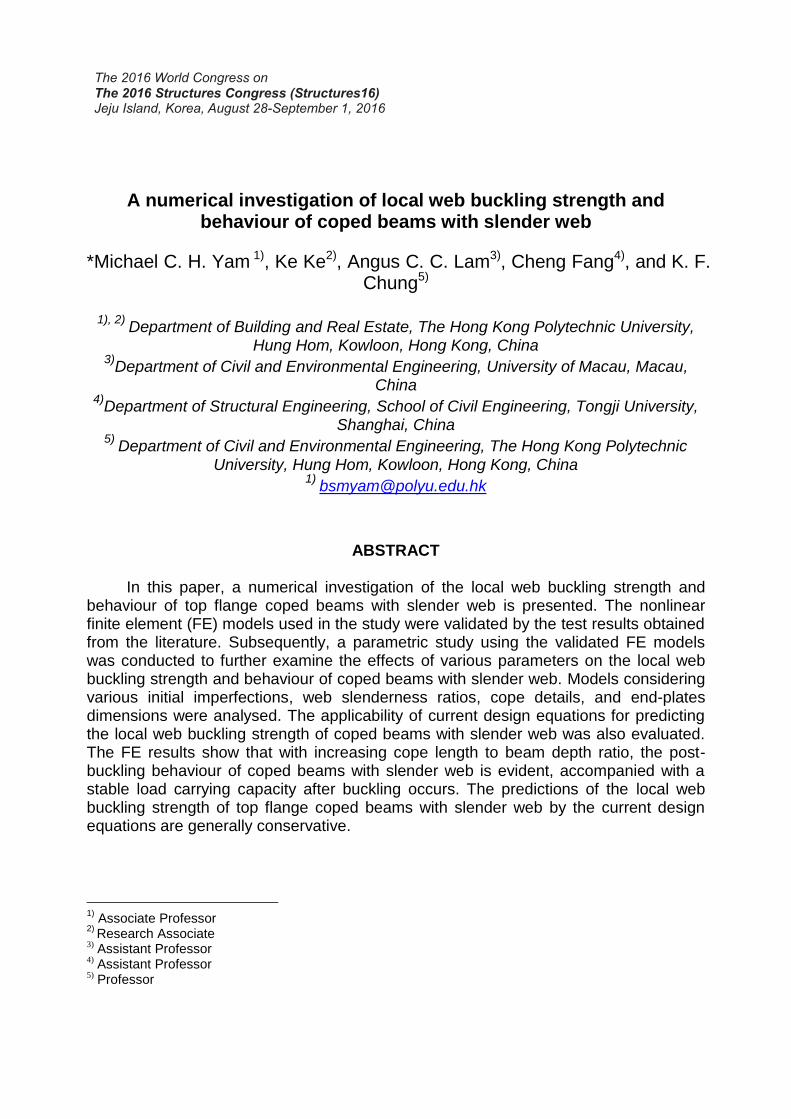
1. INTRODUCTION In steel construction, identical elevations are often required for flanges of secondary beams and primary beams for architectural purposes. Thus, secondary beams are usually coped at the flanges to facilitate erection and to achieve a compact connection between the secondary beams and the primary beams, as shown in Fig. 1. From the structural performance perspective, however, the load carrying capacity of a coped beam is inevitably reduced due to the removed flange (Milek 1980), exposing the beam to the risk of failure, both globally and locally. When lateral-torsional buckling of a coped beam (Gupta 1984; Ibrahim 2015) is prevented effectively, local failure near the coped region (Yam 2014) may occur. Specifically, the potential local failure modes of the coped beam ends include local web buckling, block shear, flexural yielding and shear yielding.
Fig. 1 Typical detail of a coped beam connection and symbols
Among these potential local failure modes of coped beams, local web buckling is one of the most common types. In fact, local web buckling failure raised concern among researchers since it was first observed in tests in late 1970s and early 1980s. In recent decades, some researchers have conducted investigations on the local web buckling behaviour of coped beams. For instance, a series of finite element (FE) analysis was first performed by Cheng (1984, 1986) to study the local buckling behaviour of top flange coped beams. Subsequently, Cheng (1986) developed a set of practical design equations for predicting the elastic local web buckling strength of coped beams based on a classical plate buckling model. From four more elastic local web buckling tests of coped beams and expanded FE analyses, Yam (2003) noticed that the buckling behaviour of the coped region might be governed by shear stress, particularly for specimens with a relatively small cope length to beam depth ratio. Therefore, an alternative calculation model was derived from the perspective of plate shear buckling, and practical design equations for quantifying the elastic local web buckling strength were constructed. More recently, Aalberg (2015) conducted an experimental study regarding the local web buckling resistance of top flange coped beams, and a simplified design formula for determining the load carrying capacity of coped beams was developed based on regression analyses. However, it should be noted that these research efforts on elastic local web buckling strength and behaviour of coped beams were primarily for hot-rolled sections with standard beam depth to web thickness ratio, whereas the available information on coped beams with slender web is quite limited. Even though two specimens with slender web were tested and analysed
Cope length c
Co
pe
de
pth
dc
Primary beam
Secondary beam
End-plate
Weld
Cope
Typical coped beam
connection
h0
D
Bh
w
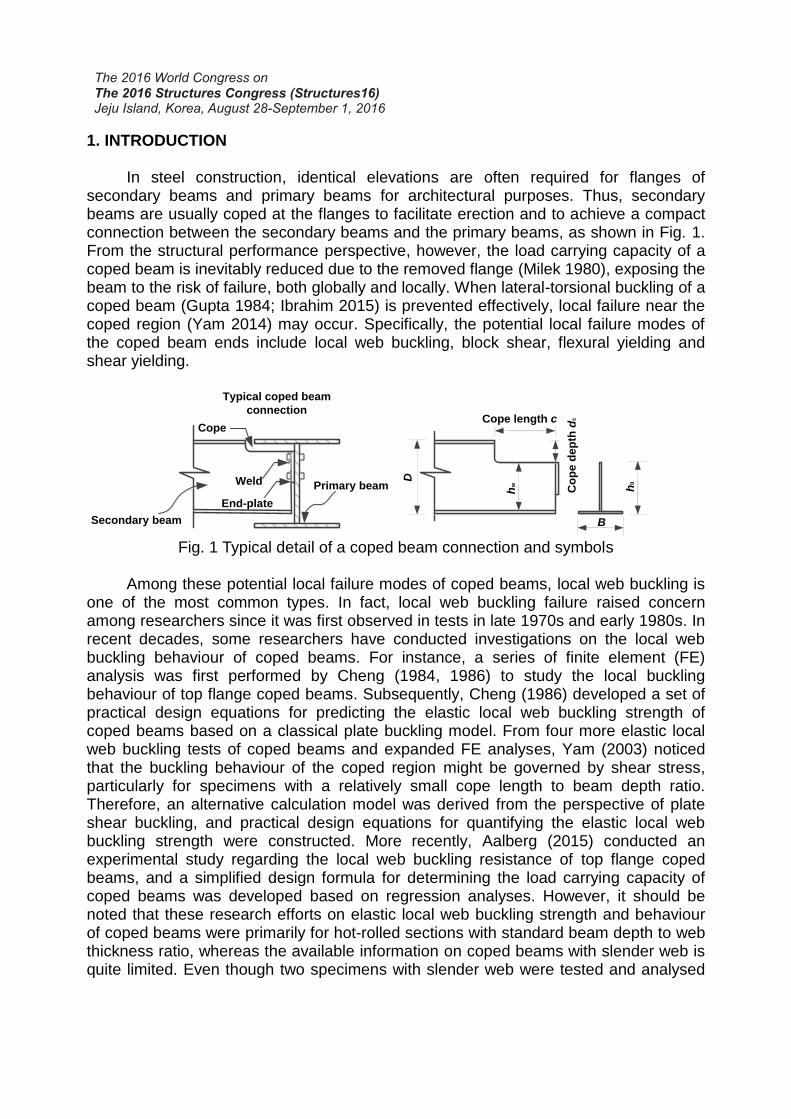
in the research work of Cheng (1984), more efforts are still in need. In this investigation, a finite element study was conducted to examine the local web buckling strength and behaviour of top flange coped beams with slender web. The developed models were compared with the test results of two specimens with slender web from Cheng (1984). Based on the validated models, a parametric study was then conducted, and effects of initial imperfections, web slenderness ratios, cope details (cope length to beam depth ratio and cope depth to beam depth ratio), and end-plate dimensions on the local web buckling strength and behaviour of coped beams with slender web were evaluated. To evaluate the applicability of current equations for predicting the local web buckling strength of coped beams with slender web, a comparison between the FE results and the local web buckling strength determined by the design equations was also made. 2. FINITE ELEMENT MODELLING OF SPECIMENS FROM THE LITERATURE To have a better understanding of the strength and behaviour of coped beams with slender web, numerical models were developed and analysed using the FE method. The test results of two specimens with slender web from the literature (Cheng 1984) were used to validate the models. The details of these two specimens are presented in Table 1. The commercial FE analysis software ABAQUS (ABAQUS Version 6.12 (2012)) was used to perform the analyses. Measured dimensions of the specimens and the actual material properties obtained from coupon tests were employed in the models. Both the material and geometric nonlinearities were considered in the analyses, and the material nonlinearity for FE models was calibrated following the isotropic elastic-plastic trilinear law and the von Mises yield criterion. The entire coped beams were modelled using four-node, reduced integration, and finite strain shell elements (S4R element in ABAQUS), and the mesh in the coped region was refined. An overview of the FE model is presented in Fig. 2.
Table 1 Summary of the specimens with slender web (Cheng 1984)
No Specimen code D(mm) B(mm) tw(mm) tf(mm) hw/tw dc/D c/D
1 PB26A 673.10 152.40 3.35 4.60 198 0.043 0.49
2 PB26B 673.10 152.40 3.35 4.60 198 0.034 0.31
To trigger the expected local web buckling failure or plate shear buckling failure near the cope for the specimens, initial imperfections were introduced in the analyses. The initial imperfection in terms of the first buckling shape was determined by an eigenvalue analysis, and then a scale factor was employed to adjust the peak value. In the analyses, the peak initial imperfection of 0.5 mm was used for specimen PB26A and PB26B, according to a trial-and-error procedure. As for the boundary condition of the end-plate, an idealised boundary condition with translation displacement restraints at the bolt holes of the end-plate was first considered for simplification (Fig. 2). Also, boundary conditions with spring elements
implemented surrounding the bolt holes were also employed to investigate the influence of washers between the end-plate and the column stub surface and the interaction between bolt shanks and bolt holes on the behaviour of coped beams with slender web. In particular, to account for the effect of washers, linear horizontal spring elements (in U1 direction) were used to simulate the flexibility provided by the washers. Meanwhile, nonlinear vertical spring elements (in U2 direction) were also applied in the FE models to simulate the influence of the bolt shanks on the bolt holes. To determine the stiffness of these spring elements, a trial-and-error procedure was adopted. Specifically, the stiffness of the vertical springs was first assumed to be infinite while the linear horizontal spring stiffness was adjusted to evaluate its effect on the load-deflection curves of the specimens. The FE analysis results in terms of the reaction force-load point displacement curves considering the variation of the stiffness of horizontal spring elements are compared in Fig. 3, along with the results determined by the idealised boundary condition (Fig. 2). It can be seen that for both specimens, the variation of the horizontal spring stiffness has a minimum effect on the load-deflection curves since models with the stiffness ranging from 5000 N/mm to infinity (the idealised boundary condition) almost have identical responses. This phenomenon can be expected because a slender end-plate was used in the connection, and the flexibility of the connection could be provided by the deformation of the end-plate. Therefore, in the horizontal direction, the direct restraint of translation displacement at the bolt hole region is believed to be sufficiently accurate to simulate the realistic boundary condition in the tests.
Fig. 2 An overview of FE models and boundary conditions of the end-plate
Concentrated loadConcentrated load
Kinematic couplingKinematic couplingU1U1
U2U2
U3U3
Restraint at holesRestraint at holes Lateral bracing
points U3=0
Lateral bracing
points U3=0
Vertical support
U2=0
Vertical support
U2=0
Refined mesh regionRefined mesh region
Slender web
Linear Spring
in U1
Nonlinear Spring
in U2
U3=0U3=0U1=0
U2=0
Idealised boundary
conditionEmployment of
spring elements
Reaction force
Restraint at bolt holes
Concentrated load
Lateral bracing
points U3=0
Refined mesh region
Vertical support
U2=0
U2
U1U3
Slender web
Kinematic couping
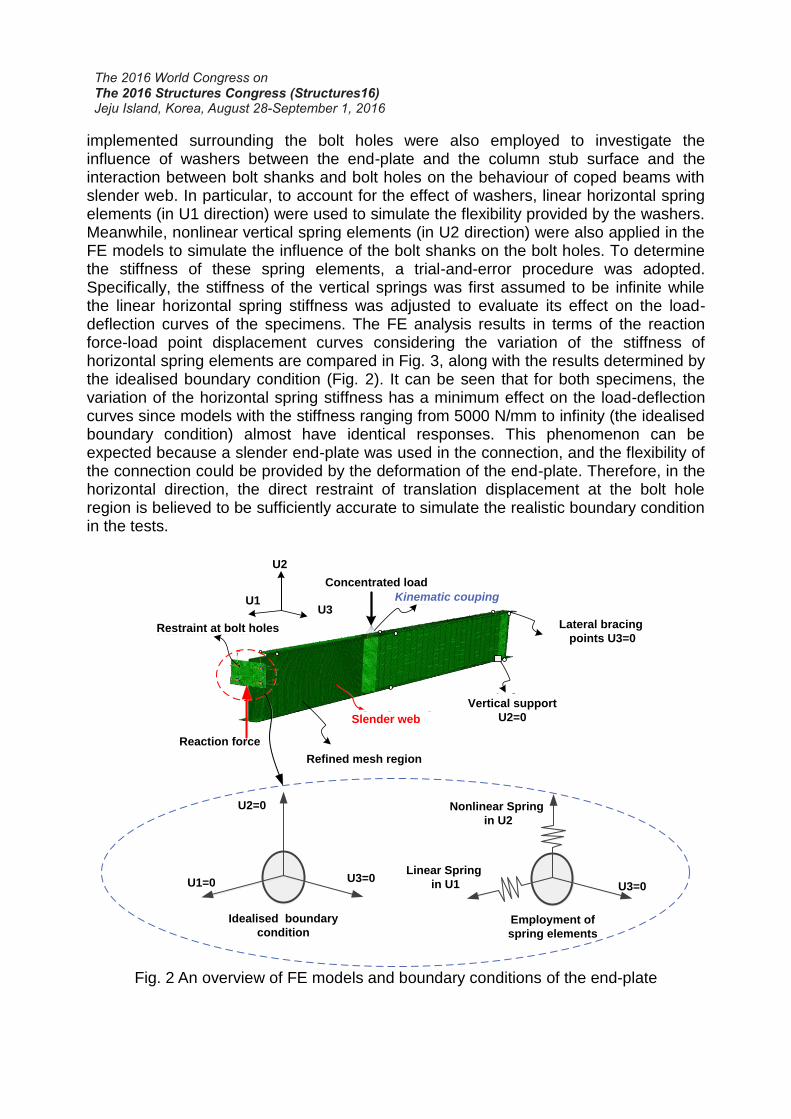
Fig. 3 Effects of the horizontal spring stiffness on the load-deflection curves Subsequently, the vertical nonlinear spring stiffness was varied until the FE load-deflection curves generally matched the test curves. Note that the nonlinear property of the vertical springs for the two specimens was considered respectively due to the potentially different connection behaviour. For specimen PB26A, prior to the 2mm slip (bolt hole clearance), the stiffness of 20000 N/mm was assigned to consider the frictional stiffness of the connection. After a slip of 2 mm was reached, an infinite stiffness was considered assuming that the deformation of bolt shanks and the material around the bolt hole was negligible. For specimen PB26B, it should be noted that a significant nonlinearity was observed before buckling occurred. Since this specimen was governed by elastic buckling, the nonlinearity was unlikely induced by yielding of the material, which was also supported by the strain readings from the test results. Thus, it was postulated that there was an accidental slip in the connection during the loading for specimen PB26B. Therefore, the nonlinear vertical spring with a stiffness of 20000 N/mm before the slip reaching 1mm and a stiffness of 2500 N/mm after 1mm slip were considered in the bolt holes. After the slip of 2 mm, an infinite stiffness was assigned to the springs. The load-deflection curves predicted by FE models were obtained and they are compared with the corresponding test results, as presented in Fig. 4. In general, the predicted curves agree well with the test curves. For specimen PB26A, it can be seen that the idealised boundary condition leads to more reasonable results regarding the response curve compared with the model with vertical springs. Comparatively, for specimen PB26B, the idealised boundary condition leads to bias regarding the slope of the load-deflection curve. However, the buckling strength of the specimen is still in reasonable agreement with the test result. This phenomenon is understandable since the failure mode was either local web buckling or local web buckling combined with plate shear buckling.
0 1 2 3 4 5
03
06
09
01
20
15
0 100 N/mm
5000 N/mm
10000 N/mm
Idealised condition
PB26A
R
kN
Displacement at load point (mm)
0 1 2 3 4 5 6 7
03
06
09
01
20
15
0
100 N/mm
5000 N/mm
10000 N/mm
Idealised condition
PB26B
R
kN
Displacement at load point (mm)
Fig. 4 Load-deflection curves obtained from the tests and the FE analyses
Fig. 5 Dimensions of end-plates
3. PARAMETRIC STUDY 3.1 An overview A parametric study considering a variation of the web slenderness ratio (hw/tw), cope details, the rotational restraint provided by the end-plate, and the magnitude of the initial imperfection was conducted. In particular, three web slenderness ratios, 80, 130, and 180 were considered in three groups of models (Group A, B and C). Meanwhile, two cope depth to beam depth ratios (dc/D) of 0.05 and 0.1 along with two cope length to beam depth ratios (c/D) of 0.4 and 1 were also employed in the analyses. Two end-plate dimensions (Fig. 5) were involved to account for the variation of rotational restraint of the end-plates. Also, the magnitude of the initial imperfection was considered as a critical parameter when performing the analyses. As the validation of FE models presented above indicates that the local web buckling strength and the general load-deflection behaviour of coped beams with slender web would not be affected by the accidental slip in the connection, the idealised boundary condition was adopted to establish the parametric study. The FE models used in the parametric study were based on the ones validated in Section 2, and the same material property as that of the test specimens was adopted. To minimise the effect of the concentrated applied load on the coped region, in the analysis of each model, the distances of the load point
0 1 2 3 4
03
06
09
01
20
15
0 Test results
FE results with nonlinear vertical springs
FE results with idealised condition
PB26A
R
kN
Displacement at load point (mm)0 5 10 15 20 25
03
06
09
01
20
15
0
Test results
FE results with nonlinear vertical springs
FE results with idealised condition
PB26B
R
kN
Displacement at load point (mm)
100
15
0
t=10 mmt=10 mm
(Type L end-plate )
50
50
50
(Type S end-plate )
200
15
0
t=5 mmt=5 mm
5050
50
50
50
centreline and the support point from the end-plate surface were set to be 2.5D and 7.5D, respectively. The detail of the parameters is presented in Table 2.
Table 2 Models in the parametric study
No Model Code D
(mm) B
(mm) tw
(mm) tf
(mm) hw/tw dc/D
End-plate
c/D
1 A/c133/dc16/Es 332 150 4 6 80 0.05 S
0.4
2 A/c133/dc33/Es 332 150 4 6 80 0.10 S
3 B/c213/dc27/Es 532 150 4 6 130 0.05 S
4 B/c213/dc53/Es 532 150 4 6 130 0.10 S
5 C/c293/dc37/Es 732 150 4 6 180 0.05 S
6 C/c293/dc73/Es 732 150 4 6 180 0.10 S
7 A/c332/dc16/Es 332 150 4 6 80 0.05 S
1.0
8 A/c332/dc33/Es 332 150 4 6 80 0.10 S
9 B/c532/dc27/Es 532 150 4 6 130 0.05 S
10 B/c532/dc53/Es 532 150 4 6 130 0.10 S
11 C/c732/dc37/Es 732 150 4 6 180 0.05 S
12 C/c732/dc73/Es 732 150 4 6 180 0.10 S
13 A/c133/dc16/El 332 150 4 6 80 0.05 L 0.4
14 C/c732/dc73/El 732 150 4 6 180 0.10 L 1.0
3.2 Effects of initial imperfections Typical reaction force-load point displacement curves of Group A and B are presented in Fig. 6, considering the magnitude of initial imperfections (δ) of 0.1 mm, 0.5 mm, 1 mm, 3 mm and 3.5 mm (corresponding to the δ/tw ratio of 0.025, 0.125, 0.25, 0.75, and 0.875, respectively). The critical elastic buckling loads (REG) represented by the reaction forces determined by the eigenvalue analyses considering the first buckling mode of each model are also presented in the figure. These load-deflection curves indicate that the effect of the initial imperfection on the local web buckling strength and behaviour of coped beams with slender web is appreciable. In particular, for cases with c/D=0.4, the peak loads are significantly influenced by the magnitude of the initial imperfection. For instance, the peak load for model A/c133/dc16/Es is decreased by 40.9%, when δ is increased from 0.1mm to 3 mm. Comparatively, the load-deflection responses of models with c/D=1.0 are less sensitive to the initial imperfection. Therefore, for conservative predictions the following parametric study adopted an initial imperfection of the first buckling shape with the magnitude based on the equivalent
Fig. 6 Load-deflection curves with various initial imperfections
0 1 2 3 4 5 6 7 8 9 10 11 12
05
01
00
15
02
00
25
0R
EG=238.1 kN =0.1 mm
=0.5 mm
=1 mm
=3 mm
=3.5 mm
A/c133/dc16/Es
R
kN
Displacement at load point (mm)
0 1 2 3 4 5 6 7 8 9 10 11 12
05
01
00
15
02
00
REG
=191.7 kN =0.1 mm
=0.5 mm
=1 mm
=3 mm
=3.5 mm
A/c133/dc33/Es
R
kN
Displacement at load point (mm)
0 1 2 3 4 5 6 7 8 9 10 11 12
01
53
04
56
07
5
REG
=58.7 kN
=0.1 mm
=0.5 mm
=1 mm
=3 mm
=3.5 mmA/c332/dc16/Es
R
kN
Displacement at load point (mm)
0 1 2 3 4 5 6 7 8 9 10 11 12
01
53
04
56
07
5
REG
=50.6 kN
=0.1 mm
=0.5 mm
=1 mm
=3 mm
=3.5 mmA/c332/dc33/Es
R
kN
Displacement at load point (mm)
0 1 2 3 4 5 6 7 8 9 10 11 12
04
08
01
20
16
0
REG
=140.6 kN
=0.1 mm
=0.5 mm
=1 mm
=3 mm
=3.5 mmB/c213/dc27/Es
R
kN
Displacement at load point (mm)
0 1 2 3 4 5 6 7 8 9 10 11 12
04
08
01
20
16
0
REG
=118.0 kN
=0.1 mm
=0.5 mm
=1 mm
=3 mm
=3.5 mmB/c213/dc53/Es
R
kN
Displacement at load point (mm)
0 1 2 3 4 5 6 7 8 9 10 11 12
01
53
04
56
0
REG
=33.9 kN =0.1 mm
=0.5 mm
=1 mm
=3 mm
=3.5 mmB/c532/dc27/Es
R
kN
Displacement at load point (mm)
0 1 2 3 4 5 6 7 8 9 10 11 12
01
53
04
56
0
REG
=30.4 kN =0.1 mm
=0.5 mm
=1 mm
=3 mm
=3.5 mmB/c532/dc53/Es
R
kN
Displacement at load point (mm)
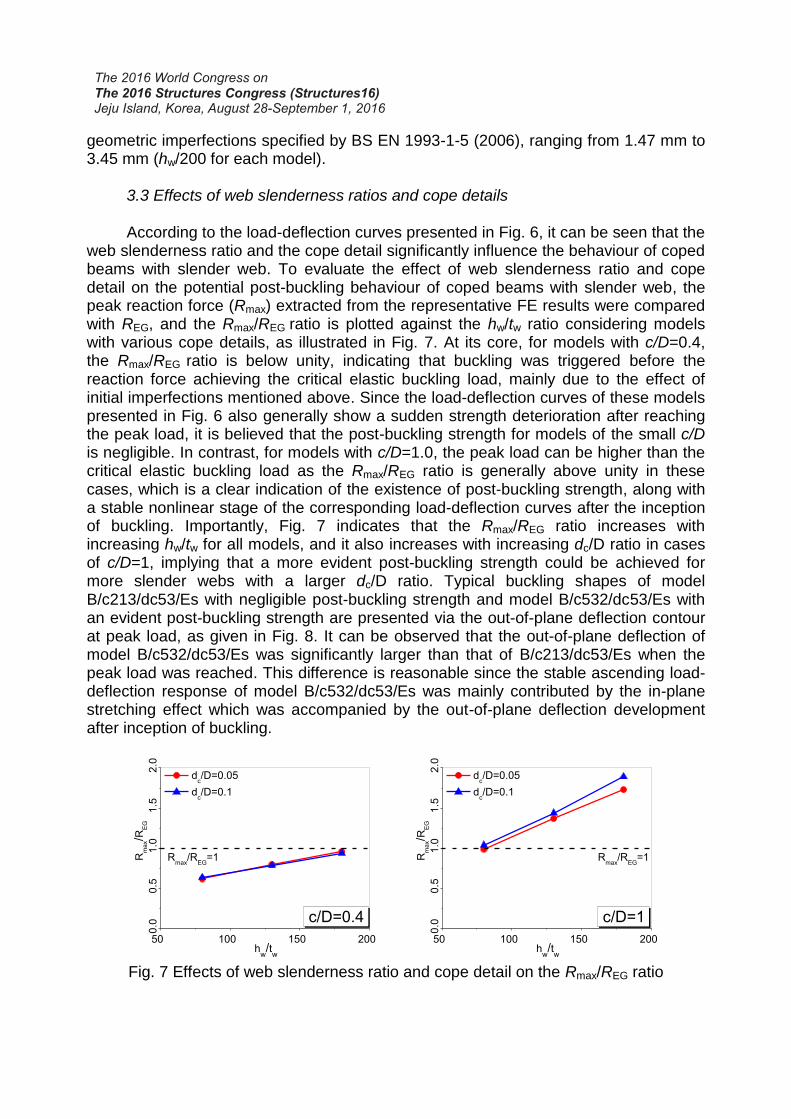
geometric imperfections specified by BS EN 1993-1-5 (2006), ranging from 1.47 mm to 3.45 mm (hw/200 for each model). 3.3 Effects of web slenderness ratios and cope details According to the load-deflection curves presented in Fig. 6, it can be seen that the web slenderness ratio and the cope detail significantly influence the behaviour of coped beams with slender web. To evaluate the effect of web slenderness ratio and cope detail on the potential post-buckling behaviour of coped beams with slender web, the peak reaction force (Rmax) extracted from the representative FE results were compared with REG, and the Rmax/REG ratio is plotted against the hw/tw ratio considering models with various cope details, as illustrated in Fig. 7. At its core, for models with c/D=0.4, the Rmax/REG ratio is below unity, indicating that buckling was triggered before the reaction force achieving the critical elastic buckling load, mainly due to the effect of initial imperfections mentioned above. Since the load-deflection curves of these models presented in Fig. 6 also generally show a sudden strength deterioration after reaching the peak load, it is believed that the post-buckling strength for models of the small c/D is negligible. In contrast, for models with c/D=1.0, the peak load can be higher than the critical elastic buckling load as the Rmax/REG ratio is generally above unity in these cases, which is a clear indication of the existence of post-buckling strength, along with a stable nonlinear stage of the corresponding load-deflection curves after the inception of buckling. Importantly, Fig. 7 indicates that the Rmax/REG ratio increases with increasing hw/tw for all models, and it also increases with increasing dc/D ratio in cases of c/D=1, implying that a more evident post-buckling strength could be achieved for more slender webs with a larger dc/D ratio. Typical buckling shapes of model B/c213/dc53/Es with negligible post-buckling strength and model B/c532/dc53/Es with an evident post-buckling strength are presented via the out-of-plane deflection contour at peak load, as given in Fig. 8. It can be observed that the out-of-plane deflection of model B/c532/dc53/Es was significantly larger than that of B/c213/dc53/Es when the peak load was reached. This difference is reasonable since the stable ascending load-deflection response of model B/c532/dc53/Es was mainly contributed by the in-plane stretching effect which was accompanied by the out-of-plane deflection development after inception of buckling.
Fig. 7 Effects of web slenderness ratio and cope detail on the Rmax/REG ratio
50 100 150 200
0.0
0.5
1.0
1.5
2.0
Rm
ax/R
EG
hw/t
w
dc/D=0.05
dc/D=0.1
c/D=0.4
Rmax
/REG
=1
50 100 150 200
0.0
0.5
1.0
1.5
2.0
Rm
ax/R
EG
hw/t
w
dc/D=0.05
dc/D=0.1
c/D=1
Rmax
/REG
=1
(Type S end-plate)
Fig. 8 Typical buckling shapes of models (out-of-plane deflection at the peak load)
To investigate the influence of the web slenderness ratio and the cope detail on the load carrying capacity of coped beams with slender web, the Rmax was first normalised by the reaction force causing yielding of the material at the coped end (Ry)
which was determined by the yield moment capacity (My) and the cope length of the coped section (Ry=My/c). The normalised strength ratio (Rmax/Ry) is plotted against hw/tw ratio and presented in Fig. 9. As expected, the Rmax/Ry ratio decreases significantly with increasing hw/tw ratio irrespective of the cope detail. It can also be observed that there are cases in which the Rmax/Ry ratio slightly increases with increasing dc/D ratio. This is due to the fact that the decrease of the depth at the coped section causes a substantial reduction in the yield moment, although the Rmax also decreases.
Fig. 9 Effects of web slenderness ratio and cope detail on the Rmax/Ry ratio
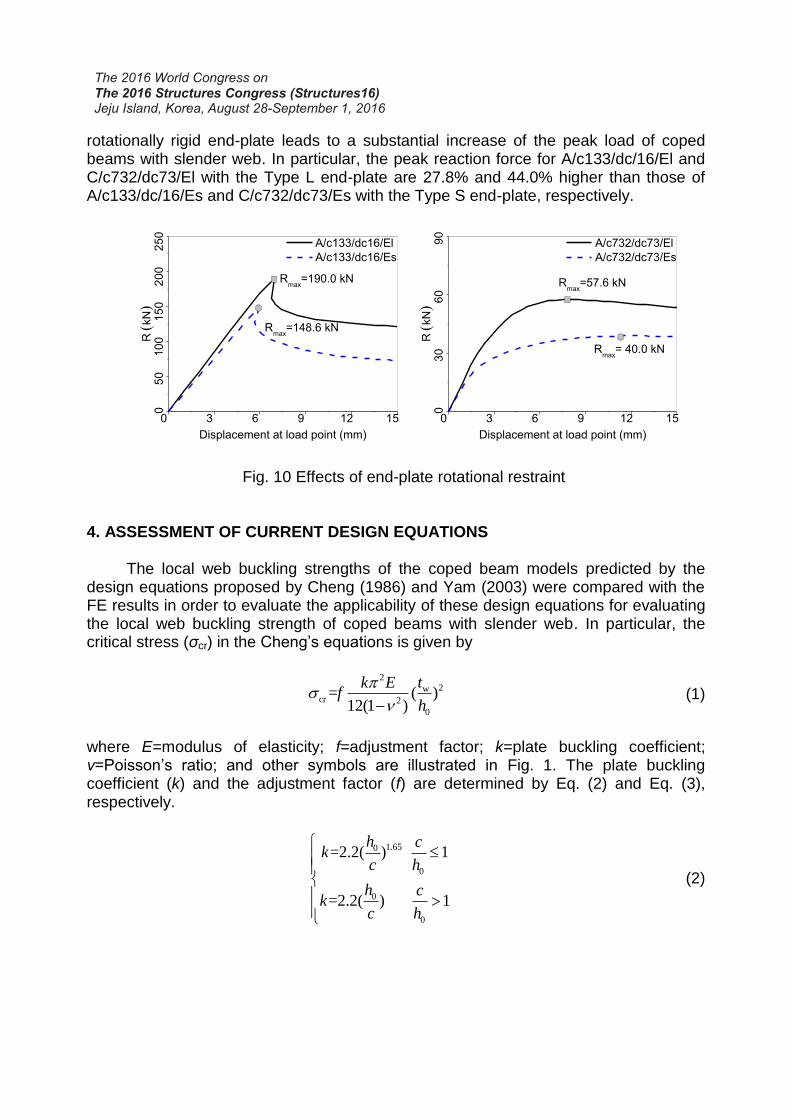
3.4 Effects of the end-plate rotational restraint Representative FE results of models with different end-plates in terms of the reaction force-load point displacement curves are illustrated in Fig. 10. These results indicate that the enhancement of the end-plate rotational stiffness by applying a more
Bottom view
U3U3
Buckling line Buckling line
B/c532/dc53/Es B/c213/dc53/Es
Bottom view
50 100 150 200
0.0
0.2
0.4
0.6
0.8
1.0
Rm
ax/R
y
hw/t
w
dc/D=0.05
dc/D=0.1
c/D=0.4
50 100 150 200
0.0
0.2
0.4
0.6
0.8
1.0
Rm
ax/R
y
hw/t
w
dc/D=0.05
dc/D=0.1
c/D=1
rotationally rigid end-plate leads to a substantial increase of the peak load of coped beams with slender web. In particular, the peak reaction force for A/c133/dc/16/El and C/c732/dc73/El with the Type L end-plate are 27.8% and 44.0% higher than those of A/c133/dc/16/Es and C/c732/dc73/Es with the Type S end-plate, respectively.
Fig. 10 Effects of end-plate rotational restraint
4. ASSESSMENT OF CURRENT DESIGN EQUATIONS
The local web buckling strengths of the coped beam models predicted by the design equations proposed by Cheng (1986) and Yam (2003) were compared with the FE results in order to evaluate the applicability of these design equations for evaluating the local web buckling strength of coped beams with slender web. In particular, the critical stress (σcr) in the Cheng’s equations is given by
(1)
where E=modulus of elasticity; f=adjustment factor; k=plate buckling coefficient; ν=Poisson’s ratio; and other symbols are illustrated in Fig. 1. The plate buckling coefficient (k) and the adjustment factor (f) are determined by Eq. (2) and Eq. (3), respectively.
(2)
0 3 6 9 12 15
05
01
00
15
02
00
25
0
Rmax
=148.6 kN
Rmax
=190.0 kN
A/c133/dc16/El
A/c133/dc16/Es
R
kN
Displacement at load point (mm)
0 3 6 9 12 15
03
06
09
0
Rmax
= 40.0 kN
Rmax
=57.6 kN
A/c732/dc73/El
A/c732/dc73/Es
R
kN
Displacement at load point (mm)
22w
cr 2
0
= ( )12(1 )
tk Ef
h
1.650
0
0
0
=2.2( ) 1
=2.2( ) 1
h ck
c h
h ck
c h
(3)
Based on the precondition that the failure is governed by elastic buckling, the reaction corresponding to local web buckling could be obtained. For the Yam’s equations, derived from the plate shear model, the critical shear stress (τcr) is determined by
(4)
where ks is the shear buckling coefficient given by
(5)
(6)
(7)
Likewise, when τcr does not exceed the shear yield strength of the material, the corresponding reaction force denoting the local web buckling strength can be computed. In this section, the comparison was made based on the models with Type S end-plates. The ratio of the FE result represented by the peak load (Rmax) to the predicted local web buckling strength (RCheng or RYam) based on the Cheng’s method (RCheng) or the Yam’s method (RYam) was obtained, and the ratios are plotted against the hw/tw ratio, as presented in Fig. 11. The Rmax/ RCheng and the Rmax/ RYam ratios of these models along with the statistical results in terms of mean value and coefficient of variation (COV) are addressed in Table 3. Applying the Cheng’s method, the analysis-to-predicted ratio ranges from 0.78 to 2.68. The mean Rmax/RCheng ratio is 1.56, with a COV of 0.42. Comparatively, the analysis-to-predicted ratio determined by the Yam’s method ranges from 0.91 to 2.11 The mean Rmax/RYam ratio and the associated COV are 1.38 and 0.28, respectively. For both the Cheng’s method and the Yam’s method, it can be seen that the analysis-to-predicted ratios are above unity for most cases, revealing the conservative nature of these design methods. In addition, it is observed that the analysis-to-predicted ratio increases with increasing web slenderness ratio, indicating that the results by the current design methods are more conservative for cases of slenderer webs. For instance, for the case with hw/tw=180 and c/D=1.0, the analysis-to-predicted ratio can achieve 2.68 and 2.11 for the Cheng’s method and the Yam’s method, respectively. This tendency is also reasonable since the observed post-buckling strength of the FE models has not been considered in the current design equations. It is also of interest to
2= 1
=1 1
c cf
D D
c cf
D D
22w
cr s 2
0
= ( )12(1 )
tEk
h
0s = ( )bh
k ac
c=1.38 1.79d
aD
2c c=3.64( ) 3.36 1.55d d
bD D
note that although both methods produced inconsistent predictions of the local web buckling strength of coped beams with slender web, the predicted results by the Yam’s method in general compare better with the FE results based on a better average analysis-to-predicted ratio and a relatively smaller CO.
Fig. 11 Comparison of FE results and current methods (Type S end-plate)
Table 3 Summary of results determined by FE analyses and design equations
No. Model Code RCheng RYam Rmax Rmax/RCheng Rmax/RYam
1 A/c133/dc16/Es 170.0 162.6 148.5 0.87 0.91
2 A/c133/dc33/Es 156.4 131.4 121.7 0.78 0.93
3 B/c213/dc27/Es 98.6 100.4 112.4 1.14 1.12
4 B/c213/dc53/Es 91.1 82.0 93.0 1.02 1.13
5 C/c293/dc37/Es 68.1 73.1 90.2 1.32 1.23
6 C/c293/dc73/Es 62.9 59.6 76.8 1.22 1.29
7 A/c332/dc16/Es 38.8 45.3 58.0 1.49 1.28
8 A/c332/dc33/Es 37.0 41.8 52.4 1.42 1.25
9 B/c532/dc27/Es 22.5 28.2 46.4 2.06 1.65
10 B/c532/dc53/Es 21.5 26.1 43.9 2.04 1.68
11 C/c732/dc37/Es 15.6 20.5 41.2 2.64 2.01
12 C/c732/dc73/Es 14.9 19.0 40.0 2.68 2.11
Mean 1.56 1.38
COV 0.42 0.28
50 100 150 200
0.0
0.5
1.0
1.5
c/D=0.4
Cheng's method
dc/D =0.05 d
c/D =0.1
Yam's method
dc/D =0.05 d
c/D =0.1
hw/t
w
Rm
ax/R
Ch
en
g o
r R
ma
x/R
Ya
m
50 100 150 2000
12
3
c/D=1
Cheng's method
dc/D =0.05 d
c/D =0.1
Yam's method
dc/D =0.05 d
c/D =0.1
hw/t
w
Rm
ax/R
Ch
en
g o
r R
ma
x/R
Ya
m
5. CONCLUSIONS The local web buckling strength and behaviour of coped beams with slender web were investigated using the finite element (FE) method. The FE models used were validated by the test results in the literature. In general, the FE results compare well with the test results. Subsequently, a parametric study was conducted based on the validated FE model, and effects of initial imperfections, web slenderness ratios, cope details, and end-plate dimensions on the local web buckling strength and behaviour of coped beams with slender web were studied. It was observed that the local web buckling strength and behaviour of coped beams with slender web are sensitive to the magnitude of initial imperfections. It was also found that for coped beams with slender web, when the cope length to beam depth ratio is small (c/D=0.4), the failure tends to be governed by elastic local web buckling with no significant post-buckling strength observed. However, the post-buckling strength and behaviour becomes evident for cases with large cope length to beam depth ratio (c/D=1), especially for models of slenderer webs. As for the effect of the end-plate rotational stiffness, the analysis results indicate that the local web buckling strength and the post-buckling strength both increase with increasing end-plate rotational rigidity. Based on the representative analysis results, the applicability of the current design equations for predicting the local web buckling strength of coped beams with slender web was also assessed. Since the post-buckling strength has not been sufficiently considered in current design equations, both the predictions by the Cheng’s method and the Yam’s method are conservative. Currently, a full-scale experimental programme is being conducted. The test results will be used to provide a further understanding of the local web buckling behaviour of coped beams with slender web and help improve the current design methods. ACKNOWLEDGEMENT This research is funded by a grant from the Research Grants Council of the Hong Kong Special Administrative Region, China (project no. PolyU 152189/15E). REFERENCES Aalberg, A. (2015), “Experimental and numerical parametric study on the capacity of
coped beam ends”, J. Constr. Steel Res., 113: 146-155. ABAQUS Analysis Users Manual (2012), “ABAQUS Standard, version 6.12”, Dassault
Systems Simulia Corp., Providence, RI, USA. BS EN 1993-1-5 (2006), “Eurocode 3: design of steel structures, part 1–5: plated
structural elements”, BSI, London, UK Cheng, J.J.R., Yura, J.A., and Johnson, C.P. (1984), “Design and behaviour of coped
beams”, Phil M. Ferguson Structural Engineering Laboratory Rep. No. 84-1, Univ. of
Texas at Austin, Austin, Tex, USA. Cheng, J.J.R. and Yura, J.A. (1986), “Local web buckling of coped beams", J. Struct.
Eng., ASCE, 112(10), 2314-2331. Gupta, A.K. (1984), “Buckling of coped steel beams”, J. Struct. Eng., ASCE,
110(9):1977–1987. Ibrahim, S. A., A. K. Dessouki and S. A. El-Sa'eed (2015), “Lateral buckling behaviour
and strengthening techniques of coped steel I-beams”, J. Constr. Steel Res., 108: 11-22.
Milek, W.A. (1980), “A cautionary note on beam copes”, Eng. J.; 17(3):72–73. Yam, M.C.H., Lam, A.C.C., Iu, V.P. and Cheng, J.J.R. (2003), “Local web buckling
strength of coped steel I beams”, J. Struct. Eng., ASCE, 129(1), 3-11. Yam, M.C.H., Fang, C., Lam, A.C.C. and Cheng, J.J.R. (2014), “Local failures of coped
steel beams-A state-of-the-art review”, J. Constr. Steel Res., 102, 217-232.


![[10] Buckling and Ultimate Strength](https://static.documents.pub/doc/80x56/577cdce11a28ab9e78aba484/10-buckling-and-ultimate-strength.jpg)


