2544 VOLUME 125 MONTHLY WEATHER REVIEW q 1997 American Meteorological Society A Numerical Study of the Along-Line Variability of a Frontal Squall Line during PRE-STORM STE ´ PHANE BE ´ LAIR Recherche en Pre ´vision Nume ´rique, Environment Canada, Dorval, Quebec, Canada DA-LIN ZHANG Department of Meteorology, University of Maryland, College Park, Maryland (Manuscript received 5 February 1996, in final form 4 March 1997) ABSTRACT Despite considerable progress in the understanding of two-dimensional structures of squall lines, little attention has been paid to the along-line variability of these convective systems. In this study, the roles of meso- and larger-scale circulations in the generation of along-line variability of squall lines are investigated, using an 18-h prediction of a frontal squall line that occurred on 26–27 June 1985 during PRE-STORM (Preliminary Regional Experiment for Stormscale Operational Research Meteorology). It is shown that the Canadian regional finite- element (RFE) model reproduces reasonably well a number of surface and vertical circulation structures of the squall system, as verified against available network observations. These include the initiation, propagation, and dissipation of the squall system, surface pressure perturbations, and cold outflow boundaries; a midlevel mesolow and an upper-level mesohigh; a front-to-rear (FTR) ascending flow overlying an intense rear-to-front (RTF) flow; and a leading convective line followed by stratiform precipitation regions. It is found that across-line circulations at the northern segment of the squall line differ significantly from those at its southern segment, including the different types of precipitation, the absence of the RTF flow and midlevel mesolow, and the early dissipation of organized convection in the northern part. The along-line vari- ability of the squall’s circulations results primarily from the interaction of convectively generated perturbations with a midlevel baroclinic trough. The large-scale trough provides an extensive RTF flow component in the southern portion of the squall system and an FTR flow component in the north, whereas the midlevel mesolow tends to enhance the RTF flow to the south and the FTR flow to the north of the mesolow during the mature to decaying stages. The along-line variability of the squall’s circulations appears to be partly responsible for the generation of different weather conditions along the line, such as the development of an upper-level stratiform region in the southern segment and a midlevel cloud region in the northern portion of the squall line. 1. Introduction Considerable progress has been made in recent years on the understanding of two-dimensional structures and evolution of midlatitude squall lines. These mesoscale convective systems (MCSs) often exhibit a line of deep convection, followed by a region of stratiform precip- itation (e.g., Ogura and Liou 1980; Smull and Houze 1985, 1987; Johnson and Hamilton 1988; Biggerstaff and Houze 1991a). Their internal flow structures are characterized by a front-to-rear (FTR) ascending current of higher equivalent potential temperature u e air over- lying an elevated or descending rear-to-front (RTF) flow of low-u e air (e.g., Moncrieff 1981; Smull and Houze 1985, 1987; Rutledge et al. 1988; Zhang and Gao 1989). Corresponding author address: Dr. Da-Lin Zhang, Department of Meteorology, University of Maryland, College Park, MD 20742- 2425. E-mail: [email protected]. Midlevel mesovortices or intense cyclonic vorticity con- centrations (Stirling and Wakimoto 1989; Brandes 1990; Bartels and Maddox 1991; Biggerstaff and Houze 1991b; Zhang 1992), as well as midlevel mesolows (Zhang and Gao 1989; Biggerstaff and Houze 1991a; Lin and Johnson 1994) and upper-level mesohighs (Zhang and Gao 1989; Gallus and Johnson 1992), have been found to develop in the trailing stratiform regions. Most of these features, organized on the meso-b-scale (i.e., order of 20–200 km; Orlanski 1975), have been summarized in the conceptual model of squall lines by Houze et al. (1989). In contrast, much less attention has been paid to the along-line variability of squall’s internal structures, due partly to the limited area of high-resolution observations and partly to the limited capability of numerical weather prediction (NWP) models to resolve multiscale circu- lations. Recently, the variability of rear inflow jets has been the subject of a few studies. For instance, previous studies showed that the variation of rear inflow intensity
Transcript
2544 VOLUME 125M O N T H L Y W E A T H E R R E V I E W
q 1997 American Meteorological Society
A Numerical Study of the Along-Line Variability of a Frontal Squall Line duringPRE-STORM
STEPHANE BELAIR
Recherche en Prevision Numerique, Environment Canada, Dorval, Quebec, Canada
DA-LIN ZHANG
Department of Meteorology, University of Maryland, College Park, Maryland
(Manuscript received 5 February 1996, in final form 4 March 1997)
ABSTRACT
Despite considerable progress in the understanding of two-dimensional structures of squall lines, little attentionhas been paid to the along-line variability of these convective systems. In this study, the roles of meso- andlarger-scale circulations in the generation of along-line variability of squall lines are investigated, using an 18-hprediction of a frontal squall line that occurred on 26–27 June 1985 during PRE-STORM (Preliminary RegionalExperiment for Stormscale Operational Research Meteorology). It is shown that the Canadian regional finite-element (RFE) model reproduces reasonably well a number of surface and vertical circulation structures of thesquall system, as verified against available network observations. These include the initiation, propagation, anddissipation of the squall system, surface pressure perturbations, and cold outflow boundaries; a midlevel mesolowand an upper-level mesohigh; a front-to-rear (FTR) ascending flow overlying an intense rear-to-front (RTF) flow;and a leading convective line followed by stratiform precipitation regions.
It is found that across-line circulations at the northern segment of the squall line differ significantly fromthose at its southern segment, including the different types of precipitation, the absence of the RTF flow andmidlevel mesolow, and the early dissipation of organized convection in the northern part. The along-line vari-ability of the squall’s circulations results primarily from the interaction of convectively generated perturbationswith a midlevel baroclinic trough. The large-scale trough provides an extensive RTF flow component in thesouthern portion of the squall system and an FTR flow component in the north, whereas the midlevel mesolowtends to enhance the RTF flow to the south and the FTR flow to the north of the mesolow during the matureto decaying stages. The along-line variability of the squall’s circulations appears to be partly responsible for thegeneration of different weather conditions along the line, such as the development of an upper-level stratiformregion in the southern segment and a midlevel cloud region in the northern portion of the squall line.
1. Introduction
Considerable progress has been made in recent yearson the understanding of two-dimensional structures andevolution of midlatitude squall lines. These mesoscaleconvective systems (MCSs) often exhibit a line of deepconvection, followed by a region of stratiform precip-itation (e.g., Ogura and Liou 1980; Smull and Houze1985, 1987; Johnson and Hamilton 1988; Biggerstaffand Houze 1991a). Their internal flow structures arecharacterized by a front-to-rear (FTR) ascending currentof higher equivalent potential temperature ue air over-lying an elevated or descending rear-to-front (RTF) flowof low-ue air (e.g., Moncrieff 1981; Smull and Houze1985, 1987; Rutledge et al. 1988; Zhang and Gao 1989).
Corresponding author address: Dr. Da-Lin Zhang, Department ofMeteorology, University of Maryland, College Park, MD 20742-2425.E-mail: [email protected].
Midlevel mesovortices or intense cyclonic vorticity con-centrations (Stirling and Wakimoto 1989; Brandes 1990;Bartels and Maddox 1991; Biggerstaff and Houze1991b; Zhang 1992), as well as midlevel mesolows(Zhang and Gao 1989; Biggerstaff and Houze 1991a;Lin and Johnson 1994) and upper-level mesohighs(Zhang and Gao 1989; Gallus and Johnson 1992), havebeen found to develop in the trailing stratiform regions.Most of these features, organized on the meso-b-scale(i.e., order of 20–200 km; Orlanski 1975), have beensummarized in the conceptual model of squall lines byHouze et al. (1989).
In contrast, much less attention has been paid to thealong-line variability of squall’s internal structures, duepartly to the limited area of high-resolution observationsand partly to the limited capability of numerical weatherprediction (NWP) models to resolve multiscale circu-lations. Recently, the variability of rear inflow jets hasbeen the subject of a few studies. For instance, previousstudies showed that the variation of rear inflow intensity
OCTOBER 1997 2545B E L A I R A N D Z H A N G
could be related to convectively induced midlevel me-solows (Smull and Houze 1987) or mesovortices (Zhang1992); namely, it is stronger (weaker or absent) to thesouth (north) of a midlevel mesovortex. Thus, Zhang(1992) postulated to visualize the midlevel mesoscalerear inflow jet as part of the vortex circulation. Davisand Weisman (1994) and Skamarock et al. (1994) sim-ulated squall lines that exhibit asymmetric circulationsin the vicinity of mesovortices when the effect of earthrotation is included. Such three-dimensional flow struc-tures even arise at the convective scale, as demonstratedby Weisman (1993), in which rear inflow jets are en-hanced in the middle of a convective bow-echo line dueto the development of meso-g-scale (i.e., order of 2–20km; Orlanski 1975) vortices at the ends of the line (i.e.,bookend vortices). Klimowski (1994) noted from dual-Doppler analyses that the rear inflow jet is stronger inregions of high-reflectivity cores, confirming the im-portance of convective-scale forcing.
Similarly, little attention has been paid to the role oflarge-scale flows, which normally influence the devel-opment and organization of deep convection alongsquall lines. In particular, squall lines often occur in thevicinity of midlevel short-wave troughs or upper-leveljet streams (e.g., Ogura and Liou 1980; Srivastava etal. 1986; Leary and Rappaport 1987; Johnson and Ham-ilton 1988; Carbone et al. 1990). Thus, we should expectthat the internal circulation structure of squall lines mayvary, depending on their location with respect to thelarge-scale disturbances. For instance, the circulation ofa squall line that develops at the base of a baroclinictrough, where the RTF ambient flow is stronger, coulddiffer from that of a squall line that occurs to the northof the base or ahead of the trough. In this regard, Zhangand Gao (1989) showed the importance of a large-scaleRTF flow component associated with an upper-level jetstream prior to the development of the 10–11 June 1985PRE-STORM (Preliminary Regional Experiment forSTORM-Central; see Cunning 1986) squall line. Thishas been recently confirmed by Yang and Houze (1995)and Gallus and Johnson (1995), who could only simulatehalf of the RTF flow intensity associated with the 10–11 June squall system, without inclusion of the large-scale forcing in their model initial conditions. In othercases, however, such a large-scale support may be lessobvious, particularly for mesoscale convective systems(MCSs) in which rear inflows are weak and less exten-sive (see Smull and Houze 1987). Nevertheless, evenwithin a single linear squall system with a length scaleof several hundred kilometers, the vertical circulationat one location would differ from that at other locationswhen it is embedded in a large-scale curved flow.
The purpose of the current study is to address theroles of meso- and larger-scale circulations in the gen-eration of variable (meso-b-scale) internal structures(e.g., FTR and RTF flows, mesolows and mesohighs,stratiform regions) within midlatitude squall lines, usingan 18-h simulation of a frontal squall system that oc-
curred on 26–27 June 1985 during PRE-STORM. Thissquall system has been documented by Trier et al. (1991)and Lin and Johnson (1994). They showed that thesquall line, having a length scale of 1500–1800 km,developed ahead of a surface cold front with a pro-nounced baroclinic trough aloft. Their analyses also re-vealed the development of an upper-level stratiform re-gion at the rear of the squall system, with classic two-dimensional flow structures as described earlier. More-over, Lin and Johnson (1994) noted two different typesof RTF flows: an elevated one that intensified in re-sponse to the development of a midlevel mesolow(Smull and Houze 1987) and a surface-based one thatwas related to the cold frontal circulation. These twoobservational analyses provide useful information onthe understanding and model verification of the 26–27June squall system for the current study. They are, how-ever, limited to only the southern segment of the squallsystem that was covered by the PRE-STORM network.It remains uncertain whether similar across-line circu-lations would develop at the northern segment of thesquall line. If not, what are the roles of the meso- andlarger-scale circulations in determining the different in-ternal structures of the squall system? Thus, the primaryobjectives of this study are to 1) examine the mesoscalepredictability of variable meso-b-scale circulations ofthe 26–27 June 1985 squall line using a high-resolutionresearch version of the Canadian regional finite-element(RFE) model, 2) investigate the along-line variability oforganized deep convection and the squall’s internalstructures, and 3) clarify the multiscale interactions in-volved in the development of rear inflow and FTR flowsin the current squall line.
The presentation of the results is organized as follows.The next section discusses briefly the main features ofthe RFE model and the initial conditions. Section 3provides verification of the 18-h model predictionagainst available observations and examines the two-dimensional vertical structure of the squall line. Section4 describes the model results that are related to thealong-line variability of the organized convection, aswell as its associated prestorm environment. In sections5 and 6, we investigate the along-line variability of themeso-b-scale structures and weather conditions of thesimulated squall system due to meso- and larger-scalecirculations, respectively. A summary and concludingremarks are given in the final section.
2. Model description and initial conditions
An improved version of the RFE model is used forthis study, with a high-resolution uniform grid intervalof 25 km over the central domain covering most of theUnited States and southern Canada; outside this centraldomain, the grid size increases by a constant factor(;14%) in every direction until the equator is reached(see Fig. 1). Table 1 summarizes the basic model fea-tures; they are the same as those used in Belair et al.
2546 VOLUME 125M O N T H L Y W E A T H E R R E V I E W
FIG. 1. Portion of the 195 3 185 hemispheric variable grid meshprojected on a polar stereographic plane. The heavy rectangle indi-cates the central uniform high-resolution domain of 25 km with thegrid size increasing by constant amplification factors A in every di-rection.
TABLE 1. Summary of the mesoscale RFE model.
Numerics● 3D, hydrostatic, primitive equations● Semi-implicit time discretization● Semi-Lagrangian scheme for three-dimensional advection (time
step: 300 s)● Linear finite elements in (x, y, s)● Variable horizontal resolution grid overlaid on a polar stereograph-
ic projection (25 km in fine mesh grid)● 19 s levels with high resolution in the lowest 150 hPa● Second-order horizontal diffusion for temperature, vorticity, and
divergence● 0.58 orography field
Physics● Planetary boundary layer (PBL) based on turbulent kinetic energy● Diagnostic PBL height● Implicit vertical diffusion● Surface energy budget based on force–restore method● Diurnal cycle with solar and infrared fluxes at the ground modu-
lated by clouds● Infrared and solar radiation fluxes calculated at all levels● Diagnostic cloud cover● Fritsch–Chappell scheme for parameterized moist convection● Explicit moisture scheme containing prognostic equations for cloud
water (ice) and rainwater (snow)
FIG. 2. Model initial conditions: Sea level pressure (solid, every 2hPa) superposed with the surface wind vectors and temperature(dashed, every 48C) at 1200 UTC 26 June 1985. The surface frontalpositions are determined from the detailed surface analysis of Trieret al. (1991).
(1994, 1995). Briefly, the RFE model incorporates amodified version of the Fritsch and Chappell (1980;hereafter referred to as FC) convective parameterizationscheme (Zhang and Fritsch 1986), which is coupled withan explicit moisture scheme predicting cloud water (ice)and rainwater (snow) (Hsie et al. 1984; Dudhia 1989;Zhang 1989). This version of the model is similar tothat used operationally at the Canadian MeteorologicalCenter (CMC), except for the above physics packageand the high-resolution grid length. The model is ini-tialized at 1200 UTC 26 June 1985 with conventionalmeteorological observations using the same proceduresas those described in Belair et al. (1994). No supple-mentary data were treated for the model initialization,since the PRE-STORM network did not collect detailedobservations until 1800 UTC 26 June when the squallline under study was initiated.
At the model’s initial time, a large-scale surface coldfront extends from western Texas to western Ontario,with a low pressure zone located over western centralKansas (see Fig. 2). The surface circulation shows ananticyclonic northerly cold current associated with thehigh pressure center over Wyoming and a warm moistsoutherly flow ahead of the cold front; the two air cur-rents converge along the front. As will be shown insection 4, the prefrontal environment is conditionallyunstable, with convective available potential energy(CAPE) of approximately 2500 J kg21 (see Fig. 11).This prefrontal environment, in conjunction with ther-mally direct circulations associated with frontogenesis(Trier et al. 1991), provides favorable conditions for thedevelopment of deep convection 6 h later. At 500 hPa,a large-amplitude baroclinic trough corresponding to the
OCTOBER 1997 2547B E L A I R A N D Z H A N G
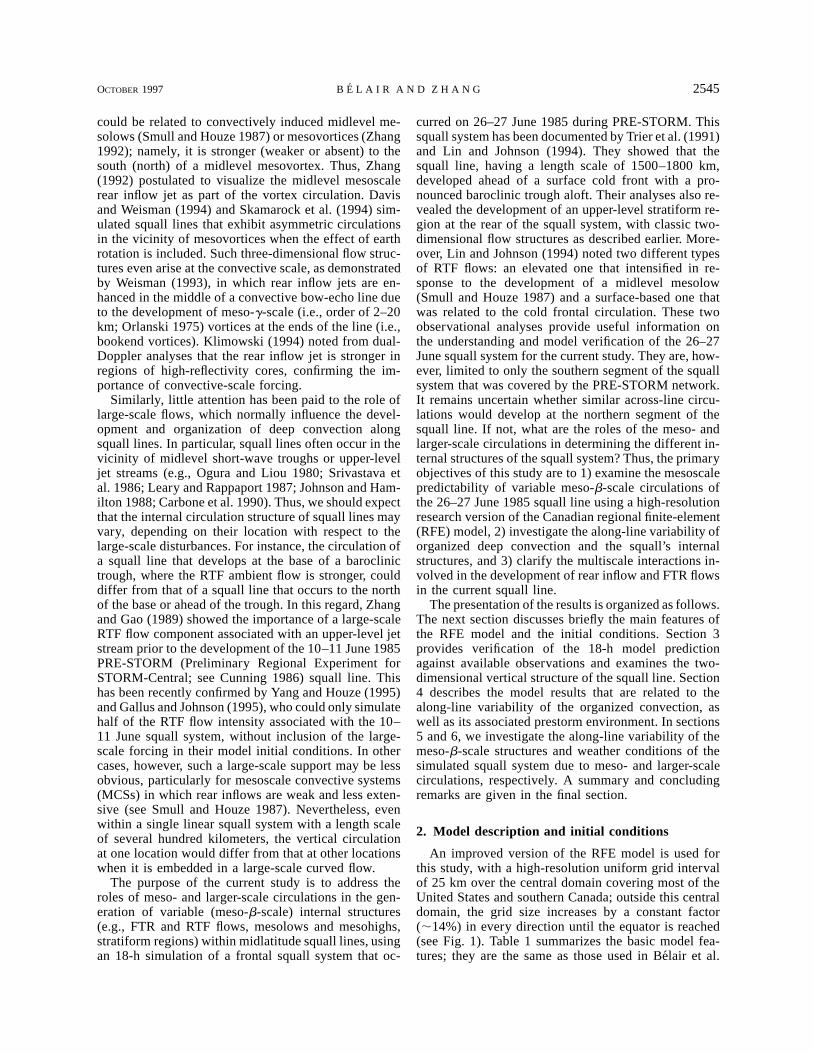
FIG. 3. As in Fig. 2 but for 500-hPa geopotential height (solid,every 6 dam) and temperature (dashed, every 48C), superposed withhorizontal wind vectors.
surface front is present (Fig. 3), with the base of thetrough located just upstream of the PRE-STORM net-work (i.e., over Kansas and Oklahoma). Note that themidlevel flow associated with the trough is nearly equiv-alent barotropic, whereas the prefrontal flow is nearlybarotropic (i.e., having little gradient). For additionaldetails on the environmental conditions, the reader isreferred to Trier et al. (1991).
3. Model verification
Before examining the variable internal structures ofthe 26–27 June squall line, it is important to ensure thatthe RFE model reproduces reasonably well the basicstructures and evolution of the system as verified againstall available observations. In this section, radar sum-maries, rawinsonde observations, Doppler data, satelliteimagery, and surface analyses are used to help validatethe model prediction and describe the general evolutionof the squall system. In the following subsections, weverify the prediction of surface features, including pre-cipitation, area of organized convection, sea level pres-sure, and temperature fields, and then investigate thepredicted tropospheric structures of the squall system.
a. Surface features
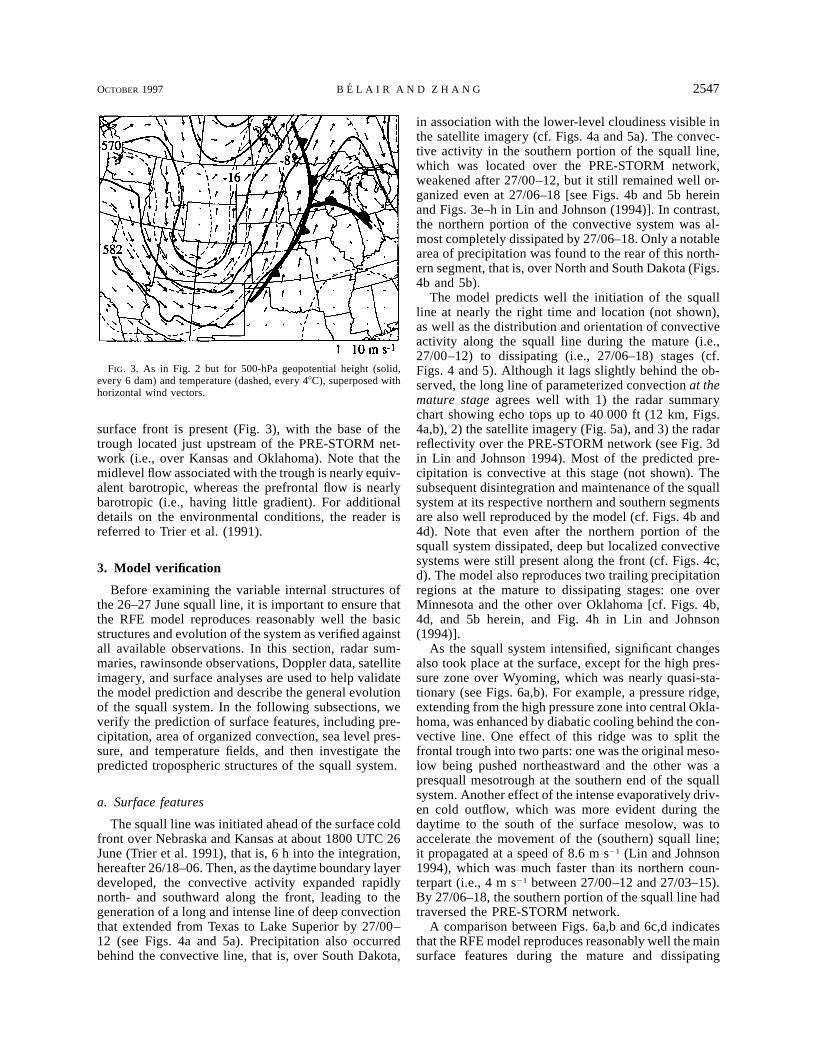
The squall line was initiated ahead of the surface coldfront over Nebraska and Kansas at about 1800 UTC 26June (Trier et al. 1991), that is, 6 h into the integration,hereafter 26/18–06. Then, as the daytime boundary layerdeveloped, the convective activity expanded rapidlynorth- and southward along the front, leading to thegeneration of a long and intense line of deep convectionthat extended from Texas to Lake Superior by 27/00–12 (see Figs. 4a and 5a). Precipitation also occurredbehind the convective line, that is, over South Dakota,
in association with the lower-level cloudiness visible inthe satellite imagery (cf. Figs. 4a and 5a). The convec-tive activity in the southern portion of the squall line,which was located over the PRE-STORM network,weakened after 27/00–12, but it still remained well or-ganized even at 27/06–18 [see Figs. 4b and 5b hereinand Figs. 3e–h in Lin and Johnson (1994)]. In contrast,the northern portion of the convective system was al-most completely dissipated by 27/06–18. Only a notablearea of precipitation was found to the rear of this north-ern segment, that is, over North and South Dakota (Figs.4b and 5b).
The model predicts well the initiation of the squallline at nearly the right time and location (not shown),as well as the distribution and orientation of convectiveactivity along the squall line during the mature (i.e.,27/00–12) to dissipating (i.e., 27/06–18) stages (cf.Figs. 4 and 5). Although it lags slightly behind the ob-served, the long line of parameterized convection at themature stage agrees well with 1) the radar summarychart showing echo tops up to 40 000 ft (12 km, Figs.4a,b), 2) the satellite imagery (Fig. 5a), and 3) the radarreflectivity over the PRE-STORM network (see Fig. 3din Lin and Johnson 1994). Most of the predicted pre-cipitation is convective at this stage (not shown). Thesubsequent disintegration and maintenance of the squallsystem at its respective northern and southern segmentsare also well reproduced by the model (cf. Figs. 4b and4d). Note that even after the northern portion of thesquall system dissipated, deep but localized convectivesystems were still present along the front (cf. Figs. 4c,d). The model also reproduces two trailing precipitationregions at the mature to dissipating stages: one overMinnesota and the other over Oklahoma [cf. Figs. 4b,4d, and 5b herein, and Fig. 4h in Lin and Johnson(1994)].
As the squall system intensified, significant changesalso took place at the surface, except for the high pres-sure zone over Wyoming, which was nearly quasi-sta-tionary (see Figs. 6a,b). For example, a pressure ridge,extending from the high pressure zone into central Okla-homa, was enhanced by diabatic cooling behind the con-vective line. One effect of this ridge was to split thefrontal trough into two parts: one was the original meso-low being pushed northeastward and the other was apresquall mesotrough at the southern end of the squallsystem. Another effect of the intense evaporatively driv-en cold outflow, which was more evident during thedaytime to the south of the surface mesolow, was toaccelerate the movement of the (southern) squall line;it propagated at a speed of 8.6 m s21 (Lin and Johnson1994), which was much faster than its northern coun-terpart (i.e., 4 m s21 between 27/00–12 and 27/03–15).By 27/06–18, the southern portion of the squall line hadtraversed the PRE-STORM network.
A comparison between Figs. 6a,b and 6c,d indicatesthat the RFE model reproduces reasonably well the mainsurface features during the mature and dissipating
2548 VOLUME 125M O N T H L Y W E A T H E R R E V I E W
FIG. 4. Left panels show radar summary charts at (a) 0000 UTC and (b) 0600 UTC 27 June 1985. Rightpanels show the predicted grid-scale (dashed) and parameterized (shaded) rainfall rates with contours of 1and 5 mm h21 from (c) 12-h (27/00–12) and (d) 18-h (27/06–18) integrations.
stages, such as the low and high pressure centers overIowa and Wyoming, the presquall mesotrough, and thecold outflow boundary. The model also captures rea-sonably well the orientation and propagation of thesquall front (9 and 4 m s21 for the southern and northernsegments, respectively), which are strongly influencedby parameterized moist downdrafts in the FC scheme.The predicted squall front, however, exhibits a littleweaker intensity than the observed at the formativestage, thereby causing the slightly slower movement ofthe gust front, especially for the southern segment ofthe squall system. The weaker intensity appears to becaused partly by the (38–48C) underprediction of surfacetemperature in the cloud-free region ahead of the coldfront and partly by the less cold downdraft air in theFC parameterization.
It should be mentioned that there are several otherdeficiencies with the 18-h model prediction. For ex-ample, the model appears to have delayed the precipi-
tation production over Arkansas by 6 h; similar resultswere obtained for the precipitation over North and SouthDakota (see Fig. 4). Due to its relatively coarse gridsize, the model is unable to resolve some small-scalefeatures, such as the multiple convective lines and theirassociated pressure perturbations ahead of the surfacefront as described in Trier et al. (1991). Nevertheless,the above results show that the RFE model capturesreasonably well the main features of the squall line, andit can therefore be used in the following sections toinvestigate some meso-b-scale structures of the systemand the mechanisms responsible for the along-line vari-ability of the squall’s internal circulations.
b. Tropospheric structures
It is apparent from Fig. 7 that the model could re-produce well some typical meso-b-scale structures ofthe squall line during the mature and dissipating stages.
OCTOBER 1997 2549B E L A I R A N D Z H A N G
FIG. 5. Satellite infrared imagery at (a) 0000 UTC and (b) 0600 UTC 27 June 1985.
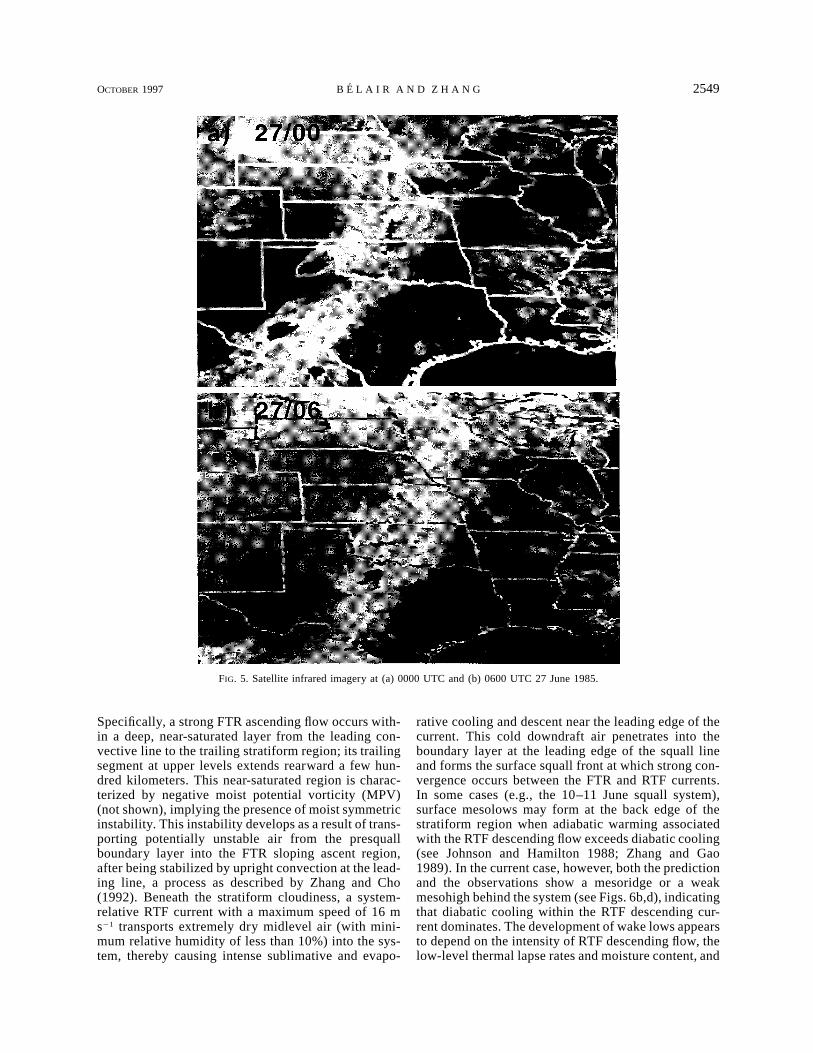
Specifically, a strong FTR ascending flow occurs with-in a deep, near-saturated layer from the leading con-vective line to the trailing stratiform region; its trailingsegment at upper levels extends rearward a few hun-dred kilometers. This near-saturated region is charac-terized by negative moist potential vorticity (MPV)(not shown), implying the presence of moist symmetricinstability. This instability develops as a result of trans-porting potentially unstable air from the presquallboundary layer into the FTR sloping ascent region,after being stabilized by upright convection at the lead-ing line, a process as described by Zhang and Cho(1992). Beneath the stratiform cloudiness, a system-relative RTF current with a maximum speed of 16 ms21 transports extremely dry midlevel air (with mini-mum relative humidity of less than 10%) into the sys-tem, thereby causing intense sublimative and evapo-
rative cooling and descent near the leading edge of thecurrent. This cold downdraft air penetrates into theboundary layer at the leading edge of the squall lineand forms the surface squall front at which strong con-vergence occurs between the FTR and RTF currents.In some cases (e.g., the 10–11 June squall system),surface mesolows may form at the back edge of thestratiform region when adiabatic warming associatedwith the RTF descending flow exceeds diabatic cooling(see Johnson and Hamilton 1988; Zhang and Gao1989). In the current case, however, both the predictionand the observations show a mesoridge or a weakmesohigh behind the system (see Figs. 6b,d), indicatingthat diabatic cooling within the RTF descending cur-rent dominates. The development of wake lows appearsto depend on the intensity of RTF descending flow, thelow-level thermal lapse rates and moisture content, and
2550 VOLUME 125M O N T H L Y W E A T H E R R E V I E W
FIG. 6. Left panels show sea level pressure (solid, every 2 hPa) and surface temperature (dashed, every48C) at (a) 0000 UTC and (b) 0600 UTC 27 June 1985. Right panels show the corresponding fields from (c)12-h (27/00–12) and (d) 18-h (27/06–18) integrations. Shadings show the predicted parameterized convectiverainfall rates with contours of 1 and 5 mm h21. Cold-frontal symbols with double dots indicate outflowboundaries.
the propagation of a squall system, as well as the in-tensity of large-scale baroclinicity.
The above circulations compare favorably to the 2Drepresentations of the squall system analyzed by Trieret al. (1991) and Lin and Johnson (1994). For instance,the Doppler radar analysis by Trier et al. (1991) showsthe existence of a well-developed couplet of FTR andRTF currents as early as 27/00–12 (see their Fig. 21).Similar flow structures were observed by the PRE-STORM upper-air network (see Figs. 4 and 9 in Linand Johnson 1994). However, Lin and Johnson’s anal-ysis shows that 1) the midlevel RTF flow was very weak
during the mature stage (i.e., 27/00–12) and strong atlater stages when a midlevel mesolow formed, and 2)the rear inflow jet never extended forward into the lead-ing convective line, as it did in the RFE prediction (seeFig. 7). These discrepancies, particularly for the de-scending portion of the RTF flow, appear to be attrib-utable partly to the limited resolution of rawinsondeobservations and partly to the along-line averaginglength scale (about 300 km) they used.
Figure 8 compares the predicted geopotential heightsand horizontal winds at 700 hPa to the observed duringthe system’s dissipating stages. The RFE model captures
OCTOBER 1997 2551B E L A I R A N D Z H A N G
FIG. 7. Vertical cross section of relative humidity (solid, every10%), superposed with line-normal relative flow vectors, taken from18-h integration (27/06–18) along line A (through the south segment)given in Fig. 4d. Thick dashed line denotes the precipitable watercontour of 0.1 g kg 21. Letters ‘‘D’’ and ‘‘M’’ indicate dry and moistcenters, respectively. FIG. 9. Portion of returned amplitude vs wavelength (km) by the
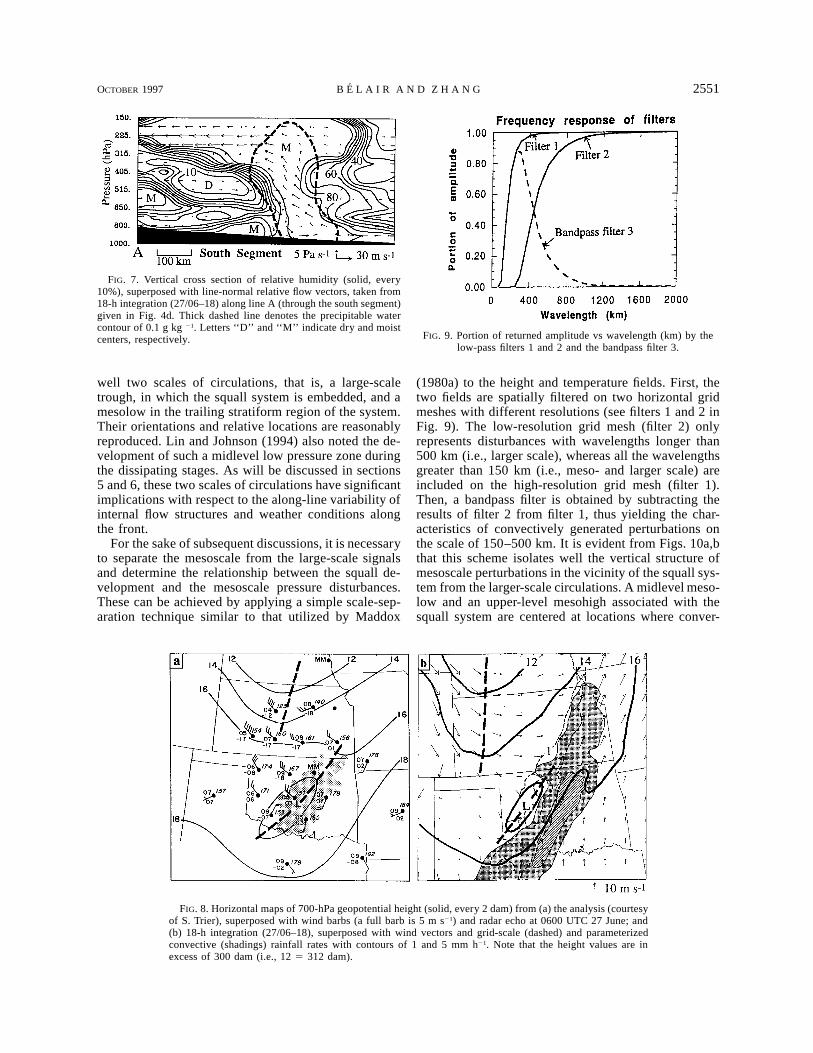
low-pass filters 1 and 2 and the bandpass filter 3.
FIG. 8. Horizontal maps of 700-hPa geopotential height (solid, every 2 dam) from (a) the analysis (courtesyof S. Trier), superposed with wind barbs (a full barb is 5 m s21) and radar echo at 0600 UTC 27 June; and(b) 18-h integration (27/06–18), superposed with wind vectors and grid-scale (dashed) and parameterizedconvective (shadings) rainfall rates with contours of 1 and 5 mm h21. Note that the height values are inexcess of 300 dam (i.e., 12 5 312 dam).
well two scales of circulations, that is, a large-scaletrough, in which the squall system is embedded, and amesolow in the trailing stratiform region of the system.Their orientations and relative locations are reasonablyreproduced. Lin and Johnson (1994) also noted the de-velopment of such a midlevel low pressure zone duringthe dissipating stages. As will be discussed in sections5 and 6, these two scales of circulations have significantimplications with respect to the along-line variability ofinternal flow structures and weather conditions alongthe front.
For the sake of subsequent discussions, it is necessaryto separate the mesoscale from the large-scale signalsand determine the relationship between the squall de-velopment and the mesoscale pressure disturbances.These can be achieved by applying a simple scale-sep-aration technique similar to that utilized by Maddox
(1980a) to the height and temperature fields. First, thetwo fields are spatially filtered on two horizontal gridmeshes with different resolutions (see filters 1 and 2 inFig. 9). The low-resolution grid mesh (filter 2) onlyrepresents disturbances with wavelengths longer than500 km (i.e., larger scale), whereas all the wavelengthsgreater than 150 km (i.e., meso- and larger scale) areincluded on the high-resolution grid mesh (filter 1).Then, a bandpass filter is obtained by subtracting theresults of filter 2 from filter 1, thus yielding the char-acteristics of convectively generated perturbations onthe scale of 150–500 km. It is evident from Figs. 10a,bthat this scheme isolates well the vertical structure ofmesoscale perturbations in the vicinity of the squall sys-tem from the larger-scale circulations. A midlevel meso-low and an upper-level mesohigh associated with thesquall system are centered at locations where conver-
2552 VOLUME 125M O N T H L Y W E A T H E R R E V I E W
FIG. 10. As in Fig. 7 but for (a) mesoscale height perturbations(every 5 dam); and (b) temperature perturbations (every 0.58C). Solid(dashed) lines are positive (negative) values. Letters ‘‘L’’ and ‘‘H,’’‘‘W’’ and ‘‘C’’ denote the centers of the mesolow and mesohigh,warming, and cooling, respectively.
gence and divergence are maximized, respectively. Ap-parently, the midlevel mesolow is hydrostatically pro-duced by net warming in the FTR ascending flow andevaporative–sublimative cooling in the RTF descendingflow, with its center situated at the interface betweenthe warming above and cooling below, as has also beenfound by Zhang and Gao (1989) and Braun and Houze(1994). In contrast, the upper-level mesohigh is pro-duced by the net adiabatic and parameterized detrain-ment cooling above the intense updrafts and the netwarming below. Such an upper-level mesohigh has beenfrequently observed (e.g., Fritsch and Maddox 1981a;Fritsch and Brown 1982; Maddox et al. 1981; Gallusand Johnson 1992) and simulated by other NWP models(e.g., Fritsch and Maddox 1981b; Gao et al. 1990). Thisfeature can also be seen from the analysis of Lin andJohnson (1994).
4. Along-line variability of deep convection
We have seen from Figs. 4 through 6 that the southernand northern segments of the squall line differ signifi-cantly in the longevity and organization of deep con-vection. The convective activity remained well orga-nized in the southern segment at 27/06–18, but it dis-sipated shortly after 27/00–12 for the northern part.Thus, it is desirable to study first the along-line vari-ability of organized deep convection before discussingthe variable meso-b-scale circulations of the squall sys-tem. Previous observational studies have also noted thealong-line variability of convective initiation, internalstructures, intensity, and movements of squall lines
(e.g., Newton and Fankhauser 1964; Hane et al. 1987).With the present 25-km grid size, it is impossible toinvestigate the along-line variability of convective cellsas well as their interactions with prestorm environments.However, it is appropriate to examine the collective ini-tiation of deep convection and its mesoscale organiza-tion using the model prediction, since the RFE modelwith the FC scheme reproduces very well the integraleffects of deep convection along the squall line. In theFC convective scheme, parameterized convection istriggered when 1) grid-scale upward motion is strongenough to lift a parcel from the boundary layer to thelevel of free convection, and 2) the atmospheric columnin which the parcel is lifted is conditionally unstable.With the FC scheme, NWP models have been shown tobe capable of reproducing the development of manymeso-b-scale structures of MCSs (e.g., Zhang andFritsch 1986, 1988; Zhang and Gao 1989; Zheng et al.1995).
To help understand the along-line variability of or-ganized deep convection, Figs. 11a, b show two com-posite presquall soundings at the respective southern andnorthern segments prior to the squall system’s disinte-gration (i.e., 27/00–12). Here, the two composite sound-ings are generally similar in character, both exhibitinga well-developed daytime boundary layer, small con-vective inhibition (CIN), large CAPE, weak to negativevertical shears normal to the line in the lowest 200 hPa,and a high level of equilibrium temperature (i.e., 160hPa). Although the well-mixed boundary layer in thenorth is slightly shallower, the general presquall ther-modynamic conditions do not appear to cause the earlydissipation of the northern convective activity. In fact,the CAPE in the north segment (3300 J kg21) is greaterthan that in the south (2500 J kg21), and the CIN isrelatively smaller (cf. Figs. 11a,b), indicating that thetriggering and organization of deep convection shouldbe less constrained to the north if other conditions areidentical. Furthermore, the modeled gridpoint soundingsare still conditionally unstable even over the dissipatedconvective region to the north at later times (not shown).It is quite possible that the interaction of convective-scale downdrafts with prefrontal wind shear may be lessfavorable for organized development (Rotunno et al.1988). This does not seem to be the case on the currentgrid scale (25 km), since the model with the parame-terized convection, in which such an interactive processis not included, reproduces well the dissipation of deepconvection in the north.
An examination of the grid-scale forcing reveals thatthe longevity and organization of parameterized deepconvection are determined more by the convergence inthe boundary layer where deep convection is rooted.Specifically, the convergence is more intense along thesouthern portion of the squall system where the diver-gent cold current, enhanced by convectively generatedcold downdrafts, meets the southerly flow along the coldfront (see Fig. 12), making the initiation of parameter-
OCTOBER 1997 2553B E L A I R A N D Z H A N G
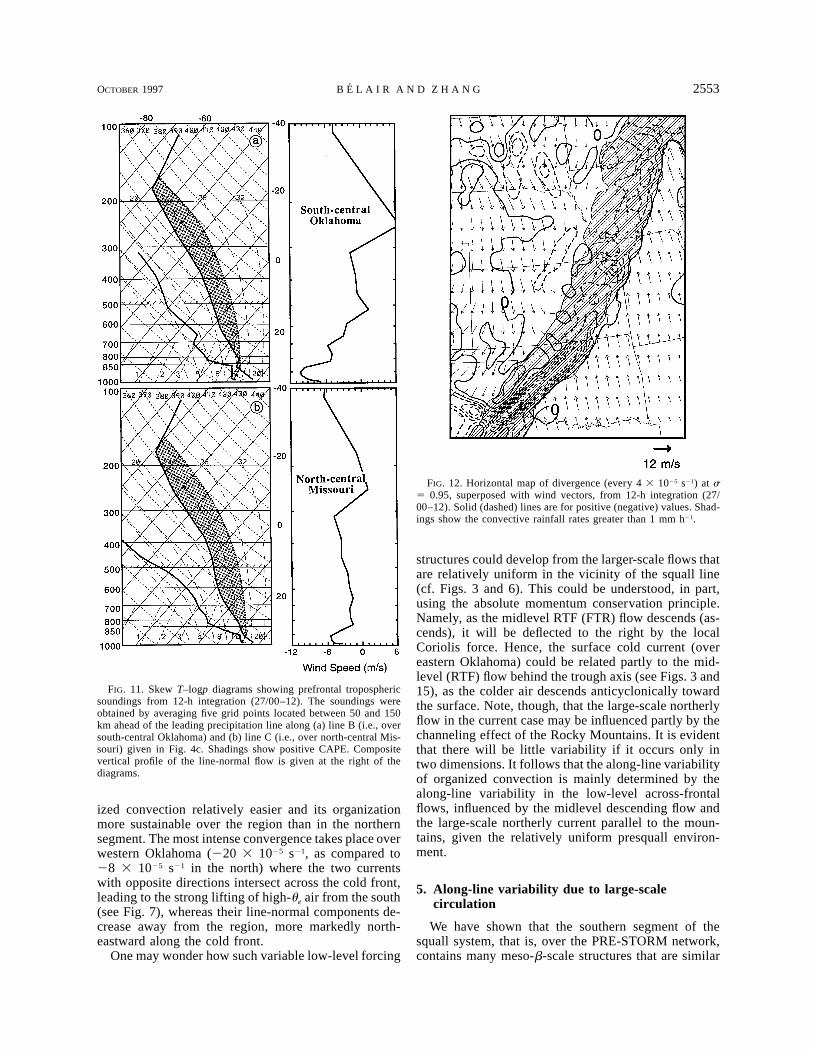
FIG. 11. Skew T–logp diagrams showing prefrontal troposphericsoundings from 12-h integration (27/00–12). The soundings wereobtained by averaging five grid points located between 50 and 150km ahead of the leading precipitation line along (a) line B (i.e., oversouth-central Oklahoma) and (b) line C (i.e., over north-central Mis-souri) given in Fig. 4c. Shadings show positive CAPE. Compositevertical profile of the line-normal flow is given at the right of thediagrams.
FIG. 12. Horizontal map of divergence (every 4 3 1025 s21) at s5 0.95, superposed with wind vectors, from 12-h integration (27/00–12). Solid (dashed) lines are for positive (negative) values. Shad-ings show the convective rainfall rates greater than 1 mm h21.
ized convection relatively easier and its organizationmore sustainable over the region than in the northernsegment. The most intense convergence takes place overwestern Oklahoma (220 3 1025 s21, as compared to28 3 1025 s21 in the north) where the two currentswith opposite directions intersect across the cold front,leading to the strong lifting of high-ue air from the south(see Fig. 7), whereas their line-normal components de-crease away from the region, more markedly north-eastward along the cold front.
One may wonder how such variable low-level forcing
structures could develop from the larger-scale flows thatare relatively uniform in the vicinity of the squall line(cf. Figs. 3 and 6). This could be understood, in part,using the absolute momentum conservation principle.Namely, as the midlevel RTF (FTR) flow descends (as-cends), it will be deflected to the right by the localCoriolis force. Hence, the surface cold current (overeastern Oklahoma) could be related partly to the mid-level (RTF) flow behind the trough axis (see Figs. 3 and15), as the colder air descends anticyclonically towardthe surface. Note, though, that the large-scale northerlyflow in the current case may be influenced partly by thechanneling effect of the Rocky Mountains. It is evidentthat there will be little variability if it occurs only intwo dimensions. It follows that the along-line variabilityof organized convection is mainly determined by thealong-line variability in the low-level across-frontalflows, influenced by the midlevel descending flow andthe large-scale northerly current parallel to the moun-tains, given the relatively uniform presquall environ-ment.
5. Along-line variability due to large-scalecirculation
We have shown that the southern segment of thesquall system, that is, over the PRE-STORM network,contains many meso-b-scale structures that are similar
2554 VOLUME 125M O N T H L Y W E A T H E R R E V I E W
FIG. 13. Vertical cross sections of equivalent potential temperature(ue, every 5 K) with line-normal relative flow vectors, which weretaken from 12-h integration (27/00–12) along (a) line B (through thesouth segment), and (b) line C (through the north segment) given inFig. 4c. Letters ‘‘L’’ and ‘‘H’’ show the respective minima and max-ima of ue, and letter ‘‘S’’ shows the position of the squall line. Thickdashed lines indicate regions with relative humidity exceeding 90%.
to those in the conceptual model of midlatitude squalllines (Houze et al. 1989). In this section, we investigatewhether these classic structures would appear at otherportions of the squall line and then clarify the role oflarge-scale circulation in determining the along-linevariability of the squall’s internal flow structures. Theeffect of convectively generated disturbances will bediscussed in the next section.
To help examine the relationship between the along-line variability and larger-scale circulations, Figs. 13a,bcompare the two-dimensional flow structures at thesouthern segment of the squall system to those at thenorthern segment during the mature stage. One can seethat the prestorm environment is potentially unstableeverywhere ahead of the cold front, with high-ue air inthe lowest 100 hPa (also see Fig. 11). However, the two-dimensional circulations in the northern segment differsignificantly from those in the southern one. Specifi-cally, the southern squall system exhibits an RTF de-scending current that transports midlevel lower-ue airdownward into the boundary layer, whereas in the norththere is little evidence of the RTF flow. Instead, thereare two FTR (southerly) ascending flows that transportboundary layer high-ue air upward: one along the frontalzone into the midtroposphere, causing potential insta-bility in a shallow layer, and the other through organizeddeep convection into the upper levels (Fig. 13b). Theseflow structures conform more or less to the development
of more extensive, midlevel clouds in the north (seeFigs. 5a,b). In contrast, the stratiform clouds that de-veloped in the south only appear in the upper tropo-sphere, like those described in the Houze et al. (1989)conceptual model. Furthermore, the grid-scale upwardmotion is more intense at the southern segment of thesquall line due to the presence of strong low- to midlevelconvergence associated with the RTF–FTR flows; thisin turn helps trigger collectively deep convection at theleading edge of the squall system, as discussed in thepreceding section. Note that the above-mentioned dif-ferences between the southern and northern segmentsremain similar throughout the squall’s life cycle.
In the next two subsections, we discuss separately themechanisms that are responsible for the generation ofthe different two-dimensional circulation structures oc-curring at the southern and northern segments of thesquall system.
a. The RTF descending flow in the southern segment
Rear inflow jets have been the focus of considerableresearch in recent years. Several hypotheses have beenput forward to explain the development of rear inflow.For instance, Smull and Houze (1987) hypothesized thatrear inflow could be generated by the forward accel-eration associated with a convectively induced midlevelmesolow (on the meso-b-scale) in the stratiform regionand then by a hydrostatic pressure fall underneath warmconvective updrafts (on the meso-g-scale) in the leadingconvective region. Zhang (1992) extended the mesolowhypothesis to a midlevel mesovortex proposition by in-cluding the tilting of horizontal vorticity in the presenceof descending motion and vertical shear near the backedge of a stratiform region. Lafore and Moncrieff (1989)and Weisman (1992) argued that the meso-g-scale rearinflow may result from an RTF acceleration associatedwith buoyancy gradients at the rear of convective up-drafts. Based on a two-dimensional simulation, Schmidtand Cotton (1990) attributed the development of a rearinflow jet to the downward deflection and channelingof an ambient RTF flow by convectively generated di-vergent outflow aloft (i.e., the ‘‘blocking’’ effect).Zhang and Gao (1989) showed that an upper-level jetstream could provide a favorable ambient RTF com-ponent that is driven downward by sublimative–evap-orative cooling and then enhanced by a midlevel meso-low to form a mesovortex with intense mesoscale RTFflow. It is possible that several of the above mechanismsmay operate together.
Now let us examine if any of the aforementionedmechanisms could account for the production of thecurrent rear inflow jet. It must be pointed out that the25-km resolution model cannot resolve the meso-g-scalelows under warm convective updrafts. However, it isunlikely that such small-scale pressure perturbationscould play an important role in generating the extensiverear inflow in the current case. By comparison, the mid-
OCTOBER 1997 2555B E L A I R A N D Z H A N G
FIG. 14. Vertical cross sections of line-normal relative flow (every2.5 m s21), superposed with the flow vectors, taken along line B (thesouth segment) given in Fig. 4c from 12-h integrations (27/00–12)of (a) experiment CTL; (b) mesoscale circulations as isolated withthe scale separation technique from experiment CTL; and (c) exper-iment DRY.
FIG. 15. Horizontal map of 500-hPa system-relative streamlines,superposed with convective rainfall rates (shadings) with contours of1 and 5 mm h21 from 12-h integration (27/00–12).
level meso-b-scale low (or mesovortex) can be wellresolved by the 2.5-km grid size (see Figs. 8 and 10).But this mechanism does not appear to be significantduring the early stages, because the convectively gen-erated mesolow or mesotrough is not evident until themature to dissipating stages, that is, after 27/03–15,when resolvable-scale precipitation becomes more pro-nounced.
What about the convective ‘‘blocking’’ or large-scaleforcing effects? To help isolate these two processes withdifferent scales, two steps are taken: 1) the scale-sep-aration technique as described previously is applied tothe 12-h control simulation (experiment CTL), and 2)a sensitivity experiment is conducted, in which neitherconvective- nor grid-scale condensation are included(experiment DRY), while keeping all the other physicalparameters identical to experiment CTL. It is evidentfrom Figs. 14a,b that convectively generated perturba-tions at the squall’s incipient stage are negligible com-pared to the larger-scale contributions. This can be fur-
ther seen by comparing the CTL and DRY runs: an RTFcurrent with the scale and depth similar to those in ex-periment CTL is also present in experiment DRY (cf.Figs. 14a,c). The basic flow structures between the tworuns differ only at upper and lower levels in associationwith the respective convectively induced divergent out-flow and cold descending flow. It follows that the ma-jority of the resolved rear inflow jet at early stages wasa manifestation of the large-scale RTF flow rather thanthe result of mesoscale processes such as blocking ofan upper-level RTF ambient flow or acceleration by amidlevel mesolow.
Thus, examination of the large-scale flow should helpreveal why an RTF current occurs in the southern seg-ment of the squall line but not in its northern part. Figure15 shows that the squall line is actually embedded inlarge-scale flows with a pronounced cyclonic circulationassociated with the midlevel baroclinic trough and ananticyclonic circulation ahead (also see Fig. 3). It isapparent from this flow configuration that the RTF flowcomponent depends on the location and orientation ofthe squall line with respect to the large-scale curvedflow. In the current case, the RTF flow tends to bestronger in the southern portion of the squall system(i.e., near the base of the trough), whereas an intenseFTR flow occurs in the northern segment (i.e., near theinterface between the cyclonic–anticyclonic circula-tions). Note that because of the length scale and relativeposition of the squall line with respect to the large-scalecyclonic vorticity center, a midlevel ‘‘line-end’’ meso-vortex is not generated near the northern end of thesquall line, which is presumably a preferred location forthe development of mesovortices, according to Zhang(1992) and Skamarock et al. (1994).
2556 VOLUME 125M O N T H L Y W E A T H E R R E V I E W
It should be mentioned that this large-scale influenceon the development of the RTF flow was not discussedby Trier et al. (1991) and Lin and Johnson (1994), sincetheir analyses domains (i.e., the PRE-STORM network)are too limited to see such a large- and mesoscale in-teraction. Nevertheless, Figs. 4d–f in Lin and Johnson(1994) do show the existence of intense midlevel RTFflow over a distance greater than 500 km behind theleading convective line, suggesting clearly the contri-bution of the ambient flow associated with the midlevelbaroclinic trough to the existence of extensive trailingrear inflow. Therefore, the convectively generated meso-low or trough mechanism alone cannot explain the de-velopment of such a strong RTF flow (.16 m s21). Thispoint has also been emphasized by Zhang and Gao(1989) and confirmed by recent idealized simulationsof the extremely intense 10–11 June 1985 squall line,which could only produce half of the observed RTFflow intensity without large-scale support (Yang andHouze 1995; Gallus and Johnson 1995). This will befurther discussed in section 6.
b. The FTR ascending flows in the northern segment
As can be seen from Figs. 12 and 13b, the low-levelshallow FTR ascending flow in the northern segment ofthe squall system results from the overrunning of thelarge-scale southerly to southeasterly flow along thecold front. Furthermore, the grid-scale upward motionover the region is much weaker than that in the south(cf. Figs. 13a,b). This result appears to be mainly dueto the lack of appreciable grid-scale convergence as-sociated with a rear inflow jet, since the prefrontal en-vironmental stability is similar to that to the south (seeFigs. 6, 11, and 13). As a result, the upper-level warmingand lower-level cooling, as shown for the southern seg-ment in Fig. 10b, are weak in the northern portion, asis the convectively induced midlevel low-pressure zone(not shown). More significantly, these different circu-lation characteristics seem to account for the develop-ment of different weather conditions, namely, the well-organized, long-lived MCS and upper-level stratiformcloudiness in the south versus the shorter-lived MCSand the two possible layers (i.e., at middle and upperlevels) of cloudiness in the northern segment. In par-ticular, the northern precipitation appears to developwith processes different from the upper-level stratiformregion that occurred in the southern squall system, al-though they both take place in FTR ascending flows.Specifically, the FTR transport of high-ue air tends togenerate weak potential instability above the frontalzone (Fig. 13b), causing the development of the mid-level cloudiness. Although it is not possible to verifythis phenomenon owing to the limited resolution of ob-servations, it has been noticed in other midlatitude fron-tal precipitation cases (e.g., Herzegh and Hobbs 1981;Parsons and Hobbs 1983). The presence of two cloudlayers suggests that the precipitation in the midlevel
clouds may involve ‘‘seeding’’ from above by ice par-ticles (Cunningham 1951; Herzegh and Hobbs 1981).
c. Discussion
The above results clearly show that the large-scalecirculations can play an important role in determiningthe squall’s internal (meso-b-scale) structures at differ-ent portions of the system, especially in the formationof low- to midlevel RTF and FTR flows. For a similarreason, the extent of upper-level FTR outflows may de-pend on the orientation of a squall line with respect tothe direction and intensity of larger-scale flow aloft. Thecurrent finding of the large-scale control is significant,since previous studies have shown the important rolesof elevated rear inflow jets and FTR ascending flow indetermining the development and distribution of pre-cipitation and surface phenomena within a squall system(see Zhang and Gao 1989; Weisman 1992; Gallus andJohnson 1995). Specifically, the presence of an elevatedand descending rear inflow jet has been shown to helpincrease mesoscale convergence or vertical motion,which frequently leads to the concentration of cyclonicvorticity (associated with midlevel mesolows) throughtilting of horizontal vorticity and vortex stretching(Smull and Houze 1985, 1987; Zhang 1992) and to thedevelopment of surface wake lows and ‘‘gust’’ winds(Johnson and Hamilton 1988; Rutledge et al. 1988;Zhang et al. 1989). The midlevel mesovortex (or meso-low) will clearly in turn reinforce the RTF flow to thesouth (see Zhang 1992). On the other hand, the FTRascending flow is often correlated with the formation oftrailing stratiform precipitation (Houze et al. 1989;Zhang and Gao 1989; Biggerstaff and Houze 1991a;Braun and Houze 1994). Therefore, if high-resolutionNWP models could predict reasonably well the locationof squall lines with respect to tropospheric large-scaleor short-wave disturbances, a significant improvementin quantitative precipitation forecasts (QPFs) and severeweather warnings may be achieved.
In fact, a literature survey of observational studiesreveals that an intense rear inflow jet occurs frequentlyin squall lines with favorable larger-scale circulations.For example, rear inflow jets have been observed nearthe base of deep mid- to upper-level troughs (e.g., Oguraand Liou 1980; Chang et al. 1981; Kessinger et al. 1987)and midlevel short-wave troughs (e.g., Leary and Rap-paport 1987; Johnson and Hamilton 1988), in easterlywave troughs (e.g., Zipser 1969; Houze 1977), and inregions of midlevel westerly flow (e.g., Fankhauser etal. 1992). After all, midlatitude squall lines tend to de-velop in association with moderate to intense baroclinicdisturbances, as distinguished from other types of MCSs(Maddox 1980b) and airmass storms. Evidently, thelarge-scale RTF (FTR) descending (ascending) flow canalso exert important influences on the meso-g-scalestructures and evolution of deep convection. It is un-clear, however, to what extent the convective-scale cir-
OCTOBER 1997 2557B E L A I R A N D Z H A N G
FIG. 16. Horizontal map of 500-hPa system-relative streamlinesfrom 18-h integration (27/06–18). Letter ‘‘L’’ shows the position ofthe mesolow. Shadings show the parameterized rainfall rates withcontours of 1 and 5 mm h21.
FIG. 17. As in Fig. 16 but for heights (solid, every 1 dam) super-posed with system-relative streamlines (thick solid). Force balancesat a few selected points are depicted, with the letters ‘‘c,’’ ‘‘p,’’ and‘‘a’’ denoting the Coriolis (i.e., 2fk 3 v9), pressure gradient force(i.e., 2 =f 2 fk 3 c), and Lagrangian acceleration (i.e., dv9/dt),respectively. Shadings represent the convective rainfall rates withcontours of 1 and 5 mm h 21.
culations could be modified by such preexisting larger-scale (RTF–FTR) flows, since most of the previouscloud modeling studies only assumed near-vanishingsystem-relative flows overlying a sheared boundary lay-er (e.g., Thorpe et al. 1982; Rotunno et al. 1988; Laforeand Moncrieff 1989). Obviously, to provide a completeunderstanding of the multiscale interactive processes inthe current case, one has to run a numerical model witha grid size that is small enough to resolve individualconvective cells but with a domain that is sufficientlylarge to include the midlevel traveling short-wavetrough.
6. Along-line variability due to mesoscalecirculation
As previously shown, there are two scales of circu-lations affecting the along-line variability of the currentsquall system: the baroclinically driven large-scale andthe convectively generated mesoscale disturbances, par-ticularly during the mature to decaying stages (see Fig.8). In this section we focus only on the along-line vari-ability of the squall’s circulations due to the convec-tively induced midlevel mesolow and upper-level meso-high, although the large-scale flow always exerts animportant influence on the structure and evolution ofthe squall system.
It is evident from Fig. 16 that corresponding to themidlevel mesolow, there is an elongated zone of con-fluence (or convergence) between the FTR and RTFflows that is superposed on the large-scale cyclonic flowin the trailing stratiform region. Moreover, streamlinesexhibit greater curvature in the vicinity of the mesolow,
indicating the generation of three-dimensional meso-b-scale structures associated with the squall convection.To help gain insight into the relationship between themesolow and the along-line variability, horizontal mo-mentum budgets at 500 hPa are calculated with the La-grangian momentum equation
dv95 2 fk 3 v9 2 (=f 1 fk 3 c), (1)
dt
where v9 is the horizontal wind vector relative to thesquall line, f is the Coriolis parameter, k is the unit vectorin the vertical direction, f is the geopotential height,and c is the propagation vector of the squall line. Equa-tion (1) represents a horizontal force balance among theinertial acceleration, the Coriolis force, and the pressuregradient force (PGF) in the framework relative to thesquall line. Note that the term f k 3 c has been includedin the PGF calculation because of the use of the system-relative framework. Note also that the effect of numer-ical diffusion has been neglected in Eq. (1).
Figure 17 presents a 500-hPa map of geopotentialheights and a few system-relative streamlines takenfrom Fig. 16 superposed with force-balance diagramsat some selected points in the vicinity of the squallsystem. The basic flow patterns at 500 hPa resemblethose at 700 hPa (cf. Figs. 8b and 17), except that theconvectively generated mesohigh becomes more evidentat higher levels (see Fig. 10a). One can see that airparcels far behind the squall line (e.g., at points 1–3)are influenced little by the convectively induced pres-sure perturbations; they are almost in a geostrophically
2558 VOLUME 125M O N T H L Y W E A T H E R R E V I E W
FIG. 18. As in Fig. 7 but for pressure gradient forces normal tothe line (every 4 m s 21 h21) along (a) line E, (b) line F, and (c) lineG given in Fig. 16, which are located to the north, center, and southof the midlevel mesolow, respectively. Solid (dashed) lines are forpositive (negative) values.
balanced state with the larger-scale trough. For air par-cels closer to the mesolow, however, the situation isquite different. Specifically, these parcels are forced byPGF to accelerate into the low pressure zone, while theCoriolis force tends to deflect them rightward (e.g., atpoints 4–9). Thus the PGF forces them to convergealong the mesotrough axis, while the Coriolis forcecauses the parcels in the large-scale RTF southwesterly(FTR southerly) flow to be accelerated toward the south(north) of the PGF vectors. The net result is that moreintense RTF (FTR) flow occurs slightly to the south(north) of the mesolow (cf. Figs. 16 and 17). This revealsthat the mesolow mechanism is indeed operative duringthe mature to decaying stages, as discussed by Trier etal (1991) and Lin and Johnson (1994). However, be-cause of the presence of intense vertical motion andstrong vertical shear in the vicinity of the mesolow, themidlevel mesoscale rear inflow could be viewed as partof a mesovortex circulation that results from the down-ward transport of the large-scale RTF momentum aloft(see Gao et al. 1990; Gallus and Johnson 1992) and theenhancement by both the tilting of horizontal vorticityand the vortex stretching (see Zhang 1992). It is im-portant to point out that this RTF downward momentumtransport is driven by the sublimative–evaporative cool-ing at the back edge of the stratiform region, whichdiffers from the ‘‘blocking’’ hypothesis of Schmidt andCotton (1990).
To further examine the along-line variability of thesquall system due to the convectively generated per-turbations, Fig. 18 compares the relative flow and PGFnormal to the line between three different cross sectionsaround the midlevel mesolow. Note that the depth ofconvectively generated disturbances is greater towardthe south of the mesolow. As can be expected, most ofthe FTR and RTF accelerations occur in regions of largepositive and negative PGF, respectively; the larger thePGF, the greater the FTR and RTF acceleration. This isparticularly true for the cross section through the centerof the mesolow (Fig. 18b). This result is consistent withthe numerical momentum budget by Gao et al. (1990)and Gallus and Johnson (1992), who showed that PGFprovides important contributions to the acceleration ofboth FTR and RTF flows. However, the RTF flow inthe southern cross section is stronger than that in themiddle one (cf. Figs. 18b,c), in spite of the presence ofsmaller PGF values in the region. As demonstrated inthe force-balance diagrams in Fig. 17, this is due partlyto the deflection of the rear inflow and partly to thelarge-scale support. On the other hand, the elevatedRTF flow is weaker to the north of the midlevel mesolow(see Fig. 18a), similar to the findings of Zhang and Gao(1989).
While the mesolow (mesovortex) mechanism is op-erative during the mature stage, it is unclear how sig-nificant it is compared to the large-scale support. Thus,the net (i.e., direct and indirect) effect of the squallconvection needs to be isolated from that associated
with the large-scale circulation by subtracting the line-normal flows in experiment DRY from those in exper-iment CTL. As seen in Fig. 19 the squall convectioncould induce, without any large-scale support, the typ-ical two-dimensional flow structures, such as the over-turning ascending flow ahead, an FTR penetrative flowinto the upper-level trailing stratiform region, and anRTF flow down to the surface. However, the scale ofthe convectively generated RTF flow component (200km) is much shorter than that associated with the large-scale flow (cf. Figs. 14 and 19). Moreover, the convec-tively generated RTF flow, on average, is about 50% to60% of the predicted full intensity. Note, though, thatpart of the magnitude is caused by the phase differenceof the squall lines between experiments CTL and DRY.Nevertheless, the results clearly provide further evi-dence on the scale interaction involved in the devel-opment of rear inflow jets as found by Zhang and Gao(1989). It is evident that both the convectively generatedFTR and RTF accelerations to the south of the mesolow
OCTOBER 1997 2559B E L A I R A N D Z H A N G
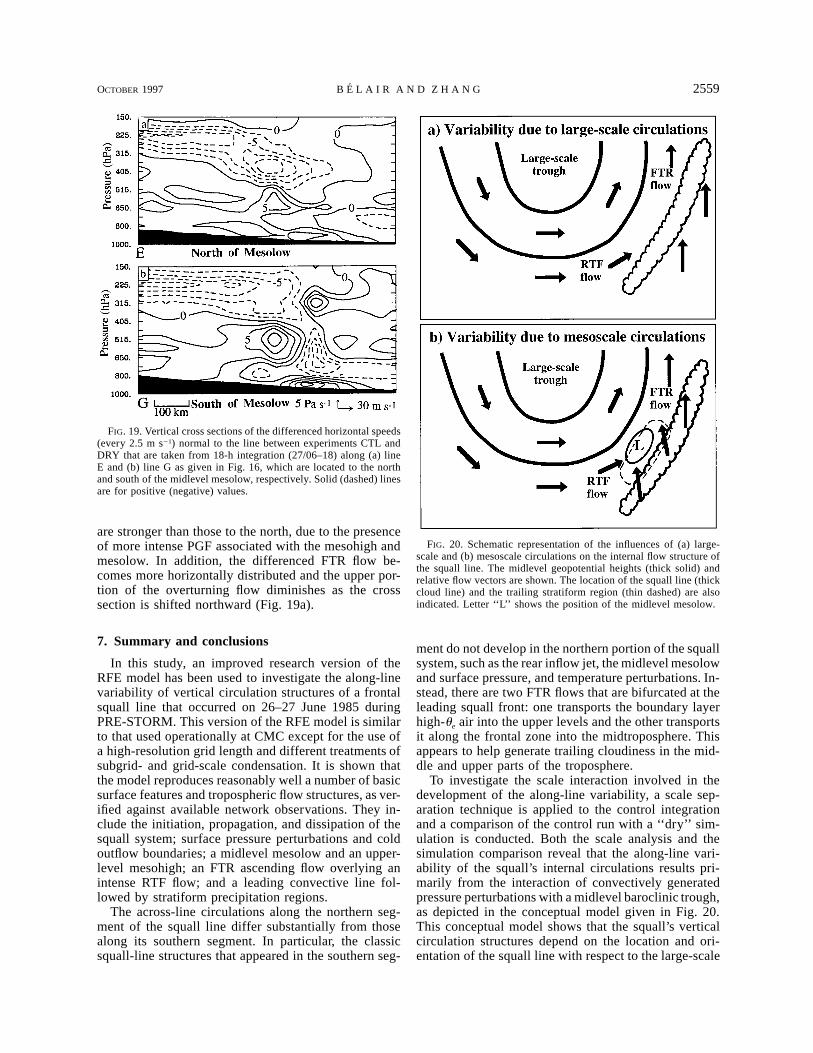
FIG. 19. Vertical cross sections of the differenced horizontal speeds(every 2.5 m s21) normal to the line between experiments CTL andDRY that are taken from 18-h integration (27/06–18) along (a) lineE and (b) line G as given in Fig. 16, which are located to the northand south of the midlevel mesolow, respectively. Solid (dashed) linesare for positive (negative) values.
FIG. 20. Schematic representation of the influences of (a) large-scale and (b) mesoscale circulations on the internal flow structure ofthe squall line. The midlevel geopotential heights (thick solid) andrelative flow vectors are shown. The location of the squall line (thickcloud line) and the trailing stratiform region (thin dashed) are alsoindicated. Letter ‘‘L’’ shows the position of the midlevel mesolow.
are stronger than those to the north, due to the presenceof more intense PGF associated with the mesohigh andmesolow. In addition, the differenced FTR flow be-comes more horizontally distributed and the upper por-tion of the overturning flow diminishes as the crosssection is shifted northward (Fig. 19a).
7. Summary and conclusions
In this study, an improved research version of theRFE model has been used to investigate the along-linevariability of vertical circulation structures of a frontalsquall line that occurred on 26–27 June 1985 duringPRE-STORM. This version of the RFE model is similarto that used operationally at CMC except for the use ofa high-resolution grid length and different treatments ofsubgrid- and grid-scale condensation. It is shown thatthe model reproduces reasonably well a number of basicsurface features and tropospheric flow structures, as ver-ified against available network observations. They in-clude the initiation, propagation, and dissipation of thesquall system; surface pressure perturbations and coldoutflow boundaries; a midlevel mesolow and an upper-level mesohigh; an FTR ascending flow overlying anintense RTF flow; and a leading convective line fol-lowed by stratiform precipitation regions.
The across-line circulations along the northern seg-ment of the squall line differ substantially from thosealong its southern segment. In particular, the classicsquall-line structures that appeared in the southern seg-
ment do not develop in the northern portion of the squallsystem, such as the rear inflow jet, the midlevel mesolowand surface pressure, and temperature perturbations. In-stead, there are two FTR flows that are bifurcated at theleading squall front: one transports the boundary layerhigh-ue air into the upper levels and the other transportsit along the frontal zone into the midtroposphere. Thisappears to help generate trailing cloudiness in the mid-dle and upper parts of the troposphere.
To investigate the scale interaction involved in thedevelopment of the along-line variability, a scale sep-aration technique is applied to the control integrationand a comparison of the control run with a ‘‘dry’’ sim-ulation is conducted. Both the scale analysis and thesimulation comparison reveal that the along-line vari-ability of the squall’s internal circulations results pri-marily from the interaction of convectively generatedpressure perturbations with a midlevel baroclinic trough,as depicted in the conceptual model given in Fig. 20.This conceptual model shows that the squall’s verticalcirculation structures depend on the location and ori-entation of the squall line with respect to the large-scale
2560 VOLUME 125M O N T H L Y W E A T H E R R E V I E W
trough and the mesoscale disturbances. Specifically, thelarge-scale trough provides an extensive RTF flow com-ponent near its base (i.e., in the southern segment) anda favorable FTR flow component in the northern portionof the squall system (see Fig. 20a). This large-scale con-tribution to the along-line variability is especially sig-nificant during the system’s formative stage. In contrast,the convectively induced mesoscale disturbance tendsto determine the internal circulations of the squall sys-tem in the south during the system’s mature to dissi-pating stages (see Fig. 20b). In particular, the midlevelmesolow (mesovortex) and upper-level mesohigh helpaccelerate the rear inflow jet and the divergent FTRoutflow in the trailing stratiform region, respectively.The low- to midlevel mesoscale rear inflow results fromthe downward transport of the larger-scale RTF mo-mentum aloft, which is then enhanced by the mesolowor mesovortex circulation. It has been demonstratedthrough force-balance diagrams that the rear inflow jettends to be more intense to the south of the mesolow(mesovortex), rather than near the center of the mesolow(mesovortex), due to the deflectional effect of the Cor-iolis force. This enhanced RTF flow increases the con-vergence and upward motion in the low to midtropo-sphere, thus leading to the development and organiza-tion of a more intense and longer-lived convective sys-tem in the southern segment of the squall system.
In conclusion, we may state that the vertical circu-lation characteristics along different parts of a midlat-itude squall line are dependent on multiscale interac-tions, namely, from the development of deep convectionto convectively generated mesoscale disturbances (e.g.,mesolows and mesohighs) and large-scale circulations(e.g., baroclinic troughs and jet streams). The classictwo-dimensional structures may only develop at certain,but not all, portions of squall lines. In particular, therear inflow component, which is often correlated withorganized convective development, vorticity concentra-tion, and trailing stratiform precipitation, tends to bemore intense to the south of a midlevel mesolow andnear the base of a large-scale trough. In other cases, therear inflow and upper-level FTR outflow may not de-velop, depending upon the distribution and orientationof squall lines with respect to their larger-scale curvedflows as well as the intensity of the large-scale flowsand squall convection.
Although the above conclusions are drawn from onlya single squall-line study, they are more or less sup-ported by previous studies of midlatitude squall lines.Hence, these results may have important implicationsfor the improvement of QPFs and severe weather warn-ings by operational NWP models, like the one used forthe current study, since some intense meso-b-scale cir-culations of MCSs may be more related to meso-a- orlarger-scale disturbances. It should be mentioned, how-ever, that to provide an adequate understanding of theinfluences of the convectively generated mesolow andthe larger-scale trough on the development of convective
cells along the leading line, one has to run a numericalmodel with a grid size that is small enough to resolveindividual convective clouds but has an integration do-main that is large enough to include the evolution ofthe midlevel baroclinic trough.
Acknowledgments. We are grateful to Dr. Stan Trierof the National Center for Atmospheric Research forproviding Fig. 8a, and to Drs. Jocelyn Mailhot, MichelBeland, and Andrew Staniforth of Recherche en previ-sion numerique/Atmospheric Environment Service fortheir continuing interest and generous support duringthe course of this research. Thanks also go to MichelValin, Bernard Bilodeau, Ning Bao, and Mario Lepinefor their kindly assistance, and to Michel Riffiod ofMeteo-France/Centre National de Recherches Meteo-rologiques (CNRM) for his drafting assistance. This re-search was funded by Environment Canada ContractKM156-0-9029, and by Natural Science and Engineer-ing Research Council of Canada (NSERC). The firstauthor (S. Belair) was also supported by a graduatefellowship from NSERC.
REFERENCES
Bartels, D., and R. A. Maddox, 1991: Midlevel cyclonic vorticesgenerated by mesoscale convective systems. Mon. Wea. Rev.,119, 104–118.
Belair, S., D.-L. Zhang, and J. Mailhot, 1994: Numerical predictionof the 10–11 June 1985 squall line with the Canadian regionalfinite-element model. Wea. Forecasting, 9, 157–172., , and , 1995: Numerical prediction of an intense con-vective system associated with the July 1987 Montreal flood. PartI: Gravity waves and the squall line. Atmos.–Ocean, 33, 447–473.
Biggerstaff, M. I., and R. A. Houze Jr., 1991a: Kinematic and pre-cipitation structure of the 10–11 June 1985 squall line. Mon.Wea. Rev., 119, 3034–3065., and , 1991b: Midlevel vorticity structure of the 10–11June 1985 squall line. Mon. Wea. Rev., 119, 3066–3079.
Brandes, E. A., 1990: Evolution and structure of the 6–7 May 1985mesoscale convective system and associated vortex. Mon. Wea.Rev., 118, 109–127.
Braun, S. A., and R. A. Houze Jr., 1994: The transition zone andsecondary maximum of radar reflectivity behind a midlatitudesquall line: Results retrieved from Doppler radar data. J. Atmos.Sci., 51, 2733–2755.
Carbone, R. E., J. W. Conway, N. A. Crook, and M. W. Moncrieff,1990: The generation and propagation of a nocturnal squall line.Part I: Observations and implications for mesoscale predict-ability. Mon. Wea. Rev., 118, 26–49.
Chang, C. B., D. J. Perkey, and C. W. Kreitzberg, 1981: A numericalcase study of the squall line of 6 May 1975. J. Atmos. Sci., 38,1601–1615.
Cunning, J. B., 1986: The Oklahoma–Kansas preliminary regionalexperiment for STORM-Central. Bull. Amer. Meteor. Soc., 67,1478–1486.
Cunningham, R. M., 1951: Some observations of natural precipitationprocesses. Bull. Amer. Meteor. Soc., 32, 334–343.
Davis, C. A., and M. L. Weisman, 1994: Balanced dynamics of me-soscale vortices produced in simulated convective systems. J.Atmos. Sci., 51, 2005–2030.
Dudhia, J., 1989: Numerical study of convection observed during thewinter monsoon experiment using a mesoscale two-dimensionalmodel. J. Atmos. Sci., 46, 3077–3107.
Fankhauser, J. C., G. M. Barnes, and M. A. LeMone, 1992: Structure
OCTOBER 1997 2561B E L A I R A N D Z H A N G
of a midlatitude squall line formed in strong unidirectional shear.Mon. Wea. Rev., 120, 237–260.
Fritsch, J. M., and C. F. Chappell, 1980: Numerical prediction ofconvectively driven mesoscale pressure line. Part I: Convectiveparameterization. J. Atmos. Sci., 37, 1722–1733., and R. A. Maddox, 1981a: Convectively driven mesoscaleweather systems aloft. Part I: Observations. J. Appl. Meteor.,20, 9–19., and , 1981b: Convectively driven mesoscale weather systemsaloft. Part II: Numerical simulations. J. Appl. Meteor., 20, 20–26., and J. M. Brown, 1982: On the generation of convectivelydriven mesohighs aloft. Mon. Wea. Rev., 110, 1554–1563.
Gallus, W. A., and R. H. Johnson, 1992: The momentum budget ofan intense midlatitude squall line. J. Atmos. Sci., 49, 422–450., and , 1995: The dynamics of circulations within the trailingstratiform regions of squall lines. Part I: The 10–11 June PRE-STORM system. J. Atmos. Sci., 52, 2161–2187.
Gao, K., D.-L. Zhang, M. W. Moncrieff, and H.-R. Cho, 1990: Me-soscale momentum budget in a midlatitude squall line: A nu-merical case study. Mon. Wea. Rev., 118, 1011–1028.
Hane, C. E., C. J. Kessinger, and P. S. Ray, 1987: The Oklahoma squallline of 19 May 1977. Part II: Mechanisms for maintenance of theregion of strong convection. J. Atmos. Sci., 44, 2866–2883.
Herzegh, P. H., and P. V. Hobbs, 1981: The mesoscale and microscalestructure and organization of clouds and precipitation in mid-latitude cyclones. IV: Vertical air motions and microphysicalstructures of prefrontal surge clouds and cold frontal clouds. J.Atmos. Sci., 38, 1771–1784.
Houze, R. A., Jr., 1977: Structure and dynamics of a tropical squall-line system. Mon. Wea. Rev., 105, 1540–1567., S. A. Rutledge, M. I. Biggerstaff, and B. F. Smull, 1989: In-terpretation of Doppler radar displays of midlatitude mesoscaleconvective lines. Bull. Amer. Meteor. Soc., 70, 608–619.
Hsie, E.-Y., R. A. Anthes, and D. Keyser, 1984: Numerical simulationof frontogenesis in a moist atmosphere. J. Atmos. Sci., 41, 2581–2594.
Johnson, R. H., and P. J. Hamilton, 1988: The relationship of surfacepressure features to the precipitation and airflow structure of anintense midlatitude squall line. Mon. Wea. Rev., 116, 1444–1472.
Kessinger, C. J., P. S. Ray, and C. E. Hane, 1987: The Oklahoma squallline of 19 May 1977. Part I: A multiple Doppler analysis of con-vective and stratiform structure. J. Atmos. Sci., 44, 2840–2864.
Klimowski, B. A., 1994: Initiation and development of rear inflowwithin the 28–29 June 1989 North Dakota mesoconvective sys-tem. Mon. Wea. Rev., 122, 765–779.
Lafore, J.-P., and M. W. Moncrieff, 1989: A numerical investigation ofthe organization and interaction of the convective and stratiformregions of tropical squall lines. J. Atmos. Sci., 46, 521–544.
Leary, C. A., and E. N. Rappaport, 1987: The life cycle and internalstructure of a mesoscale convective complex. Mon. Wea. Rev.,115, 1503–1527.
Lin, X. L., and R. H. Johnson, 1994: Heat and moisture budgets andcirculation characteristics of a frontal squall line. J. Atmos. Sci.,51, 1661–1681.
Maddox, R. A., 1980a: An objective technique for separating ma-croscale and mesoscale features in meteorological data. Mon.Wea. Rev., 108, 1108–1121., 1980b: Mesoscale convective complexes. Bull. Amer. Meteor.Soc., 61, 1374–1387., D. J. Perkey, and J. M. Fritsch, 1981: Evolution of upper tro-pospheric features during the development of a mesoscale con-vective complex. J. Atmos. Sci., 38, 1664–1674.
Moncrieff, M. W., 1981: A theory of organized steady convection andits transport properties. Quart. J. Roy. Meteor. Soc., 107, 29–50.
Newton, C. W., and J. C. Fankhauser, 1964: On the movements of con-vective storms, with emphasis on size discrimination in relation towater-budget requirement. J. Appl. Meteor., 3, 651–668.
Ogura, Y., and M.-T. Liou, 1980: The structure of a midlatitude squallline: A case study. J. Atmos. Sci., 37, 553–567.
Orlanski, I., 1975: A rational subdivision of scales for atmosphericprocesses. Bull. Amer. Meteor. Soc., 56, 527–530.
Parsons, D. B., and P. V. Hobbs, 1983: The mesoscale and microscalestructure and organization of clouds and precipitation in mid-latitude cyclones. IX: Some effects of orography on rainbands.J. Atmos. Sci., 40, 1930–1949.
Rotunno, R., J. B. Klemp, and M. L. Weisman, 1988: A theory forstrong, long-lived squall lines. J. Atmos. Sci., 45, 463–485.
Rutledge, S. A., R. A. Houze Jr., M. I. Biggerstaff, and T. Matejka,1988: The Oklahoma–Kansas mesoscale convective system of10–11 June 1985: Precipitation structure and single-Doppler ra-dar analysis. Mon. Wea. Rev., 116, 1409–1430.
Schmidt, J. M., and W. R. Cotton, 1990: Interactions between upperand lower tropospheric gravity waves on squall line structureand maintenance. J. Atmos. Sci., 47, 1205–1222.
Skamarock, W. C., M. L. Weisman, and J. B. Klemp, 1994: Three-dimensional evolution of simulated long-lived squall lines. J.Atmos. Sci., 51, 2563–2584.
Smull, B. F., and R. A. Houze Jr., 1985: A midlatitude squall linewith a trailing region of stratiform rain: Radar and satellite ob-servations. Mon. Wea. Rev., 113, 117–133., and , 1987: Rear inflow in squall lines with trailing strat-iform precipitation. Mon. Wea. Rev., 115, 2869–2889.
Srivastava, R. C., T. J. Matejka, and T. J. Lorello, 1986: Dopplerradar study of the trailing anvil region associated with a squallline. J. Atmos. Sci., 43, 356–377.
Stirling, J., and R. M. Wakimoto, 1989: Mesoscale vortices in thestratiform region of a decaying midlatitude squall line. Mon.Wea. Rev., 117, 452–458.
Thorpe, A. J., M. J. Miller, and M. W. Moncrieff, 1982: Two-di-mensional convection in non-constant shear: A model of mid-latitude squall lines. Quart. J. Roy. Meteor. Soc., 108, 739–762.
Trier, S. B., D. B. Parsons, and J. E. H. Clark, 1991: Environmentand evolution of a cold-frontal mesoscale convective system.Mon. Wea. Rev., 119, 2429–2455.
Weisman, M. L., 1992: The role of convectively generated rear-inflowjets in the evolution of long-lived mesoconvective system. J.Atmos. Sci., 49, 1826–1847., 1993: The genesis of severe, long-lived bow echoes. J. Atmos.Sci., 50, 645–670.
Yang, M.-J., and R. A. Houze Jr., 1995: Multicell squall-line struc-tures as a manifestation of vertically trapped gravity waves. Mon.Wea. Rev., 123, 641–661.
Zhang, D.-L., 1989: The effect of parameterized ice microphysics onthe simulation of vortex circulation with a mesoscale hydrostaticmodel. Tellus, 41A, 132–147., 1992: The formation of a cooling-induced mesovortex in thetrailing stratiform region of a midlatitude squall line. Mon. Wea.Rev., 120, 2763–2785., and J. M. Fritsch, 1986: Numerical simulation of the meso-b scalestructure and evolution of the 1977 Johnstown flood. Part I: Modeldescription and verification. J. Atmos. Sci., 43, 1913–1943., and , 1988: A numerical investigation of a convectivelygenerated, inertially stable, extratropical warm-core mesovortexover land. Part I: Structure and evolution. Mon. Wea. Rev., 116,2660–2687., and K. Gao, 1989: Numerical simulation of an intense squallline during 10–11 June 1985 PRE-STORM. Part II: Rear inflow,surface pressure perturbations and stratiform precipitation. Mon.Wea. Rev., 117, 2067–2094., and H.-R. Cho, 1992: The development of negative moist po-tential vorticity in the stratiform region of a simulated squallline. Mon. Wea. Rev., 120, 1322–1341., and , 1995: Three-dimensional simulation of frontal rain-bands and conditional symmetric instability in the Eady-wavemodel. Tellus, 47A, 45–61.
Zheng, Y., Q. Xu, and D. J. Stensrud, 1995: A numerical simulationof the 7 May 1985 mesoscale convective system. Mon. Wea.Rev., 123, 1781–1799.
Zipser, E. J., 1969: The role of organized unsaturated convectivedowndrafts in the structure and rapid decay of an equatorialdisturbance. J. Appl. Meteor., 8, 799–814.