Deep-Sea Research, Vol. 30, No. 6A, pp. 645 to 661, 1983. 0198-0149/83 $3.00 + 0.00 Printed in Great Britain. ~ 1983 Pergamon Press Ltd. A one-dimensional model for the vertical distribution of pelagic fish eggs in the mixed layer SVEIN SUNDBY* (Received 19 May 1982; in revised form 15 November 1982; accepted 1 March 1983) Abstract--A one-dimensionalmodeldescribing the verticaldistribution of pelagic fish eggs confined to the mixed layer is developed.The physical properties of pelagic fish eggs and a method for com- puting the corresponding ascending velocity are described. The model is applied to measurements taken from the literature of the vertical distribution of three pelagic fish eggs species: plaice eggs from the southern North Sea, mackerel eggs from the central North Sea, and cod eggs from the coast of northern Norway. The effect of wind mixing is demonstrated and a mean vertical eddy diffnsivity coefficientis computed from the egg profiles and the ascending velocitiesof the eggs. A relation between the wind force and the mean eddy diffusivitycoefficientof the mixedlayer for wind forces up to 12ms -~ is suggested. INTRODUCTION STUDIES of the vertical distribution of planktonic organisms in the mixed layer depend primarily on (1) appropriate equipment for recording vertical distributions; (2) knowledge of vertical velocities of the organisms, which depend on dimension, form, buoyancy, and behaviour; and (3) knowledge of the turbulent processes and vertical movements in the mixed layer. The traditional equipment for recording vertical distributions has been horizontally towed nets, such as Clarke-Bumpus plankton samplers and the Longhurst-Hardy plankton recorder. In recent years large pumps have been used to make vertical profdes (ELLERTSEN et al., 1977), and an in situ particle counter for continuous vertical profding has been developed (TILSETd and ELLERTSF.~, 1982). Comprehensive treatments of the vertical movement of plankton have been made by HUTCHINSON (1967) and SMAYDA (1970). Turbulence of the mixed layer is complex, but it is strongly correlated with the wind speed (e.g., OAKEY and ELLIOTr, 1980). In modelling the upper layer it is useful to make simplifications such as assuming a constant exchange coefficient with respect to depth within the mixed layer. Estimates of the eddy viscosity coefficient as a function of the wind speed derived from the Ekman theory are given by SVERDRUP, JOHNSON and FLEMING (1942). KULLENBERG (1976) derived a similar relation from rhodamine measurements in the lower part of the mixed layer. In this paper a simple one-dimensional model for the vertical distribution of pelagic fish eggs in the upper mixed layer is developed. The aims of the model are to demonstrate the effect of the physical properties of pelagic fish eggs and the vertical turbulent forces on the * Institute of Marine Research, N-5011 Bergen-Nordnes, Norway. 645
Transcript
Deep-Sea Research, Vol. 30, No. 6A, pp. 645 to 661, 1983. 0198-0149/83 $3.00 + 0.00 Printed in Great Britain. ~ 1983 Pergamon Press Ltd.
A one-dimensional model for the vertical distribution of pelagic fish eggs in the mixed layer
SVEIN SUNDBY*
(Received 19 May 1982; in revised form 15 November 1982; accepted 1 March 1983)
Abstract--A one-dimensional model describing the vertical distribution of pelagic fish eggs confined to the mixed layer is developed. The physical properties of pelagic fish eggs and a method for com- puting the corresponding ascending velocity are described. The model is applied to measurements taken from the literature of the vertical distribution of three pelagic fish eggs species: plaice eggs from the southern North Sea, mackerel eggs from the central North Sea, and cod eggs from the coast of northern Norway. The effect of wind mixing is demonstrated and a mean vertical eddy diffnsivity coefficient is computed from the egg profiles and the ascending velocities of the eggs. A relation between the wind force and the mean eddy diffusivity coefficient of the mixed layer for wind forces up to 12ms -~ is suggested.
INTRODUCTION
STUDIES of the vertical distribution of planktonic organisms in the mixed layer depend primarily on (1) appropriate equipment for recording vertical distributions; (2) knowledge of vertical velocities of the organisms, which depend on dimension, form, buoyancy, and behaviour; and (3) knowledge of the turbulent processes and vertical movements in the mixed layer.
The traditional equipment for recording vertical distributions has been horizontally towed nets, such as Clarke-Bumpus plankton samplers and the Longhurst-Hardy plankton recorder. In recent years large pumps have been used to make vertical profdes (ELLERTSEN et
al., 1977), and an in situ particle counter for continuous vertical profding has been developed (TILSETd and ELLERTSF.~, 1982). Comprehensive treatments of the vertical movement of plankton have been made by HUTCHINSON (1967) and SMAYDA (1970). Turbulence of the mixed layer is complex, but it is strongly correlated with the wind speed (e.g., OAKEY and ELLIOTr, 1980). In modelling the upper layer it is useful to make simplifications such as assuming a constant exchange coefficient with respect to depth within the mixed layer. Estimates of the eddy viscosity coefficient as a function of the wind speed derived from the Ekman theory are given by SVERDRUP, JOHNSON and FLEMING (1942). KULLENBERG (1976) derived a similar relation from rhodamine measurements in the lower part of the mixed layer.
In this paper a simple one-dimensional model for the vertical distribution of pelagic fish eggs in the upper mixed layer is developed. The aims of the model are to demonstrate the effect of the physical properties of pelagic fish eggs and the vertical turbulent forces on the
* Institute of Marine Research, N-5011 Bergen-Nordnes, Norway.
645
646 SVE~N SUNDBY
vertical distribution and to show that it can be used, together with observed vertical distribu- tions of fish eggs, to compute a mean eddy diffusivity coefficient of the mixed layer.
PHYSICAL PROPERTIES OF PELAGIC FISH EGGS
In the physical sense pelagic fish eggs in their natural environment are small spheres with a small positive or negative buoyancy. After fertilization both the volume of the egg and the salinity of the cytoplasm remain relatively constant, independent of the environmental salinity and pressure (SOLEMDAL, 1973; RIIS-VESTERGAARD, 1983). The eggs are found throughout the water column, some in high concentrations near the surface, others with maximum con- centrations in the intermediate waters or even near the bottom. The different kinds of distribu- tions must be caused by different properties of the eggs with respect to buoyancy and dimen- sion, and to the properties of the environment such as density structure, currents, and mixing.
In a first approach to understanding the vertical distribution of pelagic fish eggs, the diameter of the eggs must be measured and the buoyancy must be determined by experiments. The diameters of pelagic fish eggs from the North Sea were summarized by I'hEMSTRA (1962), where pelagic fish eggs from 53 different species are listed. The diameters range from about 0.6 to about 3.5 mm. Buoyancy measurements are scarce. Such measurements have been made for certain species, e.g. SUNDNES, LEIVESTAD and IVERSEN (1965) and SOLEMDAL (1970) for the Arcto-Norwegian cod, SOLEMDAL (unpublished material) for mackerel in the North Sea, COOMSS (1981) for mackerel west of Ireland, and COOMBS, HAP, DING, NICHOLS and FOSH (1981) for plaice in the North Sea. ALDERDICE and FORRESTER (1971) measured the buoyancy of eggs from the petrale sole offthe coast of Alaska.
Eggs from Arcto-Norwegian cod, North Sea plaice, and North Sea mackerel are all positively buoyant with respect to the density of the upper layer. In the absence of strong con- vergent processes, this means that the highest concentrations are usually in the uppermost layer even if the spawning occurs in deeper layers. Cod eggs in the Baltic Sea have another kind of distribution. Here the highest concentrations are below the upper layer because the density of the layer is lower than that of the cod eggs (KANDLER, 1949). The eggs of the petrale sole off the coast of Alaska are positively buoyant at the spawning depth of 300 m, but they are almost neutrally buoyant in the surface water (ALDERDICE and FORRESTER, 1971). The eggs of the Atlantic halibut in northern Norwegian fjords are found bathypelagic at salinities ranging from 33.9 to 35.0 x 10 -3 (HAuG, KIORSVIK and SUNDET, 1982).
SUNDNES et al. (1965) described a method to measure the buoyancy of fish eggs. In a method described by Cooiss (1981) the density of pelagic fish eggs is measured in a temperature-controlled salinity-gradient column. In this way the exact density of every single egg can be determined. The accuracy of the method is claimed to be better than 0.04 x 10 -3 gcm -3.
TERMINAL VELOCITIES OF PELAGIC FISH EGGS
Nomenclature
A number of eggs in the water column under a unit surface C(z) concentration of eggs. Number per unit volume d , egg diameter g gravity acceleration
A one-dimensional model for the vertical distribution of pelagic fish eggs 64 7
H a constant depth (z = H) K eddy diffusivity coefficient K~ numerical constant Re Reynolds number W wind velocity w terminal velocity la mean value of terminal velocity v molecular viscosity p density a standard deviation
numerical constant.
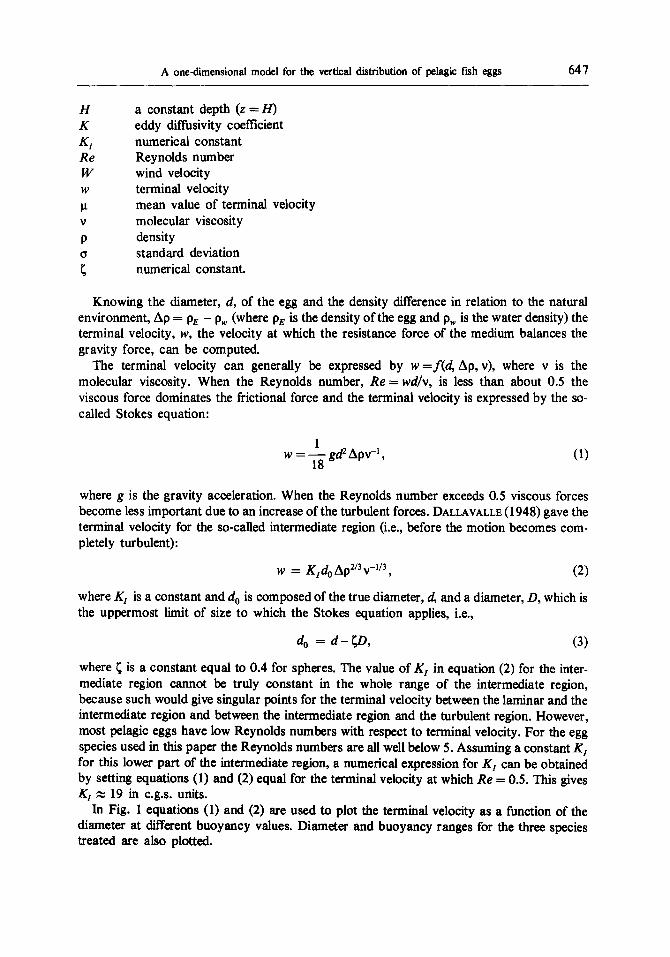
Knowing the diameter, d, of the egg and the density difference in relation to the natural environment, Ap = Pe - P~ (where PE is the density of the egg and Pw is the water density) the terminal velocity, w, the velocity at which the resistance force of the medium balances the gravity force, can be computed.
The terminal velocity can generally be expressed by w =f ( d , Ap, v), where v is the molecular viscosity. When the Reynolds number, Re = wd/v, is less than about 0.5 the viscous force dominates the frictional force and the terminal velocity is expressed by the so- called Stokes equation:
1 w =-:7_ ga~ apv -~, (1)
where g is the gravity acceleration. When the Reynolds number exceeds 0.5 viscous forces become less important due to an increase of the turbulent forces. DALLAVALL~ (1948) gave the terminal velocity for the so-called intermediate region (i.e., before the motion becomes com- pletely turbulent):
W = g z d o A p 2 / 3 v -1/3, (2)
where K t is a constant and d o is composed of the true diameter, d, and a diameter, D, which is the uppermost limit of size to which the Stokes equation applies, i.e.,
do = d - r,D, (3)
where ~ is a constant equal to 0.4 for spheres. The value of Kx in equation (2) for the inter- mediate region cannot be truly constant in the whole range of the intermediate region, because such would give singular points for the terminal velocity between the laminar and the intermediate region and between the intermediate region and the turbulent region. However, most pelagic eggs have low Reynolds numbers with respect to terminal velocity. For the egg species used in this paper the Reynolds numbers are all well below 5. Assuming a constant K~ for this lower part of the intermediate region, a numerical expression for K~ can be obtained by setting equations (1) and (2) equal for the terminal velocity at which Re = 0.5. This gives K I ~ 19 in c.g.s, units.
In Fig. I equations (1) and (2) are used to plot the terminal velocity as a function of the diameter at different buoyancy values. Diameter and buoyancy ranges for the three species treated are also plotted.
5.0
~5
\ \
~..0
33
.~ 3.0
-~ 25
,= 2 0
/,/
648 SVEIN SUNDBY
1.5
1.0
0.5
i
I , i •
.:::. "-.. /
.................... Re=0.5 ...........
0 0.5 10 15 20 2.5 30 35 /~ 0 45 mm diameter
Fig. 1. Terminal velocity at different values of density difference, Ap (g cm-3). Ranges of density difference and diameter for three pelagic fish egg species are plotted. (1) North Sea mackerel, (2)
Arcto-Norwegian cod, (3) North Sea plaice.
50
THEORY FOR V E R T I C A L D I S T R I B U T I O N OF P E L A G I C FISH EGGS
Probably the most correct opinion of how the eddy transfer coefficients vary through the mixed layer is represented, among others, by OTTESEN HANSE~ (1975): (a) A large interior region where the transfer coefficients are constant and are dominated by large whirls. (b) A thin top layer where the transfer coefficients decrease due to the effect of the boundary. (c) A layer thicker than the top layer below the interior region where the transfer coefficients decrease due to the boundary effect of the pycnocline below.
The pelagic fish egg species studied are primarily conf'med to the upper part of the mixed layer. However, the top layer Co) described above is probably thin compared to the water column over which the eggs are distributed. The eddy transfer coefficient is therefore taken to
A one-dimensional model for the vertical distribution of pelagic fish eggs 649
be constant in the layers in question. Assuming stationary conditions horizontal gradients of fish eggs the diffusion equation reduces to
and neglecting
~C(z) K + wC(z) = 0, (4)
~z
where K is the eddy diffusivity, C is the concentration of pelagic fish eggs, w is the terminal velocity of the fish eggs, and z is positive towards increasing depth. The equation shows that the vertical diffusion flux is balanced by the ascending velocity of the eggs.
The solution to equation (4) is
w C(z) = C(a) exp - ~ (z - a), (5)
where C(a) is the concentration of pelagic eggs at the depth a. An example of the function is shown in Fig. 2, curve 2.
For the above assumptions, equation (5) is valid for eggs that have a density lower than the upper mixed layer, as is the case for the three species studied. However, within each species there are variations in both density and diameter, which give different ascending velocities. SOL~raDAL and StINDBY (1981) investigated the correlation between the diameter and buoyancy of eggs from Arcto-Norwegian cod. The resulting computed ascending velocity was Gaussian distributed. CooMss et al. (1981) measured the ascending velocity of plaice eggs from the North Sea and found the larger part of them with ascending velocities of 0.8 to 2.7 mms -1 . It seems that such a distribution also may be well described by a Gaussian distribution function. The concentration profile, C, measured in the field is therefore a func- tion of depth, z, and ascending velocity, w, which here are independent variables. Equation (5)
CONCENTRATION OF EGOS
Fig. 2. Vertical profile of pelagic flsla eggs. (1) According to equation (17). (2) According to equa- tion (5).
650 SVEIN SUNDAY
can then be developed for N different numbers of ascending velocities w~:
N N Wi
C(z, w) = ~, Ct(z) = ~, Ct(a) exp - (z - a), (6) ~--1 /=1 - K -
where the concentration prof'de Ct is the profde of the eggs with ascending velocity w v d~ is now taken to be the total number of eggs with the ascending velocity w~ under a unit
surface
,41 = [HCt(z)dz. (7) J 0
Integrating gives
Hence
A t = C i ( a ) - e x p a l - e x p - H . Wf
(8)
Ct(0) -- T 1 - exp - H (9)
Let us now take all prof'tles o f eggs with different ascending velocities; m t is the fraction of eggs with ascending velocity w l. The total number of eggs, A, under a unit o f surface is then
N N A = ~ ratA, whereA l = ratA and ~ m t = 1. (10)
I=1 i=1
Inserting equations (9) and (10) into equation (6) gives the total concentration of eggs of all ascending velocities, wt:
C(z) = ~E C,(z) = miw , exp - ~ - w t 1 - exp - H (11) I=1 l=1 K
We now introduce m i as a continuous function f (w) . Equation (11) then becomes
A:m. Z( W)-I C(z) = ~__ | f ( w ) w exp - w 1 - exp - H dw,
K JWmin " f "K (12)
where Wmm and Wm~, are the upper and lower limits for the ascending velocity. As stated earlier, the ascending velocity distribution, f (w), can be described by the
Gaussian distribution function
1 1 f (w) = ~ exp - ~ a 2 (w - tt) 2, (I 3)
where o is the standard deviation and ~t is the mean ascending velocity. The last term o f equation (12) can be expanded in series:
( . l-exp- H =l+exp Kw+exp- K w+exp K w+. • (14)
A one-dimensional model for the vertical distribution of pelagic fish eggs 651
Equation (12) then becomes
A ['~m~x [ 1 1 C(z)=--~ J.'~i. / a----'~ exp-~ 'a2 ( w - la)2
. z ( . )} w e x p - ~ w l + e x p - - - w + e x p - - - w + . . , dw.
K K
Rearranging gives
C(z ) = X c ~ (z) = - - - - , - - Z L j---o aK~/2n j--o mm { [ l (,~-.I.-jH,) ~l,2 ] }
w e x p - ~ w 2 + K a2 w + ~ dw.
(15)
(16)
The integral of the exponential function with the second-order polynomial exponent is known. We use the solution and make a partial integration of equation (16). The final solution then becomes
j~ A [ (z-~_2I't)2 ~t (z +j H)] . (17) C ( z ) = 2./~ exp a2 " - K
~" c~ +j/./)] erf{~2 [w- ~t [Wmin [ ' - 'g "(Z G + - ~ ( z + i n ) .
When the concentration of eggs at the lower depth limit, H, is small, the higher order terms can be neglected and
c(z) ~ c°(z).
When mixing increases and higher concentrations at greater depths are introduced, higher order terms must be added. However, for the present data no higher than the second-order term has to be used.
By using equation (17) the mean eddy diffusivity coefficient, K, can be computed from the measured concentration profile and the computed ascending velocities.
The solution in (17) including the ascending velocity distribution differs from the solution in (5) for a constant ascending velocity (Fig. 2). The solution with the Gaussian distribution gives higher concentrations in the deeper layers because the more slowly ascending eggs make a larger contribution at greater depths.
A P P L I C A T I O N OF T H E O R Y
The theory is applied to measurements of the vertical distribution of three pelagic egg species, namely the North Sea mackerel, the North Sea plaice, and the Arcto-Norwegian cod.
652 SVE~N SUNDBY
Table 1. Investigations to which the theory is applied
Mackerel The northern June Clarke-Bumpus IVERSEN(1973) SOLEMDAL (Scorner scombrus) North Sea 1968-1972 plankton-sampler (unpublished data)
Plaice The southern Spring Neuston net and POMMERANZ COOMBS et al. (Pleuronectes North Sea 1968-1969 Gulf plankton (1973) (1981) platessa L.) sampler
Arcto-Norwegian Ves~orden at the March Submersible SOLEMDAL and SOLEMDAL and cod (Gadus northern 1980-1981 Flygt pump and SUNDBY (1981) SUNDAY (1981) morhua L.) Norwegian coast Plenger pump SOLEMDAL (1970)
For these species there also exist measurements of density and diameter so that ascending velocities can be computed. Table 1 summarizes the location and the type of sampling device used. In Fig. 1 ascending velocity is plotted as a function of diameter for different buoyancy values based on equations (1) and (2). Values for the three egg species are plotted in the figure.
Mackerel eggs
Mackerel spawns in the surface layers in the central and northern North Sea and the Skagerrak during May to July (MYP.eERGET, 1965). During the period a homogeneous upper layer down to 20 to 30 m develops. The layer is separated from the water masses below by a sharp density gradient. The eggs are rarely found below the pycnocline (IvERSEN, 1977).
Buoyancy of mackerel eggs from the North Sea was measured by Solemdal in 1971. The eggs have a low density relative to the natural environment and thus are more concentrated in the surface layers than are eggs of plaice and cod. Table 2 shows the mean egg diameter and mean neutral buoyancy of eight batches of mackerel eggs. The corresponding density of the natural environment is presented by L~Fa,~ (1980). Table 3 shows the buoyancy and diameter measurements and terminal velocities computed using equations (1) and (2). The mean ascending velocity is determined to be 1.8 mm s -1. Unfortunately, data on the s.d. of the ascending velocity are not available for mackerel.
IVERSEN (1973) used horizontally towed Clarke-Bnmpus plankton samplers at 0.5, 10, 20, and 30-m depth to sample mackerel eggs during the spawning seasons of 1968 to 1972 in the
Table 2. Mean neutral buoyancy in salinity and mean diameter of eight batches of mackerel eggs from the
Table 3. Measurements of egg buoyancy and diameter. Computed terminal velocities. Ap, Buoyancy in natural environment g cm-3; d, egg diameter ram; fv, computed mean terminal velocity mm s-I; a, s.d. of terminal velocity
North Sea plaice 0.5-3.0 1.85- COOMBSet al. (Pleuronectes 1.95 (1981) platessa L.) HmMSTRA (1962)
1 . 4 0 - -
Arcto-Norwegian cod 0.5-3.0 1.20- SOLEMDAL and 0.96 0.38 (Gadus morhua L.) 1.56 SUNDBY (1981)
SOLEMDAL (1970)
A
E
"1"
t~
EGG CONCENTRATION 5 10 15
0 ' ' ' ' ' " ' ' ' " i i i i i i
10,
20'
30' . j 10.
20. 2
38
EGG CONCENTRATION 0 5 10 15
i i i i i t t • i i i • . • • • , •
i , , . . . . . . , , , , , , • , . , ,
10- x x
20- 4 × 5
30- x x
o,. .... i . . . . . . . 10.
• x OBSERVED
20" - - COMPUTEO
30 Fig. Observed concentrations of North Sea mackerel eggs by IVERSEN (1973) from Beaufort 0
to 6 and non-linear regression of the observed values based on equation (17).
654 SVEIN SUNDBY
Table 4. Computed eddy dt~'usivity coefficients cm 2 s -1. Mackerel eggs: based on the vertical distribution by IVERSEN (1973) and buoyancy measurements by SOI_~MDAL (unpublished data). Plaice eggs: based on the vertical
distribution by POMMEI~NZ( 1973 ) and buoyancy measurements by COOMBS et al. ( 1981 )
Wind force (m s- ')
Species 0 to 0.3 to 1.6 to 3.4 to 5.5 to 8.0 to 10.8 to 0.2 1.5 3.3 5.4 7.9 10.7 13.8
Skagerrak and the northern North Sea. To demonstrate the effect of wind mixing he grouped the samples for all the years with respect to the Beaufort scale. The grouping showed a decrease in concentration with increasing depth and a decrease at the surface with increasing wind speed.
Non-linear regression analysis using equation (17) for the data is shown in Fig. 3 for Beaufort forces 0 to 6. Due to the lack of available data on the s.d. of the assumed Gaussian velocity distribution, the value was estimated by selecting the value that gives the minimum difference between observed and computed egg concentration. The average s.d. found in this way is 0.35 mm s ~ . The value is near the measured s.d. on Arcto-Norwegian cod (SOLEMDAL and SUNDSY, 1981) of 0.38 mm s -1 . Table 4 shows the computed eddy diffusivity coefficients based on the computed values for the mean ascending velocity of 1.8 mm s -~ and a s.d. of 0.35 mm s -~ (Table 3) and of non-linear regression of the material presented by IVERSEN (1973).
Plaice eggs
Plaice spawns near the sea bed in the southern North Sea during January, February, and March. The density of plaice eggs has been measured by COOMBS et al. (1981), who also measured the actual ascending velocity in laboratory conditions. The measured values are in good agreement with the corresponding values computed here. POMMERANZ (1973) sampled plaice eggs during the spawning seasons of 1968 and 1969 with a Gulf plankton sampler that sampled the entire water column and a neuston net that sampled only from 0 to 10 and 20 to 35-cm depths. Pommeranz also grouped his data in relation to the actual wind force from Beaufort 0 to 7 (Table 5, from Table 2 in POMMERANZ, 1973). The mean concentrations of the
Table 5. Data from Table 2 in POMMEe.ANZ (1973) showing the concentration of plaice eggs~lOOm 3 in the neuston net (0.17-m depth) and the GuOrplankton sampler (0 to 40-m depth) at different wind speeds
Beaufort 0 1 2 3 4 5 6 7
Number of samples 8 4 23 26 21 25 6 13 Neuston net 1192 63 647 115 183 77 237 426 Gulf plankton
sampler 138 17 95 60 80 103 111 102
A one-dimensional model for the vertical distribution of pelagic fish eggs 655
two neuston nets were used because of large variations between the two nets, especially at wind forces above Beaufort 3. The reason for this is pointed out by Pommeranz: "Das vom Neuston-Obernetz f'fltrierte Volumen ist yon Sdirke und Riehtung des Seegangs abhiingig. Da noch keine korrektuffaktoren vorliegen, wurde dieser Effekt nicht berficksightigt'. Therefore, the eddy diffusivity coefficient is here only computed for Beaufort forces 0, 1, and 2, i.e., when the wave height did not exceed the depth of the neuston net. The eddy diffusivity coefficient was computed by applying equation (11) for a = 0.17 m, which is the mean depth of the neuston net, and for H = 40 m, the mean depth of all the Gulf samples.
Cod eggs
The Arcto-Norwegian cod spawns at temperatures of 4 to 6°C close to the coast of northern Norway, particularly in Lofoten during March and April. Such temperatures are found in the transition layer between the upper cold coastal water and warmer Atlantic water below. The depth of the transition layer is highly dependent on the wind conditions (SuNDaY, 1978; FURNES and SuNDaY, 1981) and is found at depths between 50 and 150 m. The coastal water is usually homogeneous. The mean squared Brunt-Viiisiil~i frequency (N 2 = g/P 3p/~z) is < 10 -5 s -: . Convection due to atmospheric cooling of the surface water may be consider- able. The mixed layer is thick, often more than 50 m during the spawning season.
Unlike the wind conditions from the spawning fields of mackerel and plaice in the North Sea, in Lofoten there are strong sheltering effects due to the high surrounding mountains. The vertical turbulent forces set up are therefore highly dependent on the wind direction. Southwesterly wind sets up high seas into Vestfjorden, while other wind directions give moderate wave conditions.
Figure 4 illustrates the effect of wind mixing on cod eggs. The figure is based on data from 10 paired Juday net hauls from the spawning seasons of 1976 and 1977, showing the relative abundance of eggs older than 2 days in Juday net hauls from 100 to 30 m as a part of the total abundance in the whole water column (100 to 0 m) as a function of the mean wind speed for the previous 24 h. The Juday net hauls were taken at the spawning location Holla in Lofoten, and the wind force was measured at a local meteorological land station. Due to the sheltering effects of the mountains in Lofoten, only Juday net hauls during southwesterly
15-
~:lo-
l s -
1~ ' 2~ ' 3~ &O 50 60 70 %
Fig. 4. Fraction of cod eggs in percent in the deep .luday net haul (from 100 to 30 m) compared to the total number of the whole water column (100 to 0 m) as a function of the mean wind speed. Dots
are observed. Solid line is computed by using equations (17) and (18).
2O
3o
o_
EG
GS
I m
3
EG
GS
I m
3
50
10
0 15
0 2
00
2
50
3
00
3
50
0
50
10
0 15
0 2
00
2
50
3
00
3
50
o .
............................
_L-'
..................................
-'--~ .............
. i.-..---'..-x
20.
,,:,--
-'-
B
,:
'/
/ \
3
0
x/
50
10
0 15
0 20
0 2
50
3
00
3
50
0
SO
10
0 15
0 2
00
2
50
3
00
3
50
o ..
....
....
....
....
....
..
~:-
-_:=
:.;<
..
....
....
....
....
....
....
..
~:
-~
"
- ..
....
....
....
...
-i,.-
-
- "
-_ -_
-._-
= ,,,
x
10
- ~
;-x
~ ""
..x
- ...
....
....
....
..
/i
,'
I; '
/ /
5N
50
10
0 15
0 2
00
2
50
3
00
3
50
0
20
0
;OO
6
00
I~
.00
1000
12
00
1;00
..
...
, ..
..
, ..
..
j .
..
..
..
..
I
....
,
....
,
....
....
. O
BS
ER
VE
D
--
C
OM
PU
TE
D
Fig.
5.
Obs
erve
d co
ncen
trat
ions
of A
rcto
-Nor
weg
ian
cod
eggs
(SO
LEM
DAL a
nd S
UN
DBY
, 198
l) a
nd
non-
linea
r re
gres
sion
of
the
obs
erve
d va
lues
bas
ed o
n eq
uati
on 0
7).
m
:Z !
A one-dimensional model for the vertical distribution of pelagic fish eggs 657
winds are used here to get equal wave conditions. The egg concentration for the different hauls varied from 100 to 2000 eggs m -2 surface.
SOLEMDAL (1970) made a large number of measurements of buoyancy and diameter of cod eggs, which made it possible to compute the distribution of ascending velocities (SOLEMDAL and SUNDBY, 1981) (Table 3).
In March 1980 and 1981 cruises were made in Lofoten to investigate the vertical distribu- tion of cod eggs. The investigations were at the spawning sites at HzUa and in Austnesfjorden. A submersible Flygt pump and a Pleuger pump were used to profde the concentration of eggs down to 80 m. The pumps were held at f'Lxed depths, pumping 0.5 to 2.5 m 3 depending on the concentration of eggs. The method and some results are described by SOLEMDAL and SUNVBY (1981). Most of the results are from calm wind conditions, 0 to 5 m s -~, while two of the profiles were taken during fresh and strong breeze, respectively (Fig. 5). The computed non- linear regression is also plotted.
RELATION BETWEEN VERTICAL EDDY DIFFUSIVITY COEFFICIENT AND
WIND CONDITIONS
The material of IVERSEN (1973) on mackerel eggs and POMMERANZ (1973) on plaice eggs both give mean values for many profiles for each Beaufort force. In Fig. 6 the computed eddy
400
-- 30O T
LU
w 200- o
100
A
r l
0 ~ i = =
o 5
MEAN WIND VELOCITY (rns-1)
10
Fig. 6. Computed eddy diffusivity coefficients, K, based on measurements of: @, North Sea mackerel eggs; A, North Sea plaice eggs; and [3, Arcto-Norwegian cod eggs. Solid line is linear
regression between K and the square of the mean wind velocity, W 2.
6 5 8 SVEIN SUNDBY
diffusivity coefficients are plotted vs the mean wind speed. The data on cod eggs by SOLE~DAL and StmDSY (1981), however, are single profiles. The corresponding wind force for each of the profiles is taken to be the mean wind speed for the previous 6 h. A linear regres- sion between the eddy diffusivity coefficient and the square of the wind speed gives the follow- ing relation valid for 0 < W < 13 m s -~ :
K = 76.1 x 10 -4 + 2.26 x 10⁻⁴ W 2, (18)
where W is the wind velocity in m s -l and f is the eddy diffusivity coefficient in m 2 s -~ . The correlation coefficient is 0.95.
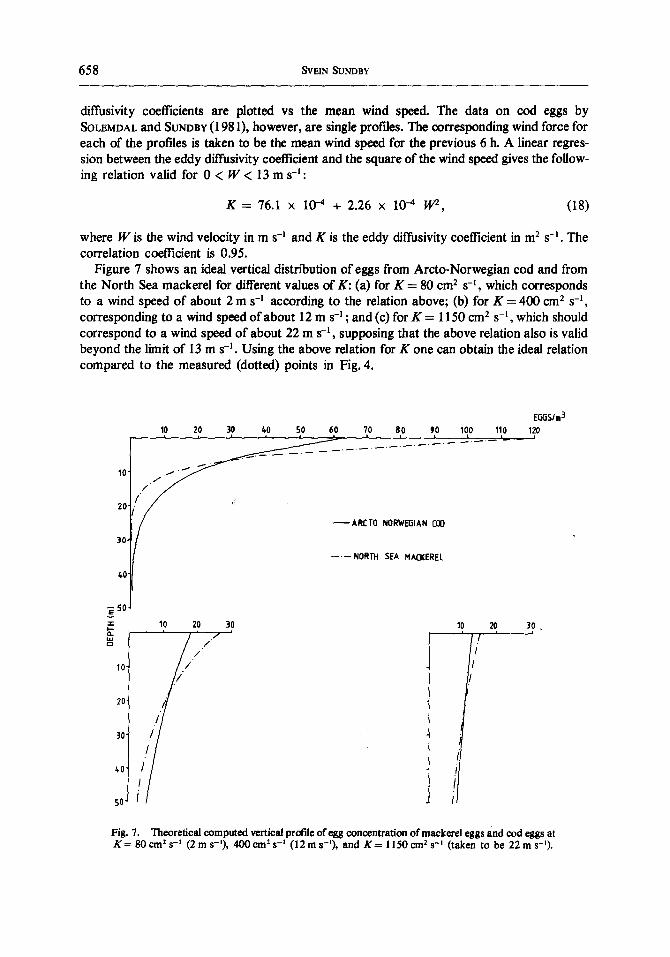
Figure 7 shows an ideal vertical distribution of eggs from Arcto-Norwegian cod and from the North Sea mackerel for different values of K: (a) for K = 80 cmz s -I , which corresponds to a wind speed of about 2 m s -1 according to the relation above; (b) for K = 400 cm 2 s -1, corresponding to a wind speed of about 12 m s -I ; and (c) for K = 1150 cm 2 s -l , which should correspond to a wind speed of about 22 m s -1 , supposing that the above relation also is valid beyond the limit of 13 m s -1. Using the above relation for K one can obtain the ideal relation compared to the measured (dotted) points in Fig. 4.
30 ̧
- - ' - -NORTH SEA MACI(EREL
4.0
~50
,_.= Io zo
10 /'/
20"
30"
40" / ,/ 50 J
~ A R C T O NORWEGIAN [OD
/
/
3O 1o 2o 3O, i
10 20 30 40 50 60 70 80 90 100 110 i i i i i i i i i i
2O
E6(iS/m 3 120
i
Fig. 7. Theoretical computed vertical profile of egg concentration o f mackerel eggs and cod eggs at K = 80 cmz s -~ (2 m s-~), 400 crn ~ s -1 (12 m s-l), and K = 1150 cm 2 s -I (taken to be 22 m s- ' ) .
A one-dimensional model for the vertical distribution of pelagic fish eggs 659
DISCUSSION
There seems to be fairly good agreement between the eddy diffusivity coefficients computed from the mackerel eggs and the cod eggs, even if they were taken at different times of the year and from different regions. The common feature is that the environment of the eggs is the same with respect to the vertical stability. There is little information about the hydrographic conditions for the plaice eggsin POMMEV.ANZ (1973), which ate sometimes found close to the coast in the southern North Sea. In the southern North Sea thin sheets of less saline water in the uppermost meter of the sea may have a lower density than the plaice eggs, and hence the eggs sink to greater depths. This may be a reason for the high value for eddy diffusivity of 140 cm 2 s -1 for Beaufort 1. Another explanation of the anomalous value may be the tidally generated vertical mixing, which is considerable in shallow coastal areas (IQtAAV, 1969; TALBOT, 1969).
A surprising feature of the relation shown in Fig. 6 is the high value of eddy diffusivity at low wind speeds. If the s.d. of the ascending velocity were underestimated it could give too large computed eddy diffusivities at low wind speed. However, for the material on cod (SOLEMDAL, 1970) this is unlikely because the available egg material was very large. Besides, the data on mackerel eggs show that the selected s.d. really gives the best curve fit. In principle, dead eggs, which sink, may also contribute to higher concentrations at greater depths, and hence give too high computed eddy diffusivity coefficient. However, although mortality of eggs has been observed in the laboratory, it has not been well documented in the field. Dead eggs sink rapidly because of their increased density. This is because osmoregula- tion stops and the salinity of the cytoplasm will increase to that of the environment. I have computed sinking speeds of dead cod eggs and found them to be about 10 times larger than the ascending speeds of live eggs. Thus, mortality must be significant to give a detectable effect on the vertical profile.
The most reasonable explanations for the high eddy diffusivity at low wind speeds are tide- induced vertical mixing or that the decay time of the turbulent energy is longer than expected.
The concentration profiles of the cod eggs show that there may be considerable microscale variation in the upper 20 m of the sea. The scale of such variations agrees well with that assumed by LEDBEVrER (1979) for Langmuir circulation. Another feature of the variations is that they vary rapidly in time. Doing profiles at the same position every second hour, it was not possible to identify the same microstructures from one profile to the other, nor was it possible to observe any continuous development of the microstructures.
All observations of the vertical distribution of pelagic fish eggs used in this paper were at wind speeds < 13 m s -1. Considerable practical problems arise by using towed nets beyond such speeds, and this may be why there have been no such observations. The present method for computing the eddy diffusivity is of course most sensitive when the gradients of egg con- centrations are large. From Fig. 7 it is evident that the variations of the gradient are largest in the wind speed interval 0 to 13 m s -~ . Increasing the mixing from K = 400 cm 2 s -t (12 m s -1) to K = 1150 cm 2 s -1 results in only a slightly different prof'de, even for the mackerel eggs, which have the largest ascending velocity. For good estimates of the eddy diffusivity at high wind speeds it is necessary to have observations of pelagic eggs with very high ascending velocities to maintain detectable vertical gradient.
Acknowledgement--I would like to thank PER SOLEMDAL for helpful discussions on the biology of pelagic eggs. He also supplied me with his data on physical properties of pelagic fish eggs.
660 SVEIN SUNWY
R E F E R E N C E S
ALDERDICE D. F. and C. R. FORRESTER (1971) Effects of salinity and temperature on embryonic development of the petrale sole (Eopsetta jordanO. Journal of the Fisheries Research Board of Canada, 28, 727-744.
COOM~S S. H. (198i2 A density-gradient column for determining the specific gravity of fish eggs, with particular referen ~ to eggs of the mackerel ( Scomber scombrus). Marine Biology, 63: ! 01-106 .
COOMBS S.H., D. HARDING, J.H. NICHOLS and C.A. FOSH (1981) The vertical distribution and buoyancy of eggs of plaice, Pleuroneetes platessa L., in the southern North Sea. Council Meeting of the International Council for the Exploration ofthe Sea, 1981/(3: 84, 7 pp. (Mimeo)
DALLAVALLE J. M. (1948) Micromeritlcs. The technology of fine particles. Pitman, New York, pp. 11-30. ELLERTSF~ B., E. MOKSNESS, P. SOLEMDAL, T. STR~MME, S. TI~ETH, T. WESTOARD and V. EhESTAD (1977)
Vertical distribution and feeding of cod larvae in relation to occurrence and size of prey organisms. Council Meeting of the International Council for the Exploration of the Sea, 1977/L: 33, 31 pp.
FURNES G. K. and S. SUNDAY (1981) Upwelling and wind induced circulation in Vestfjorden. Proceedings from the Norwegian Coastal Current Symposium, Geilo, Norway, 9-12 Sep 1980. Vol. 1. University of Bergen, pp. 152-77.
HAUG T., E. KJORSVIK and J.H. SUNDET (1982) A preliminary note on the ecology of eggs and larvae of the Atlantic halibut (Hippoglossus hippoglossus L.). Council Meeting of the International Council for the Exploration of the Sea, 1982/G: 9, 16 pp.
HIEMSTRA W. H. (1962) A correlation table as an aid for identifying pelagic fish eggs in plankton samples. Journal du Conseil, Conseil Permanent International pour l'Exploration de la Mer, 3 !, 170-195.
HUTCHINSON G. E. (1967) A treatise on limnology, Vol. 2, John Wiley, New York, 1115 pp. IVERSEN S. A. (1973) Utbredelse og mengde av makrellegg (Scomber scombrus) og zooplankton i Skagerrak og
nordlige dei av Nordsjzcn i ~rene 1968--1972. [Distribution and abundance of mackerel eggs (Scomber scombrus) and zooplankton in the Skagerrak and northern parts of the North Sea during the year 1968-1972.] Cand.Real.-Thesis, University of Bergen, 71 pp. (In Norwegian.)
IWRSEN S. A. (1977) Spawning, egg production and stock size of mackerel (Scomber scombrus L.) in the North Sea 1968-1975. Council Meeting of the International Council for the Exploration of the Sea. 1977/H: 77, 19 PP.
KANDLER R. (1949) Untersuchungen fiber den Ostseedorsch w~ihrend der Forschungsfahrten mit dem R.F.D. "Poseidon" in den Jahren 1925-1938. Berichte der Deutschen Wissenschafllichen Kommission ffw Meeresforschung. Neue Folge 11, pp. 162-168.
KRAAV V.K. (1969) Computation of the semidiurnal tide and turbulence parameters in the North Sea. Oceanology, 9, 332-341.
KULLENBERG G. E. B. (1976) On the vertical mixing and the energy transfer from the wind to the water. Tellus, 28, 159-165.
LEDBETTER M. (1979) Langmuir circulations and plankton patchiness. Ecological Modelling, 7, 289-310. I.JOEN R. (1980) Atlas of mean temperature, salinity and density in the summer from the northern North Sea.
Fisken og Havet, 1980 (2), 37 pp. MYRBERGET S. (1965) Distribution of mackerel eggs and larvae in the Skagerrak 1957-1959. Fiskeridirektoratets
skrifter Serie Havunderswkelser, 13, 20--28. OAKEY N. S. and J. A. ELtZOTr, (1980) Dissipation in the mixed layer near Emerald Basin. Marine Turbulence
Proceedings of the 1 lth International Li/~ge Colloquium on Ocean Hydrodynamics, edited by J. C. J. Nihoul, pp. 123-133.
OTTESEN HANS~ N.E. (1975) Entrainment in two-layered flows. Institute of hydrodynamics and hydraulic engineering. Technical University of Denmark Series, Paper 7, 99 pp.
POMMERANZ T. (1973) Das Vorkommen yon Fiseheicrn, in besonders yon Eiern der Seholle (Pleuronectes platessa L.), in den oberfiachennahen Wasserschichten der siidlichen Nordsee. Berichte der Deutschen Wissenschaftlichen Kommission fftr Meeresforschung, 22, 427--444.
RIIS-VESTERGAARD J. (1983) Water and salt balance of halibut eggs and larvae (Hippoglossus hippoglossus L.). Marine Biology (In press).
SMAYDA T. J. (1970) The suspension and sinking of phytoplankton in the sea. Oceanography and Marine Biology. Annual Review, 8, 353-414.
SOLEMDAL P. (1970) Intraspecific variations in size, buoyancy and growth of eggs and early larvae of Arcto- Norwegian cod, Gadus morhua L., due to parental and environmental effects. Council Meeting of the Inter- national Co-ncil for the Exploration of the Sea, 1970/F: 28, 11 pp. (Mimeo.)
SOLEMDAL P. (1973) Transfer of Baltic fiat fish to a marine environment and the long term effects on reproduction. OIKOS, Supplement, 15, 268-276.
SOLEMDAL P. and S. SUNDBY (1981) Vertical distribution of pelagic fish eggs in relation to species, spawning behaviour and wind conditions. Council Meeting of the International Council for the Exploration of the Sea, 1981/G: 77, 27 pp. (Mimeo.)
A one-dimensional model for the vertical distribution of pelagic fish eggs 661
SUNDBY S. (1978) In/out flow at coastal water in Vestfjorden. Council Meeting of the International Council for the Exploration of the Sea, 1978/C: 51, 17 pp. (Mimeo.)
SUNDNES G., H. LEIVESTAD and O. IVERSEN (1965) Buoyancy determination of eggs from cod, Gadus morhua L., Journal du Conseil, Conseii Permanent International pour rExploration de la Mer, 29, 245-252.
SVERDRUP H. U., M. W. JOHNSON und R. H. FLEMING (1942) 7~t/e oceans, their physics, chemistry and general biology. Prentice-Hall, New York, pp. 481--484.
TALBOT J. W. (1969) The dispersal of plaice eggs and larvae in the Southern Bight of the North Sea. Journal du Conseil, Conseil Permanent International pour rExpioration de ia Met, 37, 221-248.
TILSETH S. and B. ELLERTSEN (1982) The detection and distribution of larval cod (Gadus morhua L.) food organisms by an in situ particle counter. U.S. Fisheries Bulletin (In press).