A paired apatite and calcite clumped isotope thermometry approach to estimating Cambro-Ordovician seawater temperatures and isotopic composition Kristin D. Bergmann a,⇑ , Seth Finnegan b , Roger Creel a , John M. Eiler c , Nigel C. Hughes d , Leonid E. Popov e , Woodward W. Fischer c a Department of Earth, Atmospheric and Planetary Sciences, Massachusetts Institute of Technology, Cambridge, MA 02139, United States b Department of Integrative Biology, University of California, Berkeley, Berkeley, CA 94720, United States c Division of Geological and Planetary Sciences, California Institute of Technology, Pasadena, CA 91125, United States d Department of Earth Sciences, University of California, Riverside, Riverside, CA 92521, United States e Department of Geology, National Museum of Wales, Cardiff CF10 3NP, Wales, UK Received 8 February 2017; accepted in revised form 10 November 2017; Available online 6 December 2017 Abstract The secular increase in d 18 O values of both calcitic and phosphatic marine fossils through early Phanerozoic time suggests either that (1) early Paleozoic surface temperatures were high, in excess of 40 °C (tropical MAT), (2) the d 18 O value of sea- water has increased by 7–8‰ VSMOW through Paleozoic time, or (3) diagenesis has altered secular trends in early Paleozoic samples. Carbonate clumped isotope analysis, in combination with petrographic and elemental analysis, can deconvolve fluid composition from temperature effects and therefore determine which of these hypotheses best explain the secular d 18 O increase. Clumped isotope measurements of a suite of calcitic and phosphatic marine fossils from late Cambrian- to Middle-late Ordovician-aged strata–the first paired fossil study of its kind–document tropical sea surface temperatures near modern temperatures (26–38 °C) and seawater oxygen isotope ratios similar to today’s ratios. Ó 2017 Elsevier Ltd. All rights reserved. Keywords: Clumped isotope; Apatite; Calcite; Seawater; Oxygen isotope 1. INTRODUCTION Carbonate and phosphatic rocks retain our most com- plete evidence of climatic conditions in Earth’s deep past. Determining how temperature and seawater oxygen isotope (d 18 O) fluctuations influenced carbonate and phosphatic d 18 O records over geologic time, therefore, is crucial for understanding the coupled evolutions of Earth’s climate and biota. This is particularly true in early Paleozoic time, when climate transitions are hypothesized to have played a major role in the radiation of many animal lineages (e.g. Rasmussen et al., 2016; Trotter et al., 2008). Efforts to extrapolate from these d 18 O records broader inferences about climate and biotic evolution have been hampered, however, by the difficulty of making meaningful comparisons among data derived from disparate sources. For example, d 18 O measurements of conodont apatite by secondary ion mass spectrometry (SIMS) were used to propose high Early Ordovician sea surface temperatures >40 °C that declined to modern-like surface temperatures (<25 °C) by late Middle Ordovician time; this cooling was https://doi.org/10.1016/j.gca.2017.11.015 0016-7037/Ó 2017 Elsevier Ltd. All rights reserved. ⇑ Corresponding author. E-mail address: [email protected](K.D. Bergmann). www.elsevier.com/locate/gca Available online at www.sciencedirect.com ScienceDirect Geochimica et Cosmochimica Acta 224 (2018) 18–41
Transcript
Available online at www.sciencedirect.com
www.elsevier.com/locate/gca
ScienceDirect
Geochimica et Cosmochimica Acta 224 (2018) 18–41
A paired apatite and calcite clumped isotopethermometry approach to estimating
Kristin D. Bergmann a,⇑, Seth Finnegan b, Roger Creel a, John M. Eiler c,Nigel C. Hughes d, Leonid E. Popov e, Woodward W. Fischer c
aDepartment of Earth, Atmospheric and Planetary Sciences, Massachusetts Institute of Technology, Cambridge, MA 02139, United StatesbDepartment of Integrative Biology, University of California, Berkeley, Berkeley, CA 94720, United States
cDivision of Geological and Planetary Sciences, California Institute of Technology, Pasadena, CA 91125, United StatesdDepartment of Earth Sciences, University of California, Riverside, Riverside, CA 92521, United States
eDepartment of Geology, National Museum of Wales, Cardiff CF10 3NP, Wales, UK
Received 8 February 2017; accepted in revised form 10 November 2017; Available online 6 December 2017
Abstract
The secular increase in d18O values of both calcitic and phosphatic marine fossils through early Phanerozoic time suggestseither that (1) early Paleozoic surface temperatures were high, in excess of 40 �C (tropical MAT), (2) the d18O value of sea-water has increased by 7–8‰ VSMOW through Paleozoic time, or (3) diagenesis has altered secular trends in early Paleozoicsamples. Carbonate clumped isotope analysis, in combination with petrographic and elemental analysis, can deconvolve fluidcomposition from temperature effects and therefore determine which of these hypotheses best explain the secular d18Oincrease. Clumped isotope measurements of a suite of calcitic and phosphatic marine fossils from late Cambrian- toMiddle-late Ordovician-aged strata–the first paired fossil study of its kind–document tropical sea surface temperatures nearmodern temperatures (26–38 �C) and seawater oxygen isotope ratios similar to today’s ratios.� 2017 Elsevier Ltd. All rights reserved.
Carbonate and phosphatic rocks retain our most com-plete evidence of climatic conditions in Earth’s deep past.Determining how temperature and seawater oxygen isotope(d18O) fluctuations influenced carbonate and phosphaticd18O records over geologic time, therefore, is crucial forunderstanding the coupled evolutions of Earth’s climateand biota. This is particularly true in early Paleozoic time,
https://doi.org/10.1016/j.gca.2017.11.015
0016-7037/� 2017 Elsevier Ltd. All rights reserved.
when climate transitions are hypothesized to have playeda major role in the radiation of many animal lineages(e.g. Rasmussen et al., 2016; Trotter et al., 2008).
Efforts to extrapolate from these d18O records broaderinferences about climate and biotic evolution have beenhampered, however, by the difficulty of making meaningfulcomparisons among data derived from disparate sources.For example, d18O measurements of conodont apatite bysecondary ion mass spectrometry (SIMS) were used topropose high Early Ordovician sea surface temperatures>40 �C that declined to modern-like surface temperatures(<25 �C) by late Middle Ordovician time; this cooling was
K.D. Bergmann et al. / Geochimica et Cosmochimica Acta 224 (2018) 18–41 19
postulated to have spurred the radiation of diverse skele-tonized calcitic taxa in the Middle Ordovician(Rasmussen et al., 2016; Trotter et al., 2008). In contrast,d18O records of Paleozoic brachiopods have been used toargue that early Paleozoic calcitic skeletons grew at extre-mely low temperatures (e.g. 2 �C) (Giles, 2012), and thatthe bulk isotopic composition of seawater increased 7‰from early Paleozoic values to present levels (Jaffres et al.,2007; Kasting et al., 2006; Prokoph et al., 2008; Veizeret al., 1999, 1997; Veizer and Prokoph, 2015). These largediscrepancies in interpretation arise from different mineralsystems, different dataset approaches, and divergentassumptions about the cause of the observed mineralogicald18O increase over the early Paleozoic (Fig. 1).
The secular increase in oxygen isotope values docu-mented in ancient carbonates, apatites, and cherts in theearly Paleozoic and extending though the Phanerozoic era(Knauth and Epstein, 1976; Karhu and Epstein, 1986;Shields and Veizer, 2002; Jaffres et al., 2007; Prokophet al., 2008; Shemesh et al., 1988; Veizer et al., 1997) (earlyPaleozoic increase shown in Fig. 1) has three end-member
-10
-5
0
10
15
20
-10
-5
0
005 084
min
eral
δ18
OV
PD
B (‰
)ap
atite
δ18
OV
SM
OW
(‰)
min
eral
δ18
OV
PD
B (‰
)
BrachiopodMatrixRugose Coral
ConodontTrilobite
Linguliform BrachiopodPhosphate Nodule
Fig. 1. Composite mineral d18O from Cambrian, Ordovician and eabrachiopods (diamonds) from tropical sites replotted from (Veizer etlinguliform brachiopods (squares) compiled from (Bassett et al., 2007; Eet al., 2000). (C) d18OVPDB from calcitic brachiopods (blue diamonds), tril(blue circles), and CO2 generated from carbonate groups substituted into(brown diamond). The data from this study are overlaid on transparentstudy that span three significant positive carbon isotope excursions (SPreferences to color in this figure legend, the reader is referred to the web
explanations: (1) surface ocean temperatures havedecreased since Precambrian time; (2) seawater oxygen iso-topic composition has increased through time; or (3) diage-nesis has altered older rocks more than younger samples. Ithas been difficult to evaluate the relative importance ofthese hypotheses because d18O depends both on deposi-tional temperature and on the isotopic composition of thewater from which a mineral precipitates. Although prefer-ential diagenetic alteration of older materials cannotexplain the entire d18O trend in carbonate, phosphate,and chert that declines in parallel through the Phanerozoic(Joachimski et al., 2004; Veizer et al., 1999), there is at pre-sent no consensus on which of the remaining hypothesesbest explains the secular increase.
Paired isotopic analyses of co-occurring sample suites ofapatite and calcite (Joachimski et al., 2004; Wenzel et al.,2000) or apatite and chert (Karhu and Epstein, 1986) pro-vide a useful way to test the relative quality of the archivesheld by different phases via their mutual equilibrium frac-tions. Previous paired studies, however, have producedvariable results and yielded conflicting interpretations.
064 044Age
A
B
C
rly Silurian-aged shells and matrix. (A) d18OVPDB from calcitical., 1999). (B) apatite d18OVSMOW from conodonts (circles) andlrick et al., 2011; Lecuyer et al., 1998; Trotter et al., 2008; Wenzelobites (green reverse triangles), rugose corals (pink triangles), matrix
linguliform brachiopods (orange squares), and phospatic nodulescalcitic brachiopod data from (Veizer et al., 1999). Data from thisICE, GICE and HICE) are highlighted. (For interpretation of theversion of this article.)
20 K.D. Bergmann et al. / Geochimica et Cosmochimica Acta 224 (2018) 18–41
Early work, with imperfect temperature relationships, pos-tulated that equilibrium precipitation of two phases impliedexceedingly warm ocean temperatures and no change inbulk fluid d18O (Karhu and Epstein, 1986; Shemesh et al.,1988) whereas other studies have argued that one or moremineral phases precipitated out of equilibrium with primaryfluids or were subsequently altered (Bassett et al., 2007;Joachimski et al., 2004; Wenzel et al., 2000). Recent studiesredefining the phosphate-water equilibrium fractionationrelationship (Chang and Blake, 2015; Puceat et al., 2010)have also undermined previous interpretations of pairedstudies of phosphate-carbonate (Joachimski et al., 2004;Wenzel et al., 2000) and phosphate-chert (Karhu andEpstein, 1986), as well as d18O phosphate records(Shemesh et al., 1988; Trotter et al., 2008). Additionally,analytical methods to isolate and measure the d18O ofPO4 have varied substantially and yielded inconsistentresults (Puceat et al., 2010). Recent efforts have also recal-ibrated the composition of NBS 120-C, a standard com-monly used to calibrate phosphate oxygen isotope ratiomeasurements (Puceat et al., 2010).
Carbonate clumped isotope thermometry, a measure ofcrystallization temperature not influenced by fluid d18O iso-tope composition (Eiler, 2007), can substantiate observedd18O trends in O-bearing marine precipitates through earlyPaleozoic time. When paired with classical d18O paleother-mometry (Urey, 1947; Friedman and O’Neil, 1977; Kimand O’Neil, 1997), the technique can also establish the iso-topic composition of the seawater, formationwater, or diage-netic fluid with which the mineral last equilibrated and, whencombined with petrographic and elemental analysis, canuntangle primary isotopic signals from diagenetic artifacts.
Here we use carbonate clumped isotope thermometry toconstruct from calcitic and phosphatic biominerals andother fabrics a paired phosphate-calcite record for partsof the Cambrian and Ordovician periods—the interval withthe most substantial observed change in global d18O recordsin the Phanerozoic era (Fig. 1) (Veizer et al., 1997). Bio-genic phosphates behave differently from calcitic biominer-als during diagenesis and serve as an important geochemicalarchive of seawater conditions prior to the diversification ofthick-shelled calcitic skeletons in many groups during theOrdovician biodiversification (Pruss et al., 2010; Trotteret al., 2008). Building on previous phosphatic calibrationstudies of carbonate clumped isotope thermometry in boneand teeth (Eagle et al., 2010, 2011; Wacker et al., 2016), wealso measure the clumped isotope values (D47) of CO2
extracted from modern linguliform brachiopods withknown growth temperatures. We compare measurementsof the d18O of CO3 groups with the d18O of PO4 groupsin these phosphatic brachiopods to test whether theclumped isotope measurements yield equilibrium fractiona-tion patterns consistent with primary growth temperatures.
2. SAMPLES AND ANALYTICAL METHODS
2.1. Modern brachiopod materials
The modern brachiopods used for calibrationincluded calcitic brachiopods and both extant genera of
linguliforms—Lingula and Glottidia—collected from fivelocations worldwide: Florida, southern California, Hawaii,the Philippines and Japan. To best calibrate the measure-ments in modern samples, shells grown in a range of meanaverage temperatures were selected. Linguliform valves ofGlottidia albida from Terminal Island and Newport Bay,CA, and one specimen of the calcitic rhynchonelliform bra-chiopod Terebratalia transversa from the San Pedro Jetty,Los Angeles, CA, were analyzed to compare calcite andphosphate shell materials from nearby localities. Samplesof Lingula reevii were raised in the Waikiki Aquarium for>5 years at a known temperature after being harvestedfrom Kaneohe Bay, Hawaii. Because the Waikiki Aquar-ium used local seawater and temperature ranges, weassumed that the move from Kaneohe Bay caused a mini-mal change in temperature. Lingula ungis valves were col-lected from the Polillo Islands, Philippines, and Glottidia
pyramidata valves were collected from Tampa Bay, Florida.Lingula anatina valves were collected from the tidal flats ofAriake Bay, Japan. A deep-sea calcitic brachiopod was ana-lyzed as a cold temperature end-member. The single valvewas collected from Monterey Canyon up dip of Shepard’sMeander near studied whale falls, where benthic tempera-tures range from 2 to 7 �C (Lundsten et al., 2010). Thiscalibration suite spans a temperature range of 2–35 �C(Supplemental Materials, D).
2.2. Middle to Late Ordovician fossil materials
Samples of calcitic and phosphatic fossil materials werecollected from six stratigraphic sections of the Late Ordovi-cian (Sandbian-early Katian) Decorah Formation in Min-nesota, Iowa and Wisconsin in the summers of 2010 and2011 (Emerson, 2002; Sell et al., 2015). The unit containsfour bentonite ash deposits: the Deicke, Millbrig, Elkportand Dickeyville beds, which can be correlated across east-ern North America (Sell et al., 2015). The Decorah Forma-tion strata also capture the Guttenberg Carbon IsotopeExcursion (GICE) (Ludvigson et al., 2004; Simo et al.,2003). The Decorah Formation sections in Iowa and Min-nesota have experienced minimal burial and remain belowthe oil window based on thermal maturity estimates fromorganic material (Tmax < 441 �C, hydrogen indices of278–1024 mg HC/g TOC) and conodonts (CAI = 1)(Smith and Clark, 1996; Rohrssen et al., 2015). NorthernWisconsin sections not explored in this study have Missis-sippi Valley Type (MVT) mineralization. Biomarker analy-ses from these MVT-deposits indicate peak burialtemperatures of 95–118 �C, Ro values of 0.6–0.8 and Tmaxof 425 �C (Barker and Pawlewicz, 1994; Rowan andGoldhaber, 1996). Maximum burial depth estimates rangefrom 600 to 900 m and assuming a 25 �C/km geothermalgradient and a 22 �C surface temperature, expected burialtemperatures are 37–47 �C outside of the zone of MVTmineralization (Rowan and Goldhaber, 1996). This is wellbelow the temperatures needed to generate solid statereordering with <1 �C expected reordering for rocks heldat 75 �C for 100 million years (Henkes et al., 2014;Stolper and Eiler, 2015). Brachiopods, rugose corals, trilo-bites, crinoids and bryozoa including Prasapora sp. were
K.D. Bergmann et al. / Geochimica et Cosmochimica Acta 224 (2018) 18–41 21
collected for analysis because of their diverse range of mate-rial properties. Large Lingulasma galenaense phosphaticbrachiopods and phosphatic nodules were collected fromthe Decorah Bruening Quarry and Pole Line Road locali-ties near Decorah, Iowa (Emerson, 2002; Bergstrom andMcKenzie, 2005; Simo et al., 2003) (Fig. 2).
The strata of the Volkhov, Kunda and Aseri Stages(Floian-Darriwilian) of Estonia and adjacent Russia is areamong the few successions on earth that preserve abundantcalcitic fossil materials from Middle Ordovician-aged rockswith burial history below the oil window (Egerquist andEgerquist, 2003; Rohrssen, 2013; Dronov et al., 2005;Popov et al., 2005; Rasmussen et al., 2016). The entirethickness of the Ordovician Strata is 100 m and total burialestimates are similarly minimal suggesting solid statereordering is a non-issue (Stolper and Eiler, 2015; Henkeset al., 2014; Rasmussen et al., 2016). Calcitic brachiopodsfrom the lower part of the Volkhov Formation werecollected by P. Fedorov and provided by L. Popov. From
A B
C D
E F
Fig. 2. Field photographs and shell materials of the Eau Claire and DeClaire Formation near Strum, Wisconsin. (B) Mixed poorly lithified mudFormation at the Decorah Bruening Quarry, Decorah, IA. (C) Mineralizepoorly lithified mudstone near Rochester, MN. (D) Abundant iron ooiLingulasma galenaense recovered from the St. James Member of the Dsample of Lingulepis sp. from the Crepicephalus zone of the Eau Claire F
collectors, we also purchased exceptionally preserved trilo-bites contained within a carbonate wackestone matrix fromthe Russian Aseri and Kunda Formations.
2.3. late Cambrian fossil materials
Phosphatic linguliform brachiopods were collected fromfive Eau Claire Formation localities in Wisconsin in thesummer of 2011. The different localities sampled for thisstudy are all from siliciclastic-dominated, nearshore to mar-ginal marine environments, with fossils collected by split-ting sandstone outcrop hand samples (Fig. 2). Due to thesample sizes required for clumped isotope analysis, we werenot able to collect samples from coeval offshore depositsbecause these are known only from drill cores. The collec-tion sites in Strum, Colfax, and Remington Quarry, Wis-consin, have different dominant species of Lingulepis andspan two trilobite zones, the Cedaria and Crepicephalus
zones (Cowan et al., 2005). The Lingulepis specimens from
corah Formations. (A) Nearshore sandstone lithology of the Eaustone and cemented packstone carbonate lithologies of the Decorahd hardground surfaces with significant burrowing interbedded withds from the middle Decorah Formation near Rochester, MN. (E)ecorah Formation at the Decorah Bruening Quarry. (F) preparedormation near Strum, WI.
22 K.D. Bergmann et al. / Geochimica et Cosmochimica Acta 224 (2018) 18–41
the Cambrian Eau Claire Formation sampled near Colfax,WI are relatively thin, white, and in certain cases have lostall luster in the outer shell. The Lingulepis specimens fromStrum, WI display brown growth banding and are generallythicker and iridescent. The better preserved shells fromStrum, WI were analyzed as part of this study (Fig. 2,ECIB). The Eau Claire Fm. burial history is minimal andbroadly similar to the Decorah Formation as it is even clo-ser to the maximum Paleozoic outcrop extent again sug-gesting solid state reordering is not an issue in thislocality (Henkes et al., 2014; Stolper and Eiler, 2015). Thetotal Cambrian-Early Ordovician stratigraphic thicknessin the Eau Claire area is 100–150 m thick and no youngerstratigraphy is outcropping (Runkel et al., 2007).
2.4. Sample processing
We extracted phosphatic linguliform brachiopod shellsfrom the Eau Claire Formation using a Dremel hand drill,sonication in DI water and sand abrasion. Phosphatic shellsfrom the Decorah Formation were isolated using dentalpicks. Once extracted, all taxa were cleaned with a varietyof tools including dental picks, toothbrush, sand abrasion,and sonication.
For isotopic and XRD analyses, calcitic brachiopodshells were gently crushed and picked under a dissectingmicroscope for flakes preserving shell ultrastructure:blocky zones of recrystallization were avoided. Frag-ments of well-preserved shell ultrastructure were thenpowdered in a mortar and pestle. Trilobite fragmentswere crushed and powdered. Rugose corals were sec-tioned in two directions and a small portion of skeletalmaterial was drilled, avoiding visible cement-filled bor-ings and cavities.
A sample of many isolated and cleaned linguliform bra-chiopod fragments from the same horizon was powdered.Because modern lingulid skeletons typically contain sub-stantial amounts of organic matter—and organic com-pounds can challenge clumped isotope massspectrometry—we assessed the precision and accuracy ofseveral cleaning protocols for modern and ancient samplesin order to find the best way to removing organic materialprior to analysis. The range of protocols that we testedincluded: no cleaning, 3% H2O2 for 4 h, 30% H2O2 for 24h, 50–50 30% H2O2 and 3% NaOCl for 24 h, and 50–5030% H2O2 and 1 M NaOH until no further reaction wasnoticeable (over 36 h). All powders were then treated witha 0.1 M buffered acetic and acetate solution for 12 h toremove labile organic-hosted carbonate groups (Kochet al., 1997).
2.5. SEM/electron microprobe
We used a ZEISS 1550 VP Field Emission ScanningElectron Microscope (SEM) equipped with an OxfordINCA Energy 300 X-ray Energy Dispersive Spectrometer(EDS) system in the California Institute of TechnologyGeological and Planetary Sciences Division AnalyticalFacility to characterize the mineralogy and textures of thesamples prior to isotopic analysis. Images were collected
at a working distance between 7–9 mm using a QuadrantBack-Scattering Detector (QBSD).
Using a JEOL JXA-8200 Electron Microprobe, wemade quantitative elemental spot analyses and elementalmaps of the fossil materials on the fossil materials to mea-sure and image micro-scale trace metal abundances in dif-ferent sample textures. For all quantitative results, theaccelerating voltage was 15 kV, the beam current was20nA, and the beam size was 1 mm. The CITZAF methodwas used for matrix correction. Sample standards for thefive chemical elements analyzed on calcitic samplesincluded: calcite for Ca, dolomite for Mg, siderite for Fe,rhodochrosite for Mn, strontianite for Sr, and anhydritefor S. Ca had an average detection limit of 161 ppm,Mg–294 ppm, Fe–312 ppm, Mn–293 ppm, Sr–507 ppm,and S–91 ppm. Sample standards for the ten elementsmapped on the linguliform brachiopod included: anhydritefor S, apatite for P, cerium phosphate for Ce, albite for Na,fluorine mica for F, apatite for Ca, yttrium phosphate forY, dolomite for Mg, siderite for Fe, and strontianite for Sr.
For 63 of the 130 calcitic clumped isotope samples, analiquot of powder was analyzed for trace metals on anICP-OES. We dissolved between 1 and 3 mg of powder in3 mL of dilute nitric acid for 24 h at 25 �C at the CaliforniaInstitute of Technology. Samples were analyzed at the JetPropulsion Laboratory using a Thermo iCAP 6300 radialview ICP-OES with a Cetac ASX260 autosampler withsolutions aspirated to the Ar plasma using a peristalticpump. Three standard solutions of 10 ppb, 100 ppb and1 ppm of Fe, Mn, and Sr were run between every 8 sampleunknowns. A methods blank was also analyzed during theanalytical run.
2.7. Bulk powder x-ray diffraction (XRD)
XRD measurements were made on powders of the lin-guliform brachiopod materials used for clumped isotopemeasurements on a PANalytical X’Pert Pro within theDepartment of Applied Physics and Materials Science atthe California Institute of Technology. Scans were run from5–70� 2h with a step size of 0.008 and a scan step time of10.16 s. A Cu anode was used at 45 kV and 40 mA. Azero-background silicon plate was used for all measure-ments because of sample size limitations. Mineralogicalphases that most closely matched a given linguliform bra-chiopod sample were identified using the X’Pert HighscoreIDMin function.
2.8. Carbonate clumped isotope thermometry
Samples were analyzed between December 2010 andJanuary 2013. We weighed 9–12 mg of calcitic powder or100–200 mg of phosphatic powder into silver capsules.The powders reacted in a phosphoric common acid bath(�103%; 1.90 < q < 1.92) for 20 min at 90 �C. EvolvedCO2 was collected and purified with an automated acid
K.D. Bergmann et al. / Geochimica et Cosmochimica Acta 224 (2018) 18–41 23
digestion and gas purification device as described by Passeyet al. (2010). This device includes passing the CO2 throughmultiple dry ice/ethanol and liquid nitrogen cryogenic trapsas well as through a Porapak-Q 180/20 chromatograph heldat �20 �C with a helium carrier gas. The CO2 was measuredon one of two ThermoFinnigan MAT 253 IRMS housed atCaltech. Each measurement consisted of eight acquisitions(16 V on m/z = 44) of seven cycles of unknown sampleCO2 versus Oztech working gas as outlined byHuntington et al. (2009). The data collection spans a longperiod of time over which best practices in the clumped iso-tope community evolved to better address pressure baselineissues, non-linearity in the source and scale compression(e.g. Bernasconi et al., 2013; Dennis et al., 2011). Theunknown samples were collected concurrently with 1000 �C heated gases of two different bulk isotopic compositionsand at least two carbonate standards of known composi-tion. Unknown samples analyzed since 2012 were also ana-lyzed concurrently with 25 �C equilibrated gases of twodifferent bulk isotopic compositions.
2.9. Post clumped isotope measurement data processing
To address the complexities of the data set— multiplemass spectrometers, data processed over many months,samples of multiple mineralogies gathered with and without25 �C equilibrated gases—we input over 1200 raw measure-ment files of 1000 �C heated and 25 �C equilibrated gasesand carbonate standard data, along with 270 raw measure-ment files of sample unknowns, into Easotope, an opensource software tool developed specifically for clumped iso-tope data processing (John and Bowen, 2016) (Supplemen-tal Materials, E and F). The carbonate d18O compositionwas calculated using separate 90 �C acid digestion fraction-ation factors for calcite Kim et al. (2007a) and apatitePassey et al. (2007). Following Schauer et al. (2016) andDaeron et al. (2016), we used 17O correction parametersoutlined in Brand et al. (2010). Carbonate d13C and d18Ovalues were drift-corrected using a 10 standard moving win-dow to NBS-19 and NBS-19 calibrated internal Carraramarble standards (HCM and CIT). We corrected all ofthe D47 data using a 10 standard moving window for boththe linearity correction and empirical transfer function intothe ‘‘absolute reference frame” or ‘‘Carbon Dioxide Equili-brated Scale” (CDES) as defined by Dennis et al. (2011).For the linearity correction in Easotope, we used 1000 �Cheated gases of two different bulk isotopic compositionsand when available 25 �C equilibrated gases of two differentbulk isotopic compositions. To build an empirical functionto transfer our data into the CDES reference frame in Easo-tope, we first calculated D47CDES values for five in housestandards from periods when both 1000 �C heated and 25�C equilibrated gases were analyzed (HCM (n = 44), CITCM (n = 38), TV01 (n = 60), TV03 (n = 32), 102-GC-AZ-01 (n = 30). We then used a 10 standard moving windowof a combination of at least two carbonate standards(HCM/CIT CM, TV01/TV03, 102-GC-AZ-01) and twocompositions of 1000 �C heated and 25 �C equilibratedgases (when available) to calculate D47CDES values for theentire time period, an approach similar to one used in
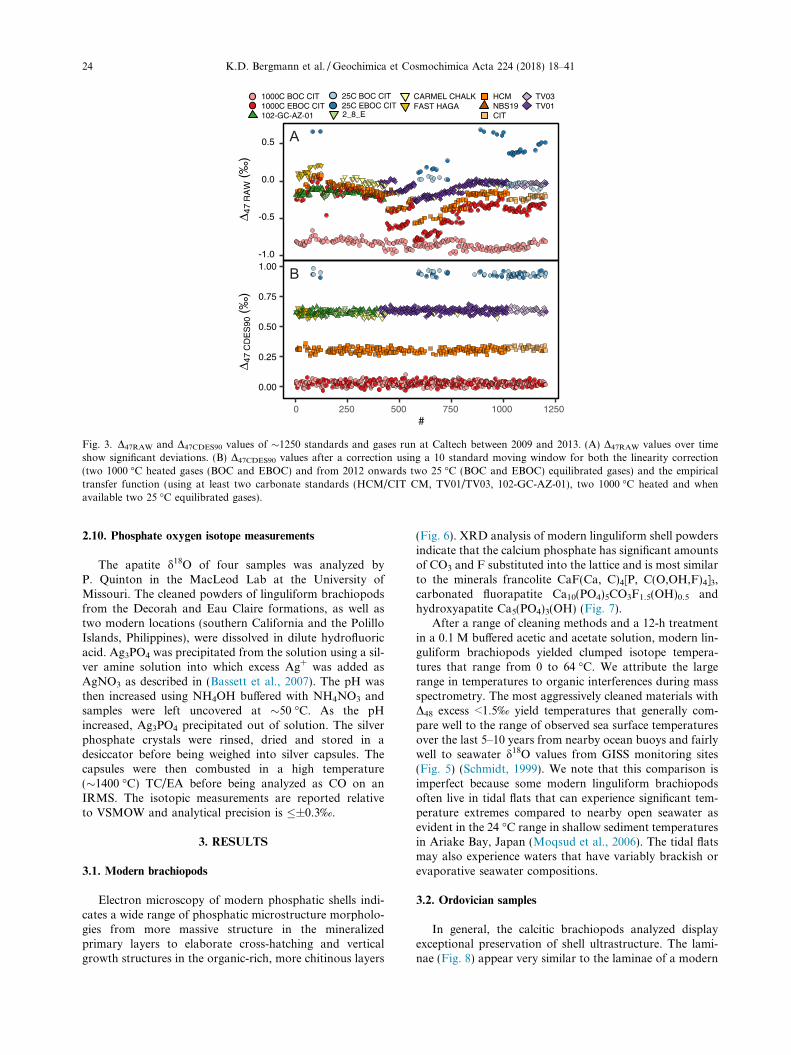
Dale et al. (2014), Kluge et al. (2014) and John (2015).Results of pre- and post- processing of standards are pre-sented in Fig. 3; long-term averages of standard D47CDES
values with comparisons to D47CDES values measured inthree other labs are available in Table 1 (Bonifacie et al.,2017; Dennis et al., 2011; Henkes et al., 2013). Values arereported as D47CDES90 with no acid fractionation correctionand as two values for D47CDES25 using recent empiricallyderived acid fractionation factors of 0.082‰ following(Defliese et al., 2015) and of 0.092‰ following (Henkeset al., 2013).
Following recent clumped isotope studies, we recognizethe importance of larger error bars on samples with fewreplicate measurements. In the main text the reproducibilityof the measurement is presented as 2SE, twice the com-monly reported 1SE. We present well-replicated measure-ments in the main text (n > 1, with D48 excess <1.5‰(except for the modern organic rich samples where a morestrict D48 excess <1‰ was required) and 2SE < 15 �C)(Table 2). Table E in the Supplemental Materials, alsohas single analyses (n = 1), poorly replicated samples and95% confidence intervals calculated (two tailed criticalvalue for t-distribution with n � 1 degrees of freedom)(e.g. Bonifacie et al., 2017; Muller et al., 2017.
We used a temperature calibration of D47CDES90 =0.0422 (±0.0019) * 106/T2 + 0.1262 (±0.0207) (Bonifacieet al., 2017, Eq. (3)). The D47CDES90 calibration equationis a composite of both synthetic and biogenic calcite, arag-onite and dolomite minerals reacted at 70–90 �C in 8 differ-ent laboratories (Bonifacie et al., 2017; Defliese et al., 2015;Fernandez et al., 2014; Henkes et al., 2013; Kele et al., 2015;Tang et al., 2014; Wacker et al., 2014) (Fig. 4). This calibra-tion includes data garnered at Caltech during the same timeinterval as our analyses using the same methods outlinedhere (Bonifacie et al., 2017). In addition to the unpublisheddata presented below we have also reprocessed all of theraw data from Finnegan et al. (2011) using the post-measurement data processing approach and statistical eval-uation outlined above and the temperature calibration fromBonifacie et al. (2017). While we analyzed modern bra-chiopod samples as part of this study, we do not use thoseresults to calculate temperature because of recent argu-ments that the best practices for calibration studies mustinclude a large temperature spread, many sample replicates,and many samples (Bonifacie et al., 2017). In the Supple-mental Materials, Table E we also present temperatures cal-culated using D47CDES25, a 0.082‰ AFF (Defliese et al.,2015), and a calibration from Kelson et al. (2017), the onlycalibration currently calculated using 17O correctionparameters following Schauer et al. (2016) and Daeronet al. (2016), as outlined in Brand et al. (2010).
Fluid compositions were calculated using the measuredclumped isotope temperatures and an equilibrium fraction-ation equation for calcite-water (Kim and O’Neil, 1997). Tocalculate d18O fluid composition in equilibrium with thecarbonate in our phosphatic materials, we assumed theequilibrium fractionation of the CO3 groups followscalcite-water equilibrium fractionation (Kim and O’Neil,1997). Error on these calculations uses 2SE on the D47
temperature.
-1.0
-0.5
0.0
0.5
Δ 47
RA
W(‰
)
0.00
0.25
0.50
0.75
1.00
0 250 500 750 1000 1250#
Δ 47
CD
ES
90(‰
)
1000C BOC CIT1000C EBOC CIT102-GC-AZ-01 2_8_E
25C BOC CIT25C EBOC CIT
CARMEL CHALK
CITFAST HAGA
HCMNBS19 TV01
TV03
A
B
Fig. 3. D47RAW and D47CDES90 values of �1250 standards and gases run at Caltech between 2009 and 2013. (A) D47RAW values over timeshow significant deviations. (B) D47CDES90 values after a correction using a 10 standard moving window for both the linearity correction(two 1000 �C heated gases (BOC and EBOC) and from 2012 onwards two 25 �C (BOC and EBOC) equilibrated gases) and the empiricaltransfer function (using at least two carbonate standards (HCM/CIT CM, TV01/TV03, 102-GC-AZ-01), two 1000 �C heated and whenavailable two 25 �C equilibrated gases).
24 K.D. Bergmann et al. / Geochimica et Cosmochimica Acta 224 (2018) 18–41
2.10. Phosphate oxygen isotope measurements
The apatite d18O of four samples was analyzed byP. Quinton in the MacLeod Lab at the University ofMissouri. The cleaned powders of linguliform brachiopodsfrom the Decorah and Eau Claire formations, as well astwo modern locations (southern California and the PolilloIslands, Philippines), were dissolved in dilute hydrofluoricacid. Ag3PO4 was precipitated from the solution using a sil-ver amine solution into which excess Ag+ was added asAgNO3 as described in (Bassett et al., 2007). The pH wasthen increased using NH4OH buffered with NH4NO3 andsamples were left uncovered at �50 �C. As the pHincreased, Ag3PO4 precipitated out of solution. The silverphosphate crystals were rinsed, dried and stored in adesiccator before being weighed into silver capsules. Thecapsules were then combusted in a high temperature(�1400 �C) TC/EA before being analyzed as CO on anIRMS. The isotopic measurements are reported relativeto VSMOW and analytical precision is �±0.3‰.
3. RESULTS
3.1. Modern brachiopods
Electron microscopy of modern phosphatic shells indi-cates a wide range of phosphatic microstructure morpholo-gies from more massive structure in the mineralizedprimary layers to elaborate cross-hatching and verticalgrowth structures in the organic-rich, more chitinous layers
(Fig. 6). XRD analysis of modern linguliform shell powdersindicate that the calcium phosphate has significant amountsof CO3 and F substituted into the lattice and is most similarto the minerals francolite CaF(Ca, C)4[P, C(O,OH,F)4]3,carbonated fluorapatite Ca10(PO4)5CO3F1.5(OH)0.5 andhydroxyapatite Ca5(PO4)3(OH) (Fig. 7).
After a range of cleaning methods and a 12-h treatmentin a 0.1 M buffered acetic and acetate solution, modern lin-guliform brachiopods yielded clumped isotope tempera-tures that range from 0 to 64 �C. We attribute the largerange in temperatures to organic interferences during massspectrometry. The most aggressively cleaned materials withD48 excess <1.5‰ yield temperatures that generally com-pare well to the range of observed sea surface temperaturesover the last 5–10 years from nearby ocean buoys and fairlywell to seawater d18O values from GISS monitoring sites(Fig. 5) (Schmidt, 1999). We note that this comparison isimperfect because some modern linguliform brachiopodsoften live in tidal flats that can experience significant tem-perature extremes compared to nearby open seawater asevident in the 24 �C range in shallow sediment temperaturesin Ariake Bay, Japan (Moqsud et al., 2006). The tidal flatsmay also experience waters that have variably brackish orevaporative seawater compositions.
3.2. Ordovician samples
In general, the calcitic brachiopods analyzed displayexceptional preservation of shell ultrastructure. The lami-nae (Fig. 8) appear very similar to the laminae of a modern
Table 1Isotopic composition of analyzed CIT standards (‰).
Standard N d13CVPDB SD d18OVPDB SD D47CDES90 D47CDES25a D47CDES25
a Calculated using a 0.092 Acid Fractionation Factor following Henkes et al. (2013).b Calculated using a 0.082 Acid Fractionation Factor following Defliese et al., 2015.c 95% confidence intervals calculated with a two tailed critical value for t-distribution with n � 1 degrees of freedomd D47CIT uses a 10 standard moving window, the HG intercept and slope and stretching factor outlined in Huntington et al., 2009e Comparison data in italics from Bonifacie et al. (2017).f Comparison data in italics from Henkes et al. (2013).g Comparison data in italics from Defliese et al., 2015.
K.D
.B
ergman
net
al./G
eoch
imica
etC
osm
och
imica
Acta
224(2018)
18–4125
Table 2Isotopic composition of analyzed samples (‰).
Sample Name N Min Age Age Bin d13CVPDB SD d18OVPDB SD D47CDES90 D47CDES25a D47CDES25
K.D. Bergmann et al. / Geochimica et Cosmochimica Acta 224 (2018) 18–41 27
calcitic brachiopod Terebratalia transversa, recovered fromthe San Pedro Jetty, CA (Fig. 8A and B). In some of thecalcite brachiopod shells examined on the SEM, the ultra-structure has a recrystallized appearance althoughRasmussen et al. (2016) attribute similar features to dustcreated during mounting and not recrystallization (Fig. 8).
Electron microprobe elemental maps and spot analysesof the different Ordovician fossil materials highlight arange of post-depositional diagenetic modifications of shellmaterial. Transects of spot analyses across a calcitic bra-chiopod shell from the Decorah Formation indicate local-ized zones of Fe enrichment. The punctae are in placesfilled with pyrite, and a zone of dissolution and recrystal-lization of the shell calcite spreads outwards from thepunctae. In the region of alteration Fe concentrationscan be as high as 5500 ppm. Outside of the zone of alter-ation, Sr concentrations are high, while Mn and Fe con-centrations are low and more similar to youngerbrachiopod materials (Fig. 9B, F, J, N, R, RSQ_2_1_B).A brachiopod (Paurorthis parva) from the Volkhov For-mation is enriched in Mn in specific horizons within theskeleton that follow the orientation of original growthlaminae in the shell ultrastructure. Mn enrichments canbe as high as 8000 ppm (Fig. 9A, E, I, M, Q, VkB2).An asaphid trilobite (Asaphus cornutus) from the AseriStage shows two features suggesting that the originalskeletal calcite has been diagenetically altered. The firstis even, high enrichment in Fe across the entire thicknessof the cuticle to values over 3000 ppm. The second is largedolomite rhombs that are ingrown at the sediment-shellinterface (Fig. 9C, G, K, O, S, Aseri_T1).
The linguliform brachiopod Lingulasma galenaense fromthe Decorah Formation show microstructure similar tomodern linguliform brachiopods, including massive miner-alized layers and fine-scale cross-hatched phosphatic pre-cipitates in the chitinous layers (Fig. 6). The globularnature of the skeleton ultrastructure in both modern andfossil linguliform brachiopods makes it more challengingto identify recrystallization than in their calcitic relatives.XRD analysis of the Lingulasma galenaense samples fromthe Decorah Formation yield spectra similar to the modernlinguliform brachiopod spectra and are most similar to car-bonated hydroxyapatite and francolite (Fig. 7).
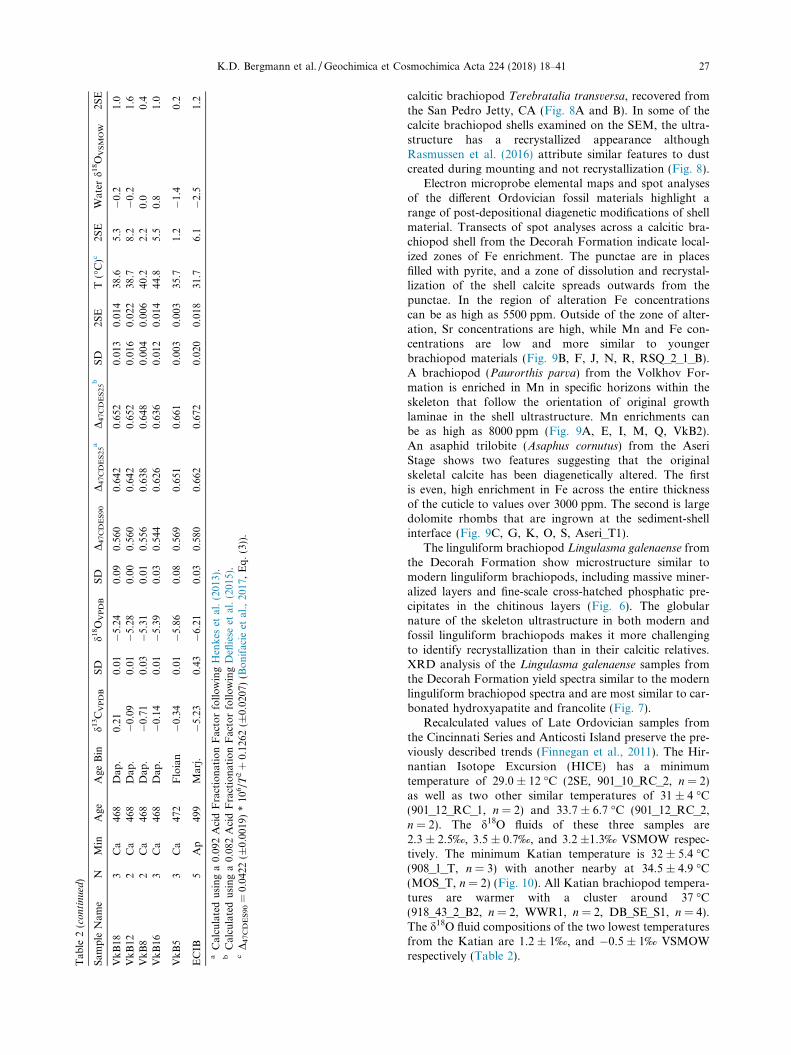
Recalculated values of Late Ordovician samples fromthe Cincinnati Series and Anticosti Island preserve the pre-viously described trends (Finnegan et al., 2011). The Hir-nantian Isotope Excursion (HICE) has a minimumtemperature of 29.0 ± 12 �C (2SE, 901_10_RC_2, n = 2)as well as two other similar temperatures of 31 ± 4 �C(901_12_RC_1, n = 2) and 33.7 ± 6.7 �C (901_12_RC_2,n = 2). The d18O fluids of these three samples are2.3 ± 2.5‰, 3.5 ± 0.7‰, and 3.2 ±1.3‰ VSMOW respec-tively. The minimum Katian temperature is 32 ± 5.4 �C(908_1_T, n = 3) with another nearby at 34.5 ± 4.9 �C(MOS_T, n = 2) (Fig. 10). All Katian brachiopod tempera-tures are warmer with a cluster around 37 �C(918_43_2_B2, n = 2, WWR1, n = 2, DB_SE_S1, n = 4).The d18O fluid compositions of the two lowest temperaturesfrom the Katian are 1.2 ± 1‰, and �0.5 ± 1‰ VSMOWrespectively (Table 2).
Fig. 4. D47CDES90 values from modern calcitic and linguliform brachiopods (D48 excess <1.5) compared to recently published D47CDES90 valuesfrom calcite, dolomite and aragonite calibration studies (Bonifacie et al., 2017) and references therein) and a recently published dataset ofD47CDES90 values of modern apatite enamel measurements (Wacker et al., 2016).
0
10
20
30
40
50
60
5 10 15Site
Tem
pera
ture
(°C
)
0
5
5 10 15Site
wat
erδ
OV
SM
OW
(‰)
SouthernCalifornia
Phillipines
Flo
rida
Japan
Dp.
Sea Southern
CaliforniaPhillipines
Flo
rida
Japan
Dp.
Sea
18
Haw
aii
Annual T range and meanLocal δ 18Oseawater (VSMOW)
A B
Haw
aii
Fig. 5. All modern linguliform and calcitic brachiopod clumped isotope calibration results. (A) clumped isotope temperatures calculatedusing D47CDES90 values compared to min, max and mean temperature from the closest buoy in NODC except for Japan which has in-situ tidalflat temperature data (±2SE) (Moqsud et al., 2006). Multiple cleaning methods were tried as poorly cleaned samples produced depleted D47
values relative to expected and had D48 excesses >1 (smaller transparent symbols). Calcitic brachiopods are plotted as circles. (B) calculatedwater d18OVSMOW compositions compared to the closest GISS measurements (±2SE) (Schmidt, 1999; Kim et al., 2007b).
28 K.D. Bergmann et al. / Geochimica et Cosmochimica Acta 224 (2018) 18–41
The lowest recorded temperature from Decorah Forma-tion is 26.6 ± 8.7 �C from a phosphatic nodule foundless than a meter below the onset of the GICE (Figs. 10and 11). The calculated d18O fluid composition is�0.1 ± 1.8‰ VSMOW (DB_PN, n = 2). The lowest tem-perature calcitic brachiopod from above the GICE is38.1 ± 5.1 �C with a d18O fluid composition of �0.5 ± 1.0‰(DB_SE_S1, n = 4). Results from clumped isotope analysesof the CO3 groups substituted into the phosphate lattice oflinguliform brachiopods from the Decorah Formation yield
a mean temperature of 44.6 ± 3.0 �C (DIB, n = 6). Thecalculated mean d18O fluid, assuming an equilibrium rela-tionship that follows calcite, is 1.7 ± 0.5‰ VSMOW (Kimand O’Neil, 1997) (Fig. 11, Table 2).
The brachiopod clumped isotope temperatures from theFloian-Darriwilian Volkhov Formation, trilobites andmatrix from the Darriwilian Aseri and Kunda formationsare similar with a minimum temperature of 33.2 ± 6.5 �C(Kunda_M, n = 4) with eight other samples between 33and 37 �C (VkB4, n = 5, VkB5, n = 3, VkB12, n = 2,
Fig. 6. SEM images of modern and ancient linguliform brachiopods. (A & C) shell structure of the secondary layer of a modern linguliformbrachiopod, Glottidia albida from the San Pedro shelf off Newport Bay, CA. (E) shell ultrastructure of a modern linguliform brachiopod,Lingula reevii from the Waikiki Aquarium. (B) ultrastructure of the secondary layers in Lingulepis sp. recovered from the Crepicephalus zoneof the Eau Claire Formation near Strum, WI. Scale bar is 20 mm. (D) ultrastructure of the secondary layers in Lingulepis sp. recovered fromthe Crepicephalus zone of the Eau Claire Formation near Colfax, WI. Scale bar is 40 mm. (F) shell ultrastructure of Lingulasma galenaense
from the Decorah Formation collected from the Decorah Bruening Quarry, IA.
2
4
2
4
6
8
0
2
4
6
Inte
nsity
30 40 50 60
2θ (°)
quartz sa
nd
A
B
C
Fig. 7. XRD data for modern and ancient linguliform brachiopod samples. (A) Modern cleaned and powdered samples of Glottidia albida
from the San Pedro shelf off Newport Bay, CA (green) and Lingula unguis from Polillo Islands, Philippines (blue). (B) two separate cleanedand powdered samples of Lingulasma galenaense from the Decorah Formation (purple and pink). (C) cleaned and powdered samples ofLingulepis sp. from the Crepicephalus zone of the Eau Claire Formation near Strum, WI (light blue and dark blue) and Colfax, WI (red). (Forinterpretation of the references to color in this figure legend, the reader is referred to the web version of this article.)
K.D. Bergmann et al. / Geochimica et Cosmochimica Acta 224 (2018) 18–41 29
A B
C D
E F
G H
Fig. 8. SEM images of modern and ancient articulate brachiopods.(A and B) shell ultrastructure of Terebratalia transversa from theSan Pedro Jetty, CA. Note the abundant punctae. (C–H) calciticbrachiopods from the Decorah Formation in varying states ofultrastructure preservation and recrystallization (C =DB_SE_S5_1, D = DB_SE_S2_1, E = DB_SE_S6_1, F =DB_SE_S3_1, G = DB_SE_S4_1, H = DB_SE_S1_1). They areorganized from highest (C) to lowest (H) clumped isotopetemperature. In some of the calcite brachiopod shells examinedon the SEM, the ultrastructure has a recrystallized appearance(shown with arrows) although Rasmussen et al. (2016) attributesimilar features to dust created during mounting and notrecrystallization.
30 K.D. Bergmann et al. / Geochimica et Cosmochimica Acta 224 (2018) 18–41
VkB14, n = 2 VkB18, n = 3, Aseri_T1, n = 5, Aseri_M,n = 4 Kunda_T1, n = 5). These temperatures are slightlylower than the temperatures from the Decorah Formationand other Late Ordovician sections but it has a higher pale-olatitude (�30�S) (excepting the samples from the HICEand GICE). The calculated d18O fluid composition for thelowest temperature sample is �1.0 ± 1.3‰ (Kunda_M,n = 4) (Table 2).
3.3. Cambrian samples
The Lingulepis specimens have very similar microstruc-tures to both the Decorah and modern linguliform bra-chiopod species. The more porous organic-rich layershave cross-hatching and vertical phosphate precipitates(Fig. 6B and D). The XRD spectra are similar to themodern linguliform brachiopod spectra and have the same
mineralogy (francolite, hydroxyapatite, and carbonatehydroxyapatite). The spectra also indicate that while notall of the quartz sand was removed from each powder priorto analysis, no calcite or dolomite remained in the analyzedsamples (Fig. 7).
The Eau Claire linguliform brachiopod sample yields atemperature of 31.7 ± 6.1 �C (ECIB, n = 5). The averagecalculated d18O water, assuming an equilibrium relation-ship that follows calcite, is �2.5 ± 1.2‰ VSMOW (Kimand O’Neil, 1997) (Table 2).
4. DISCUSSION
The geological context and materials examined here pro-vide several insights into the nature of clumped isotoperecords in deep time. Below we discuss three case studiesthat illustrate the behavior of clumped isotopes in differentmaterials and from different paleoenvironments that informinterpretation. We discuss how these new data constraininterpretations of Cambro-Ordovician climate, seawaterd18O values, and the trend in d18O values of mineralsthrough early Paleozoic time.
4.1. Case study: Organic-rich modern linguliform brachiopods
can yield anomalously high clumped isotope temperatures
The modern linguliform brachiopod calibration datahighlight the challenge with analyzing organic-rich materi-als. Part of the pre-processing clean up method for makingcarbonate clumped isotope measurements involves runningthe CO2 sample through a poropak trap held at �20 �C.The goal of this treatment is to remove organic materialsthat may create isobaric interferences with different iso-topologues of CO2. Different laboratories have slight varia-tions on this cleaning step that range from a freeze downfinger filled with poropak to a diffusive flow though poro-pak packed 1/400 tube, to a He flow through poropakpacked 1/800 stainless steel column. CO2 is moved throughthe 1/800 column in a He carrier gas stream. While the labat Caltech uses one of the more stringent organic cleaningprotocols currently applied, the high amount of organicphases present in modern linguliform brachiopod skeletons(approaching 40% by weight) was not effectively removed inmodern linguliform brachiopod samples that had no chem-ical pre-treatment (e.g. PIB_none). Clumped isotope analy-ses are depleted in d13C, d18O, and D47 and elevated in D48,suggesting hydrolysable carboxylic groups are sourced dur-ing digestion and contributed isobaric interferences to themeasurements. The apparent clumped isotope temperatureof modern samples contaminated with organic molecules ishigher than growth temperatures by as much as 40 �C.Interferences on Mass 45 and 48 appear to be the most sig-nificant with clear offsets in both D48 and d13C betweenuncleaned and cleaned samples. Additionally, the organicmaterial is sometimes ‘sticky’ and can remain in the massspectrometer system resulting in high standard residuals.The organic fragments are visible on a full mass scan aslow-resolution peaks.
Attempts to react away the �40% organic materialwith a range of chemical pre-treatment methods met with
Fig. 9. Electron microprobe maps and spot analyses of ancient brachiopods. (A) Calcitic brachiopod from the Volkhov Formation withoverlain elemental maps generated on an electron microprobe of Ca (E), Fe (I), & Mn (M) and quantitative spot measurements (Q) along atransect shown in (A) (VkB8). Scale bar is 110 mm. (B) Calcitic brachiopod from the Decorah Formation with overlain elemental maps of Ca(F), Fe (J), & Mn (N) and quantitative spot measurements (R) along a transect shown in (B) (RSQ_8_B). Scale bar is 60 mm. (C) Calcitictrilobite from the Aseri Formation, Russia with overlain elemental maps of Ca (G), Fe (K), & Mn (O) and quantitative spot measurements (S)along a transect shown in (C) (Aseri_T1). Note the ingrown dolomite rhombs along the base of the shell. Scale bar is 110 mm. (D) Phosphaticbrachiopod from the Eau Claire Formation with overlain elemental maps of P (H), F (L), Na (P), & Ce (T) (ECIB). Scale bar is 200 mm.
K.D. Bergmann et al. / Geochimica et Cosmochimica Acta 224 (2018) 18–41 31
variable success. Variability in sample shell thicknessesand total organic material affected the success of thecleaning treatment. More aggressive cleaning methodsyield results consistent with or slightly lower than nearbybuoy temperatures (Fig. 5). Ineffective cleaning treat-ments were identified with D48 excess >1 in these materi-als. Symbols in Fig. 5 with a D48 excess >1 aretransparent, and are not subsequently plotted in Fig. 4.The temperature results of the modern phosphatic sam-ples without D48 excesses and the two measured calciticbrachiopods are in good agreement with recently pub-lished calibration datasets (Fig. 4) (Bonifacie et al.,2017 and references therein).
4.2. Case study: Samples with elevated Fe and Mn sometimes
yield low clumped isotope temperatures
Trace metal abundance has long been used to assess dia-genesis and screen samples before isotopic analysis. Duringburial, calcitic brachiopod shells may recrystallize in thepresence of high-temperature, anoxic metal-rich fluids andbecome enriched in Fe and Mn (Brand and Veizer, 1980).Carbonate clumped isotope thermometry provides an inde-pendent measure of diagenesis for carbonate or apatitematerials, yielding deeper insight into alteration processesassociated with a range of environments. The combinedapplication of microscopy, trace metal analysis and
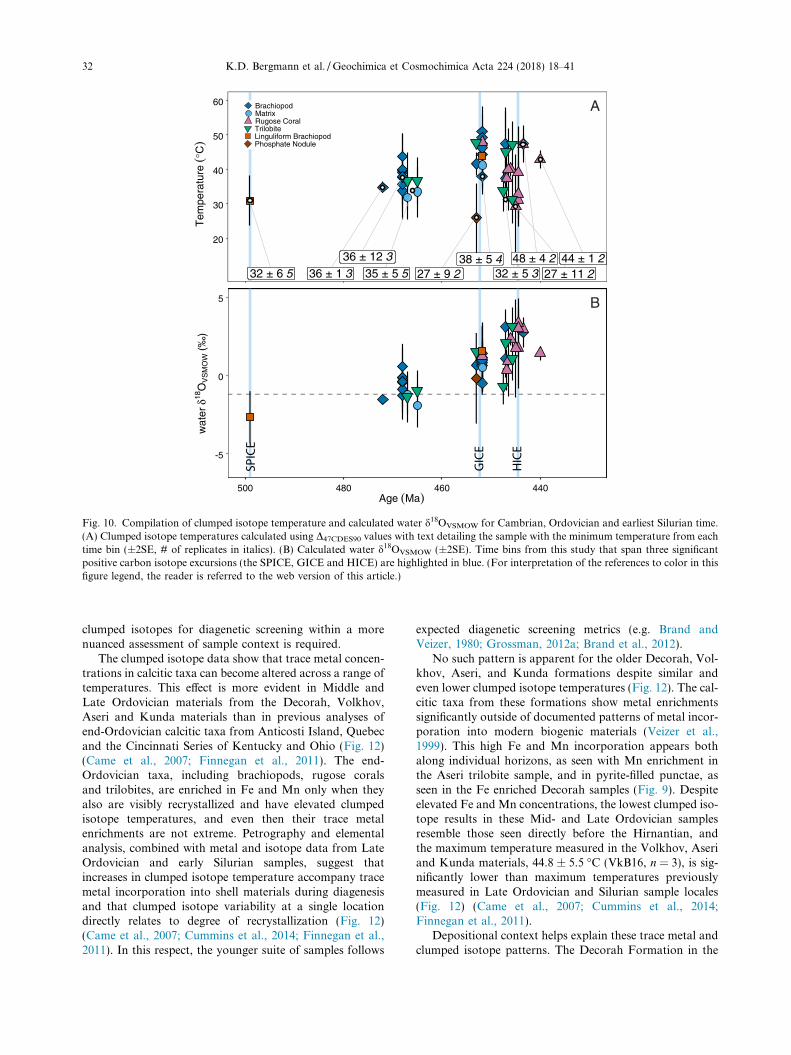
Fig. 10. Compilation of clumped isotope temperature and calculated water d18OVSMOW for Cambrian, Ordovician and earliest Silurian time.(A) Clumped isotope temperatures calculated using D47CDES90 values with text detailing the sample with the minimum temperature from eachtime bin (±2SE, # of replicates in italics). (B) Calculated water d18OVSMOW (±2SE). Time bins from this study that span three significantpositive carbon isotope excursions (the SPICE, GICE and HICE) are highlighted in blue. (For interpretation of the references to color in thisfigure legend, the reader is referred to the web version of this article.)
32 K.D. Bergmann et al. / Geochimica et Cosmochimica Acta 224 (2018) 18–41
clumped isotopes for diagenetic screening within a morenuanced assessment of sample context is required.
The clumped isotope data show that trace metal concen-trations in calcitic taxa can become altered across a range oftemperatures. This effect is more evident in Middle andLate Ordovician materials from the Decorah, Volkhov,Aseri and Kunda materials than in previous analyses ofend-Ordovician calcitic taxa from Anticosti Island, Quebecand the Cincinnati Series of Kentucky and Ohio (Fig. 12)(Came et al., 2007; Finnegan et al., 2011). The end-Ordovician taxa, including brachiopods, rugose coralsand trilobites, are enriched in Fe and Mn only when theyalso are visibly recrystallized and have elevated clumpedisotope temperatures, and even then their trace metalenrichments are not extreme. Petrography and elementalanalysis, combined with metal and isotope data from LateOrdovician and early Silurian samples, suggest thatincreases in clumped isotope temperature accompany tracemetal incorporation into shell materials during diagenesisand that clumped isotope variability at a single locationdirectly relates to degree of recrystallization (Fig. 12)(Came et al., 2007; Cummins et al., 2014; Finnegan et al.,2011). In this respect, the younger suite of samples follows
No such pattern is apparent for the older Decorah, Vol-khov, Aseri, and Kunda formations despite similar andeven lower clumped isotope temperatures (Fig. 12). The cal-citic taxa from these formations show metal enrichmentssignificantly outside of documented patterns of metal incor-poration into modern biogenic materials (Veizer et al.,1999). This high Fe and Mn incorporation appears bothalong individual horizons, as seen with Mn enrichment inthe Aseri trilobite sample, and in pyrite-filled punctae, asseen in the Fe enriched Decorah samples (Fig. 9). Despiteelevated Fe and Mn concentrations, the lowest clumped iso-tope results in these Mid- and Late Ordovician samplesresemble those seen directly before the Hirnantian, andthe maximum temperature measured in the Volkhov, Aseriand Kunda materials, 44.8 ± 5.5 �C (VkB16, n = 3), is sig-nificantly lower than maximum temperatures previouslymeasured in Late Ordovician and Silurian sample locales(Fig. 12) (Came et al., 2007; Cummins et al., 2014;Finnegan et al., 2011).
Depositional context helps explain these trace metal andclumped isotope patterns. The Decorah Formation in the
Fig. 11. Comparison of calcitic and phosphatic taxa from theDecorah Formation. (A) Clumped isotope temperatures calculatedusing D47CDES90 values for calcitic brachiopods (blue diamonds),matrix (blue circles), rugose corals (pink triangles), trilobites (greenreverse triangles), and CO2 generated from carbonate groupssubstituted into linguliform brachiopods (orange squares), andphospatic nodules (brown diamond) (± 2SE). The labeled calciticbrachiopods (C, D, E and H) reference SEM images in Fig. 8. Thecoldest sample, a phosphatic nodule is from directly below theonset of the GICE in the uppermost Spects Ferry Member. (B)calculated water d18OVSMOW compositions with the dashed line atpredicted modern ice-free conditions (�1.2‰) (Lear, 2000)(± 2SE). (For interpretation of the references to color in thisfigure legend, the reader is referred to the web version of thisarticle.)
20
40
60
-5 -2 0
mineral δ18OVPDB (‰)
Tem
pera
ture
(°C
)
Anticosti IslandCincinnati Series
Decorah FormationVolkov Formation
Aseri & Kunda formations 0.9800.9840.9880.992
Fig. 12. Cross plot of clumped isotope temperature and minerald18OVPDB. Clumped isotope temperatures calculated usingD47CDES90 values (±2SE). Grey lines are constant waterd18OVSMOW. The PCA1 of trace metals abundances of log Fe(0.703), log Mn (0.680) and log Sr (�0.207) is plotted as a colormapon calcitic taxa from units spanning Ordovician (Volkov Forma-tion (reverse triangle), Aseri and Kunda Formations (square),Decorah Formation (triangle), Cincinnati Series (diamond), andAnticosti Island (circle). The more d18OVPDB depleted Volkov,Aseri, Kunda and Decorah formations have similar to lowerclumped isotope temperatures than the Cincinnati and Anticostisamples but more enriched trace metals. Evidence suggests this isdue to low oxygen conditions at or near the seafloor. (Forinterpretation of the references to color in this figure legend, thereader is referred to the web version of this article.)
K.D. Bergmann et al. / Geochimica et Cosmochimica Acta 224 (2018) 18–41 33
Upper Mississippi Valley region is a mixed carbonate-siliciclastic unit deposited in the Hollandale Embayment,a broad shallow depression across Minnesota and Iowa(Emerson, 2002; Simo et al., 2003). Lithologies in the Dec-orah vary from poorly lithified mixed carbonate muds andillite clays to fossiliferous amalgamated packstone bedsreworked by storms and riddled with well-developed hard-grounds and Chondrites burrows (Emerson, 2002). TheDecorah Formation is characterized by notably low aver-age sedimentation rates, due to its position at the geody-namic center of the North American craton during one of
the largest transgressions of the Phanerozoic era(Emerson, 2002); evidence for these low sedimentation ratesincludes phosphatized grains in the lower Decorah Forma-tion, iron ooids which appear in the more northerly sectionsin Minnesota, and abundant hardgrounds (Emerson, 2002;Simo et al., 2003) (Fig. 2).
Fossils from the Baltic-Ladoga Klint, a cratonic escarp-ment on the European platform exposed in Estonia, Russia,and Sweden, are found within limestone wackestone andpackstone beds as well as in the unlithified clay-rich inter-layers (Egerquist and Egerquist, 2003; Tolmacheva et al.,2003). Very low sedimentation rates also characterize thesedeposits. The Volkhov Formation, carbonate-rich, con-formably overlies predominantly quartz sand and claylithologies of Cambrian and Early Ordovician age andwas deposited on a broad epicontinental shelf (Dronovet al., 1996, 2005). Hardgrounds in the Volkhov are abun-dant, the sediments predominantly glauconiferous, and theooids ferruginous (Dronov et al., 1996, 2005; Popov et al.,2005). The Kunda and Aseri stages of the Baltic-LadogaKlint (�12 meters total thickness) also contain iron ooidsand glauconite grains as well as abundant, well-preservedtrilobite and brachiopod fauna (Dronov et al., 1996,2005; Rasmussen et al., 2016).
The stratigraphies sampled for this study contain abun-dant sedimentological evidence—including hardgrounds,phosphatized grains and iron ooids—for early seafloor
34 K.D. Bergmann et al. / Geochimica et Cosmochimica Acta 224 (2018) 18–41
lithification in an environment with low sedimentation ratesand enhanced metal cycling (Fig. 2). Early lithificationlikely led to syndepositional mineralization of fossil materi-als, which elevated trace metal concentrations. Despitetrace metal enrichments, however, the entire suite ofclumped isotope temperatures (fossils and cemented car-bonate mud) remains low, a result consistent with low bur-ial estimates from organic maturity data (Rohrssen, 2013).Each of these examples underwent scant subsequent sedi-mentary burial diagenesis due to the geodynamic settingsof these continental basins, for a substantial transgressionduring this time interval generated little accommodationspace for sediment accumulation (Peters and Gaines,2012). This finding reinforces the need to couple sedimen-tology, petrography and elemental analyses, particularlyon the micro-scale, with carbonate clumped isotope ther-mometry in order to fully characterize diagenetic alteration,for even materials with high Fe or Mn abundances may bewell preserved if they formed in low O2 conditions. This isparticularly true for older carbonate successions whenlower benthic oxygen concentrations (and higher degreesof metal cycling) may have been more frequent (e.g.Creveling et al., 2014).
This case study demonstrates that both the trace metaldistribution and the range of clumped isotope temperaturesin a sample suite are influenced by sedimentation rate andtotal overburden. Fossil materials preserved in environ-ments with high sedimentation rates, and environments thathave seen significant tectonic loading, usually exceed theblocking temperature for calcite, and the fossils experiencepartial or complete reordering (Finnegan et al., 2011;Henkes et al., 2014). In intermediate burial environments,fossil materials have some components with elevatedclumped isotope temperatures, including sparry calcitecements with higher trace metal concentrations (Fig. 12).Fossil materials from depositional environments with verylow sedimentation rates and the thinnest overburden, likethe cratonic Volkhov and Decorah formations, have lowclumped isotope temperatures and little evidence for coarserecrystallization. Although the trace metal enrichments anddepleted d18O values in these formations suggest that thesefossil materials are poorly preserved, we contend that thed18O depletion in Decorah and Volkov samples relative toyounger fossil materials is primary and reflects temperaturechange (Fig. 12).
4.3. Case study: Estuarine waters
The phosphatic brachiopods from the Cambrian-agedEau Claire Formation are the only samples we examinedthat yield both low clumped isotope temperatures and cal-culated fluid compositions more depleted than estimates forice-free seawater (estimated between �0.89 and �1.2‰)(Lear, 2000; Cramer et al., 2011). In principle, these resultsmay imply a change in the seawater d18O value from Cam-brian to Ordovician time, though they are certainly not as18O-depleted as some hypotheses for Cambrian-aged sea-water (�2.5 ± 1.2‰ VSMOW, ECIB, n = 5 versus �7‰)(e.g. Prokoph et al., 2008; Veizer et al., 1999). However,the sedimentological context of the samples suggests a
different interpretation. The Upper Cambrian-aged EauClaire Formation of Wisconsin and Minnesota was oneof the first Cambrian sandstones deposited on the cratonat these localities (Runkel et al., 1998, 2007). The EauClaire Formation is composed of well-rounded, medium-grained quartzose sandstones intercalated with fine felds-pathic sandstones and reflects nearshore paleoenvironments(Cowan et al., 2005; Runkel et al., 2012). The nearshore sili-ciclastics of the Eau Claire transition to carbonates downstratigraphic dip in Iowa (Runkel et al., 2012, 2007).Interpretation of sedimentation patterns indicates awell-developed ’moat’ at this time across Minnesota andWisconsin that allowed incoming freshwater to mix withmarine water in an estuary-like setting (Cowan et al.,2005; Myrow et al., 2012; Runkel et al., 2012, 2007). Previ-ous geochemical study of the Eau Claire Formation alsosupports a marginal marine environment setting (Cowanet al., 2005). Trilobite fauna from the ’inner detrital belt’is also restricted and distinct from more offshore environ-ments (Ludvigsen and Westrop, 1983; Westrop, 1996).
The Eau Claire Formation preserves the Steptoean Pos-itive Carbon Isotope Excursion (SPICE) in carbonatelithologies in Iowa (Elrick et al., 2011; Saltzman et al.,2004) and in the d13C of CO3 groups substituted into thephosphate lattice of linguliform brachiopods (Cowanet al., 2005). Based on their statigraphic position andd13C composition, the samples analyzed for this study pre-serve the onset of the SPICE excursion (Cowan et al., 2005).The linguliform brachiopods from Iowa record the SPICEwith d13C values identical to the surrounding carbonatematrix and other global sections recording the SPICE(Cowan et al., 2005). Interestingly, the d13C of the CO3
from linguliform brachiopods recovered from nearshoresand-dominated sediments in the Eau Claire Formation isconsistently depleted by about 5‰ compared to down-dipmarine environments, a reasonable offset if the nearshoresandy environment in Wisconsin was estuarine, with DICisotopically distinct from a well-mixed marine DIC pool(Mook, 1971; Cowan et al., 2005). This explanation is alsosupported by the d18O of the CO3 groups measured in thetwo populations: the d18O in the Wisconsin brachiopodsis �4‰ lighter than that of the Iowa brachiopods(Cowan et al., 2005). This mineral offset is similar to ourcalculated water d18O offset from nominal ’seawater,’implying that deposition from different fluids but in similartemperatures could explain the offset between Wisconsinand Iowa.
There is an additional test to determine whether the lin-guliform brachiopods from the Eau Claire Formation grewin brackish waters or, alternatively, whether global seawa-ter d18O composition evolved between Late Cambrianand Middle Ordovician time: pairing clumped isotope andconventional d18O records of carbonate groups and apatite.Each record is imperfect. Carbonate minerals are morelikely to dissolve and recrystallize in burial environments.For apatite, the phosphate-water equilibrium relationshipis long debated (Longinelli and Nuti, 1973, 1996; Changand Blake, 2015; Kolodny et al., 1983; Lecuyer et al.,2013; Puceat et al., 2010). Additionally, Rodland et al.(2003) recover high-resolution variability in apatite mineral
Table 3Water d18O comparison of apatite samples (‰).
Sample Name N Min Age d13CVPDB SD d18Od SD D47CDES90 SD 2SE T (�C)e 2SE Water d18OVSMOW 2SE
DIB 6 Ap 451.8 �1.60 0.07 �4.43 0.18 0.543 0.007 0.006 44.6 3.0 1.7 0.5Chang and Blake (2015) 17.5 44.6 �1.5Puceat et al. (2010)c 17.5 44.6 0.8Longinelli and Nuti (1973) 17.5 44.6 2.0Lecuyer et al. (2013) 17.5 44.6 1.3
ECIB 5 Ap 499 �5.23 0.43 �6.21 0.03 0.580 0.020 0.018 31.7 6.1 �2.5 1.2Chang and Blake (2015) 16.1 31.7 �4.8Puceat et al. (2010)c 16.1 31.7 �3.6Longinelli and Nuti (1973) 16.1 31.7 �2.4Lecuyer et al. (2013) 16.1 31.7 �3.0
TIIBa 1 Ap 0 1.09 0.01 1.08 0.01 0.608 0.017 0.004 24.0 1.3 3.3 0.3Chang and Blake (2015) 21.4 22.2 �0.8Puceat et al. (2010)c 21.4 22.2 �0.1Longinelli and Nuti (1973) 21.4 22.2 1.1Lecuyer et al. (2013) 21.4 22.2 0.7
PIBb 4 Ap 0 �4.37 0.11 �0.09 0.09 0.579 0.014 0.007 33.1 1.6 3.0 0.4Chang and Blake (2015) 20.5 33.1 �0.3Puceat et al. (2010)c 20.5 33.1 1.1Longinelli and Nuti (1973) 20.5 33.1 2.3Lecuyer et al. (2013) 20.5 33.1 1.8
a Only TIIB with no D48 excess (TIIB_NaOH_HP).b Average of three cleaned samples of PIB that do not show a D48 excess (PIB_4_12_POW, PIB_4_12_250, and PIB_24_12_POW).c With the corrected value for NBS120c from Joachimski and Lambert (2015).d Relative to VPDB for the CO3 group analyses (grey), relative to VSMOW for the apatite analyses.e D47CDES90 = 0.0422 (±0.0019) * 106/T2 + 0.1262 (±0.0207) (Bonifacie et al., 2017, Eq. (3)).
K.D
.B
ergman
net
al./G
eoch
imica
etC
osm
och
imica
Acta
224(2018)
18–4135
36 K.D. Bergmann et al. / Geochimica et Cosmochimica Acta 224 (2018) 18–41
d18O (>5‰) across linguliform brachiopod shells and sug-gest that CO3 groups provide a better record of equilibriumconditions. Despite the uncertainties, combined measure-ments of clumped isotope temperatures in modern, Ordovi-cian and Cambrian samples can be used to test whether theoxygen isotopes of these two mineral phases precipitated ator near equilibrium from the same fluid. Using the mea-sured clumped isotope temperature from the CO3 groupand measured d18O mineral composition (either on the apa-tite or CO3 group)—we calculated water d18O compositionsusing four phosphate-water d18O equilibrium fractionationequations and one calcite-water d18O equilibrium fraction-ation equation (Longinelli and Nuti, 1973, 1996; Kim andO’Neil, 1997; Chang and Blake, 2015; Kolodny et al.,1983; Lecuyer et al., 2013; Puceat et al., 2010) with anupdated value for NBS120c for Puceat et al. (2010)(Joachimski and Lambert, 2015). Notably, waterd18OVSMOW values calculated from apatite measurementsusing two PO4-water equilibrium equations (Longinelliand Nuti, 1973; Lecuyer et al., 2013) provided a bettermatch to carbonate water d18OVSMOW than other equations(Chang and Blake, 2015; Puceat et al., 2010) for theCambro-Ordovician samples while the modern CO3 groupwaters are high relative to GISS measurements from thesites suggesting the need for better modern data of a rangeof apatite materials (Table 3). Further work is needed tofully address why some equations agree better in the past.
4.4. Climate of the Cambrian and Ordovician and seawater
d18O through time
The decline in apatite and calcite mineral d18O valuesthrough deep time has historically had three explanations:climate and baseline temperatures changed; seawater d18Oevolved; or burial diagenesis had a greater impact in thepast than it currently has. We find no evidence for evolutionof seawater d18O beyond stratigraphic trends likely associ-ated with cycles of continental ice sheet growth, but signif-icant evidence that both climate change (albeit milder thansome hypotheses have suggested; e.g. Trotter et al., 2008)and diagenesis contributed to Paleozoic d18O trends.
During the time interval that the Cambrian- andOrdovician-aged strata we sampled represent, calcite bra-chiopod d18O increased from �11‰ to �4‰ and apatitemineral d18O increased from 14‰ to �18‰ (Fig. 1). Thed18O water compositions of these strata, calculated fromclumped isotope measurements, indicate that the oxygenisotopic fluctuations over the Ordovician largely reflectschanges in ice volume related to the end-Ordovician glacia-tion (e.g. Finnegan et al. 2011). Middle Ordovician-agedsamples from Russia and Late Ordovician-aged samplesfrom the Decorah Formation yield seawater d18O valuespredicted for ice-free conditions in oceans with modernd18O water composition (between �0.89 and �1.2‰)(Lear, 2000; Cramer et al., 2011). The mineral d18OVPDB
compositions of these samples are at the high end of thePhanerozoic d18O dataset compiled from tropical bra-chiopods (Veizer et al., 1999), as are bulk oxygen isotopevalues from Lower Ordovician brachiopods from Baltica(Rasmussen et al., 2016). These difference suggests that
average values from the compilation are unlikely to provideaccurate estimates of mineral d18OVPDB of this age(Grossman, 2012a, 2012b; Grossman et al., 2008). Thoughthe lowest temperatures from the Cambrian-aged EauClaire Formation, measured in Wisconsin linguliform bra-chiopods imply fluid compositions depleted in 18O(�2.6‰), the sedimentological, geochemical and fossil evi-dence suggest that these nearshore sandstones were depos-ited in a brackish environment lower in d18O than marinewaters due to riverine influx. Pairing the Wisconsin bra-chiopod temperatures with carbonate d18O values fromcontemporaneous linguliform brachiopods from offshoreIowa sections yields marine seawater d18O estimates(Cowan et al., 2005).
These estimates for seawater d18O accord with ophiolitestudies and records of hydrothermal alteration of mid-ocean ridge basalts that show little change in seawaterd18O since the Archean Eon (Muehlenbachs and Clayton,1976; Holmden and Muehlenbachs, 1993; Muehlenbachs,1998; Turchyn et al., 2013). The ophiolite data evince a con-stant gradient in d18O of oceanic crusts through time, withpillow basalt enrichment (d18OVSMOW �6–10‰) relative toconcurrent gabbros (d18OVSMOW �3–6‰) indicatingexchange with 0‰ VSMOW seawater at different tempera-tures (e.g. Holmden and Muehlenbachs, 1993). Theconstancy of the oceanic d18O reservoir is supported bymass-balance models of seawater isotope exchange, whichsuggest an equilibrium between isotopic depletion fromlow-temperature pillow basalt weathering and hydrother-mal enrichment of gabbroic mid-ocean ridge deposits(Muehlenbachs and Clayton, 1976). Assuming past spread-ing rates to be at least 50% of present rates, these exchangereactions, along with subduction and recycling of saturatedsediments, are thought to have maintained seawater com-positions of �0‰ (Muehlenbachs and Clayton, 1976;Holmden and Muehlenbachs, 1993; Muehlenbachs, 1998).
Reconstructing sea surface temperatures in the ancientpast with accuracy remains challenging because theclumped isotope thermometer is particularly sensitive todiagenetic alteration. Each study site has a complex historyof burial, recrystallization, trace metal migration, andchanges in permeability and porosity. The petrography,SEM and EPMA work that complements our clumpedisotope studies indicates that reprecipitated carbonateinfluences even those brachiopods typically regarded aswell-preserved. At a single sample site, inclusion of repre-cipitated material into samples with similar d18O mineralcompositions can cause a range of clumped isotope temper-atures (Fig. 11, Fig. 8). The full range of brachiopodclumped isotope temperatures from the Decorah Forma-tion can be explained by connecting those temperatureswith textural differences between skeletal materials viewedby SEM: samples with higher clumped isotope tempera-tures have more recrystallized shell material and commonlyhave thin laminae susceptible to dissolution (Fig. 11,Fig. 8). Fig. 10A includes the minimum, well-replicatedclumped isotope temperature from each time bin as our besttemperature estimate from the least recrystallized material.We find no evidence supporting recent claims that clumpedisotope temperature variability is independent of texture,
K.D. Bergmann et al. / Geochimica et Cosmochimica Acta 224 (2018) 18–41 37
trace metal or chemical/isotopic signals in study sites withlow temperature burial histories (Veizer and Prokoph,2015).
In the late Cambrian – middle Ordovician time intervalour clumped isotope dataset brackets previously publishedconodont phosphate analyses. Unlike Trotter et al. (2008),we observe no monatonic trend towards warmer tempera-tures into the Cambrian however we lack the sample reso-lution to fully reconstruct earliest Ordoviciantemperatures. Rather, temperature differences betweensamples within positive carbon isotope excursions (theSPICE, GICE and HICE) and those outside excursionssuggest that these positive carbon isotope excursions mayeach represent a short interval associated with cooler tem-peratures (Buggisch et al., 2010; Elrick et al., 2011;Finnegan et al., 2011). The minimum temperatures fromother time bins equal or slightly exceed temperatures inthe modern West Pacific warm pool and are warm relativeto modern tropical seawater (34–38 �C vs. �30). They alsomatch estimates by climate models and proxies for equato-rial sea surface temperatures during the ice-free Eocene Cli-matic Optimum and the Cretaceous, suggesting that pastPhanerozoic greenhouse conditions may have reached sim-ilar maxima (Huber and Sloan, 2001; Douglas et al., 2014;Lunt et al., 2012; Upchurch et al., 2015). Skeletal growthtemperatures may also reflect seasonal biases (e.g. Butleret al., 2015) or differ systematically from a global seawateraverage due to the unique hydrography of tropical epeiricseaways.
Two aspects of the fossil record may magnify the impor-tance of diagenesis in Cambrian and Early Ordovician cal-citic fossils relative to its importance in younger materials.First, the lowest values in brachiopod calcite d18O predatesthe Ordovician radiation of calcifying taxa, when manygroups of thick-shelled taxa emerged. Those thick shellsare likely better able to withstand diagenesis. A skeletalcontrol on diagenesis is apparent in the divergence betweencalcite d18O and phosphate d18O values in the Cambrianand Early Ordovician (Fig. 1, light points in upper panel).Second, the Ordovician intracratonic seas that developedfollowing the Sauk Transgression—a eustatic sea level highover the past five hundred million years (Peters and Gaines,2012)—deposited strata on the geodynamically stable con-tinental interior, creating a unique sedimentary archive withlow burial and superior fossil preservation. We postulatethat the taphonomic opportunities associated with concur-rent development of thick-shelled calcitic skeletons anddeposition of gently buried midcratonic deposits in themid- to late Ordovician drove global trends in d18O mineralrecords that naturally reflect time-varying diageneticsignals.
5. CONCLUSIONS
The long-term increase in d18O of carbonate, apatite andchert has three end-member explanations: (1) the d18Orecord was controlled by cooling of surface environmentstowards the present, (2) the bulk isotopic concentration ofseawater increased 7‰ from the Cambrian period to thepresent, and (3) diagenetic alteration was more prevalent
in the past. Using clumped isotope thermometry, coupledwith micro-analytical screening, we evaluate the origins ofd18O records of carbonate and apatite by deconvolvingfluid composition from temperature. Results from Ordovi-cian and Cambrian calcitic and phosphatic taxa indicatethat seawater d18O did not approach �7‰. Instead, by con-straining the effect of diagenetic recrystallization on thematerials analyzed, we find equatorial temperatures ofOrdovician and Cambrian epeiric seas to be between 29and 38 �C, a temperature range within modern equatorialtemperatures and estimates from proxies and models forthe Cretaceous and Eocene (Huber and Sloan, 2001;Douglas et al., 2014; Lunt et al., 2012; Upchurch et al.,2015). Finally we hypothesize that d18O values trend fromlow to high during late Cambrian – Early Ordovician timebecause of (1) decreased diagenesis due to the taphonomicchange in skeletal materials that accompanied the Ordovi-cian radiation, and (2) the deposition of thin, thermallyimmature strata in the middle of continents during globaleustatic highstand, which contain fossil materials betterpreserved than their Cambrian-age counterparts.
ACKNOWLEDGEMENTS
We thank Ethan Grossman, Cedric John and an anonymousreviewer for helpful comments that improved the manuscript.The Los Angeles County Museum of Natural History, the WaikikiAquarium and Norene Tuross provided samples of modern linguli-form and calcitic brachiopods. Victoria Orphan provided the cal-citic brachiopod from Monterey Canyon. Matthew Robles andGerry Gunderson provided Eau Claire materials and collaboratedon fieldwork in the Eau Claire Formation. Norlene Emerson, ClintCowan, and Pat McLaughlin provided invaluable assistance on theDecorah Formation in the field. Nami Kitchen, Joel Hurowitz, ChiMa and Katie Eiler assisted with analytical measurements andmethod development. Page Quinton and Ken MacLeod are respon-sible for phosphate d18O measurements on splits of the ancient lin-guliform brachiopod samples and two of our modern linguliformsamples. A National Science Foundation Graduate Research Fel-lowship was provided to K. Bergmann. Support for analyses wasprovided by a National Science Foundation award (EAR-1053523) to WWF and JME. WWF acknowledges support fromthe Agouron Institute and a David and Lucile Packard Fellowshipfor Science and Engineering. LEP acknowledges logistical supportfrom the National Museum of Wales, Cardiff.
APPENDIX A. SUPPLEMENTARY MATERIAL
Supplementary data associated with this article can befound, in the online version, at https://doi.org/10.1016/j.gca.2017.11.015.
REFERENCES
Barker C. E. and Pawlewicz M. J. (1994) Calculation of vitrinitereflectance from thermal histiries amd peak temperatures. Acomparison of methods. Vitr. reflectance as a Matur. Param.
38 K.D. Bergmann et al. / Geochimica et Cosmochimica Acta 224 (2018) 18–41
temperature of early Ordovician seawater. Palaios 22, 98–103.https://doi.org/10.2110/palo.2005.p05-089r.
Bergstrom S. M. and McKenzie P. (2005) Biostratigraphic andpaleoceanographic relations between the type Richmondian(Upper Ordovician) in the Cincinnati region and the UpperMississippi Valley succession. Iowa Geol. Surv. Guideb. Ser.,35–37.
Bernasconi S. M., Hu B., Wacker U., Fiebig J., Breitenbach S. F.M. and Rutz T. (2013) Background effects on Faradaycollectors in gas-source mass spectrometry and implicationsfor clumped isotope measurements. Rapid Commun. Mass
Spectrom. 27, 603–612. https://doi.org/10.1002/rcm.6490.Bonifacie M., Calmels D., Eiler J. M., Horita J., Chaduteau C.,
Vasconcelos C., Agrinier P., Katz A., Passey B. H., Ferry J. M.and Bourrand J. J. (2017) Calibration of the dolomite clumpedisotope thermometer from 25 to 350 �C, and implications for auniversal calibration for all (Ca, Mg, Fe)CO3 carbonates.Geochim. Cosmochim. Acta 200, 255–279. https://doi.org/10.1016/j.gca.2016.11.028.
Brand U., Jiang G., Azmy K., Bishop J. and Montanez I. P. (2012)Diagenetic evaluation of a Pennsylvanian carbonate succession(Bird Spring Formation, Arrow Canyon, Nevada, U.S.A.) – 1:Brachiopod and whole rock comparison. Chem. Geol. 308–309,26–39. https://doi.org/10.1016/j.chemgeo.2012.03.017.
Brand U. and Veizer J. (1980) Chemical diagenesis of a multicom-ponent carbonate system-1: trace elements. J. Sediment. Petrol..
Brand W. A., Assonov S. S. and Coplen T. B. (2010) Correction forthe 17O interference in d13C measurements when analyzing CO2
with stable isotope mass spectrometry (IUPAC TechnicalReport). Pure Appl. Chem. 82, 1719–1733. https://doi.org/10.1351/PAC-REP-09-01-05.
Buggisch W., Joachimski M. M., Lehnert O., Bergstrom S. M.,Repetski J. E. and Webers G. F. (2010) Did intense volcanismtrigger the first late Ordovician icehouse? Geology 38, 327–330.https://doi.org/10.1130/G30577.1.
Butler S., Bailey T. R., Lear C. H., Curry G. B., Cherns L. andMcDonald I. (2015) The Mg/Ca-temperature relationship inbrachiopod shells: calibrating a potential palaeoseasonalityproxy. Chem. Geol. 397, 106–117. https://doi.org/10.1016/j.chemgeo.2015.01.009.
Came R. E., Eiler J. M., Veizer J., Azmy K., Brand U. andWeidman C. R. (2007) Coupling of surface temperatures andatmospheric CO2 concentrations during the Palaeozoic era.Nature 449, 198–201. https://doi.org/10.1038/nature06085.
Chang S. J. and Blake R. E. (2015) Precise calibration ofequilibrium oxygen isotope fractionations between dissolvedphosphate and water from 3 to 37 �C. Geochim. Cos-
Cowan C. A., Fox D. L., Runkel A. C. and Saltzman M. R. (2005)Terrestrial-marine carbon cycle coupling in �500-m.y.-oldphosphatic brachiopods. Geology 33, 661–664. https://doi.org/10.1130/G21434.1.
Cramer B. S., Miller K. G., Barrett P. J. and Wright J. D. (2011)Late Cretaceous-Neogene trends in deep ocean temperatureand continental ice volume: Reconciling records of benthicforaminiferal geochemistry (d18O and Mg/Ca) with sea levelhistory. J. Geophys. Res. Ocean. 116, C12023. https://doi.org/10.1029/2011JC007255.
Creveling J. R., Johnston D. T., Poulton S. W., Kotrc B., Marz C.,Schrag D. P. and Knoll A. H. (2014) Phosphorus sources forphosphatic Cambrian carbonates. Bull. Geol. Soc. Am. 126,145–163. https://doi.org/10.1130/B30819.1.
Cummins R. C., Finnegan S., Fike D. A., Eiler J. M. and FischerW. W. (2014) Carbonate clumped isotope constraints onSilurian ocean temperature and seawater d18O. Geochim.
Daeron M., Blamart D., Peral M. and Affek H. P. (2016) Absoluteisotopic abundance ratios and the accuracy of D47 measure-ments. Chem. Geol. 442, 83–96. https://doi.org/10.1016/j.chemgeo.2016.08.014.
Dale A., John C. M., Mozley P. S., Smalley P. C. and MuggeridgeA. H. (2014) Time-capsule concretions: unlocking burialdiagenetic processes in the Mancos shale using carbonateclumped isotopes. Earth Planet. Sci. Lett.. https://doi.org/10.1016/j.epsl.2014.03.004.
Defliese W. F., Hren M. T. and Lohmann K. C. (2015) Compo-sitional and temperature effects of phosphoric acid fractiona-tion on D47 analysis and implications for discrepantcalibrations. Chem. Geol. 396, 51–60. https://doi.org/10.1016/j.chemgeo.2014.12.018.
Dennis K. J., Affek H. P., Passey B. H., Schrag D. P. and Eiler J.M. (2011) Defining an absolute reference frame for ‘‘clumped”isotope studies of CO2. Geochim. Cosmochim. Acta 75, 7117–7131. https://doi.org/10.1016/j.gca.2011.09.025.
Douglas P. M. J., Affek H. P., Ivany L. C., Houben A. J. P., SijpW. P., Sluijs A., Schouten S. and Pagani M. (2014) Pronouncedzonal heterogeneity in Eocene southern high-latitude seasurface temperatures. Proc. Natl. Acad. Sci. U. S. A. 111, 1–6.https://doi.org/10.1073/pnas.1321441111.
Dronov A. V., Tolmacheva T., Raevskaya E. and Nestell M. (2005)Cambrian and Ordovician of St. Petersburg Region, Fossils.
Dronov A. V., Savitsky J. V., Fedorov P. V. and Tsyganova E. A.(1996) Detailed lithostratigraphy of the Ordovician lowerVolkhovian limestone along the eastern part of the Baltic-Ladoga Glint, northwestern Russia. Geol. Foeren. Stockholm
Foerh. 118, 19–24.Eagle R. A., Schauble E. A., Tripati A. K., Tutken T., Hulbert R.
C. and Eiler J. M. (2010) Body temperatures of modern andextinct vertebrates from 13C–18O bond abundances in bioap-atite. Proc. Natl. Acad. Sci. U. S. A. 107, 10377–10382. https://doi.org/10.1073/pnas.0911115107.
Eagle R. A., Tutken T., Martin T. S., Tripati A. K., Fricke H. C.,Connely M., Cifelli R. L. and Eiler J. M. (2011) Dinosaur bodytemperatures determined from isotopic (13C-18O) ordering infossil biominerals. Science 333, 443–445. https://doi.org/10.1126/science.1206196.
Egerquist E. and Egerquist E. (2003) New brachiopods from theLower-Middle Ordovician (Billingen–Volkhov stages) of theEast Baltic. Acta Palaeontol. Pol. 48, 31–38.
Eiler J. M. (2007) ‘‘Clumped-isotope” geochemistry–the study ofnaturally-occurring, multiply-substituted isotopologues. Earth
Planet. Sci. Lett. 262, 309–327. https://doi.org/10.1016/j.epsl.2007.08.020.
Elrick M., Rieboldt S., Saltzman M. and McKay R. M. (2011)Oxygen-isotope trends and seawater temperature changesacross the Late Cambrian Steptoean positive carbon-isotopeexcursion (SPICE event). Geology 39, 987–990. https://doi.org/10.1130/G32109.1.
Emerson N. R. (2002) Sedimentology, sequence stratigraphy, andbrachiopod biostratigraphy of the Ordovician (Mohawkian)Decorah Formation, Midcontinent, USA.
Fernandez A., Tang J. and Rosenheim B. E. (2014) Siderite‘‘clumped” isotope thermometry: a new paleoclimate proxy forhumid continental environments. Geochim. Cosmochim. Acta
126, 411–421. https://doi.org/10.1016/j.gca.2013.11.006.Finnegan S., Bergmann K., Eiler J. M., Jones D. S., Fike D. A.,
Eisenman I., Hughes N. C., Tripati A. K. and Fischer W. W.(2011) The magnitude and duration of Late Ordovician-EarlySilurian glaciation. Science 331, 903–906. https://doi.org/10.1126/science.1200803.
K.D. Bergmann et al. / Geochimica et Cosmochimica Acta 224 (2018) 18–41 39
Friedman I. and O’Neil J. R. (1977) Compilation of stable isotopefractionation factors of geochemical interest. Geol. Surv. Prof.Pap. 440. https://doi.org/10.1017/CBO9781107415324.004.
Giles P. S. (2012) Low-latitude Ordovician to Triassic brachiopodhabitat temperatures (BHTs) determined from d18O bra-chiopod calcite: a cold hard look at ice-house tropical oceans.Palaeogeogr. Palaeoclimatol. Palaeoecol. 317–318, 134–152.https://doi.org/10.1016/j.palaeo.2012.01.002.
Grossman E. L. (2012a) Applying oxygen isotope paleothermom-etry in deep time. Paleontol. Soc. Pap. 18, 39–68. https://doi.org/10.1017/s1089332600002540.
Grossman E. L. (2012b) Oxygen isotope stratigraphy. Geol. Time
Grossman E. L., Yancey T. E., Jones T. E., Bruckschen P.,Chuvashov B., Mazzullo S. J. and Mii H. sheng. (2008)Glaciation, aridification, and carbon sequestration in thePermo-Carboniferous: the isotopic record from low latitudes.Palaeogeogr. Palaeoclimatol. Palaeoecol. 268, 222–233. https://doi.org/10.1016/j.palaeo.2008.03.053.
Henkes G. A., Passey B. H., Grossman E. L., Shenton B. J., Perez-Huerta A. and Yancey T. E. (2014) Temperature limits forpreservation of primary calcite clumped isotope paleotemper-atures. Geochim. Cosmochim. Acta 139, 362–382. https://doi.org/10.1016/j.gca.2014.04.040.
Henkes G. A., Passey B. H., Wanamaker A. D., Grossman E. L.,Ambrose W. G. and Carroll M. L. (2013) Carbonate clumpedisotope compositions of modern marine mollusk and bra-chiopod shells. Geochim. Cosmochim. Acta 106, 307–325.https://doi.org/10.1016/j.gca.2012.12.020.
Holmden C. and Muehlenbachs K. (1993) The 18O/16O ratio of 2-billion-year-old seawater inferred from ancient oceanic crust.Science 259, 1733–1736. https://doi.org/10.1126/science.259.5102.1733.
Huber M. and Sloan L. C. (2001) Heat transport, deep waters, andthermal gradients: coupled simulation of an Eocene greenhouseclimate. Geophys. Res. Lett. 28, 3481–3484. https://doi.org/10.1029/2001GL012943.
Huntington K. W., Eiler J. M., Affek H. P., Guo W., Bonifacie M.,Yeung L. Y., Thiagarajan N., Passey B., Tripati A., Daeron M.and Came R. (2009) Methods and limitations of ‘‘clumped”CO2 isotope (D47) analysis by gas-source isotope ratiomassspectrometry. J. Mass Spectrom. 44, 1318–1329. https://doi.org/10.1002/jms.1614.
Jaffres J. B. D., Shields G. A. and Wallmann K. (2007) The oxygenisotope evolution of seawater: a critical review of a long-standing controversy and an improved geological water cyclemodel for the past 3.4 billion years. Earth-Sci. Rev. 83, 83–122.https://doi.org/10.1016/j.earscirev.2007.04.002.
Joachimski M. M. and Lambert L. L. (2015) Salinity contrast inthe US Midcontinent Sea during Pennsylvanian glacio-eustatichighstands: evidence from conodont apatite d18O. Palaeogeogr.Palaeoclimatol. Palaeoecol. 433, 71–80. https://doi.org/10.1016/j.palaeo.2015.05.014.
Joachimski M. M., van Geldern R., Breisig S., Buggisch W. andDay J. (2004) Oxygen isotope evolution of biogenic calcite andapatite during the Middle and Late Devonian. Int. J. Earth Sci.
93, 542–553. https://doi.org/10.1007/s00531-004-0405-8.John C. M. (2015) Burial estimates constrained by clumped isotope
thermometry: example of the Lower Cretaceous Qishn Forma-tion (Haushi-Huqf High, Oman). Geol. Soc. London, Spec.
Publ. 435. https://doi.org/10.1144/SP435.5.John C. M. and Bowen D. (2016) Community software for
challenging isotope analysis: First applications of ‘‘Easotope”to clumped isotopes. Rapid Commun. Mass Spectrom. 30, 2285–2300. https://doi.org/10.1002/rcm.7720.
Karhu J. and Epstein S. (1986) The implication of the oxygenisotope records in coexisting cherts and phosphates. Geochim.
Kasting J. F., Howard M. T., Wallmann K., Veizer J., Shields G.and Jaffres J. B. D. (2006) Paleoclimates, ocean depth, and theoxygen isotopic composition of seawater. Earth Planet. Sci.
Lett. 252, 82–93. https://doi.org/10.1016/j.epsl.2006.09.029.Kele S., Breitenbach S. F. M., Capezzuoli E., Meckler A. N.,
Ziegler M., Millan I. M., Kluge T., Deak J., Hanselmann K.,John C. M., Yan H., Liu Z. and Bernasconi S. M. (2015)Temperature dependence of oxygen- and clumped isotopefractionation in carbonates: a study of travertines and tufas inthe 6–95�C temperature range. Geochim. Cosmochim. Acta 168,172–192. https://doi.org/10.1016/j.gca.2015.06.032.
Kelson J. R., Huntington K. W., Schauer A. J., Saenger C. andLechler A. R. (2017) Toward a universal carbonate clumpedisotope calibration: diverse synthesis and preparatory methodssuggest a single temperature relationship. Geochim. Cosmochim.
Acta 197, 104–131. https://doi.org/10.1016/j.gca.2016.10.010.Kim S.-T. and O’Neil J. R. (1997) Equilibrium and nonequilibrium
oxygen isotope effects in synthetic carbonates. Geochim. Cos-
Kim S. T., Mucci A. and Taylor B. E. (2007a) Phosphoric acidfractionation factors for calcite and aragonite between 25 and75 �C: revisited. Chem. Geol. 246, 135–146. https://doi.org/10.1016/j.chemgeo.2007.08.005.
Kim S. T., O’Neil J. R., Hillaire-Marcel C. and Mucci A. (2007b)Oxygen isotope fractionation between synthetic aragonite andwater: influence of temperature and Mg2+ concentration.Geochim. Cosmochim. Acta 71, 4704–4715. https://doi.org/10.1016/j.gca.2007.04.019.
Kluge T., Affek H. P., Zhang Y. G., Dublyansky Y., Spotl C.,Immenhauser A. and Richter D. K. (2014) Clumped isotopethermometry of cryogenic cave carbonates. Geochim. Cos-
Knauth L. P. and Epstein S. (1976) Hydrogen and oxygen isotoperatios in nodular and bedded cherts. Geochim. Cosmochim. Acta
40, 1095–1108. https://doi.org/10.1016/0016-7037(76)90051-X.Koch P. P. L., Tuross N. and Fogel M. L. M. (1997) The effects of
sample treatment and diagenesis on the isotopic integrity ofcarbonate in biogenic hydroxylapatite. J. Archaeol. Sci. 24,417–429. https://doi.org/10.1006/jasc.1996.0126.
Kolodny Y., Luz B. and Navon O. (1983) Oxygen isotopevariations in phosphate of biogenic apatites, I. Fish boneapatite—rechecking the rules of the game. Earth Planet. Sci.
Lett. 64, 398–404.Lear C. H. (2000) Cenozoic deep-sea temperatures and global ice
volumes from Mg/Ca in benthic foraminiferal calcite. Science287, 269–272. https://doi.org/10.1126/science.287.5451.269.
Lecuyer C., Amiot R., Touzeau A. and Trotter J. (2013) Calibra-tion of the phosphate d18O thermometer with carbonate-wateroxygen isotope fractionation equations. Chem. Geol. 347, 217–226. https://doi.org/10.1016/j.chemgeo.2013.03.008.
Lecuyer C., Grandjean P., Barrat J.-A. A., Nolvak J., Emig C.,Paris F. and Robardet M. (1998) D18O and REE contents ofphosphatic brachiopods: a comparison between modern andlower Paleozoic populations. Geochim. Cosmochim. Acta 62,2429–2436. https://doi.org/10.1016/S0016-7037(98)00170-7.
Lecuyer C., Grandjean P. and Emig C. C. (1996) Determination ofoxygen isotope fractionation between water and phosphatefrom living lingulids: potential application to palaeoenviron-mental studies. Palaeogeogr. Palaeoclimatol. Palaeoecol. 126,101–108.
40 K.D. Bergmann et al. / Geochimica et Cosmochimica Acta 224 (2018) 18–41
Longinelli A. and Nuti S. (1973) Revised phosphate-water isotopictemperature scale. Earth Planet. Sci. Lett. 19, 373–376. https://doi.org/10.1016/0012-821X(73)90088-5.
Ludvigsen R. and Westrop S. R. (1983) Trilobite biofacies of thecambrian-ordovician boundary interval in northern NorthAmerica. Alcheringa 7, 301–319. https://doi.org/10.1080/03115518308619614.
Ludvigson G. A., Witzke B. J., Gonzalez L. A., Carpenter S. J.,Schneider C. L. and Hasiuk F. (2004) Late Ordovician(Turinian-Chatfieldian) carbon isotope excursions and theirstratigraphic and paleoceanographic significance. Palaeogeogr.Palaeoclimatol. Palaeoecol. 210, 187–214. https://doi.org/10.1016/j.palaeo.2004.02.043.
Lundsten L., Schlining K. L., Frasier K., Johnson S. B., Kuhnz L.A., Harvey J. B. J., Clague G. and Vrijenhoek R. C. (2010)Time-series analysis of six whale-fall communities in MontereyCanyon, California, USA. Deep Sea Res. Part I: Ocean. Res.
Pap. 57(12). https://doi.org/10.1016/j.dsr.2010.09.003.Lunt D. J., Jones T. D., Heinemann M., Huber M., LeGrande A.,
Winguth A., Loptson C., Marotzke J., Roberts C. D., TindallJ., Valdes P. and Winguth C. (2012) A model-data comparisonfor a multi-model ensemble of early Eocene atmosphere-oceansimulations: EoMIP. Clim. Past 8, 1717–1736. https://doi.org/10.5194/cp-8-1717-2012.
Mook W. G. (1971) Paleotemperatures and chlorinities from stablecarbon and oxygen isotopes in shell carbonate. Palaeogeogr.
Moqsud M. A., Hayashi S., Du Y. J. and Suetsugu D. (2006)Evaluation of temperature trend in contaminated tidal flat inthe Ariake Sea, Japan. Am. J. Environ. Sci. 2, 104–108.
Muehlenbachs K. (1998) The oxygen isotopic composition of theoceans, sediments and the seafloor. Chem. Geol. 145, 263–273.
Muehlenbachs K. and Clayton R. N. (1976) Oxygen isotopecomposition of the oceanic crust and its bearing on seawater. J.Geophys. Res. 81, 4365–4369. https://doi.org/10.1029/JB081i023p04365.
Muller I. A., Fernandez A., Radke J., van Dijk J., Bowen D.,Schwieters J. and Bernasconi S. M. (2017) Carbonate clumpedisotope analyses with the long-integration dual-inlet (LIDI)workflow: scratching at the lower sample weight boundaries.Rapid Commun. Mass Spectrom. 31, 1057–1066. https://doi.org/10.1002/rcm.7878.
Myrow P. M., Taylor J. F., Runkel A. C. and Ripperdan R. L.(2012) Mixed siliciclastic–carbonate upward-deepening cyclesof the upper Cambrian inner detrital belt of Laurentia. J.
Sediment. Res. 82, 216–231. https://doi.org/10.2110/jsr.2012.20.Passey B. H., Cerling T. E. and Levin N. E. (2007) Temperature
dependence of oxygen isotope acid fractionation for modernand fossil tooth enamels. Rapid Commun. Mass Spectrom. 21,2853–2859. https://doi.org/10.1002/rcm.3149.
Passey B. H., Levin N. E., Cerling T. E., Brown F. H., Eiler J. M.and Turekian K. K. (2010) High-temperature environments ofhuman evolution in East Africa based on bond ordering inpaleosol carbonates. Proc. Natl. Acad. Sci. U. S. A. 107, 11245–11249. https://doi.org/10.1073/pnas.1001824107.
Peters S. E. and Gaines R. R. (2012) Formation of the ‘‘GreatUnconformity” as a trigger for the Cambrian explosion. Nature
484, 363–366. https://doi.org/10.1038/nature10969.Popov L. E., Egerquist E. and Zuykov M. A. (2005) Ordovician
(Arenig-Caradoc) syntrophiidine brachiopods from the EastBaltic region. Palaeontology 48, 739–761. https://doi.org/10.1111/j.1475-4983.2005.00487.x.
Prokoph A., Shields G. A. and Veizer J. (2008) Compilation andtime-series analysis of a marine carbonate d18O, d13C, 87Sr/86Sr
and d34S database through Earth history. Earth-Sci. Rev. 87,113–133. https://doi.org/10.1016/j.earscirev.2007.12.003.
Pruss S. B., Finnegan S., Fischer W. W. and Knoll A. H. (2010)Carbonates in skeleton-poor seas: new insights from Cambrianand Ordovician strata of Laurentia. Palaios 25, 73–84. https://doi.org/10.2110/palo.2009.p09-101r.
Puceat E., Joachimski M. M., Bouilloux A., Monna F., Bonin A.,Motreuil S., Moriniere P., Henard S., Mourin J., Dera G. andQuesne D. (2010) Revised phosphate–water fractionationequation reassessing paleotemperatures derived from biogenicapatite. Earth Planet. Sci. Lett. 298, 135–142.
Rasmussen C. M. Ø., Ullmann C. V., Jakobsen K. G., LindskogA., Hansen J., Hansen T., Eriksson M. E., Dronov A., Frei R.,Korte C., Nielsen A. T. and Harper D. A. T. (2016) Onset ofmain Phanerozoic marine radiation sparked by emerging MidOrdovician icehouse. Sci. Rep. 6, 18884. https://doi.org/10.1038/srep18884.
Rodland D. L., Kowalewski M., Dettman D. L., Flessa K. W.,Atudorei V. and Sharp Z. D. (2003) High-resolution analysis ofd18O in the biogenic phosphate of modern and fossil lingulidbrachiopods. J. Geol. 111, 441–453. https://doi.org/10.1086/375283.
Rohrssen M. (2013) Molecular organic geochemical records of lateOrdovician biospheric evolution.
Rohrssen M., Gill B. C. and Love G. D. (2015) Scarcity of the C 30sterane biomarker, 24-n-propylcholestane, in Lower Paleozoicmarine paleoenvironments. Org. Geochem. 80, 1–7. https://doi.org/10.1016/j.orggeochem.2014.11.008.
Rowan E. L., Goldhaber M. B. (1996). Fluid Inclusions andBiomarkers in the Upper Mississippi Valley Zinc-lead District;Implications for the Fluid-flow and Thermal History of theIllinois Basin. Bulletin.
Runkel A., McKay R., Cowan C., Miller J., Taylor J. (2012). TheSauk Megasequence in the cratonic interior of North America:interplay between a fully developed inner detrital belt and thecentral Great American Carbonate Bank. AAPG Mem. 98 Gt.Am. Carbonate Bank. pp. 1001–1011. http://doi.org/10.1306/13331526M983522.
Runkel A. C., McKay R. M. and Palmer A. R. (1998) Origin of aclassic cratonic sheet sandstone: stratigraphy across the SaukII–Sauk III boundary in the Upper Mississippi Valley. GSA
Bull. 110.Runkel A. C., Miller J. F., McKay R. M., Palmer A. R. and Taylor
J. F. (2007) High-resolution sequence stratigraphy of lowerPaleozoic sheet sandstones in central North America: the roleof special conditions of cratonic interiors in development ofstratal architecture. Bull. Geol. Soc. Am. 119, 860–881. https://doi.org/10.1130/B26117.1.
Saltzman M. R., Cowan C. A., Runkel A. C., Runnegar B.,Stewart M. C. and Palmer A. R. (2004) The Late CambrianSpice (13C) event and the Sauk II-Sauk III regression: newevidence from Laurentian basins in Utah, Iowa, and New-foundland. J. Sediment. Res. 74, 366–377. https://doi.org/10.1306/120203740366.
Schauer A. J., Kelson J., Saenger C. and Huntington K. W. (2016)Choice of 17O correction affects clumped isotope (D47) values ofCO2 measured with mass spectrometry. Rapid Commun. Mass
Spectrom. 30, 2607–2616. https://doi.org/10.1002/rcm.7743.Schmidt G. A. (1999) Forward modeling of carbonate proxy data
from planktonic foraminifera using oxygen isotope tracers in aglobal ocean model. Paleoceanography 14, 482–497. https://doi.org/10.1029/1999PA900025.
Sell B. K., Samson S. D., Mitchell C. E., McLaughlin P. I., KoenigA. E. and Leslie S. A. (2015) Stratigraphic correlations usingtrace elements in apatite from late Ordovician (Sandbian-
K.D. Bergmann et al. / Geochimica et Cosmochimica Acta 224 (2018) 18–41 41
Katian) K-bentonites of eastern North America. Bull. Geol.
Soc. Am. 127, 1259–1274. https://doi.org/10.1130/B31194.1.Shemesh A., Kolodny Y. and Luz B. (1988) Isotope geochemistry
of oxygen and carbon in phosphate and carbonate of phos-phorite francolite. Geochim. Cosmochim. Acta 52, 2565–2572.https://doi.org/10.1016/0016-7037(88)90027-0.
Shields G. and Veizer J. (2002) The Precambrian marine carbonateisotope database: version 1.1. Geochem. Geophys. Geosyst. 3, 1–12. https://doi.org/10.1029/2001GC000266.
Simo J. A., Emerson N. R., Byers C. W. and Ludvigson G. A.(2003) Anatomy of an embayment in an Ordovician epeiric sea,Upper Mississippi Valley, USA. Geology 31, 545–548. https://doi.org/10.1130/0091-7613(2003)0310545:AOAEIA2.0.CO;2.
Smith G. L. and Clark D. L. (1996) Condonts of the LowerOrdovician Prairie du Chien Group of Wisconsin and Min-nesota. Micropaleontology 42, 363. https://doi.org/10.2307/1485958.
Stolper D. A. and Eiler J. M. (2015) The kinetics of solid-stateisotope-exchange reactions for clumped isotopes: a study ofinorganic calcites and apatites from natural and experimentalsamples. Am. J. Sci. 315, 363–411. https://doi.org/10.2475/05.2015.01.
Tang J., Dietzel M., Fernandez A., Tripati A. K. and RosenheimB. E. (2014) Evaluation of kinetic effects on clumped isotopefractionation (D47) during inorganic calcite precipitation.Geochim. Cosmochim. Acta 134, 120–136. https://doi.org/10.1016/j.gca.2014.03.005.
Tolmacheva T., Egerquist E., Meidla T., Tinn O. and Holmer L.(2003) Faunal composition and dynamics in unconsolidatedsediments: a case study from the Middle Ordovician of the EastBaltic. Geol. Mag. 140, 31–44. https://doi.org/10.1017/S001675680200701X.
Trotter J. A., Williams I. S., Barnes C. R., Lecuyer C. and NicollR. S. (2008) Did cooling oceans trigger Ordovician biodiver-sification? Evidence from conodont thermometry. Science 321,550–554. https://doi.org/10.1126/science.1155814.
Turchyn A. V., Alt J. C., Brown S. T., DePaolo D. J., Coggon R.M., Chi G., Bedard J. H. and Skulski T. (2013) Reconstructingthe oxygen isotope composition of late Cambrian and Creta-ceous hydrothermal vent fluid. Geochim. Cosmochim. Acta 123,440–458. https://doi.org/10.1016/j.gca.2013.08.015.
Upchurch G. R., Kiehl J., Shields C., Scherer J. and Scotese C.(2015) Latitudinal temperature gradients and high-latitude
temperatures during the latest Cretaceous: congruence ofgeologic data and climate models. Geology 43, 683–686.https://doi.org/10.1130/G36802.1.
Urey H. C. (1947) The thermodynamic properties of isotopicsubstances. J. Chem. Soc. 562. https://doi.org/10.1039/jr9470000562.
Veizer J., Ala D., Azmy K., Bruckschen P., Buhl D., Bruhn F.,Carden G., Diener A., Ebneth S., Godderis Y., Jasper T., KorteC., Pawellek F., Podlaha O. and Strauss H. (1999) 87Sr/86Sr,d13C and d18O evolution of Phanerozoic seawater. Chem. Geol.
161, 59–88. https://doi.org/10.1016/S0009-2541(99)00081-9.Veizer J., Bruckschen P., Pawellek F., Diener A., Podlaha O. G.,
Carden G. A. F., Jasper T., Korte C., Strauss H., Azmy K. andAla D. (1997) Oxygen isotope evolution of Phanerozoicseawater. Palaeogeogr. Palaeoclimatol. Palaeoecol. 132, 159–172. https://doi.org/10.1016/S0031-0182(97)00052-7.
Veizer J. and Prokoph A. (2015) Temperatures and oxygen isotopiccomposition of Phanerozoic oceans. Earth-Sci. Rev. 146, 92–104. https://doi.org/10.1016/j.earscirev.2015.03.008.
Wacker U., Fiebig J., Todter J., Schone B. R., Bahr A., FriedrichO., Tutken T., Gischler E. and Joachimski M. M. (2014)Empirical calibration of the clumped isotope paleothermometerusing calcites of various origins. Geochim. Cosmochim. Acta
M. E. and Fiebig J. (2016) Clumped isotope thermometry ofcarbonate-bearing apatite: revised sample pre-treatment, aciddigestion, and temperature calibration. Chem. Geol. 443, 97–110. https://doi.org/10.1016/j.chemgeo.2016.09.009.
Wenzel B., Lecuyer C. and Joachimski M. M. (2000) Comparingoxygen isotope records of silurian calcite and phosphate—d18Ocompositions of brachiopods and conodonts. Geochim. Cos-
mochim. Acta 64, 1859–1872.Westrop S. R. (1996) Temporal persistence and stability of
Cambrian biofacies: Sunwaptan (Upper Cambrian) trilobitefaunas of North America. Palaeogeogr. Palaeoclimatol.