38
Blyth Industries, Inc. 1999 Annual Report A P ART OF L IFE. E VERY D AY .

B l y t h I n d u s t r i e s , I n c . 1 9 9 9 A n n u a l R e p o r t
A P A R T O F L I F E.
E V E R Y D A Y.
BLYTH INDUSTRIES, INC.
TABLE OF CONTENTS
Blyth Industries, Inc. designs, manufactures, mar-
kets and distributes an extensive line of
candles and home fragrance products including
scented candles, outdoor lighting products,
potpourri, and environmental fragrance products,
and markets a broad range of related candle
accessories and decorative gift bags and tags. It
is also a leading producer of portable heating
fuel products.
Financial Highlights 1
Letter from the Chairman 2
A Part of Life. Every Day. 4
Financial Review 10
Directors and Officers 34
Shareholder Information 35
*The COLONY® and ECLIPSE CANDLES™ trademarks are registered inthe United Kingdom and other countries outside of the United States.Blyth’s products under the COLONY® and ECLIPSE CANDLES™ marksare offered and sold only outside of the United States, and are not availablein the United States. COLONY® and ECLIPSE CANDLES™ brand prod-ucts sold in the United States are in no way associated with Blyth, and aremade and sold by another company.
® *
®
®
®
®
™ *
TM
TM
1
FINANCIAL HIGHLIGHTS
Market for Common Stock (3)
The price range for the Company’s Common Stock on the New York StockExchange as reported by the New York Stock Exchange was as follows:
Fiscal 1998(Ended January 31, 1998)
high Low
First Quarter $26.25 $21.08Second Quarter $38.44 $24.17Third Quarter $39.13 $23.25Fourth Quarter $31.25 $22.63
Fiscal 1999(Ended January 31, 1999)
high Low
First Quarter $37.63 $28.81Second Quarter $37.56 $29.56Third Quarter $30.19 $22.94Fourth Quarter $34.19 $27.63
Fiscal 2000(Ended January 31, 2000)
high Low
First Quarter (through April 9, 1999) $28.00 $21.63
(1) Financial position amounts include the balance sheet of Liljeholmens Stearinfabriks AB as of December 31, 1998 as a result of the Company’s investment in Liljeholmens as further described in the footnotes to the financial statements. Due to the timing of the investment the operating results of Liljeholmens are not included in the operating results of the Company.
(2) Net Earnings and Diluted Net Earnings Per Share include one-time non-recurring transaction costs of $3.2 million after-tax incurred by Endar Corp. prior to its acquisition by Blyth.
(3) Reflects the June 1997 three-for-two stock split effected as a stock dividend.
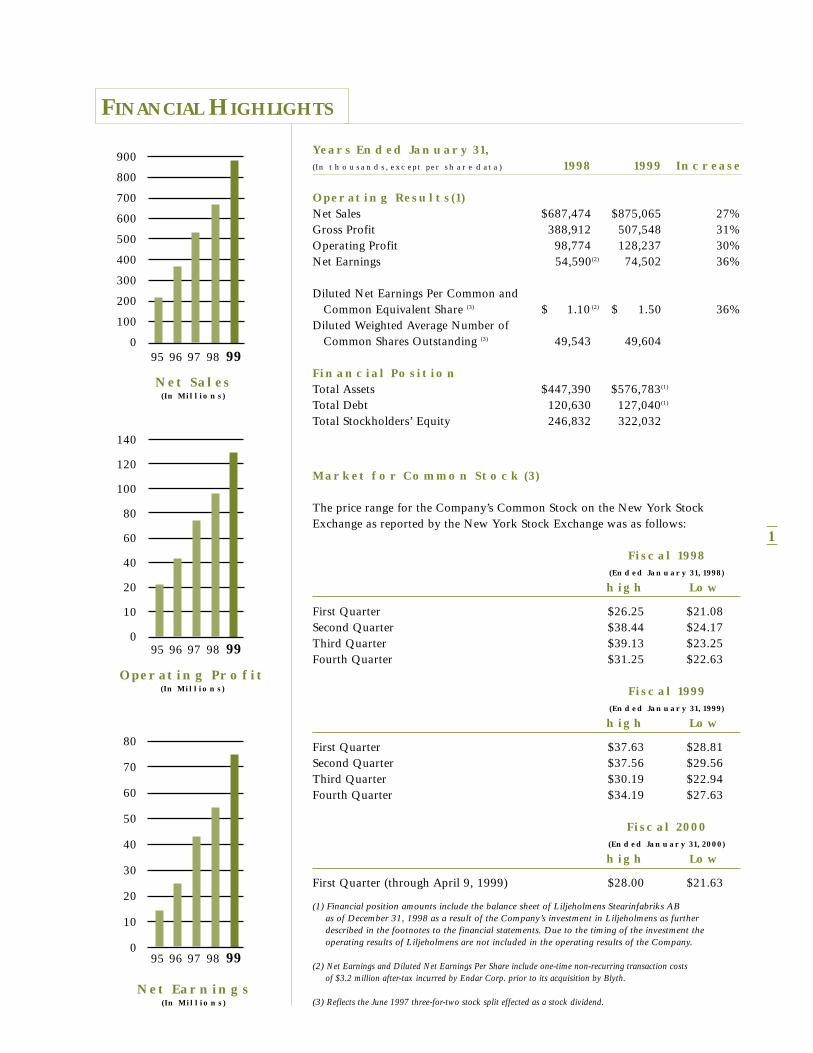
Net Sales (In Millions)
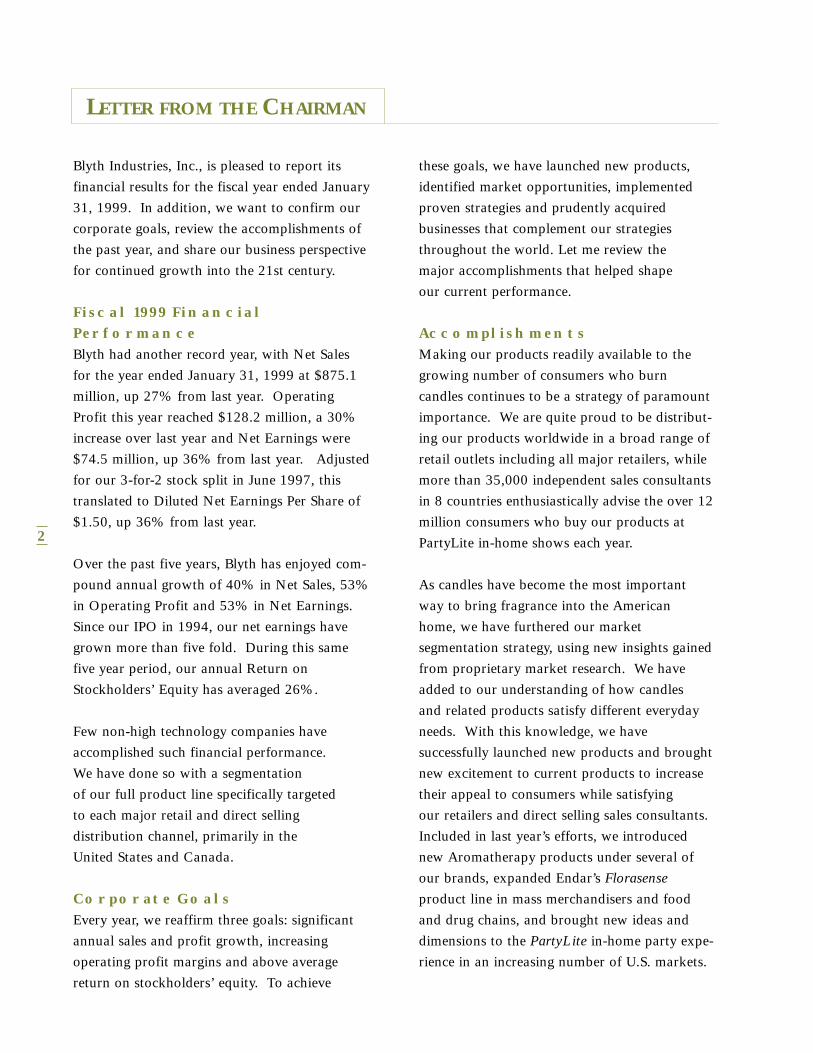
Operating Profit(In Millions)
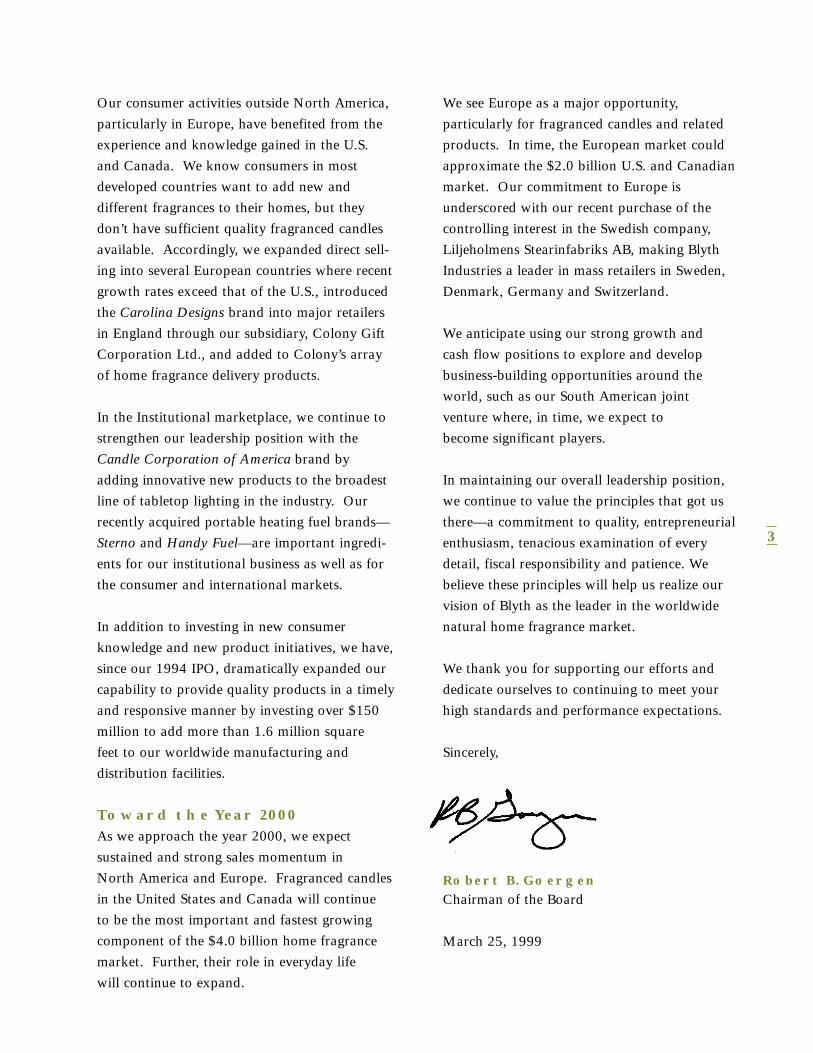
Net Earnings(In Millions)
95 96 97 98 99
95 96 97 98 99
95 96 97 98 99
900
800
700
600
500
400
300
200
100
0
140
120
100
80
60
40
20
10
0
80
70
60
50
40
30
20
10
0
Years Ended January 31,(In thousands, except per share data) 1998 1999 Increase
Operating Results(1)Net Sales $687,474 $875,065 27%Gross Profit 388,912 507,548 31%Operating Profit 98,774 128,237 30%Net Earnings 54,590(2) 74,502 36%
Diluted Net Earnings Per Common andCommon Equivalent Share (3) $ 1.10 (2) $ 1.50 36%
Diluted Weighted Average Number of Common Shares Outstanding (3) 49,543 49,604
Financial PositionTotal Assets $447,390 $576,783(1)
Total Debt 120,630 127,040(1)
Total Stockholders’ Equity 246,832 322,032
2
Blyth Industries, Inc., is pleased to report its
financial results for the fiscal year ended January
31, 1999. In addition, we want to confirm our
corporate goals, review the accomplishments of
the past year, and share our business perspective
for continued growth into the 21st century.
Fiscal 1999 FinancialPerformanceBlyth had another record year, with Net Sales
for the year ended January 31, 1999 at $875.1
million, up 27% from last year. Operating
Profit this year reached $128.2 million, a 30%
increase over last year and Net Earnings were
$74.5 million, up 36% from last year. Adjusted
for our 3-for-2 stock split in June 1997, this
translated to Diluted Net Earnings Per Share of
$1.50, up 36% from last year.
Over the past five years, Blyth has enjoyed com-
pound annual growth of 40% in Net Sales, 53%
in Operating Profit and 53% in Net Earnings.
Since our IPO in 1994, our net earnings have
grown more than five fold. During this same
five year period, our annual Return on
Stockholders’ Equity has averaged 26%.
Few non-high technology companies have
accomplished such financial performance.
We have done so with a segmentation
of our full product line specifically targeted
to each major retail and direct selling
distribution channel, primarily in the
United States and Canada.
Corporate GoalsEvery year, we reaffirm three goals: significant
annual sales and profit growth, increasing
operating profit margins and above average
return on stockholders’ equity. To achieve
these goals, we have launched new products,
identified market opportunities, implemented
proven strategies and prudently acquired
businesses that complement our strategies
throughout the world. Let me review the
major accomplishments that helped shape
our current performance.
AccomplishmentsMaking our products readily available to the
growing number of consumers who burn
candles continues to be a strategy of paramount
importance. We are quite proud to be distribut-
ing our products worldwide in a broad range of
retail outlets including all major retailers, while
more than 35,000 independent sales consultants
in 8 countries enthusiastically advise the over 12
million consumers who buy our products at
PartyLite in-home shows each year.
As candles have become the most important
way to bring fragrance into the American
home, we have furthered our market
segmentation strategy, using new insights gained
from proprietary market research. We have
added to our understanding of how candles
and related products satisfy different everyday
needs. With this knowledge, we have
successfully launched new products and brought
new excitement to current products to increase
their appeal to consumers while satisfying
our retailers and direct selling sales consultants.
Included in last year’s efforts, we introduced
new Aromatherapy products under several of
our brands, expanded Endar’s Florasense
product line in mass merchandisers and food
and drug chains, and brought new ideas and
dimensions to the PartyLite in-home party expe-
rience in an increasing number of U.S. markets.
LETTER FROM THE CHAIRMAN
3
Our consumer activities outside North America,
particularly in Europe, have benefited from the
experience and knowledge gained in the U.S.
and Canada. We know consumers in most
developed countries want to add new and
different fragrances to their homes, but they
don’t have sufficient quality fragranced candles
available. Accordingly, we expanded direct sell-
ing into several European countries where recent
growth rates exceed that of the U.S., introduced
the Carolina Designs brand into major retailers
in England through our subsidiary, Colony Gift
Corporation Ltd., and added to Colony’s array
of home fragrance delivery products.
In the Institutional marketplace, we continue to
strengthen our leadership position with the
Candle Corporation of America brand by
adding innovative new products to the broadest
line of tabletop lighting in the industry. Our
recently acquired portable heating fuel brands—
Sterno and Handy Fuel—are important ingredi-
ents for our institutional business as well as for
the consumer and international markets.
In addition to investing in new consumer
knowledge and new product initiatives, we have,
since our 1994 IPO, dramatically expanded our
capability to provide quality products in a timely
and responsive manner by investing over $150
million to add more than 1.6 million square
feet to our worldwide manufacturing and
distribution facilities.
Toward the Year 2000As we approach the year 2000, we expect
sustained and strong sales momentum in
North America and Europe. Fragranced candles
in the United States and Canada will continue
to be the most important and fastest growing
component of the $4.0 billion home fragrance
market. Further, their role in everyday life
will continue to expand.
We see Europe as a major opportunity,
particularly for fragranced candles and related
products. In time, the European market could
approximate the $2.0 billion U.S. and Canadian
market. Our commitment to Europe is
underscored with our recent purchase of the
controlling interest in the Swedish company,
Liljeholmens Stearinfabriks AB, making Blyth
Industries a leader in mass retailers in Sweden,
Denmark, Germany and Switzerland.
We anticipate using our strong growth and
cash flow positions to explore and develop
business-building opportunities around the
world, such as our South American joint
venture where, in time, we expect to
become significant players.
In maintaining our overall leadership position,
we continue to value the principles that got us
there—a commitment to quality, entrepreneurial
enthusiasm, tenacious examination of every
detail, fiscal responsibility and patience. We
believe these principles will help us realize our
vision of Blyth as the leader in the worldwide
natural home fragrance market.
We thank you for supporting our efforts and
dedicate ourselves to continuing to meet your
high standards and performance expectations.
Sincerely,
Robert B. GoergenChairman of the Board
March 25, 1999

At a time when consumers are more dependent
on fast-paced high-tech products and services,
they also demonstrate an unswerving
desire for fundamental products to
make their daily life better.
For thousands of years,
candles have provided light,
heat and atmosphere.
But, as life becomes
more complex, so
has the use and
demand for candles,
and the related
changes in products and
distribution to satisfy that demand.
CANDLES HAVE CHANGED INTOEVERYDAY PERSONAL PRODUCTS
The evidence of this change is startling.
The market, once simple in its offering
of basic tapers for home and institutional
use, has matured into a
multi-tiered, segmented arena
of home fragrance products
with a wide variety of brands,
product forms, scents, colors
and sizes. Each is now
more available than many
consumer products, as new
distribution channels, such
as catalogs and the internet,
are being used.
A PART OF LIFE. EVERY DAY.
Aromatherapy by Eclipse Candles.

More importantly, the use of candles has
blossomed from occasional and practical to
an affirming part of everyday life. “No matter
whose home we visit, candles are always there to
make my husband and me feel welcome.” In the
early ‘90s, a woman decorated her dining room
table with elegant white tapers for dinner guests.
Today, she burns various forms and fragrances
in different rooms throughout the house, each
creating its own special ambiance. “With
so many new scents, I can create a different
experience in each room.”
As evidence, this past year saw over
half of all women in America use
candles in six different rooms—
in the living room (86%),
bedroom (68%), bathroom
(65%), kitchen (63%),
dining room (56%) and
family room (51%).
In fact, during the past year,
over 60% of women in the U.S.
bought candles—only surpassed
among personal products by toothpaste,
shampoo and lipstick. That’s because
candles are becoming very personal, in
addition to the traditional uses of entertaining
and gift-giving. A working mother told us,
“When I get home I look forward to lighting
some candles and relaxing.” This shift in candle
usage has made them an intimate everyday
product for pampering and relaxation.
As candles
have become
a staple in their
every day lives,
women now put candles on their shopping list.
When they do, they buy more. Nearly forty
percent of women plan candle purchases and
buy sixty-five percent more candles than those
who don’t plan. The expanded use of candles
throughout the house is significantly influenced
by scent. Over ninety percent of candle users
buy fragranced candles, making them the leading
home fragrance delivery system.
BLYTH HAS CHANGEDITS EVERYDAY BUSINESSAs the leading manufacturer
and marketer of home fragrance
products, including candles,
candle accessories, tabletop
lighting, portable heating fuel
products and fragranced
filters, we have played an
important role in creating
many of these changes. We
applied fundamental strategies
to reshape a quiet but steadily
growing business into a dynamic
high-growth market. To achieve success,
we continue to implement four fundamental
5
“No matter whose
home we visit, candles
are always there to
make my husband and
Me feel welcome.”
Aromatherapy by Ambria.
Gel Pomanders by Carolina Designs.

strategies regarding business, segmentation,
product and learning:
Business Strategy
Seek new and larger opportunities
for product differentiation,
healthy profit margins and
profitable growth.
This strategy encourages
us to focus on creating and
building significant and
steady growth in both
retail and direct sales
channels. Of primary
importance are ways to...
• Enhance our emphasis
on higher margin
consumer products
The dynamics of helping women in their daily
lives influences all aspects of our business,
including market research, information tech-
nology and product development.
• Balance new product
development and acquisitions
As consumers search for new
ways to use candles, new
products become the very life
blood of our success. We
usually develop our own,
but also make acquisitions
that add relevance to our
product offering.
• Penetrate major
distribution channels
Our retail channel Sea Spray Potpourri by Florasense.
7
strategy is to expand the number of locations
within stores where our products are found.
Our strategy for in-home selling, which is so
well-suited to home fragrance products, is to
continue developing existing and new markets.
• Emphasize customer satisfaction with
value-added customer service
We develop programs and standards, electronic
data bases, and even extranets to evaluate and
improve customer service for both retail and
direct sales channels.
• Seek efficiencies in sourcing,
manufacturing and distribution
We design and innovate new ways to deliv-
er quality products at affordable costs.
This adds the important dimension of
value to the product experience
enjoyed by all of our consumers.
• Facilitate global expansion
We identify opportunities
around the world and
adapt success models
from our North
American experience.
Segmentation Strategy
Have the right brand at
the right price in the right
channels of distribution.
To keep pace with this dynamic market, we seg-
ment our products by channel type. We put
different brands in many departments and aisles
in different
retail outlets,
and we promote
usage in different rooms for different occasions
in our in-home shows. We also segment prod-
ucts by consumer type by positioning each brand
to address specific daily personal needs. But,
we know that yesterday’s insights and successes
may not be right for tomorrow. Consequently,
our segmentation planning continually
acknowledges changing consumer, consultant
and customer attitudes and preferences.
Product Strategy
Evaluate and prioritize the global
mix of our products.
Our understanding of the
complexities of our segmented
business enables us to continually
fine-tune our efforts by prioritizing
our geographic markets and
products. We are placing
growing importance on
markets outside the United
States and defining how
much of our global
business could likely come
from each country. Our
tailored market research throughout
the world has clearly identified
“When I get home,
I look forward
to lighting some
candles and relaxing.”
Freshëns™ by Carolina Designs.
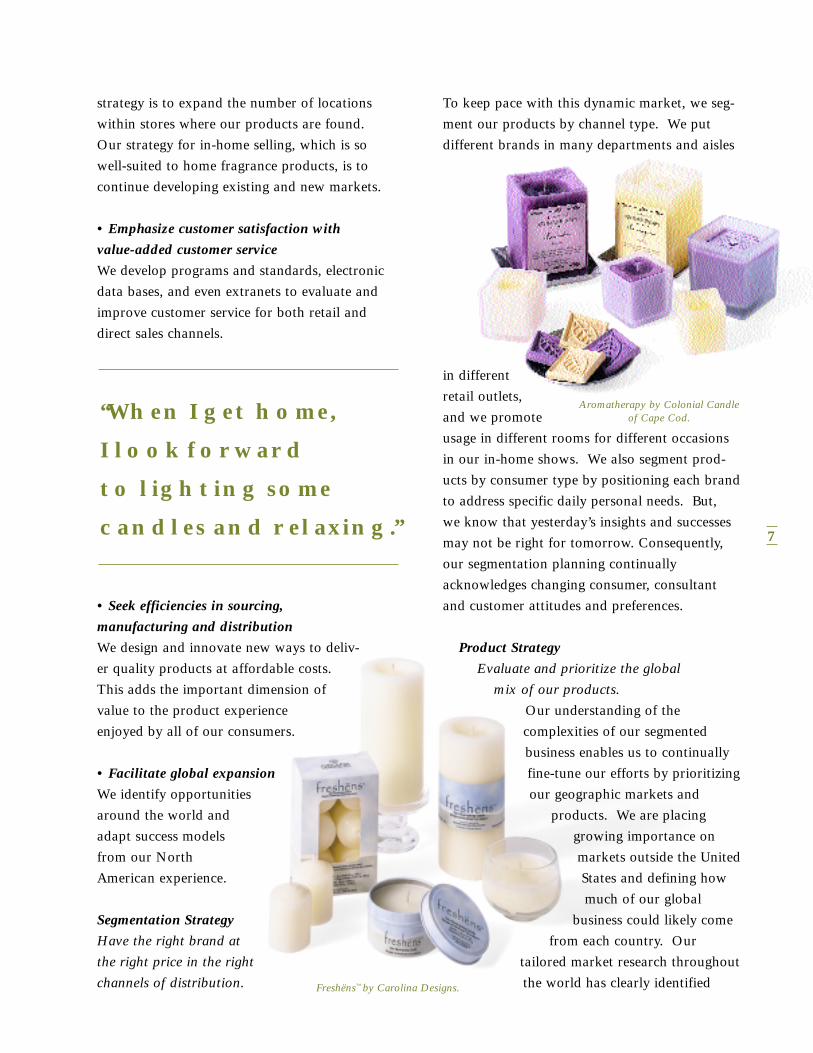
Aromatherapy by Colonial Candle of Cape Cod.

fragranced consumer products as more
important today than ever before.
Learning Strategy
Commit to knowledge-based
decision-making.
As our market becomes
more dynamic and complex,
an expanded base of
knowledge contributes to
our achievement of growth
goals. We use five factors
in defining the areas of
knowledge which provide
the most return:
• Market Change
We believe in creating
change and are not satisfied
watching change take place. But we try to
create change at our own pace. We influence
change through continuous yet incremental
growth that relies more on consistent
performance and less on dramatic
peaks and valleys.
• Our Consumers
We know attitudes and behavior
have changed dramatically
in the last five years, and
believe they will continue
to do so. To achieve
brand success, we will
further our understanding
of the how’s and why’s
of home fragrance
trends, particularly for
fragranced candles.Herb Collection by Colony.

9
• Our Customers
As profit pressures mount per square foot,
our customers look to us to enhance their
performance with new products that
complement their strategies and address
their shoppers’ needs.
• Our Sales Consultants
With candles as the most important home
fragrance delivery vehicle, our sales consultants,
hostesses and their in-home party guests want
us to create new products that bring energy
and ambiance throughout their homes.
• Our Team
Our seasoned management team has
evolved from within the company,
through acquisitions and from
outside recruitment. Each member
appreciates the importance of
knowledge in building success,
especially as the market,
our customers, our sales
consultants and their
consumers continue
to modify and change
their needs and
demands. Each
member also brings
special knowledge from
her or his own experiences.
SUCCESS MUST BE ACHIEVED EVERY DAYEvery day, our consumers remind us that our
home fragrance products are everyday staples in
their homes.
Every day, our
retail customers
remind us they want
the right brand for
the right audience at
the right price in the
right location in their stores.
Every day, our direct sales consultants remind
us consumers are always looking for new and
imaginative ways to use our products.
Every day, we remind ourselves
that new learning is needed to
create and implement the
best strategies and tactics.
Our business is an every
day business because
consumers burn
candles every day.
We manage our
business every day
knowing this.
Tea Collection by Colonial Candle of Cape Cod.
Pillars, classic tapers
and related accessories
by PartyLite.
“With so many new
scents, I can create a
different experience
in each room.”
10
INDEX TO FINANCIAL REVIEW
Selected Consolidated 11
Financial Data
Management’s Discussion 12
and Analysis
Consolidated Balance Sheets 19
Consolidated Statements 20
of Earnings
Consolidated Statements of 20
Stockholders’ Equity
Consolidated Statements 21
of Cash Flows
Notes to Consolidated 22
Financial Statements
Report of Independent 32
Accountants
Report of Independent 33
Certified Public Accountants
Directors and Officers 34
Shareholder Information 35
11
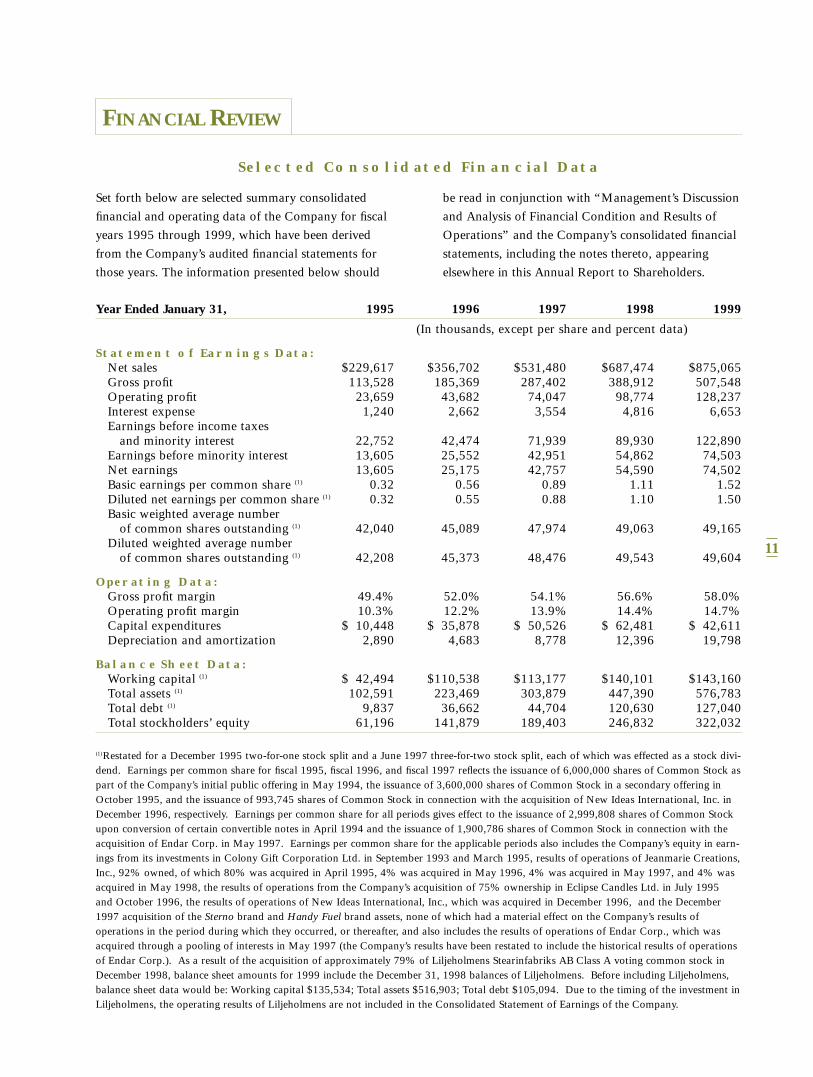
Year Ended January 31, 1995 1996 1997 1998 1999
(In thousands, except per share and percent data)
Statement of Earnings Data:Net sales $229,617 $356,702 $531,480 $687,474 $875,065Gross profit 113,528 185,369 287,402 388,912 507,548Operating profit 23,659 43,682 74,047 98,774 128,237Interest expense 1,240 2,662 3,554 4,816 6,653Earnings before income taxes
and minority interest 22,752 42,474 71,939 89,930 122,890Earnings before minority interest 13,605 25,552 42,951 54,862 74,503Net earnings 13,605 25,175 42,757 54,590 74,502Basic earnings per common share (1) 0.32 0.56 0.89 1.11 1.52Diluted net earnings per common share (1) 0.32 0.55 0.88 1.10 1.50Basic weighted average number
of common shares outstanding (1) 42,040 45,089 47,974 49,063 49,165Diluted weighted average number
of common shares outstanding (1) 42,208 45,373 48,476 49,543 49,604
Operating Data:Gross profit margin 49.4% 52.0% 54.1% 56.6% 58.0% Operating profit margin 10.3% 12.2% 13.9% 14.4% 14.7%Capital expenditures $ 10,448 $ 35,878 $ 50,526 $ 62,481 $ 42,611Depreciation and amortization 2,890 4,683 8,778 12,396 19,798
Balance Sheet Data:Working capital (1) $ 42,494 $110,538 $113,177 $140,101 $143,160Total assets (1) 102,591 223,469 303,879 447,390 576,783Total debt (1) 9,837 36,662 44,704 120,630 127,040Total stockholders’ equity 61,196 141,879 189,403 246,832 322,032
Selected Consolidated Financial Data
FINANCIAL REVIEW
Set forth below are selected summary consolidated
financial and operating data of the Company for fiscal
years 1995 through 1999, which have been derived
from the Company’s audited financial statements for
those years. The information presented below should
be read in conjunction with “Management’s Discussion
and Analysis of Financial Condition and Results of
Operations” and the Company’s consolidated financial
statements, including the notes thereto, appearing
elsewhere in this Annual Report to Shareholders.
(1)Restated for a December 1995 two-for-one stock split and a June 1997 three-for-two stock split, each of which was effected as a stock divi-dend. Earnings per common share for fiscal 1995, fiscal 1996, and fiscal 1997 reflects the issuance of 6,000,000 shares of Common Stock aspart of the Company’s initial public offering in May 1994, the issuance of 3,600,000 shares of Common Stock in a secondary offering inOctober 1995, and the issuance of 993,745 shares of Common Stock in connection with the acquisition of New Ideas International, Inc. inDecember 1996, respectively. Earnings per common share for all periods gives effect to the issuance of 2,999,808 shares of Common Stockupon conversion of certain convertible notes in April 1994 and the issuance of 1,900,786 shares of Common Stock in connection with theacquisition of Endar Corp. in May 1997. Earnings per common share for the applicable periods also includes the Company’s equity in earn-ings from its investments in Colony Gift Corporation Ltd. in September 1993 and March 1995, results of operations of Jeanmarie Creations,Inc., 92% owned, of which 80% was acquired in April 1995, 4% was acquired in May 1996, 4% was acquired in May 1997, and 4% wasacquired in May 1998, the results of operations from the Company’s acquisition of 75% ownership in Eclipse Candles Ltd. in July 1995and October 1996, the results of operations of New Ideas International, Inc., which was acquired in December 1996, and the December1997 acquisition of the Sterno brand and Handy Fuel brand assets, none of which had a material effect on the Company’s results of operations in the period during which they occurred, or thereafter, and also includes the results of operations of Endar Corp., which wasacquired through a pooling of interests in May 1997 (the Company’s results have been restated to include the historical results of operationsof Endar Corp.). As a result of the acquisition of approximately 79% of Liljeholmens Stearinfabriks AB Class A voting common stock inDecember 1998, balance sheet amounts for 1999 include the December 31, 1998 balances of Liljeholmens. Before including Liljeholmens,balance sheet data would be: Working capital $135,534; Total assets $516,903; Total debt $105,094. Due to the timing of the investment inLiljeholmens, the operating results of Liljeholmens are not included in the Consolidated Statement of Earnings of the Company.
12
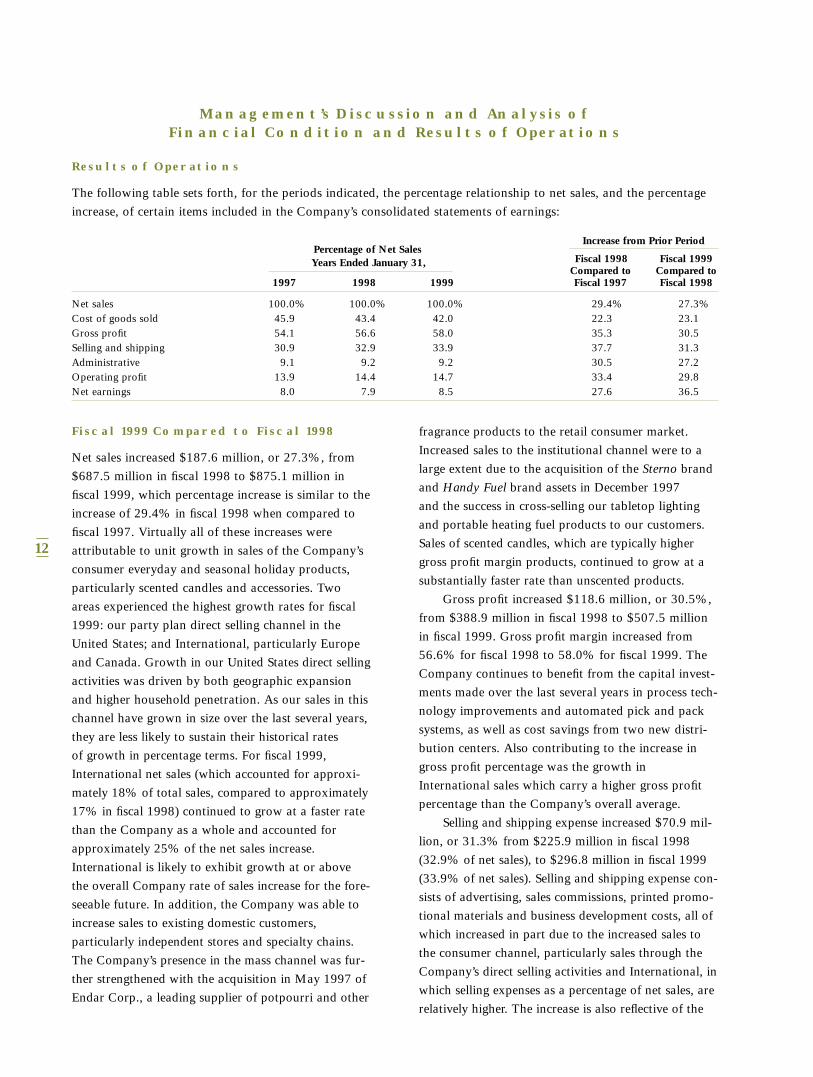
Results of Operations
The following table sets forth, for the periods indicated, the percentage relationship to net sales, and the percentage
increase, of certain items included in the Company’s consolidated statements of earnings:
Percentage of Net SalesIncrease from Prior Period
Years Ended January 31, Fiscal 1998 Fiscal 1999Compared to Compared to
1997 1998 1999 Fiscal 1997 Fiscal 1998
Net sales 100.0% 100.0% 100.0% 29.4% 27.3%Cost of goods sold 45.9 43.4 42.0 22.3 23.1Gross profit 54.1 56.6 58.0 35.3 30.5Selling and shipping 30.9 32.9 33.9 37.7 31.3Administrative 9.1 9.2 9.2 30.5 27.2Operating profit 13.9 14.4 14.7 33.4 29.8Net earnings 8.0 7.9 8.5 27.6 36.5
Management’s Discussion and Analysis of Financial Condition and Results of Operations
Fiscal 1999 Compared to Fiscal 1998
Net sales increased $187.6 million, or 27.3%, from
$687.5 million in fiscal 1998 to $875.1 million in
fiscal 1999, which percentage increase is similar to the
increase of 29.4% in fiscal 1998 when compared to
fiscal 1997. Virtually all of these increases were
attributable to unit growth in sales of the Company’s
consumer everyday and seasonal holiday products,
particularly scented candles and accessories. Two
areas experienced the highest growth rates for fiscal
1999: our party plan direct selling channel in the
United States; and International, particularly Europe
and Canada. Growth in our United States direct selling
activities was driven by both geographic expansion
and higher household penetration. As our sales in this
channel have grown in size over the last several years,
they are less likely to sustain their historical rates
of growth in percentage terms. For fiscal 1999,
International net sales (which accounted for approxi-
mately 18% of total sales, compared to approximately
17% in fiscal 1998) continued to grow at a faster rate
than the Company as a whole and accounted for
approximately 25% of the net sales increase.
International is likely to exhibit growth at or above
the overall Company rate of sales increase for the fore-
seeable future. In addition, the Company was able to
increase sales to existing domestic customers,
particularly independent stores and specialty chains.
The Company’s presence in the mass channel was fur-
ther strengthened with the acquisition in May 1997 of
Endar Corp., a leading supplier of potpourri and other
fragrance products to the retail consumer market.
Increased sales to the institutional channel were to a
large extent due to the acquisition of the Sterno brand
and Handy Fuel brand assets in December 1997
and the success in cross-selling our tabletop lighting
and portable heating fuel products to our customers.
Sales of scented candles, which are typically higher
gross profit margin products, continued to grow at a
substantially faster rate than unscented products.
Gross profit increased $118.6 million, or 30.5%,
from $388.9 million in fiscal 1998 to $507.5 million
in fiscal 1999. Gross profit margin increased from
56.6% for fiscal 1998 to 58.0% for fiscal 1999. The
Company continues to benefit from the capital invest-
ments made over the last several years in process tech-
nology improvements and automated pick and pack
systems, as well as cost savings from two new distri-
bution centers. Also contributing to the increase in
gross profit percentage was the growth in
International sales which carry a higher gross profit
percentage than the Company’s overall average.
Selling and shipping expense increased $70.9 mil-
lion, or 31.3% from $225.9 million in fiscal 1998
(32.9% of net sales), to $296.8 million in fiscal 1999
(33.9% of net sales). Selling and shipping expense con-
sists of advertising, sales commissions, printed promo-
tional materials and business development costs, all of
which increased in part due to the increased sales to
the consumer channel, particularly sales through the
Company’s direct selling activities and International, in
which selling expenses as a percentage of net sales, are
relatively higher. The increase is also reflective of the
13
continued investment in marketing and product
development costs in support of existing and new
account and new country development.
Administrative expense increased $17.2 million,
or 27.2%, from $63.3 million in fiscal 1998 (9.2% of
net sales) to $80.5 million in fiscal 1999 (9.2% of net
sales). Such increases were partially a result of increases
in personnel (from approximately 451 administrative
employees at January 31, 1998 to approximately 492
administrative employees at January 31, 1999). The
Company expects increases in investment in infrastruc-
ture to support International sales growth and
continued spending associated with improvements
in information and administrative support systems
including Year 2000 related expenses. See “Year
2000 Compliance” below.
Interest expense increased $1.9 million, or
39.6%, from $4.8 million in fiscal 1998 to $6.7
million in fiscal 1999. Such increase was attributable
to increased borrowing to fund working capital
requirements, capital expenditures and long term
investments. Borrowing at the end of fiscal 1998 to
acquire the Sterno brand and Handy Fuel brand
assets also contributed to the increased interest
expense during fiscal 1999.
Income tax expense increased $13.3 million, or
38.0%, from $35.1 million in fiscal 1998 to $48.4
million in fiscal 1999. The effective income tax rate
remained at approximately 39% for fiscal 1999.
As a result of the foregoing, net earnings
increased $19.9 million, or 36.5%, from $54.6 mil-
lion in fiscal 1998 to $74.5 million in fiscal 1999.
Basic earnings per share based upon the weighted
average number of shares outstanding were $1.52
compared to $1.11 for the same period last year.
Diluted earnings per share based upon the potential
dilution that could occur if options to issue common
stock were exercised or converted were $1.50
compared to $1.10 for the same period last year.
Fiscal 1998 Compared to Fiscal 1997
Net sales increased $156.0 million, or 29.4%, from
$531.5 million in fiscal 1997 to $687.5 million in fiscal
1998. Virtually all of these increases were attributable to
unit growth in sales of the Company’s consumer everyday
Management’s Discussion and Analysis of Financial Condition and Results of Operations
and seasonal holiday products, particularly scented can-
dles and accessories. In particular, two areas experienced
the highest growth rate for fiscal 1998: our party plan
direct seller in the United States; and International, partic-
ularly Europe and Canada. Several factors contributed to
the increase in unit sales. The increase in sales to new
domestic customers was attributable to improved pene-
tration of select channels of distribution and to geograph-
ic expansion in the United States, particularly by the
Company’s direct selling activities. International sales,
including sales in Canada, grew at a faster rate than the
Company as a whole, and accounted for approximately
25% of the net sales increase. International sales account-
ed for approximately 17% of the total net sales for fiscal
1998. The Company’s results were restated to include the
historical results of operations of Endar Corp. (which
was acquired in a pooling of interests transaction in May
1997). The acquisition of the Sterno brand and Handy
Fuel brand assets on December 31, 1997 did not have a
material impact on the Company’s results of operations.
Sales of scented candles, which are typically higher gross
profit margin products, also continued to grow at a sub-
stantially faster rate than unscented products.
Gross profit increased $101.5 million, or 35.3%,
from $287.4 million in fiscal 1997 to $388.9 million in
fiscal 1998. Gross profit margin increased from 54.1%
for fiscal 1997 to 56.6% for fiscal 1998. Such increases
were due, in substantial part, to the continued increased
direct sales of the Company’s products, such as scented
candles and candle accessories; these products generally
carry higher gross profit margins than other of the
Company’s products. The increase in gross profit mar-
gin was also attributable to increased international sales
and to cost savings from the recent implementation of
two automated pick and pack systems, which have
lower operational costs than the manual processes his-
torically used. As in fiscal 1997, the Company experi-
enced cost benefits from continuing capital investments
in process and technology improvements.
Selling and shipping expense increased $61.9 mil-
lion, or 37.7%, from $164.0 million in fiscal 1997
(30.9% of net sales), to $225.9 million in fiscal 1998
(32.9% of net sales). Selling and shipping expense con-
sists of advertising, sales commissions, printed promo-
tional materials and business development costs, all of
which was higher due to increased sales to the consumer

14
channel, particularly sales through the Company’s direct
selling activities in which sales expenses, as a percentage
of sales, are relatively higher. In addition, the
Company’s consumer products generally require a high-
er level of product development and sales and market-
ing expense than the Company’s institutional products.
Finally, the increase in selling and shipping expense as a
percentage of net sales was also attributable, in part, to
bad debt write-offs of $2.1 million (principally related
to the bankruptcy of one customer) and to non-recur-
ring one-time costs incurred during and after the United
Parcel Service strike of approximately $2.0 million.
Administrative expense increased $14.8 million, or
30.5%, from $48.5 million in fiscal 1997 (9.1% of net
sales) to $63.3 million in fiscal 1998 (9.2% of net
sales). Such increases were a result of increases in per-
sonnel (from approximately 388 administrative
employees at January 31, 1997 to approximately 451
administrative employees at January 31, 1998) and the
incurrence of approximately $1.1 million in transition
expenses due to the shutdown of duplicative facilities.
Endar Corp. incurred one-time, non-recurring
transaction costs of approximately $5.2 million prior
to its acquisition by the Company. These one-time,
non-recurring transaction costs consisted of a non-cash
exercise of options, payment of bonuses and payment
of legal and professional fees.
Interest expense increased $1.2 million, or 33.3%,
from $3.6 million in fiscal 1997 to $4.8 million in fiscal
1998. Such increase was attributable to increased bor-
rowing to fund working capital requirements, capital
expenditures and the acquisition of the Sterno brand
and Handy Fuel brand assets.
Income tax expense increased $6.1 million, or
21.0%, from $29.0 million in fiscal 1997 to $35.1
million in fiscal 1998. The effective income tax rate
decreased from approximately 40.0% for fiscal 1997 to
approximately 39.0% for fiscal 1998 due to growth in
sales in countries with lower tax rates than U.S. tax rates.
As a result of the foregoing, net earnings increased
$11.8 million, or 27.6%, from $42.8 million in fiscal
1997 to $54.6 million in fiscal 1998. Excluding the one-
time non-recurring transaction costs incurred by Endar
prior to the date of acquisition, the net earnings for fis-
cal 1998 increased 35.1% compared to the prior year.
Management’s Discussion and Analysis of Financial Condition and Results of Operations
Basic earnings per share based upon the weighted
average number of shares outstanding were $1.11 com-
pared to $0.89 for the same period last year. Diluted
earnings per share based upon the potential dilution
that could occur if options to issue common stock were
exercised or converted were $1.10 compared to $0.88
for the same period last year. Earnings per share have
been restated for a 3-for-2 stock split effected as a stock
dividend in June 1997 and to include the shares issued
in connection with the acquisition of Endar Corp.
Seasonality
Approximately 44% of the Company’s annual net
sales typically occur in the first and second fiscal
quarters of the fiscal year, with the larger balance
experienced in the third and fourth fiscal quarters,
generally due to consumer buying patterns. The
Company’s net sales are strongest in the third and
fourth fiscal quarters due to increased shipments to
meet year-end holiday season demand for the
Company’s products. In addition, during the third and
fourth fiscal quarters, the mix of products shipped by
the Company shifts to a greater percentage of
higher gross profit margin products. Operating profit
largely follows these patterns, although a somewhat
larger portion of the Company’s annual operating
profit is earned in the second half of the fiscal year.
Liquidity and Capital Resources
Operating assets and liabilities increased from January
31, 1998 to January 31, 1999 due to the Company’s
internally generated growth and from the Company’s
investment in Liljeholmens Stearinfabriks AB
(“Liljeholmens”) Class A voting common stock, as
described below. Inventory increased from $135.5
million at January 31, 1998 to $169.7 million at
January 31, 1999. Approximately $17.4 million of
this $34.2 million increase was due to the inclusion of
the Liljeholmens inventory while the balance of the
increase was attributable to increases to meet antici-
pated demand. The Company’s percentage increase in
sales (27.3%) was significantly greater than the per-
centage increase in inventory (12.4% excluding
Liljeholmens) during fiscal 1999. Accounts receivable
increased $8.8 million from $52.0 million at the end
15
of fiscal 1998 to $60.8 million at the end of fiscal
1999. Excluding the Liljeholmens accounts receivable
of $9.5 million, accounts receivable was $51.3 million
at January 31, 1999. Accounts payable and accrued
expenses increased $26.7 million ($9.3 million exclud-
ing Liljeholmens) from $68.7 million at the end of fis-
cal 1998 to $95.4 million ($78.0 million excluding
Liljeholmens) at the end of fiscal 1999. Except for the
inclusion of Liljeholmens amounts, the changes in
accounts receivable and in accounts payable and
accrued expenses reflect normal seasonal fluctuations
and normal payment patterns of operating expenses.
The Company’s outstanding balance under its
revolving credit facility at January 31, 1999 is
attributable to working capital requirements, capital
expenditures, the investment in Liljeholmens and
other long term investments.
Capital expenditures for property, plant and
equipment were $42.6 million in fiscal 1999. The
Company anticipates total capital spending of
approximately $60.0 million for fiscal 2000, which
will be used primarily for increased manufacturing
and distribution capacity, upgrades to machinery and
equipment in existing facilities, and computer hard-
ware and software.
The Company has grown in part through acquisi-
tions and, as part of its growth strategy, the Company
expects to continue from time to time in the ordinary
course of its business to evaluate and pursue acquisi-
tion opportunities as appropriate. In the future, acqui-
sitions may contribute more to the overall Company’s
sales growth rate than historically. This could be in
the form of acquiring other companies, selected assets
and product lines, long term investments, and/or joint
ventures that either complement or expand its existing
business. In December, 1998 the Company acquired
an approximately 39% economic interest and 79%
voting interest in Liljeholmens, a leading European
candle manufacturer based in Sweden, in a
private sale.
Pursuant to the Company’s revolving credit facili-
ty (“Credit Facility”), which matures on October 17,
2002, the lending institutions have agreed, subject to
certain conditions, to provide an unsecured revolving
credit facility to the Company in an aggregate amount
of up to $140.0 million and to provide, under certain
Management’s Discussion and Analysis of Financial Condition and Results of Operations
circumstances, an additional $35.0 million. Amounts
outstanding under the Credit Facility bear interest, at
the Company’s option, at Bank of America’s prime
rate (7.75% at January 31, 1999) or at the
Eurocurrency rate plus a credit spread ranging from
0.25% to 0.50%, based on a pre-defined financial
ratio, for a weighted average interest rate of 5.28% at
January 31, 1999. At January 31, 1999, $76.7 million
(including outstanding letters of credit) was outstand-
ing under the Credit Facility.
In August 1998 and January 1999 the Company
entered into agreements with four banks to provide
uncommitted one year lines of credit with total avail-
able borrowing of $75.0 million. Borrowings under
the agreements bear interest, at the Company’s option,
at short term fixed rates, at the banks’ prime rate
(7.75% at January 31, 1999) or at the Eurocurrency
rate plus a credit spread, for a weighted average inter-
est rate of approximately 5.18% at January 31, 1999.
There was $1.7 million outstanding under the uncom-
mitted lines of credit at January 31, 1999.
Liljeholmens has a line of credit which is renewed
annually, with available borrowing of approximately
$31.0 million. As of December 31, 1998 Liljeholmens
had borrowings under the line of credit of approximate-
ly $1.8 million. Amounts outstanding under the line of
credit bear interest at 3.75% at December 31, 1998.
At December 31, 1998, Liljeholmens had various
long-term debt agreements in multiple European cur-
rencies maturing at different dates over the next two
to six years. The total amount outstanding as of
December 31, 1998 under the loan agreements was
approximately $20.2 million with interest rates rang-
ing from 3.95% to 8.46%, of which $14.6 million
relates to the credit facility. The loans are collateral-
ized by certain of Liljeholmens’ real estate and by
Liljeholmens’ shares in its subsidiaries.
Net cash provided by operating activities amount-
ed to $87.4 million in fiscal 1999 compared to $43.6
million in fiscal 1998, an improvement of $43.8 mil-
lion. Subsequent to January 31, 1999, the Company
has continued to purchase common stock on the open
market as part of its stock repurchase program. As of
March 31, 1999, a total of approximately 500,000
shares have been repurchased.
16
The Company’s primary capital requirements are
for working capital to fund the increased inventory
and accounts receivable to sustain the Company’s
sales growth and for capital expenditures. The
Company is building its inventory to meet increased
demand. The Company believes that its cash from
operations and available borrowings under the Credit
Facility, uncommitted lines of credit and the
Liljeholmens line of credit will be sufficient to fund its
operating requirements, capital expenditures, the
Company’s stock repurchase program and all other
obligations for fiscal 2000 and fiscal 2001.
Quantitative and QualitativeDisclosures About Market Risk
Interest Rate RiskAs of March 31, 1999, the Company is subject to
interest rate risk on approximately $97.0 million of
variable rate debt, including Liljeholmens. The
majority of the Company’s variable rate debt,
approximately $74.9 million at January 31, 1999,
bears interest at the bank’s prime rate (7.75% at
January 31, 1999) or at the Eurocurrency rate plus
a credit spread ranging from 0.25% to 0.50%. Each
1.00% increase in the interest rate would impact
pre-tax earnings by approximately $970,000 if
applied to the total.
Foreign Currency RiskThe Company uses forward foreign exchange
contracts to hedge the impact of foreign currency fluc-
tuations on certain committed capital expenditures,
Canadian intercompany payables and on certain inter-
company loans. The Company does not hold or issue
derivative financial instruments for trading purposes.
With regard to commitments for machinery and
equipment in foreign currencies, upon payment of
each commitment the underlying forward contract is
closed and the corresponding gain or loss is included
in the measurement of the cost of the acquired asset.
With regard to forward exchange contracts used to
hedge Canadian intercompany payables, gain or loss
on such hedges is recognized in earnings in the period
in which the underlying hedged transaction occurs.
With regard to cross-currency forward contracts relat-
ed to certain intercompany loans, gain or loss on such
Management’s Discussion and Analysis of Financial Condition and Results of Operations
contracts is recognized into earnings in the period in
which the debt is repaid. If a hedging instrument is
sold or terminated prior to maturity, gains and losses
are deferred until the hedged item is settled. However,
if the hedged item is no longer likely to occur, the
resultant gain or loss on the terminated hedge is rec-
ognized into earnings. For consolidated financial
statement presentation, net cash flows from such
hedges are classified in the categories of the cash flow
with the items being hedged.
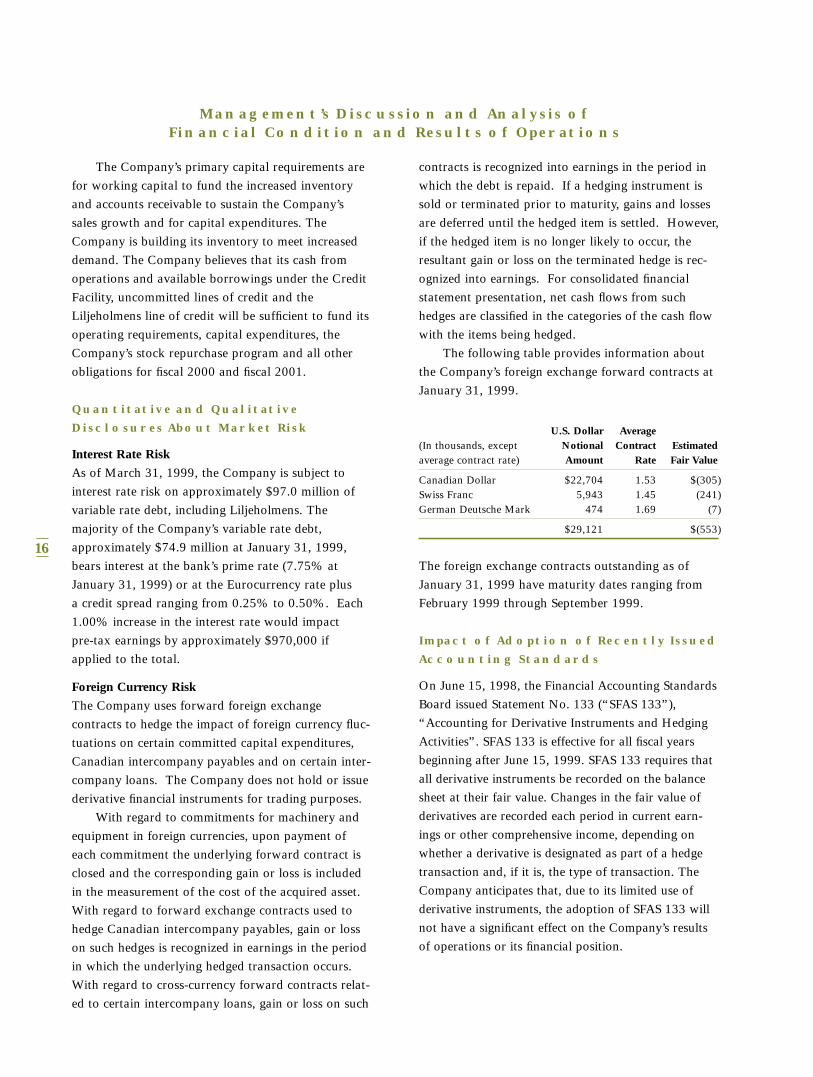
The following table provides information about
the Company’s foreign exchange forward contracts at
January 31, 1999.
U.S. Dollar Average(In thousands, except Notional Contract Estimatedaverage contract rate) Amount Rate Fair Value
Canadian Dollar $22,704 1.53 $(305)Swiss Franc 5,943 1.45 (241)German Deutsche Mark 474 1.69 (7)
$29,121 $(553)
The foreign exchange contracts outstanding as of
January 31, 1999 have maturity dates ranging from
February 1999 through September 1999.
Impact of Adoption of Recently IssuedAccounting Standards
On June 15, 1998, the Financial Accounting Standards
Board issued Statement No. 133 (“SFAS 133”),
“Accounting for Derivative Instruments and Hedging
Activities”. SFAS 133 is effective for all fiscal years
beginning after June 15, 1999. SFAS 133 requires that
all derivative instruments be recorded on the balance
sheet at their fair value. Changes in the fair value of
derivatives are recorded each period in current earn-
ings or other comprehensive income, depending on
whether a derivative is designated as part of a hedge
transaction and, if it is, the type of transaction. The
Company anticipates that, due to its limited use of
derivative instruments, the adoption of SFAS 133 will
not have a significant effect on the Company’s results
of operations or its financial position.
17
Year 2000 Compliance
The "Year 2000 Issue" is the result of computer pro-
grams that were written using two digits rather than
four digits to define the applicable year. If the
Company’s computer programs with date-sensitive
functions are not Year 2000 compliant, they may rec-
ognize a date using "00" as the Year 1900 rather than
the Year 2000. This could result in miscalculations,
malfunctions or disruptions when attempting to
process information containing dates that fall after
December 31, 1999 or other dates which could cause
computer malfunctions.
Recognizing the importance of the "Year 2000
Issue" the Company began developing a Year 2000 com-
pliance plan in fiscal 1997. The Company’s efforts have
been focused on the elements that are believed to be criti-
cal to business operations ("mission critical"), which
includes: (a) an assessment, and where needed, a remedi-
ation, of both information technology ("IT") and non-IT
elements of its business information, computing, telecom-
munications, and process control systems, (b) an assess-
ment, and remediation, as necessary, of equipment with
embedded chips, and (c) an evaluation of the Company’s
relationships with significant product and services
providers and major customers ("key business partners").
The compliance plan contains five components as
follows: (1) Internal assessment - a detailed evaluation
of the potential Year 2000 effects on the Company’s IT
and non-IT systems and on its equipment with embed-
ded computer chips, (2) Remediation - corrective action
including code enhancements, hardware and software
upgrades, system replacements, vendor certification,
equipment repair or replacement, and other associated
changes to achieve Year 2000 compliance, (3) Testing -
the verification that remediation actions are effective
and that systems currently deemed compliant in fact are
compliant, (4) Third party evaluation - an evaluation of
the Year 2000 readiness of key suppliers of goods and
services and of key customers, and (5) Contingency
planning - the development of detailed procedures to be
put in place should the Company or key business part-
ners experience a significant Year 2000 problem.
Although we believe the above is a sound plan, there
can be no assurances that this process will identify or
remediate all of the existing Year 2000 exposures.
Management’s Discussion and Analysis of Financial Condition and Results of Operations
The assessment phase is near completion. The
remediation process is substantially complete on critical
IT and non-IT systems, and the Company presently
anticipates that remediation and testing of remaining sys-
tems will be complete by April 30, 1999. The testing
phase, which is done in most instances using simulated
data, is well underway on critical IT and non-IT systems,
and the Company expects to complete, in all material
respects, testing of internal systems by July 31, 1999.
The third party evaluation phase is underway with
the Company having identified its key business part-
ners, and is in the process of ascertaining their stage of
Year 2000 readiness through questionnaires, interviews,
on-site visits, and other available means. However, the
actual readiness of these third parties is beyond the
Company’s control; therefore, there can be no assur-
ances that significant deficiencies do not exist amongst
such third parties. The Company expects to complete,
in all material respects, the third party evaluation phase
by April 30, 1999.
If needed modifications and conversions of com-
puter systems are not made on a timely basis by the
Company or its key business partners, the Company
could be affected by business disruption, operational
problems, and financial loss, any of which could have a
material adverse effect on the Company’s results of
operations, and consolidated financial position.
Although not anticipated, the most reasonably likely
worst case scenario of failure by the Company or its key
business partners to resolve the Year 2000 issue would be
a short-term slowdown or cessation of manufacturing
operations at one or more of the Company’s facilities,
and a short-term inability on the part of the Company to
process orders and billings in a timely manner and to
deliver product to customers in a timely manner.
In addition to the readiness measures described
above, the Company intends to mitigate, through the
development of contingency plans as deemed appropri-
ate, the possible disruption in business operations that
may result from the Year 2000 issue. Contingency plans
may include stockpiling raw materials, increasing fin-
ished goods inventory levels, securing alternate sources
of supply, and other appropriate measures.
Once developed, contingency plans and related
cost estimates will be continually refined as additional
information becomes available. The Company intends
18
to complete the development of its contingency plans,
in all material respects, by the end of July, 1999.
It is currently estimated that the aggregate cost of
the Company’s Year 2000 compliance efforts will be
approximately $3.0 million, of which approximately
$2.0 million has been spent. These costs are being
expensed as they are incurred except for costs associated
with the replacement of computerized systems, hardware
or equipment, substantially all of which will be capital-
ized, and are being funded through operating cash flow.
These amounts do not include any costs associated with
the implementation of contingency plans. The Company
anticipates that substantially all of the costs associated
with the Company’s Year 2000 compliance efforts
(exclusive of the costs of implementation of contingency
plans) will be expensed. The costs associated with the
Company’s Year 2000 compliance efforts are not expect-
ed to be material in relation to the Company’s IT budget,
and such efforts are not expected to have a material
effect upon the Company’s other IT projects.
While the Company does not expect that it will
have any need to obtain independent verification of its
risk or cost estimates, it should be recognized that the
risk and cost estimates herein constitute forward-look-
ing statements and are based solely on management’s
best estimates of future events. The Company’s Year
2000 compliance plan is an ongoing process and the
estimates of costs and completion dates for various
components of the Year 2000 compliance plan
described above are subject to change; therefore actual
costs could vary significantly from those currently
anticipated and there can be no guarantees regarding
the timing or effectiveness of plan completion.
European Monetary Union — Euro
On January 1, 1999, several member countries of the
European Union established fixed conversion rates
between their existing sovereign currencies, and adopt-
ed the Euro as their new common legal currency. Since
that date, the Euro has been traded on currency
exchanges while at the same time the legacy currencies
remain legal tender in the participating countries during
a transition period from January 1, 1999 through
January 1, 2001.
Management’s Discussion and Analysis of Financial Condition and Results of Operations
During the transition period, cashless payments
can be made in the Euro, and parties can elect to pay
for goods and services and transact business using
either the Euro or a legacy currency.
Between January 1, 2002 and July 1, 2002, the
participating countries will introduce Euro notes and
coins and withdraw all legacy currencies so that they
will no longer be available.
The Company began assessing the effect of the
Euro’s introduction in late 1997. The Company
believes that its business and financial systems are
capable of handling the conversion to the Euro. Testing
of transactions processed using the new Euro currency
has not yet been completed. The Euro conversion may
affect cross-border competition by creating cross-bor-
der price transparency. The Company is assessing its
pricing/marketing strategy in order to insure that it
remains competitive in a broader European market.
The Company will continue to evaluate issues involving
introduction of the Euro. Based on current information
and the Company’s current assessment, the Company
does not expect that the Euro conversion will have a
material adverse effect on its business, results of opera-
tions, cash flows or financial condition.
Forward-looking and CautionaryStatements
Certain statements contained in this Annual Report
may constitute forward-looking statements within the
meaning of the Private Securities Litigation Reform Act
of 1995. These statements involve a number of risks,
uncertainties and other factors that could cause actual
results to differ materially, as discussed more fully else-
where in this Annual Report and in the Company’s fil-
ings with the Securities and Exchange Commission,
including the Company’s Form 10-K for fiscal 1999 to
be filed on or about April 28,1999.
19
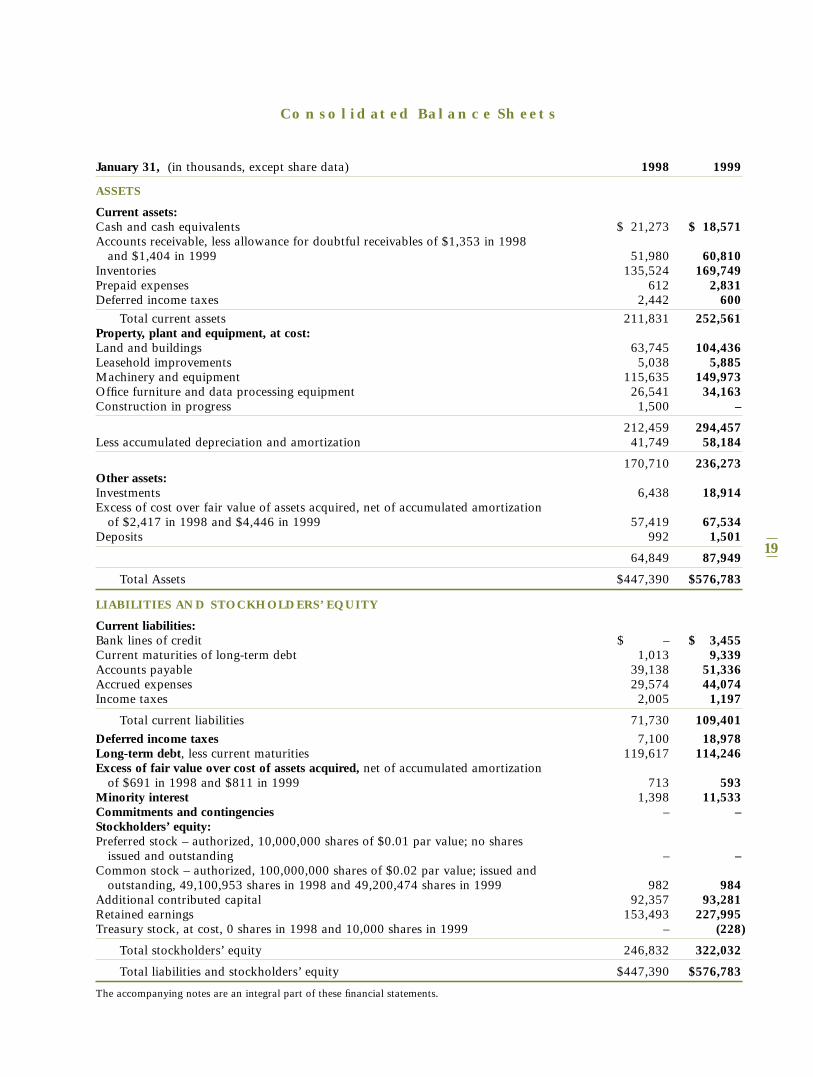
Consolidated Balance Sheets
January 31, (in thousands, except share data) 1998 1999
ASSETS
Current assets:Cash and cash equivalents $ 21,273 $ 18,571Accounts receivable, less allowance for doubtful receivables of $1,353 in 1998
and $1,404 in 1999 51,980 60,810Inventories 135,524 169,749Prepaid expenses 612 2,831Deferred income taxes 2,442 600
Total current assets 211,831 252,561Property, plant and equipment, at cost: Land and buildings 63,745 104,436Leasehold improvements 5,038 5,885Machinery and equipment 115,635 149,973Office furniture and data processing equipment 26,541 34,163Construction in progress 1,500 –
212,459 294,457Less accumulated depreciation and amortization 41,749 58,184
170,710 236,273Other assets: Investments 6,438 18,914Excess of cost over fair value of assets acquired, net of accumulated amortization
of $2,417 in 1998 and $4,446 in 1999 57,419 67,534Deposits 992 1,501
64,849 87,949
Total Assets $447,390 $576,783
LIABILITIES AND STOCKHOLDERS’ EQUITY
Current liabilities: Bank lines of credit $ – $ 3,455Current maturities of long-term debt 1,013 9,339Accounts payable 39,138 51,336Accrued expenses 29,574 44,074Income taxes 2,005 1,197
Total current liabilities 71,730 109,401Deferred income taxes 7,100 18,978Long-term debt, less current maturities 119,617 114,246Excess of fair value over cost of assets acquired, net of accumulated amortization
of $691 in 1998 and $811 in 1999 713 593Minority interest 1,398 11,533Commitments and contingencies – –Stockholders’ equity:Preferred stock – authorized, 10,000,000 shares of $0.01 par value; no shares
issued and outstanding – –Common stock – authorized, 100,000,000 shares of $0.02 par value; issued and
outstanding, 49,100,953 shares in 1998 and 49,200,474 shares in 1999 982 984Additional contributed capital 92,357 93,281Retained earnings 153,493 227,995Treasury stock, at cost, 0 shares in 1998 and 10,000 shares in 1999 – (228)
Total stockholders’ equity 246,832 322,032
Total liabilities and stockholders’ equity $447,390 $576,783
The accompanying notes are an integral part of these financial statements.
20
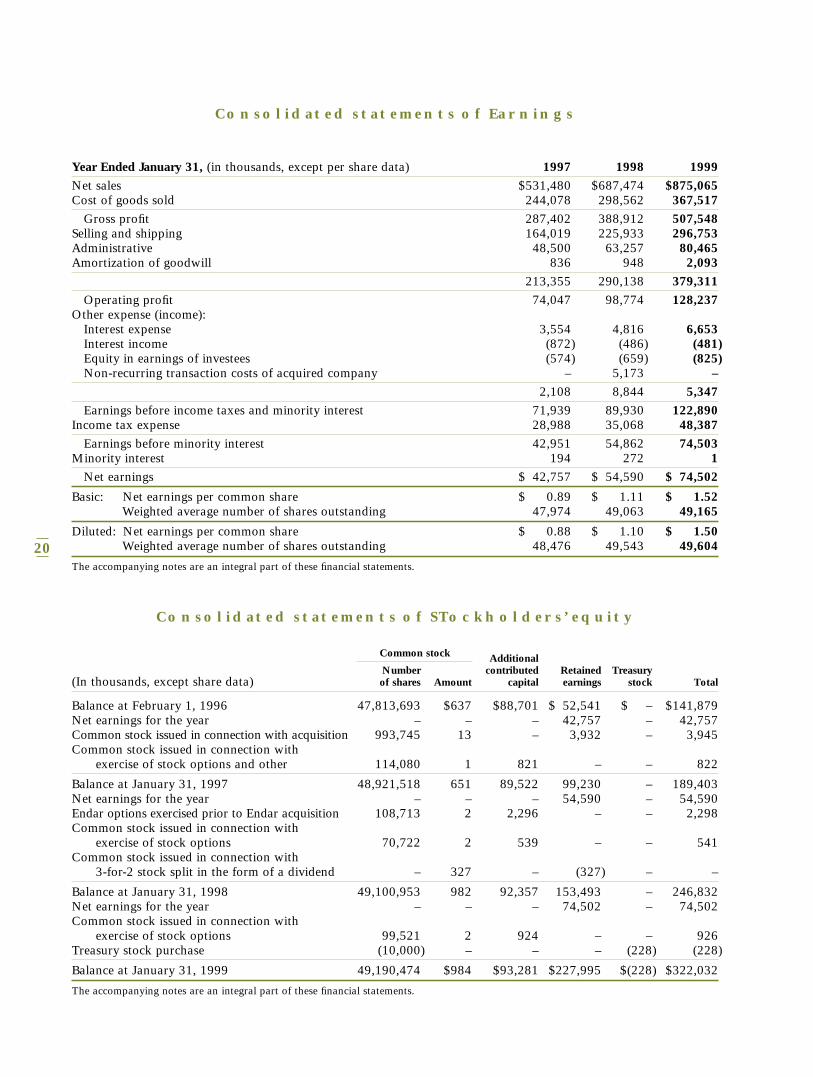
Consolidated statements of Earnings
Year Ended January 31, (in thousands, except per share data) 1997 1998 1999Net sales $531,480 $687,474 $875,065Cost of goods sold 244,078 298,562 367,517
Gross profit 287,402 388,912 507,548Selling and shipping 164,019 225,933 296,753Administrative 48,500 63,257 80,465Amortization of goodwill 836 948 2,093
213,355 290,138 379,311Operating profit 74,047 98,774 128,237
Other expense (income): Interest expense 3,554 4,816 6,653Interest income (872) (486) (481)Equity in earnings of investees (574) (659) (825)Non-recurring transaction costs of acquired company – 5,173 –
2,108 8,844 5,347Earnings before income taxes and minority interest 71,939 89,930 122,890
Income tax expense 28,988 35,068 48,387Earnings before minority interest 42,951 54,862 74,503
Minority interest 194 272 1Net earnings $ 42,757 $ 54,590 $ 74,502
Basic: Net earnings per common share $ 0.89 $ 1.11 $ 1.52Weighted average number of shares outstanding 47,974 49,063 49,165
Diluted: Net earnings per common share $ 0.88 $ 1.10 $ 1.50Weighted average number of shares outstanding 48,476 49,543 49,604
The accompanying notes are an integral part of these financial statements.
Common stock AdditionalNumber contributed Retained Treasury
(In thousands, except share data) of shares Amount capital earnings stock Total
Balance at February 1, 1996 47,813,693 $637 $88,701 $ 52,541 $ – $141,879Net earnings for the year – – – 42,757 – 42,757Common stock issued in connection with acquisition 993,745 13 – 3,932 – 3,945Common stock issued in connection with
exercise of stock options and other 114,080 1 821 – – 822
Balance at January 31, 1997 48,921,518 651 89,522 99,230 – 189,403Net earnings for the year – – – 54,590 – 54,590Endar options exercised prior to Endar acquisition 108,713 2 2,296 – – 2,298Common stock issued in connection with
exercise of stock options 70,722 2 539 – – 541Common stock issued in connection with
3-for-2 stock split in the form of a dividend – 327 – (327) – –
Balance at January 31, 1998 49,100,953 982 92,357 153,493 – 246,832Net earnings for the year – – – 74,502 – 74,502Common stock issued in connection with
exercise of stock options 99,521 2 924 – – 926Treasury stock purchase (10,000) – – – (228) (228)
Balance at January 31, 1999 49,190,474 $984 $93,281 $227,995 $(228) $322,032
The accompanying notes are an integral part of these financial statements.
Consolidated statements of STockholders’ equity
21
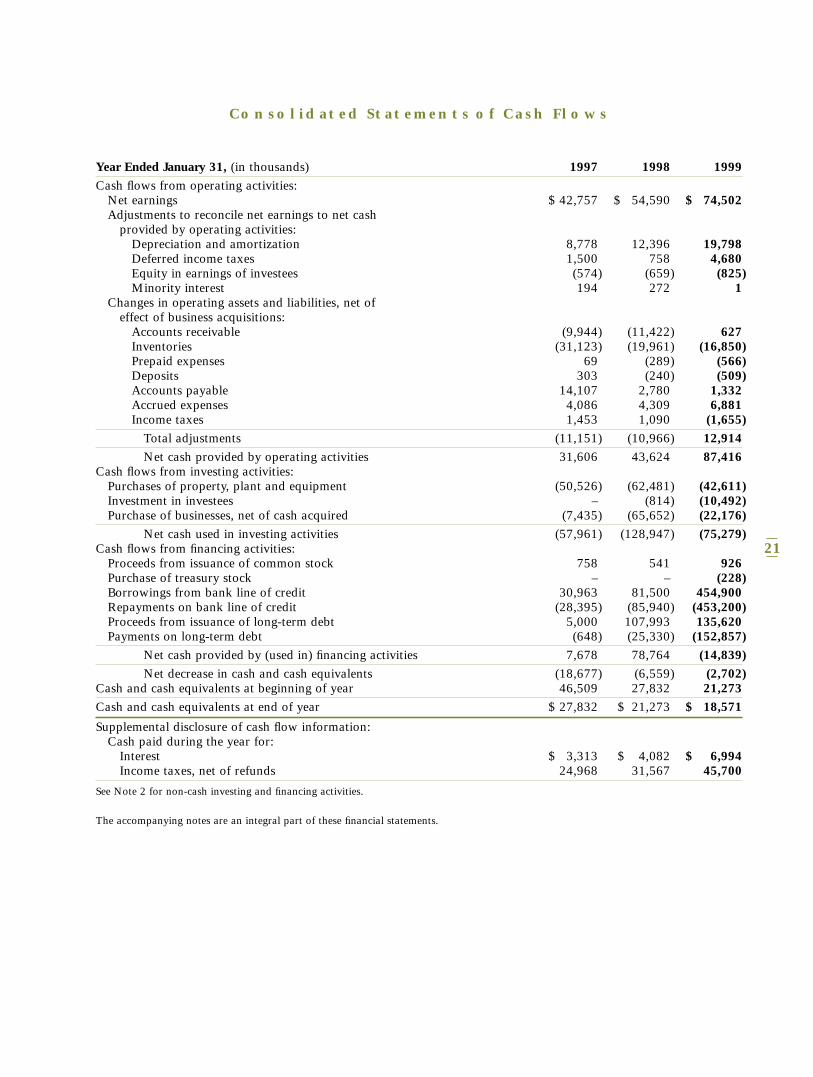
Consolidated Statements of Cash Flows
Year Ended January 31, (in thousands) 1997 1998 1999 Cash flows from operating activities:
Net earnings $ 42,757 $ 54,590 $ 74,502Adjustments to reconcile net earnings to net cash
provided by operating activities:Depreciation and amortization 8,778 12,396 19,798Deferred income taxes 1,500 758 4,680Equity in earnings of investees (574) (659) (825)Minority interest 194 272 1
Changes in operating assets and liabilities, net of effect of business acquisitions:
Accounts receivable (9,944) (11,422) 627Inventories (31,123) (19,961) (16,850)Prepaid expenses 69 (289) (566)Deposits 303 (240) (509) Accounts payable 14,107 2,780 1,332Accrued expenses 4,086 4,309 6,881Income taxes 1,453 1,090 (1,655)
Total adjustments (11,151) (10,966) 12,914Net cash provided by operating activities 31,606 43,624 87,416
Cash flows from investing activities: Purchases of property, plant and equipment (50,526) (62,481) (42,611)Investment in investees – (814) (10,492)Purchase of businesses, net of cash acquired (7,435) (65,652) (22,176)
Net cash used in investing activities (57,961) (128,947) (75,279)Cash flows from financing activities:
Proceeds from issuance of common stock 758 541 926Purchase of treasury stock – – (228)Borrowings from bank line of credit 30,963 81,500 454,900Repayments on bank line of credit (28,395) (85,940) (453,200)Proceeds from issuance of long-term debt 5,000 107,993 135,620Payments on long-term debt (648) (25,330) (152,857)
Net cash provided by (used in) financing activities 7,678 78,764 (14,839) Net decrease in cash and cash equivalents (18,677) (6,559) (2,702)
Cash and cash equivalents at beginning of year 46,509 27,832 21,273Cash and cash equivalents at end of year $ 27,832 $ 21,273 $ 18,571
Supplemental disclosure of cash flow information: Cash paid during the year for:
Interest $ 3,313 $ 4,082 $ 6,994Income taxes, net of refunds 24,968 31,567 45,700
See Note 2 for non-cash investing and financing activities.
The accompanying notes are an integral part of these financial statements.
22
Note 1: Summary of Significant
Accounting Policies
The Company, which operates in a single category,
home fragrance products, designs, manufactures, mar-
kets and distributes an extensive line of home fra-
grance products including scented candles, outdoor
citronella candles, potpourri and environmental fra-
grance products and markets a broad range of related
candle accessories and decorative gift bags and tags.
A summary of the significant accounting policies
applied in the preparation of the accompanying con-
solidated financial statements follows:
Principles of Consolidation — The consolidated finan-
cial statements include the accounts of Blyth Industries,
Inc. and its direct and indirect subsidiaries. All significant
intercompany accounts and transactions have been elimi-
nated. Investments in companies which are not majority
owned or controlled are reported using the equity
method and are recorded in other assets. European oper-
ations maintain a calendar year accounting period which
is consolidated with the Company’s fiscal period.
Estimates — The preparation of financial statements in
conformity with generally accepted accounting principles
requires management to make estimates and assumptions
that affect the reported amounts of assets and liabilities
and disclosure of contingent assets and liabilities at the
date of the financial statements and the reported
amounts of revenues and expenses during the reporting
period. Actual results could differ from those estimates.
Credit Concentration — The Company’s credit sales
are principally to department and gift stores, mass
merchandisers and distributors who purchase the
Company’s products for resale. The Company per-
forms ongoing credit evaluations of its customers and
generally does not require collateral. The Company
Notes to Consolidated Financial Statements
makes provisions for estimated credit losses.
Foreign Currency Translation — All balance sheet
accounts of foreign operations are translated into
U.S. dollars at the year-end rate of exchange, and
statement of earnings items are translated at the
weighted average exchange rates for the period.
The effect of the foreign currency translation on
the financial statements presented was not material.
Investments — The Company makes investments
from time to time in the ordinary course of its busi-
ness which may include selected assets and product
lines, long term investments and/or joint ventures that
either complement or expand its existing business.
Derivatives and Other Financial Instruments —
The Company uses forward foreign exchange con-
tracts to hedge the impact of foreign currency fluctua-
tions on certain committed capital expenditures,
Canadian intercompany payables and on certain inter-
company loans. The Company does not hold or issue
derivative financial instruments for trading purposes.
With regard to commitments for machinery and
equipment in foreign currencies, upon payment of
each commitment the underlying forward contract is
closed and the corresponding gain or loss is included
in the measurement of the cost of the acquired asset.
With regard to forward exchange contracts used to
hedge Canadian intercompany payables, gain or loss
on such hedges is recognized in earnings in the peri-
od in which the underlying hedged transaction
occurs. With regard to cross-currency forward con-
tracts related to certain intercompany loans, gain or
loss on such contracts is recognized into earnings in
the period in which the debt is repaid. If a hedging
instrument is sold or terminated prior to maturity,
gains and losses are deferred until the hedged item is
23
settled. However, if the hedged item is no longer likely
to occur, the resultant gain or loss on the terminated
hedge is recognized into earnings.
For consolidated financial statement presentation,
net cash flows from such hedges are classified in the
categories of the cash flow with the items being hedged.
Fair Value of Financial Instruments — The
Company’s financial instruments include short-term and
long-term debt. Management believes the carrying value
of the debt approximates their estimated fair values.
Cash Equivalents — The Company considers all
highly liquid debt instruments purchased with a maturity
of three months or less to be cash equivalents.
Inventories — Inventories are valued at the lower of
cost or market. Cost is determined by the first-in,
first-out method. The elements of cost are material,
labor and factory overhead.
Property, Plant and Equipment — Property, plant and
equipment are stated at cost, less accumulated deprecia-
tion and amortization. Depreciation and amortization
are provided principally by use of the straight-line
method for financial reporting purposes. The straight-line
method and accelerated methods are used for income tax
reporting purposes. Leasehold improvements are amor-
tized over the lives of the respective leases or the service
lives of the improvements, whichever is shorter.
The principal estimated lives used in determining
depreciation and amortization are as follows:
Buildings . . . . . . . . . . . . . . . . . . . . . . . . . . . . . . 27 to 40 years Leasehold improvements . . . . . . . . . . . . . . . . . . 5 to 10 years Machinery and equipment . . . . . . . . . . . . . . . . 5 to 12 years Office furniture and data
processing equipment . . . . . . . . . . . . . . . . . . 5 to 7 years
Excess of Cost Over Fair Value of Assets Acquired —
The excess of costs of the acquisitions over the value of
identifiable assets acquired less liabilities assumed is
Notes to Consolidated Financial Statements
being amortized on a straight line basis ranging from
15-40 years. On an ongoing basis, management reviews
the valuation of the intangible assets to determine possi-
ble impairment by comparing the carrying value to the
undiscounted future cash flows of the related assets.
Excess of Fair Value Over Cost of Assets Acquired —
The excess of fair value of assets acquired over their
cost is amortized on a straight line basis over 12 years.
Comprehensive Income — The Company has adopted
Financial Accounting Standards Board (“FASB”)
Statement No. 130 “Reporting Comprehensive
Income”. This Statement establishes new standards
for the presentation and disclosure of other compre-
hensive income. There were no material items for the
years ended January 31, 1997, 1998 and 1999.
Income Taxes — The Company accounts for income
taxes in accordance with the FASB Statement No. 109,
“Accounting for Income Taxes”. Deferred income taxes
reflect the net tax effects of temporary differences
between the carrying amounts of assets and liabilities for
financial reporting purposes and income tax purposes,
based upon enacted tax rates in effect for the periods the
taxes are expected to be recoverable (payable).
Revenue Recognition — Revenue is recognized at the
time of shipment of the Company’s products.
Earnings per Common and Common Equivalent
Share — In June 1997, the Company effected a three-
for-two stock split in the form of a stock dividend. All
share quantities, per share amounts, and option data
have been retroactively restated to reflect this stock split.
Earnings per common and common equivalent share
are computed based upon the weighted average number
of shares outstanding during each year, which includes
outstanding options for common stock, when dilutive.
24
Notes to Consolidated Financial Statements
Note 2: Business Acquisitions
In April 1995, the Company acquired 80% of the
issued and outstanding capital stock of Jeanmarie
Creations, Inc., a decorative gift bag company, for
approximately $7.1 million (net of cash acquired).
During May 1996, 1997 and 1998, the Company
increased its investment by an additional 4% each
year. Under the purchase and sale agreements, the
Company has the option to acquire, and in certain cir-
cumstances, may be required to acquire, the remaining
8% of common stock at prices set forth in the agree-
ments. The results of operations prior to acquisition
were not material.
In February 1996, the Company purchased from
Hallmark Cards, Incorporated the Canterbury brand can-
dle product line and related candle manufacturing equip-
ment for approximately $8.4 million in cash. The results
of operations prior to acquisition were not material.
In December 1997, the Company acquired the
Sterno brand and Handy Fuel brand assets from a
division of the Colgate-Palmolive Company for $65.0
million in cash. The excess of the purchase price over
the estimated fair value of assets acquired approximat-
ed $47.0 million and is being amortized over 40 years.
In December 1998, the Company acquired
9,431,000 shares of Class A voting common stock of
Liljeholmens Stearinfabriks AB (“Liljeholmens”), a
leading European candle manufacturer, in a private
sale. Such shares represent an approximately 39% eco-
nomic interest and 79% voting interest in
Liljeholmens. After the purchase price was applied to
the fair value of assets acquired and liabilities assumed,
goodwill of approximately $12.2 million was generat-
ed and will be amortized over 40 years.
The following unaudited pro forma consolidated
results of operations have been prepared as if the
investment in Liljeholmens had occurred as of
February 1, 1997 and therefore includes an estimate of
incremental operating expenses, interest expense,
amortization of goodwill and income tax expense:
(In thousands, except per share amounts) 1998 1999
Net sales $783,178 $974,565 Net earnings 54,289 75,176 Net earnings per common share:
Basic $ 1.11 $ 1.53 Diluted 1.10 1.52
The unaudited pro forma results do not purport to
represent what the Company’s results of operations or
financial condition actually would have been had the
investment been made as of February 1, 1997.
The foregoing acquisitions have been recorded
under the purchase method of accounting and, accord-
ingly, the results of the acquired businesses are includ-
ed in the consolidated financial statements since the
date of acquisition.
In December 1996, the Company issued 993,745
shares of its common stock in exchange for all of the
outstanding capital stock of New Ideas International,
Inc. (“New Ideas”), a manufacturer of home and auto
fragrance products. This transaction was accounted for
as a pooling of interests. Since the aggregated historical
operations of New Ideas prior to the date of combina-
tion were not material to the Company’s consolidated
results of operations and financial position, prior period
financial statements have not been restated.
In May 1997, the Company issued 1,900,786
shares of its common stock in exchange for all of the
outstanding capital stock of Endar Corp. (“Endar”), a
manufacturer of potpourri, scented candles and other
25
Notes to Consolidated Financial Statements
fragrance products. The transaction was accounted for
as a pooling of interests. All of the accompanying con-
solidated financial statements and footnotes have been
restated to include the historical results of operations
and financial position of Endar prior to the acquisition.
Note 3: Inventories
The major components of inventories are as follows
(in thousands):
1998 1999
Raw materials $ 19,988 $ 34,807Work in process 2,263 2,658Finished goods 113,273 132,284
$135,524 $169,749
Note 4: Accrued Expenses
Accrued expenses consist of the following (in thousands):
1998 1999
Compensation and certain benefits $10,330 $15,141Deferred revenue 6,015 5,679Promotional expenses 5,217 10,110Taxes, other than income 4,707 3,670Other 3,305 9,474
$29,574 $44,074
Note 5: Bank Lines of Credit
As of January 31, 1999, the Company had a total of
$75.0 million available under uncommitted bank lines
of credit maturing in August 1999 and January 2000
of which $1.7 million was outstanding. Amounts
outstanding under the lines of credit bear interest, at
the Company’s option, at short term fixed rates, at the
banks’ prime rate (7.75% at January 31, 1999) or at
the Eurocurrency rate plus a credit spread, for a
weighted average interest rate of approximately
5.18% at January 31, 1999.
As of December 31, 1998, Liljeholmens had avail-
able lines of credit of approximately $31.0 million of
which approximately $1.8 million was outstanding.
The amounts outstanding under the lines of credit bear
interest at 3.75% at December 31, 1998. The lines of
credit are renewed annually.
Note 6: Long-Term Debt
Long-term debt consists of the following (in thousands):
1998 1999
7.54% Senior Notes $ 25,000 $ 25,000 Credit facilities 93,557 89,538 Other 2,073 9,047
120,630 123,585 Less current maturities (1,013) (9,339)
$119,617 $114,246
In July 1995, the Company privately placed $25.0
million aggregate principal amount of 7.54% Senior
Notes due 2005. Such Senior Notes are guaranteed by
certain of the Company’s subsidiaries and contain,
among other provisions, requirements for maintaining
certain financial ratios and net worth. At January 31,
1999, the Company was in compliance with such
covenants. The notes are payable in seven annual
installments beginning June 30, 1999.
Pursuant to the Company’s revolving credit facili-
ty (“Credit Facility”), which matures on October 17,
2002, the lending institutions have agreed, subject to
certain conditions, to provide an unsecured revolving
credit facility to the Company in an aggregate amount
of up to $140.0 million and to provide, under certain
circumstances, an additional $35.0 million. Amounts
outstanding under the Credit Facility bear interest, at
the Company’s option, at Bank of America’s prime
rate (7.75% at January 31, 1999) or at the
Eurocurrency rate plus a credit spread ranging from
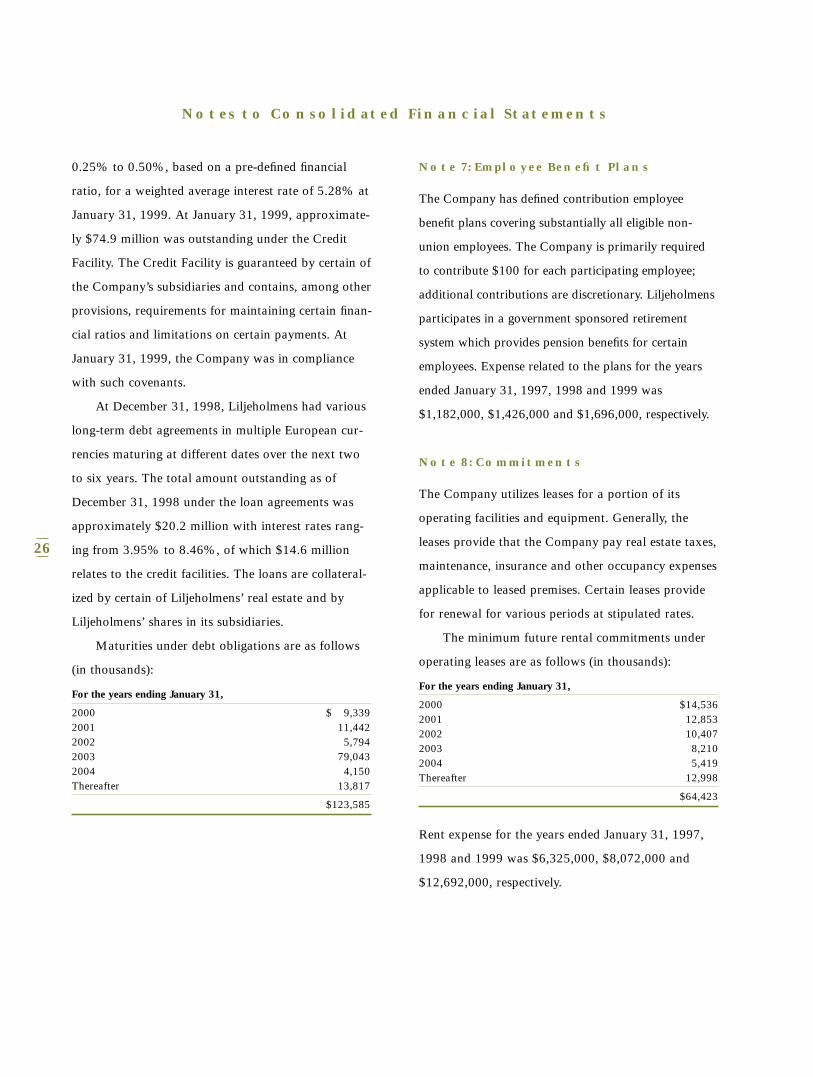
26
Notes to Consolidated Financial Statements
0.25% to 0.50%, based on a pre-defined financial
ratio, for a weighted average interest rate of 5.28% at
January 31, 1999. At January 31, 1999, approximate-
ly $74.9 million was outstanding under the Credit
Facility. The Credit Facility is guaranteed by certain of
the Company’s subsidiaries and contains, among other
provisions, requirements for maintaining certain finan-
cial ratios and limitations on certain payments. At
January 31, 1999, the Company was in compliance
with such covenants.
At December 31, 1998, Liljeholmens had various
long-term debt agreements in multiple European cur-
rencies maturing at different dates over the next two
to six years. The total amount outstanding as of
December 31, 1998 under the loan agreements was
approximately $20.2 million with interest rates rang-
ing from 3.95% to 8.46%, of which $14.6 million
relates to the credit facilities. The loans are collateral-
ized by certain of Liljeholmens’ real estate and by
Liljeholmens’ shares in its subsidiaries.
Maturities under debt obligations are as follows
(in thousands):
For the years ending January 31,
2000 $ 9,3392001 11,4422002 5,794 2003 79,0432004 4,150Thereafter 13,817
$123,585
Note 7: Employee Benefit Plans
The Company has defined contribution employee
benefit plans covering substantially all eligible non-
union employees. The Company is primarily required
to contribute $100 for each participating employee;
additional contributions are discretionary. Liljeholmens
participates in a government sponsored retirement
system which provides pension benefits for certain
employees. Expense related to the plans for the years
ended January 31, 1997, 1998 and 1999 was
$1,182,000, $1,426,000 and $1,696,000, respectively.
Note 8: Commitments
The Company utilizes leases for a portion of its
operating facilities and equipment. Generally, the
leases provide that the Company pay real estate taxes,
maintenance, insurance and other occupancy expenses
applicable to leased premises. Certain leases provide
for renewal for various periods at stipulated rates.
The minimum future rental commitments under
operating leases are as follows (in thousands):
For the years ending January 31,
2000 $14,536 2001 12,853 2002 10,407 2003 8,2102004 5,419 Thereafter 12,998
Total minimum payments required $64,423
Rent expense for the years ended January 31, 1997,
1998 and 1999 was $6,325,000, $8,072,000 and
$12,692,000, respectively.
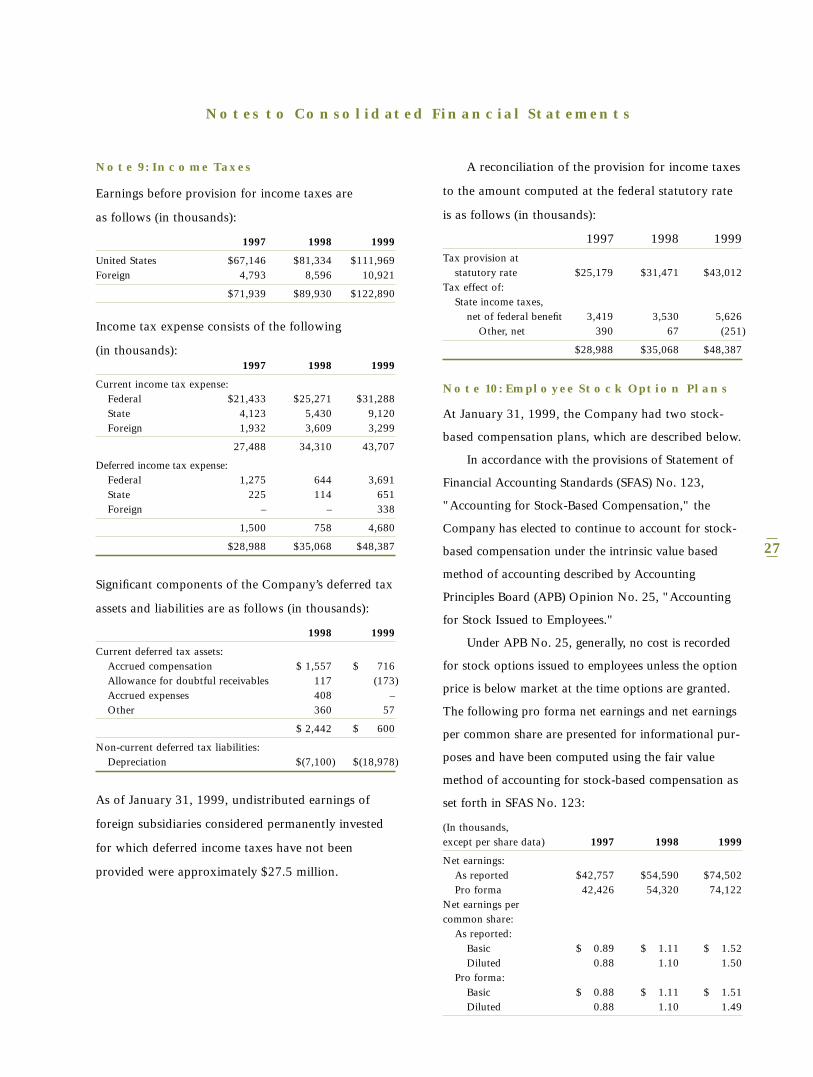
27
A reconciliation of the provision for income taxes
to the amount computed at the federal statutory rate
is as follows (in thousands):
1997 1998 1999
Tax provision at statutory rate $25,179 $31,471 $43,012
Tax effect of: State income taxes,
net of federal benefit 3,419 3,530 5,626Other, net 390 67 (251)
$28,988 $35,068 $48,387
Note 10: Employee Stock Option Plans
At January 31, 1999, the Company had two stock-
based compensation plans, which are described below.
In accordance with the provisions of Statement of
Financial Accounting Standards (SFAS) No. 123,
"Accounting for Stock-Based Compensation," the
Company has elected to continue to account for stock-
based compensation under the intrinsic value based
method of accounting described by Accounting
Principles Board (APB) Opinion No. 25, "Accounting
for Stock Issued to Employees."
Under APB No. 25, generally, no cost is recorded
for stock options issued to employees unless the option
price is below market at the time options are granted.
The following pro forma net earnings and net earnings
per common share are presented for informational pur-
poses and have been computed using the fair value
method of accounting for stock-based compensation as
set forth in SFAS No. 123:
(In thousands, except per share data) 1997 1998 1999
Net earnings: As reported $42,757 $54,590 $74,502 Pro forma 42,426 54,320 74,122
Net earnings per common share:
As reported:Basic $ 0.89 $ 1.11 $ 1.52Diluted 0.88 1.10 1.50
Pro forma: Basic $ 0.88 $ 1.11 $ 1.51Diluted 0.88 1.10 1.49
Notes to Consolidated Financial Statements
Note 9: Income Taxes
Earnings before provision for income taxes are
as follows (in thousands):
1997 1998 1999
United States $67,146 $81,334 $111,969 Foreign 4,793 8,596 10,921
$71,939 $89,930 $122,890
Income tax expense consists of the following
(in thousands):1997 1998 1999
Current income tax expense: Federal $21,433 $25,271 $31,288 State 4,123 5,430 9,120 Foreign 1,932 3,609 3,299
27,488 34,310 43,707
Deferred income tax expense:Federal 1,275 644 3,691 State 225 114 651Foreign – – 338
1,500 758 4,680
$28,988 $35,068 $48,387
Significant components of the Company’s deferred tax
assets and liabilities are as follows (in thousands):
1998 1999
Current deferred tax assets: Accrued compensation $ 1,557 $ 716 Allowance for doubtful receivables 117 (173) Accrued expenses 408 – Other 360 57
$ 2,442 $ 600
Non-current deferred tax liabilities: Depreciation $(7,100) $(18,978)
As of January 31, 1999, undistributed earnings of
foreign subsidiaries considered permanently invested
for which deferred income taxes have not been
provided were approximately $27.5 million.

28
Notes to Consolidated Financial Statements
The fair value of each option is estimated on the date
of grant, using the Black-Scholes option pricing model
with the following weighted-average assumptions used
for grants in 1997, 1998 and 1999, respectively:
expected volatility was 42.5% for 1997 and 1998 and
43.7% for 1999; risk-free interest rates at 6.14% to
6.85% for 1997, 5.69% to 6.99% for 1998 and
4.27% to 5.67% for 1999; expected life of 7 years for
all years and no dividend payments.
The Company has adopted the Amended and
Restated 1994 Employee Stock Option Plan (the
“Employee Option Plan”), which provides for the grant
to officers and employees of both “incentive stock
options” and stock options that are non-qualified for
Federal income tax purposes. The total number of shares
of common stock for which options may be granted pur-
suant to the Employee Option Plan is 1,880,000.
The exercise price of incentive stock options granted
under the Employee Option Plan may not be less than
100% of the fair market value of the common stock at
the time of grant, and the term of any option may not
exceed 10 years. Options generally become exercisable
over a five-year period. With respect to any employee
who owns stock representing more than 10% of the
voting power of the outstanding capital stock of the
Company, the exercise price of any incentive stock
option may not be less than 110% of the fair market
value of such shares at the time of grant, and the term
of such option may not exceed five years.
The Company has also adopted the 1994 Stock Option
Plan for Non-Employee Directors (the “Non-Employee
Director Plan”). A total of 120,000 shares of common
stock may be issued through the exercise of options grant-
ed pursuant to the Non-Employee Director Plan. No
option may be granted under the Non-Employee Director
Plan after ten years following May 18, 1994.
Each Non-Employee Director who is elected to
office for the first time after March 1, 1994 will, upon
such date, automatically be granted an option to
acquire 3,000 shares of common stock. Each Non-
Employee Director who is in office on November 15
of any year thereafter will, on the immediately suc-
ceeding January 1, automatically be granted an option
to acquire 1,500 shares of common stock. The price
of shares that may be purchased upon exercise of an
option is the fair market value of the common stock
on the date of grant.
Options granted pursuant to the Non-Employee
Director Plan become exercisable in full on the first
anniversary of the date of the grant.
Transactions involving stock options are summa-
rized as follows:Weighted Average
Option Shares Exercise Price
Outstanding at January 31, 1996 786,000 $ 9.17
Options granted 274,500 26.17 Options exercised (68,100) 6.99Options cancelled (25,500) 8.47
Outstanding at January 31, 1997 966,900 19.23
Options granted 279,000 25.65Options exercised (70,201) 8.08Options cancelled (40,800) 19.63
Outstanding at January 31, 1998 1,134,899 17.17
Options granted 262,000 31.47Options exercised (99,521) 9.31Options cancelled (65,670) 22.67
Outstanding at January 31, 1999 1,231,708 $20.55
At January 31, 1997, 1998 and 1999, options to
purchase 170,700, 308,999 and 461,407 shares,
respectively, were exercisable.
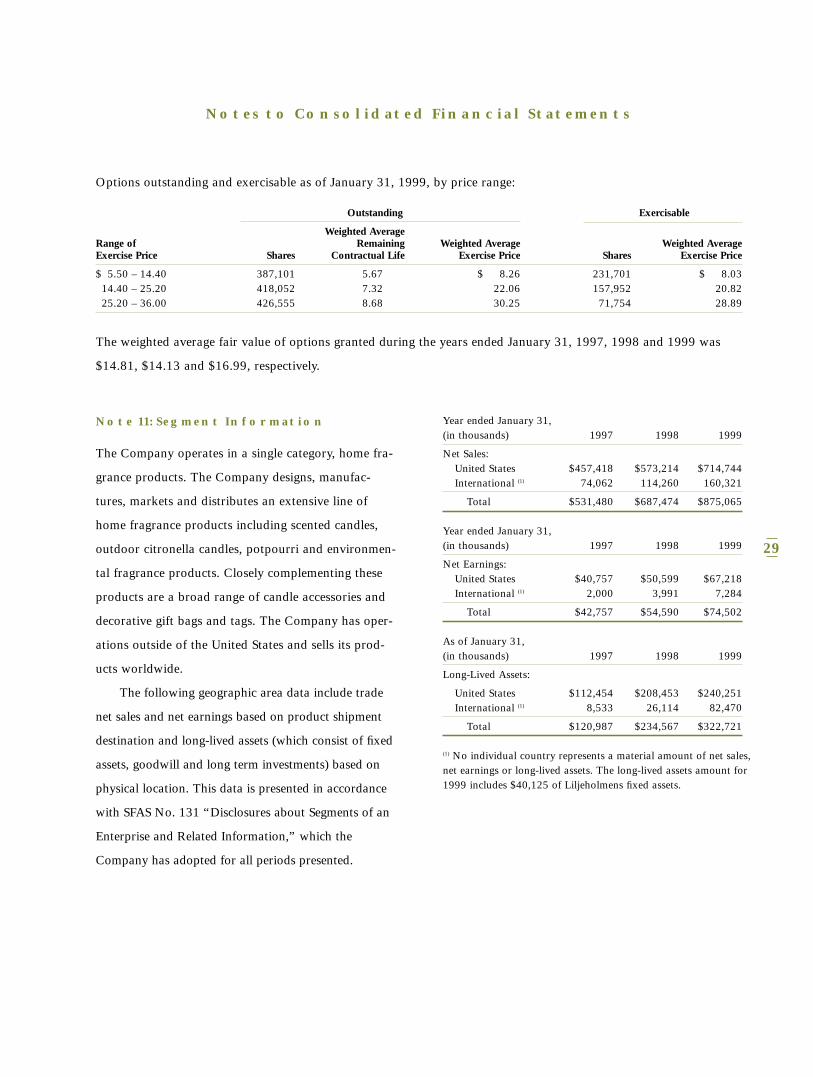
29
Note 11: Segment Information
The Company operates in a single category, home fra-
grance products. The Company designs, manufac-
tures, markets and distributes an extensive line of
home fragrance products including scented candles,
outdoor citronella candles, potpourri and environmen-
tal fragrance products. Closely complementing these
products are a broad range of candle accessories and
decorative gift bags and tags. The Company has oper-
ations outside of the United States and sells its prod-
ucts worldwide.
The following geographic area data include trade
net sales and net earnings based on product shipment
destination and long-lived assets (which consist of fixed
assets, goodwill and long term investments) based on
physical location. This data is presented in accordance
with SFAS No. 131 “Disclosures about Segments of an
Enterprise and Related Information,” which the
Company has adopted for all periods presented.
Notes to Consolidated Financial Statements
Options outstanding and exercisable as of January 31, 1999, by price range:
Outstanding Exercisable
Weighted AverageRange of Remaining Weighted Average Weighted AverageExercise Price Shares Contractual Life Exercise Price Shares Exercise Price
$ 5.50 – 14.40 387,101 5.67 $ 8.26 231,701 $ 8.0314.40 – 25.20 418,052 7.32 22.06 157,952 20.8225.20 – 36.00 426,555 8.68 30.25 71,754 28.89
The weighted average fair value of options granted during the years ended January 31, 1997, 1998 and 1999 was
$14.81, $14.13 and $16.99, respectively.
Year ended January 31, (in thousands) 1997 1998 1999
Net Sales:United States $457,418 $573,214 $714,744International (1) 74,062 114,260 160,321
Total $531,480 $687,474 $875,065
Year ended January 31, (in thousands) 1997 1998 1999
Net Earnings:United States $40,757 $50,599 $67,218International (1) 2,000 3,991 7,284
Total $42,757 $54,590 $74,502
As of January 31, (in thousands) 1997 1998 1999
Long-Lived Assets:
United States $112,454 $208,453 $240,251International (1) 8,533 26,114 82,470
Total $120,987 $234,567 $322,721
(1) No individual country represents a material amount of net sales,net earnings or long-lived assets. The long-lived assets amount for1999 includes $40,125 of Liljeholmens fixed assets.
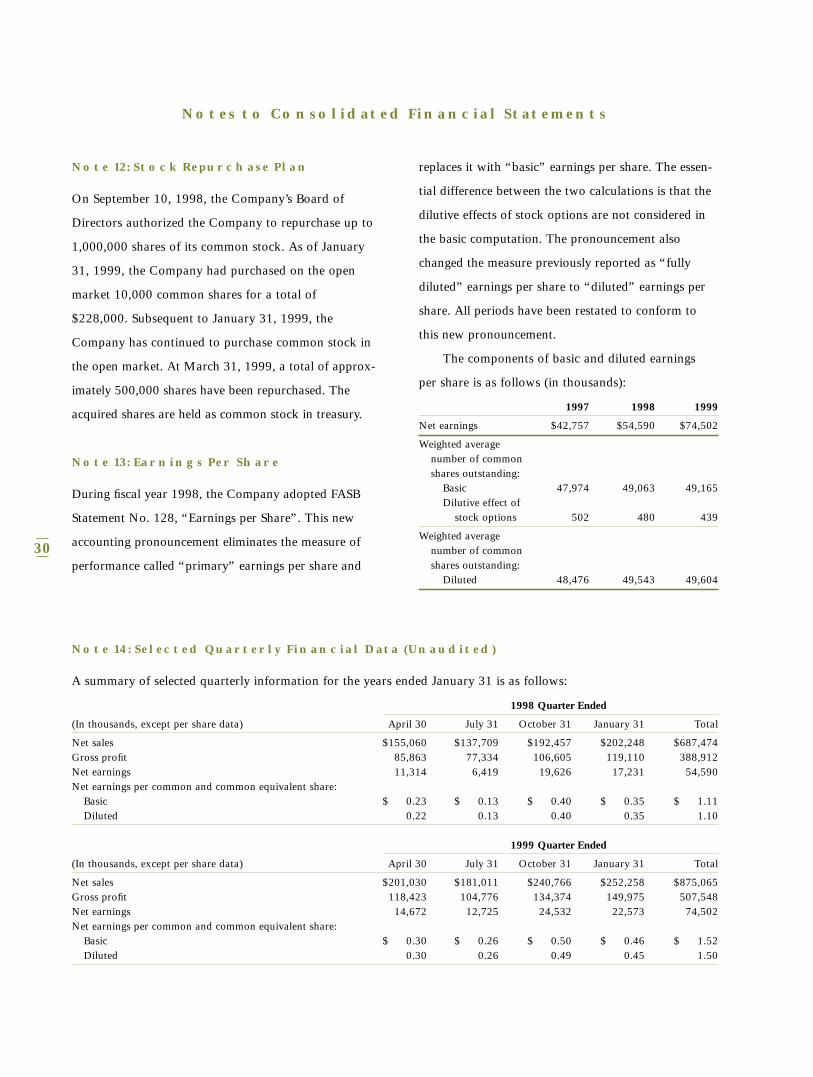
30
Note 12: Stock Repurchase Plan
On September 10, 1998, the Company’s Board of
Directors authorized the Company to repurchase up to
1,000,000 shares of its common stock. As of January
31, 1999, the Company had purchased on the open
market 10,000 common shares for a total of
$228,000. Subsequent to January 31, 1999, the
Company has continued to purchase common stock in
the open market. At March 31, 1999, a total of approx-
imately 500,000 shares have been repurchased. The
acquired shares are held as common stock in treasury.
Note 13: Earnings Per Share
During fiscal year 1998, the Company adopted FASB
Statement No. 128, “Earnings per Share”. This new
accounting pronouncement eliminates the measure of
performance called “primary” earnings per share and
Notes to Consolidated Financial Statements
Note 14: Selected Quarterly Financial Data (Unaudited)
A summary of selected quarterly information for the years ended January 31 is as follows:
1998 Quarter Ended
(In thousands, except per share data) April 30 July 31 October 31 January 31 Total
Net sales $155,060 $137,709 $192,457 $202,248 $687,474Gross profit 85,863 77,334 106,605 119,110 388,912Net earnings 11,314 6,419 19,626 17,231 54,590 Net earnings per common and common equivalent share:
Basic $ 0.23 $ 0.13 $ 0.40 $ 0.35 $ 1.11Diluted 0.22 0.13 0.40 0.35 1.10
1999 Quarter Ended
(In thousands, except per share data) April 30 July 31 October 31 January 31 Total
Net sales $201,030 $181,011 $240,766 $252,258 $875,065 Gross profit 118,423 104,776 134,374 149,975 507,548 Net earnings 14,672 12,725 24,532 22,573 74,502 Net earnings per common and common equivalent share:
Basic $ 0.30 $ 0.26 $ 0.50 $ 0.46 $ 1.52Diluted 0.30 0.26 0.49 0.45 1.50
replaces it with “basic” earnings per share. The essen-
tial difference between the two calculations is that the
dilutive effects of stock options are not considered in
the basic computation. The pronouncement also
changed the measure previously reported as “fully
diluted” earnings per share to “diluted” earnings per
share. All periods have been restated to conform to
this new pronouncement.
The components of basic and diluted earnings
per share is as follows (in thousands):
1997 1998 1999
Net earnings $42,757 $54,590 $74,502
Weighted average number of common shares outstanding:
Basic 47,974 49,063 49,165Dilutive effect of
stock options 502 480 439
Weighted average number of common shares outstanding:
Diluted 48,476 49,543 49,604
31
Notes to Consolidated Financial Statements
Note 15: Subsequent Event
On April 9, 1999, the Company announced that it has
offered to buy for cash, through its subsidiary Candle
Corporation Worldwide Sweden AB (“CCW/Sweden”),
the remaining Class A and Class B common shares of
Liljeholmens not already owned by the Company.
If all the outstanding shares were tendered to
CCW/Sweden, the offer would represent an aggregate
consideration of SEK 231,717,929, or approximately
$28 million.
32
require that we plan and perform the audit to obtain
reasonable assurance about whether the financial state-
ments are free of material misstatement. An audit
includes examining, on a test basis, evidence support-
ing the amounts and disclosures in the financial state-
ments, assessing the accounting principles used and
significant estimates made by management, and evalu-
ating the overall financial statement presentation. We
believe that our audits provide a reasonable basis for
the opinion expressed above.
PRICEWATERHOUSECOOPERS LLP
Chicago, Illinois
March 25, 1999, except for Note 12 and Note 15,
as to which the date is April 9, 1999
Board of Directors and Stockholders
Blyth Industries, Inc.
In our opinion, the accompanying consolidated bal-
ance sheets and the related consolidated statements of
earnings, stockholders’ equity and cash flows present
fairly, in all material respects, the financial position of
Blyth Industries, Inc. and Subsidiaries at January 31,
1999 and 1998, and the results of their operations and
their cash flows for each of the two years in the period
ended January 31, 1999, in conformity with generally
accepted accounting principles. These financial state-
ments are the responsibility of the Company’s manage-
ment; our responsibility is to express an opinion on
these financial statements based on our audits. We
conducted our audits of these statements in accordance
with generally accepted auditing standards which
REPORT OF INDEPENDENT ACCOUNTANTS
33
in the financial statements. An audit also includes assessing
the accounting principles used and significant estimates
made by management, as well as evaluating the overall
financial statement presentation. We believe that our audit
provides a reasonable basis for our opinion.
In our opinion, the financial statements referred to above
present fairly, in all material respects, the consolidated
results of operations and cash flows of Blyth Industries, Inc.
and Subsidiaries, for the year ended January 31, 1997, in
conformity with generally accepted accounting principles.
GRANT THORNTON LLP
Chicago, Illinois
March 28, 1997
Board of Directors and Stockholders
Blyth Industries, Inc.
We have audited the accompanying consolidated statements
of earnings, stockholders’ equity and cash flows of Blyth
Industries, Inc. and Subsidiaries, for the year ended January
31, 1997. These financial statements are the responsibility
of the Company’s management. Our responsibility is to
express an opinion on these financial statements based on
our audit.
We conducted our audit in accordance with generally
accepted auditing standards. Those standards require that
we plan and perform the audit to obtain reasonable assur-
ance about whether the financial statements are free of
material misstatement. An audit includes examining, on a
test basis, evidence supporting the amounts and disclosures
REPORT OF INDEPENDENT CERTIFIED PUBLIC ACCOUNTANTS
34
DIRECTORS AND OFFICERS
DIRECTORS
Roger A. Anderson*Chairman and PresidentBurlington Management Company
John W. Burkhart*Chairman and President Breezy Hill Enterprises, Inc.
Pamela M. GoergenSecretary and Treasurer of The Ropart Group Limited
Robert B. GoergenChairman of the Board, Chief Executive Officer and President of the Company
Neal I. Goldman†
President of Goldman Capital Management, Inc.
Roger H. Morley*Director, Biogen, Inc.Advisory Director, Bank of America–Illinois
John E. Preschlack†
Chairman and President of JEPCOR, Inc.
Howard E. RoseVice Chairman of the Board of the Company
Frederick H. Stephens, Jr.†Retired Corporate Vice President, The Gillette Company
* Member of the Audit Committee† Member of the Compensation Committee
OFFICERS
Robert B. GoergenChairman of the Board, Chief Executive Officer and President
Albert A. BergeronVice President andPresident of PartyLite Gifts, Inc.
Richard T. BrowningVice President and Chief Financial Officer
Jane F. CaseyVice President
Bruce G. CrainVice President andPresident of European Affiliate Group
Bruce D. KreigerVice President, General Counsel and Secretary
Thomas K. KreilickVice President
Elwood L. La Forge, Jr.Vice President andPresident of Worldwide Affiliate Group
Marcia L. PontiusVice President
Jonathan L. PoppickVice President

Des
igne
d by
Sus
an L
oren
Ass
ocia
tes,
New
Yor
k C
ity.
SHAREHOLDER INFORMATION
Common StockListed on the New York Stock ExchangeTrading Symbol: BTH
Dividend PolicyThe Company traditionally has not paid anycash dividends on the Common Stock and doesnot intend to pay cash dividends on theCommon Stock for the foreseeable future. TheCompany intends to retain future earnings forreinvestment in its business.
Annual Meeting of Shareholderswill be held on Tuesday, June 8, 1999at 9:00 a.m. ET at the Hyatt Regency, Greenwich1800 East Putnam Avenue Old Greenwich, CT 06870
Transfer Agent and RegistrarHarris Trust and Savings Bank311 West Monroe StreetChicago, IL 60690-3504
Independent AccountantsPricewaterhouseCoopers LLP200 East Randolph DriveChicago, IL 60601
For Shareholder Information,contact:Jane F. CaseyVice PresidentCorporate Offices(203) 661-1926
Form 10-KThe Company will provide a copy of its report on Form 10-K as filed with the Securities and Exchange Commission. Requests should beaddressed to: Blyth Industries, Inc.Investor Relations100 Field Point RoadGreenwich, Connecticut 06830-6451
Corporate OfficesBlyth Industries, Inc.100 Field Point RoadGreenwich, Connecticut 06830-6451Phone: (203) 661-1926Fax: (203) 661-1969E-mail: [email protected]://www.blythindustries.com

1 0 0F i e l d
P o i n t R o a d


