Page | 1 Acknowledgment My summer training with Asian paints Limited is a lifetime experience that I will cherish throughout my career. This project has provided me a great opportunity to experience the work culture and work process of Asian paints project sales division. This project can never be prepared by the singular efforts but I also demand the help and guardians of some conversant person who under pin actively or passively in the completion of a successful project. I wish to express my sincere gratitude to Mr. Arvind Iyer (Regional Manager, NEWB) for giving me the opportunity to do my summer training at his highly esteemed Organization. I am also grateful to Mr. Ajay Sharma (Area Sales Executive) for his valuable guidance, advice, suggestion and constant encouragement rendered to me at every stage. I am also thankful to Project Sales Officer of Asian paints respected Mr. Chandan Sribastab, Mr. Niladri Mukherjee, Mr. Rajat Gan Chowdhury, Mr. Indrajit Ghosh, Mr. Niraj Sinha and Mr. Dhiman Thakur for giving me information and guidance during my training period.
Transcript
P a g e | 1
AcknowledgmentMy summer training with Asian paints Limited is a lifetime experience that I will cherish
throughout my career. This project has provided me a great opportunity to experience the
work culture and work process of Asian paints project sales division.
This project can never be prepared by the singular efforts but I also demand the help and
guardians of some conversant person who under pin actively or passively in the completion of
a successful project.
I wish to express my sincere gratitude to Mr. Arvind Iyer (Regional Manager, NEWB) for giving
me the opportunity to do my summer training at his highly esteemed Organization.
I am also grateful to Mr. Ajay Sharma (Area Sales Executive) for his valuable guidance, advice,
suggestion and constant encouragement rendered to me at every stage.
I am also thankful to Project Sales Officer of Asian paints respected Mr. Chandan Sribastab, Mr. Niladri Mukherjee, Mr. Rajat Gan Chowdhury, Mr. Indrajit Ghosh, Mr. Niraj Sinha and Mr. Dhiman Thakur for giving me information and guidance during my training period.
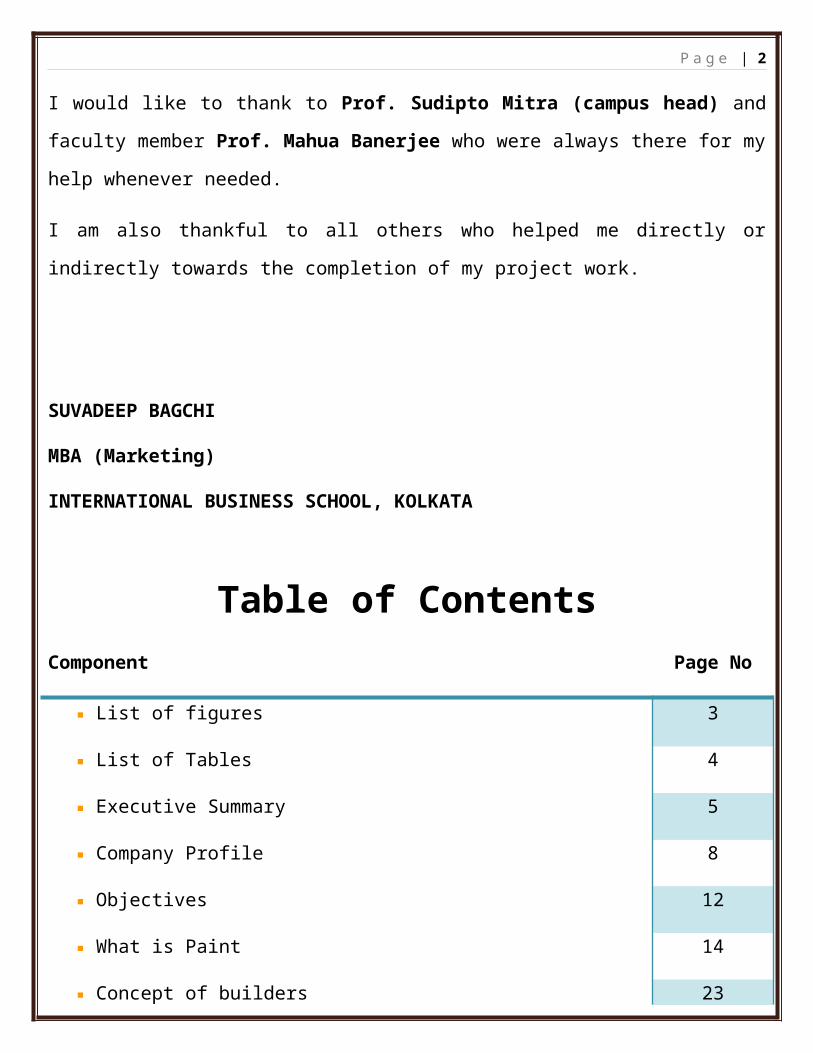
I would like to thank to Prof. Sudipto Mitra (campus head) and faculty member Prof. Mahua
Banerjee who were always there for my help whenever needed.
I am also thankful to all others who helped me directly or indirectly towards the completion of
my project work.
SUVADEEP BAGCHI MBA (Marketing) INTERNATIONAL BUSINESS SCHOOL, KOLKATA
P a g e | 2
Table of ContentsComponent Page No
List of figures 3
List of Tables 4
Executive Summary 5
Company Profile 8
Objectives 12
What is Paint 14
Concept of builders 23
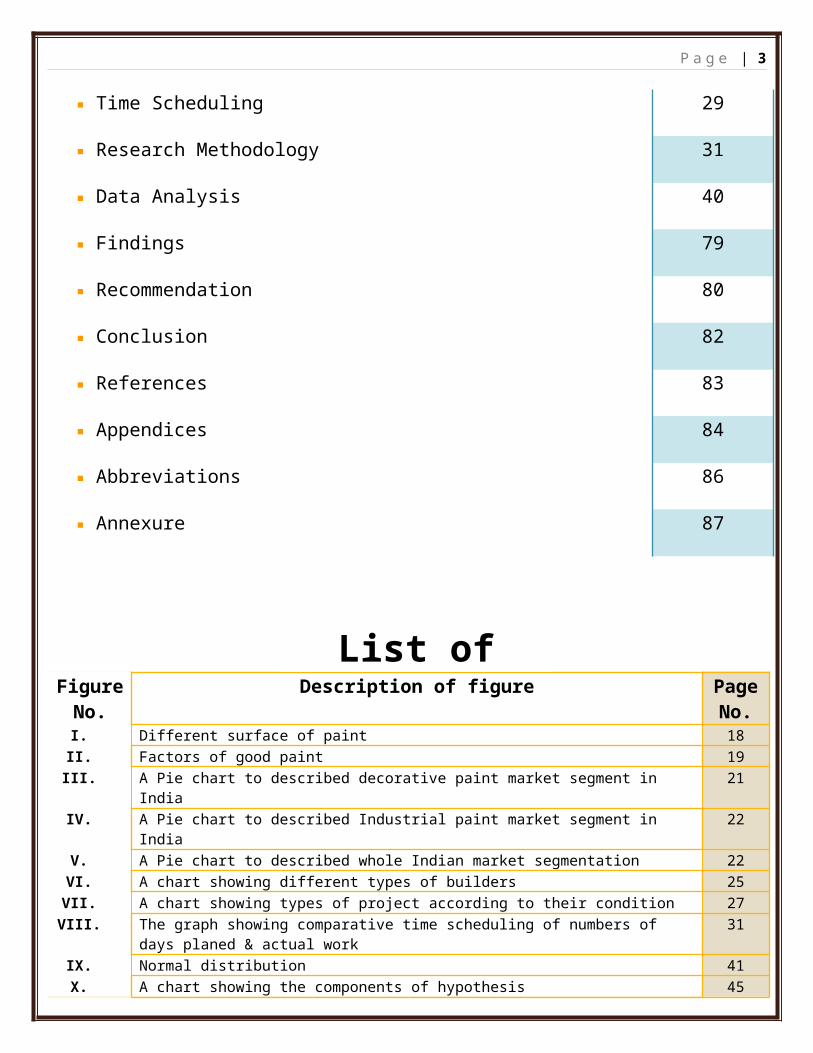
Time Scheduling 29
Research Methodology 31
Data Analysis 40
Findings 79
Recommendation 80
Conclusion 82
References 83
Appendices 84
Abbreviations 86
Annexure 87
Figure No.
Description of figure Page No.
List of figure
P a g e | 3
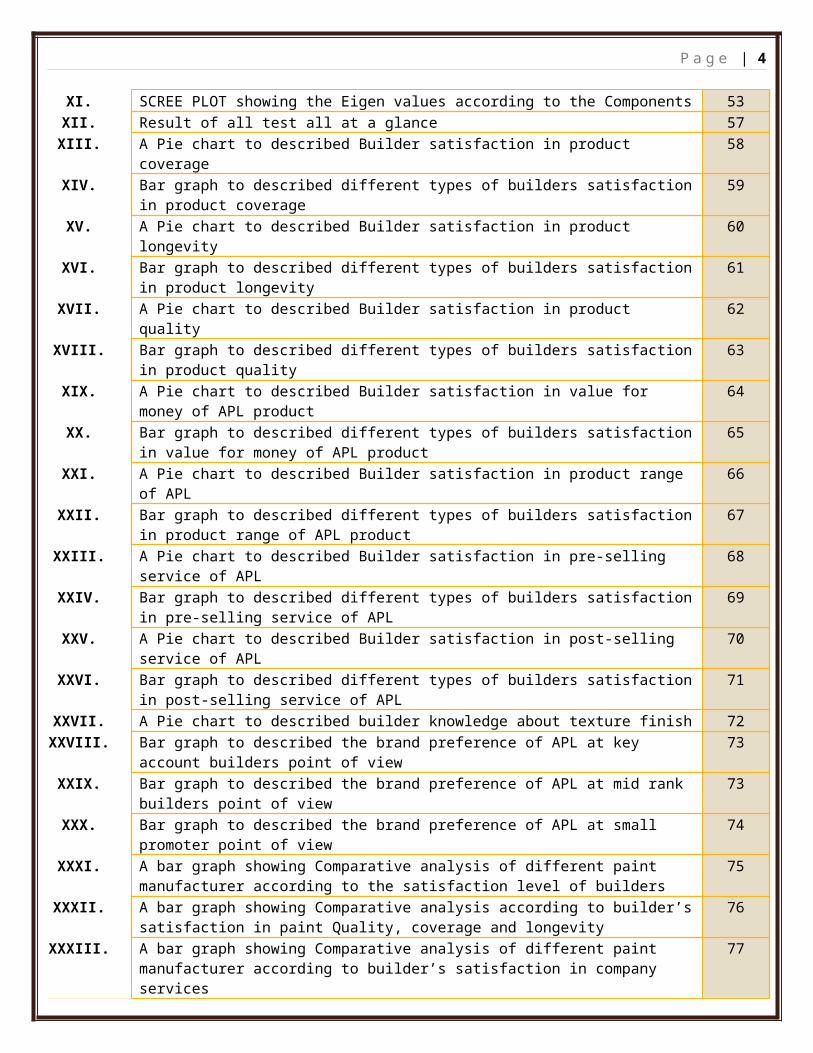
I. Different surface of paint 18II. Factors of good paint 19III. A Pie chart to described decorative paint market segment in India 21IV. A Pie chart to described Industrial paint market segment in India 22V. A Pie chart to described whole Indian market segmentation 22VI. A chart showing different types of builders 25VII. A chart showing types of project according to their condition 27VIII. The graph showing comparative time scheduling of numbers of days planed & actual work 31IX. Normal distribution 41X. A chart showing the components of hypothesis 45XI. SCREE PLOT showing the Eigen values according to the Components 53XII. Result of all test all at a glance 57XIII. A Pie chart to described Builder satisfaction in product coverage 58XIV. Bar graph to described different types of builders satisfaction in product coverage 59XV. A Pie chart to described Builder satisfaction in product longevity 60XVI. Bar graph to described different types of builders satisfaction in product longevity 61XVII. A Pie chart to described Builder satisfaction in product quality 62XVIII. Bar graph to described different types of builders satisfaction in product quality 63XIX. A Pie chart to described Builder satisfaction in value for money of APL product 64XX. Bar graph to described different types of builders satisfaction in value for money of APL
product65
XXI. A Pie chart to described Builder satisfaction in product range of APL 66XXII. Bar graph to described different types of builders satisfaction in product range of APL
product67
XXIII. A Pie chart to described Builder satisfaction in pre-selling service of APL 68XXIV. Bar graph to described different types of builders satisfaction in pre-selling service of
APL69
XXV. A Pie chart to described Builder satisfaction in post-selling service of APL 70XXVI. Bar graph to described different types of builders satisfaction in post-selling service of
APL71
XXVII. A Pie chart to described builder knowledge about texture finish 72XXVIII. Bar graph to described the brand preference of APL at key account builders point of view 73XXIX. Bar graph to described the brand preference of APL at mid rank builders point of view 73XXX. Bar graph to described the brand preference of APL at small promoter point of view 74XXXI. A bar graph showing Comparative analysis of different paint manufacturer according to
the satisfaction level of builders75
XXXII. A bar graph showing Comparative analysis according to builder’s satisfaction in paint Quality, coverage and longevity
76
XXXIII. A bar graph showing Comparative analysis of different paint manufacturer according to builder’s satisfaction in company services
77
XXXIV. A flow chart to maintain builders relation 81
List of tablesTable No. Description of table Page
No.
P a g e | 4
a. Comparative time scheduling of numbers of days planed & actual work 29
b. Sample size details 38
c. Weight age assumption of Likert scale 42
d. Result of Z-test 48
e. Result of Reliability Analysis 50
f. Result of KMO & Bartlette’s Test for Sphericity 53
g. Total variance explained 54
h. Result of Rotated Component Matrix 55
i. Component extraction from Rotated Component Matrix 56
j. Percentage of responded builders in coverage of APL product 58
k. Percentage of responded builders in longevity of APL products 60
l. Percentage of responded builders in Quality of APL product 62
m. Percentage of responded builders in value for money of APL products 64
n. Percentage of responded builders in products range of APL 66
o. Percentage of responded builders in pre-selling services of APL 68
p. Percentage of responded builders in the post-selling services of APL 70
q. Percentage of responded builders in Knowledge about texture finish 72
Chapter Executive Summary
P a g e | 5
Executive Summary1. Introduction: -
Customer Satisfaction is the buzzword used by the business people for the success of
organization in the present days. Due to the increases of heavy competition in every product –
1 Introduction
2 Aim and objectives
3 Methodology
4 Finding and recommendation
P a g e | 6
line it become difficult for the companies to retain the customers for longer time. So retain the
customer for longer time the marketer has to do only one thing i.e. customer satisfaction .If
customer is fully satisfied by the product it not only rub the organization successfully but also
fetch many benefits for the company.
This research is a hypothesized study which was conducted to measure the Builders
satisfaction level towards the project sales division of Asian paints. This research was
conducted in Kolkata. This project was done during the period of 15 May 2010 to 15 July 2010.
2. Aim and objectives: -
Aim of this project is to find out satisfaction level of builders towards the APL Company and
also categories the builders according to company’s level plan.
3. Methodology: -
To meet the research objectives, following activities have been performed.
1. An extensive search of relevant literature from news articles, internet, books. This step
guided the development of the methods and instruments for collecting data.
2. Designing the questionnaire.
3. Survey has been carried out by face to face interviews with the questionnaire.
4. The Survey was included both by quantitative, forced-choice or close ended questions,
qualitative and open-ended questions. Analysis was done on the basis of the
information gathered at the time of interview.
4. Finding and recommendation:-
It seems self evident that companies should try to satisfy their Builders. Satisfied
builders usually return and buy more; they convey other builders about their
experiences and make them loyal towards the company. The different strategies have to
P a g e | 7
be followed by Asian paints, consists of Customer relationship management, strategy to
provide better facility and strategy to provide better after sales service to builders.
CRM as a tool was used to create positive word-of-mouth, to monitor customer
experiences and generate referrals. A series of CRM activities were implemented with
regular direct communication, customer satisfaction surveys, events, festive offers,
rewards program, etc.
Chapter Company profile
P a g e | 8
Company profile1. Introduction:-
Asian Paints is India's largest paint company and ranked among the top ten Decorative
coatings companies in the world with a turnover of INR 66.80 billion. Asian Paints along with
1 Introduction
2 Vision
3 History
4 Human Resources
P a g e | 9
its subsidiaries have operations in 17 countries across the world with 23 paint manufacturing
facilities, servicing consumers in 65 countries through Berger International, SCIB Paints –
Egypt, Asian Paints, Apco Coatings and Taubmans.
2. Vision:-
Asian Paints aims to become one of the top five Decorative coatings companies world-wide by
leveraging its expertise in the higher growth emerging markets. Simultaneously, the company
intends to build long term value in the Industrial coatings business through alliances with
established global partners.
3. History:-
Today:-Asian Paints becomes the 10th largest decorative paint company in the worldAsian Paints is more than twice the size of its nearest competitorIt is one of the most admired companies in IndiaPresent in 22 countries with 27 manufacturing locations, over 2500 SKU's, Integrated SAP - ERP & i2 - SCM solutionRated Best Employer by BT-Hewitt survey, 2000 Bluest of the blue chips by Hindu Business Line; Most admired company to work for by ET-BT survey, 2000On the recommendations of Booz, Allen and Hamilton, Asian Paints restructured itself into Growth, Decorative and International business units and adopted SCM and ERP technologyAsian Paints aims to become the 5th largest decorative paint company in the world.
1967
Asian Paints emerges as India's leading paint company ahead of any international competition.
1957 - 66
P a g e | 10
The family-owned company makes the transition to a professionally managed organisation.British company Balmer Lawrie rejects the products of a giant British paint company in favour of Asian Paints.Asian Paints embarks on an ambitious grassroots marketing campaign, partnering with thousands of dealers in small towns all over India.
1954
Asian Paints mascot, Gattu, the mischievous kid, is born.
1945
Asian Paints touches a turnover of Rs. 3, 50,000, with an innovative marketing strategy "to reach consumers in the remotest corners of the country with small packs."
1st February, 1942
Armed with little knowledge and great determination, Champaklal H. Choksey,
Chimanlal N. Choksi, Suryakant C. Dani and Arvind R. Vakil get together to manufacture
paint in a garage on Foras Road, Bombay. They name their company 'The Asian Oil &
Paint Company', a name that they picked randomly from a telephone directory.
4. Human Resources
Asian Paints believes that people are its strongest assets, for a company can go only as high as
its people aim. It is people who innovate and invent, and who engineer the efficiencies that
make a business succeed. It is they who drive growth and lead to greater heights. At Asian
P a g e | 11
Paints, our human resources systems are designed to create a focused, performance oriented
and agile company. Talent pools of over 4700 employees employed across 23 countries bring
in a unique blend of mindsets and skills.
An open and interactive work culture brings out the best in our people. A sense of ownership
and freedom to experiment at their workplace brings out creativity and innovation in every
individual. Excellent training is provided to develop leaders and re-strengthen competencies
from within the organization. Besides encouraging achievers from within the organization, we
absorb the best talent from some of the best management and technology institutes in the
country.
We hire people who are best suited to the job and whose personal goals are in alignment with
our corporate purpose. Thus, the task is cut out for every individual within the framework of
result-orientation, market insight, customer perspective, trust, respect and problem solving.
The commitment of our people and their sense of discipline and ownership continue to drive
growth for our company.
P a g e | 12
Objectives
Chapter Objectives
1 Primary Objective
2 Secondery Objective
P a g e | 13
“Knowledge must not be confined to ivory towers; but step out and find practical applications”
1. Primary Objective: -
Mapping of Builders :- Find out new builders group name, Key person of that builder
group( contact number& office address), Ongoing projects name and location, total
painting area (External & Internal) , number of project already done and average per
year to distinguish the Builders according to its capacity and also distinguish the
project according to project situation (Hot ,Warm & Cold).
Satisfaction of Builders for Asian paints project sales division: - Identify the builder’s
satisfaction level towards Asian paints product quality, coverage, longevity, pricing,
pre & post selling service.
2. Secondary Objective: -
Identify the following:-
Kind of services expected by builders from a paint company.
Strengths/Weakness of Asian paints Company.
Type of services provided better by the competitor.
Nearest competitor of Asian paints in builder section.
Chapter What is Paint ?
P a g e | 14
What is paint?
1 Definition
2 Purpose of painting
3 Components of paints
4 Painting Surface
5 Factors of good Paint
6 The Indian paint industry
7 The Paint Market
8 The paint market segmentation
P a g e | 15
Definition:-
Paint is a pigmented material which when applied to a surface forms a solid opaque coating under normal conditions of atmospheric temperature or elevated temperature.Paint is a solid / fluid material which when spread over a surface in the form of a thin layer will form a solid, adherent, cohesive dry film in transparent / opaque form.Paint is a coating which makes a film over the surface and protects the surface from internal and external environment and decorates the surface.
Purpose of painting:-
To protect the surface.To decorate the surface.To hide the surface.Aesthetics & Identity
Components of paints:-PigmentBinderSolventAdditives
The important features required for each of these components will be discussed below.
Pigments: - By pigments we mean the insoluble solid substances, supplied in fine particles sizes which give the dried paint film its desired color, hiding and other optical properties and also to confer increased hardness, durability and protective properties. Pigments have also been found to affect the consistency and the application properties of the paints consistency and the application properties of the paints considerably.
Vehicle: - Vehicle, which is also called Binder or medium for paints, is the firm forming material; which binds the pigments and keeps them in suspension in a film.
P a g e | 16
These clear media are of considerable importance, since they control to a great extent many of the fundamental properties of the coating. To ease and manner of application; speed of dying under various conditions and properties like protection against corrosion and resistance to different chemicals are all largely dependent on the other type of medium used.Vehicle can be broadly classified into two- non synthetic type and synthetic type. Non-synthetic medium for paints may be either a processed or unprocessed drying type vegetable oil or a varnished medium made by cooking vegetable oil with naturally occurring resin. Synthetic resins are made by the interaction of different chemicals and sometimes these are modified by naturally occurring materials like vegetable oils or rosin (naturally occurring resin). The synthetic resins are tailor made materials and are designed to suit the requirements desired. Often more than one synthetic medium are in use of synthetic enamel to meet different performance requirements desired in the product.
Solvent: - It might be assumed that because the solvents of paint are ultimately lost evaporation, their importance is small relative to that of the other ingredients. In practice, considerable knowledge of the properties of the volatile ingredients of paints is essential in order to formulate the wide variety of finishes.For convenience of study the solvents may be classified into several classes and this classification may be done in a number of ways.One type of classification may be done on the basis of “solvent power “. The solvent power as a solvent for a solute is its ability to dissolve the solute. A solvent has maximum solvent power when it dissolves a solute as completely as possible, over a wide range of concentration. As per this classification lacquer thinners are mixtures of “true solvents” “latent solvent” and “diluents”. A latent solvent is defined as a volatile ingredient added to a lacquer which, although it is not solvent for the principle film forming polymer and is added for the purpose of reducing the cost or increasing the solvent power of the solvent mixture.
Additives: - Besides the three main categories of ingredients, paint can have a wide variety of miscellaneous additives, which are usually added in very small amounts(1 - 4 gm in 100 gm of paint) and yet give a very significant effect on the product. Some
P a g e | 17
examples include additives to modify surface tension, improve flow properties, improve the finished appearance, increase wet edge, improve pigment stability, impart antifreeze properties, control foaming, control skinning, etc. Other types of additives include catalysts, thickeners, stabilizers, emulsifiers, texturizers, adhesion promoters, UV stabilizers, flatteners (de-glossing agents), biocides to fight bacterial growth, and the like.They are available in all stages of paint making -
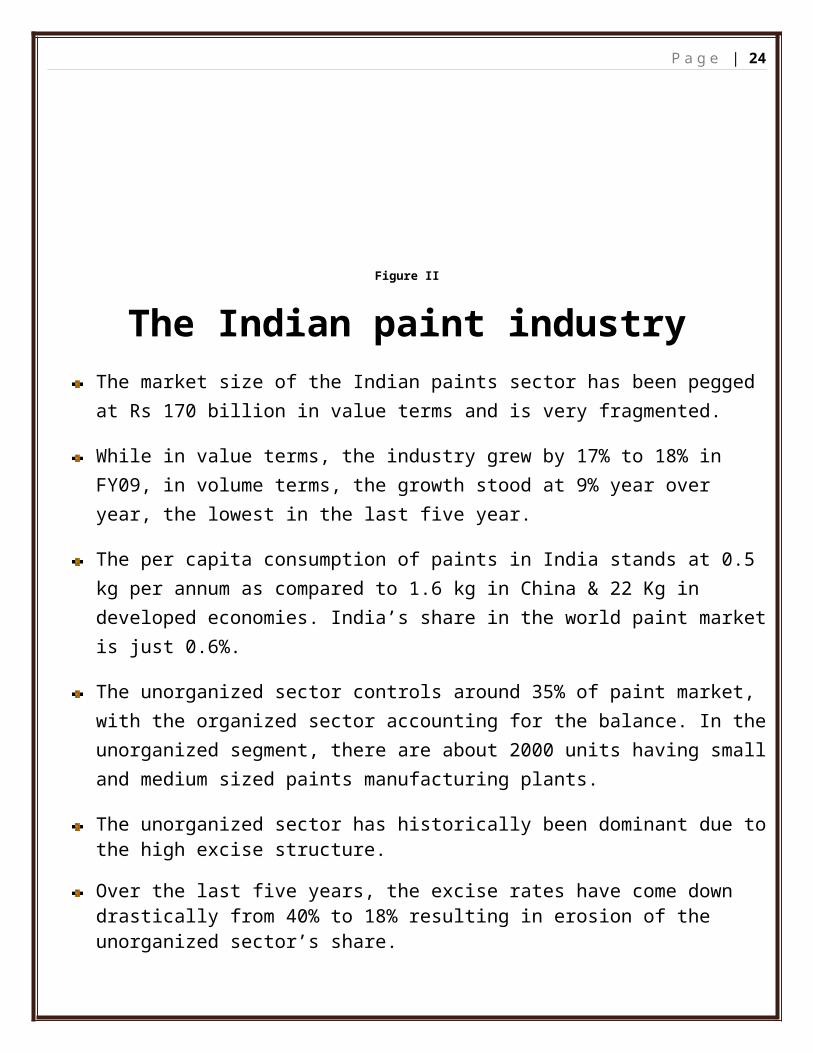
The market size of the Indian paints sector has been pegged at Rs 170 billion in value terms and is very fragmented.
P a g e | 19
While in value terms, the industry grew by 17% to 18% in FY09, in volume terms, the growth stood at 9% year over year, the lowest in the last five year.
The per capita consumption of paints in India stands at 0.5 kg per annum as compared to 1.6 kg in China & 22 Kg in developed economies. India’s share in the world paint market is just 0.6%.
The unorganized sector controls around 35% of paint market, with the organized sector accounting for the balance. In the unorganized segment, there are about 2000 units having small and medium sized paints manufacturing plants.
The unorganized sector has historically been dominant due to the high excise structure.
Over the last five years, the excise rates have come down drastically from 40% to 18% resulting in erosion of the unorganized sector’s share.
The paint industry is characterized by low fixed assets intensity but high working capital intensity. The main investments are in brand building and distribution infrastructure.
New trends are emerging in technology and marketing. Introduction of Tinting Machine at the dealer / retailer level will bring down working capital costs.
Also new technology is being used for increasing the utility and lifespan of paints. Indian industry will have to keep pace with global technological changes to maintain their competitiveness.
Already a few alliances have been entered into and the number is likely to increase in the future.
The outlook for the industry is positive especially given the good prospect for automotive and white goods industry.
Moreover, housing is expected to grow rapidly on the back of rising incomes and government incentives. The supply situation remains a cause for concern and will keep prices under check. The key to success will be innovative marketing.
The Paint MarketThe utility of paints have evolved from a decorative use to surface protection also known as surface coatings, paints can be classified on the basis of end use, solvent system and solid content.
P a g e | 20
End use classification:- paints can be classified as
Decorative/architectural paint
Industrial paints and automotive coating.
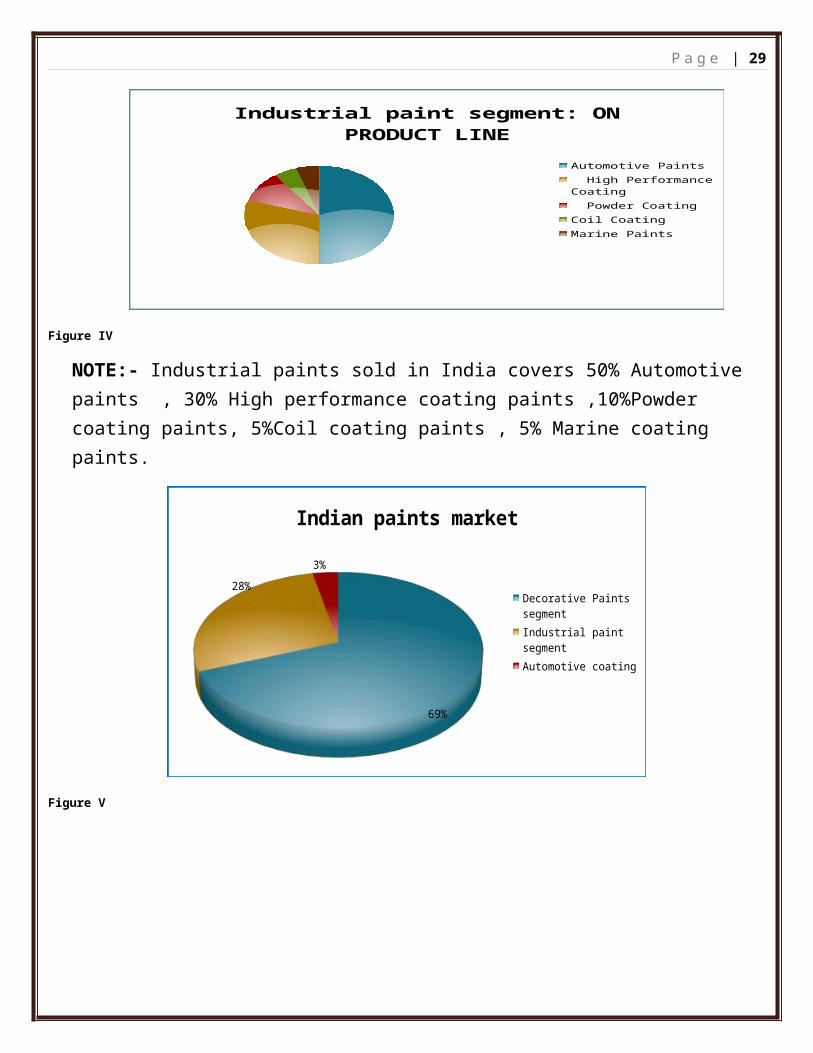
Decorative Paints: Decorative paints account covers almost 70% of the overall paint
market in India. In this segment Asian paint has been a leader for almost four decades.
Decorative paints include wall finishes, for interior & exterior uses, examples, wood
finishes & ancillary products such as primers, putties, etc.
Industrial Coatings: An industrial coating is paint or coating defined by its protective,
rather than its aesthetic properties, although it can provide both. The most common use
of industrial coatings is for corrosion control of steel or concrete. The most common
polymers used in industrial coatings are polyurethane, epoxy and moisture cure
urethane. Industrial coatings have a moderate growth rate than decorative coating, led
by the growth in automotive original equipment sector, powder coatings & protective
coatings. Industrial coatings are classified into automotive & non-automotive coatings.
While Asian paints Industrial coating Ltd. (APICL) services the powder coating segment,
Asian paints Ltd. caters to be remaining non-auto industrial coatings segments.
Solvent based classification: - This includes paints which use petro
products or water as the main solvent. Water based paints are gaining popularity due to
their environment friendliness.
Solid content: - Can be classified as liquid or solid (powder) paints. Powder
coatings find application mainly in the white foods industry.
The paint market segmentation
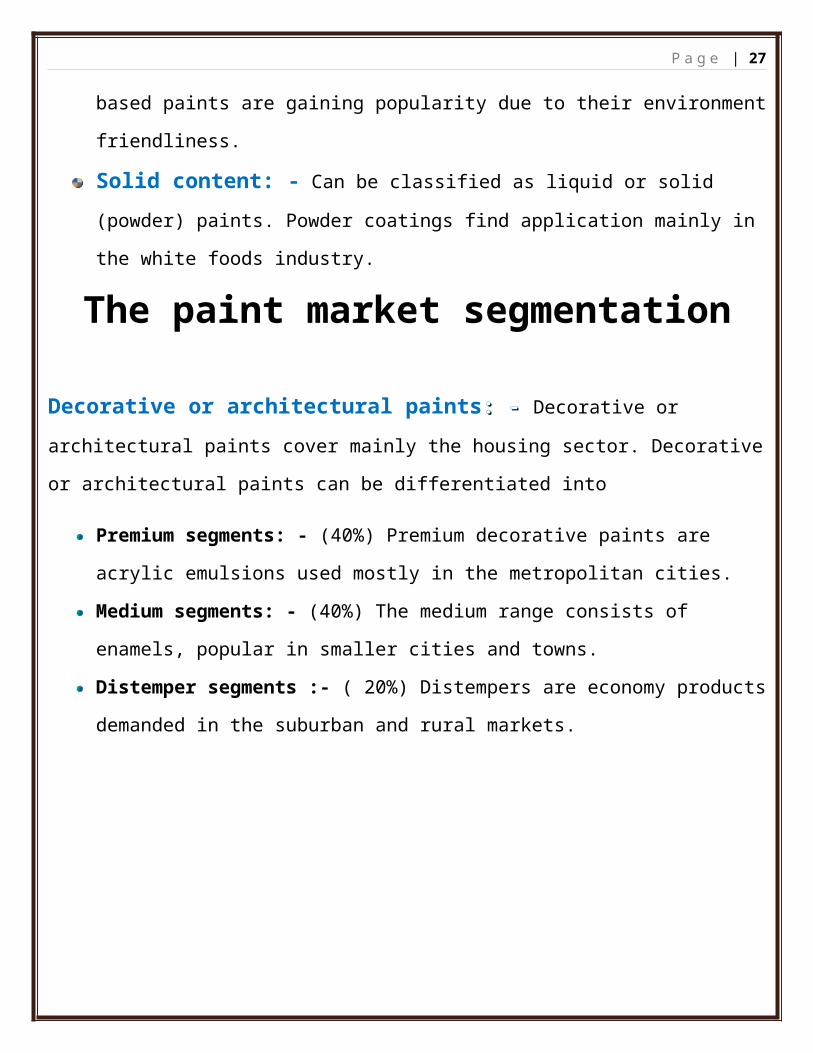
Decorative or architectural paints: - : - Decorative or architectural paints
cover mainly the housing sector. Decorative or architectural paints can be differentiated into
NOTE: - Decorative paints sold in India covers 40% Premium segment, 40% Medium segment and 20% of all are Distempers segment and it is here that the unorganized sector has dominance. Key success factors in the decorative paints segment:
Brand equitya wide range of shadesdistribution strength efficient working capital management
Industrial paints: - : - Industrial paints can be differentiated into:
A builder is responsible for the construction of masonry structures. Their work can involve sheet rock, ceramic tile, painting, personnel deal with material estimates and labor projections.
1 Definition
2 Tasks of builders
3 How builders work
4 Types of builders
P a g e | 24
2. Generally Builders are performing the following tasks:
Examine and interpret client’s plan or arrange the drawing of plan to meet the building regulations.Submit tenders (offers to do jobs at a stated price), quote the prices for the project.Arrange submission of plans to local authorities for approval and arrange inspections of building work.Organize subcontractors to carry out all stages of building work and negotiate rates.Calculate quantities of material required for building projects and order these from building suppliers or advertise for tenders.Arrange delivery times of materials to coincide with various stages of the building process.Supervise the work of subcontractors to make sure buildings are of an acceptable standard and are proceeding according to time schedule.
3. How builders work:-
Builder visits the site to learn more about it, talks with the architect who designed the project about the plan and develops an estimate for the client. The estimate includes all types cost associated with the project. Laid out a document which reduced the costs so that people understand how the builder arrived at the estimate. Once the estimate is approved, the builder starts work.Builders are the coordinators of the construction site. With the architect's drawings in hand, they find people to perform all the work, including establishing foundations, framing, siding, roofing, and interior finishing such as plumbing, wiring, dry walling and painting . Builders also handle tasks like ordering supplies, controlling supply costs, managing waste, confirming that all of the contractors and employees are qualified for the work, and working with property inspectors to ensure that the structure meets the building code. Typically, builder has a large staff so that it can have several projects underway at once, and the staff includes people experienced in many different aspects of construction, from lawyers who handle construction issues to foremen with extensive experience in the field. The services offered by a builder can vary widely. Many choose to specialize in particular types of projects, such as Residential & Commercial Complexes, Office Buildings and Township, Shopping mall, Hospital, Institution, Clubs & resort, Hospitality sector etc. Builders often begin their job by helping to obtain building permits and by surveying land so that they know what to keep in mind while building on it, such as its drainage and natural vegetation. Once the builder establishes that the property is ready, building
begins! Builders are on-sight during construction making sure that all of the aspects of the structure are built properly and according to plan.
4. Types of Builders:-
There many types of builders but for my project I am concern those builders who construct masonry structure. According to my project I differentiate the builders in basis of their working process and Asian paints Company segmented the builders on the basis of their capacity for betterment of their service.
Figure VI
Fig: - showing types of builders
According to their working process
Project builders: Project builders generally:-
Have a number of different houses being constructed at one time.Have a team of salespeople to negotiate the building deal.Offer the home buyer access to a design service.Offer house and land packages and possibly finance.
Builders
Accoording to their working process
Project builder
Contract builder
According to their capacity
Key account
Mid rank builder
Small
P a g e | 26
Contract builders: Contract builders generally:-
Offer a more personalized service and custom-built houses.Remain personally involved with a project from start to finish.Offer a design service.
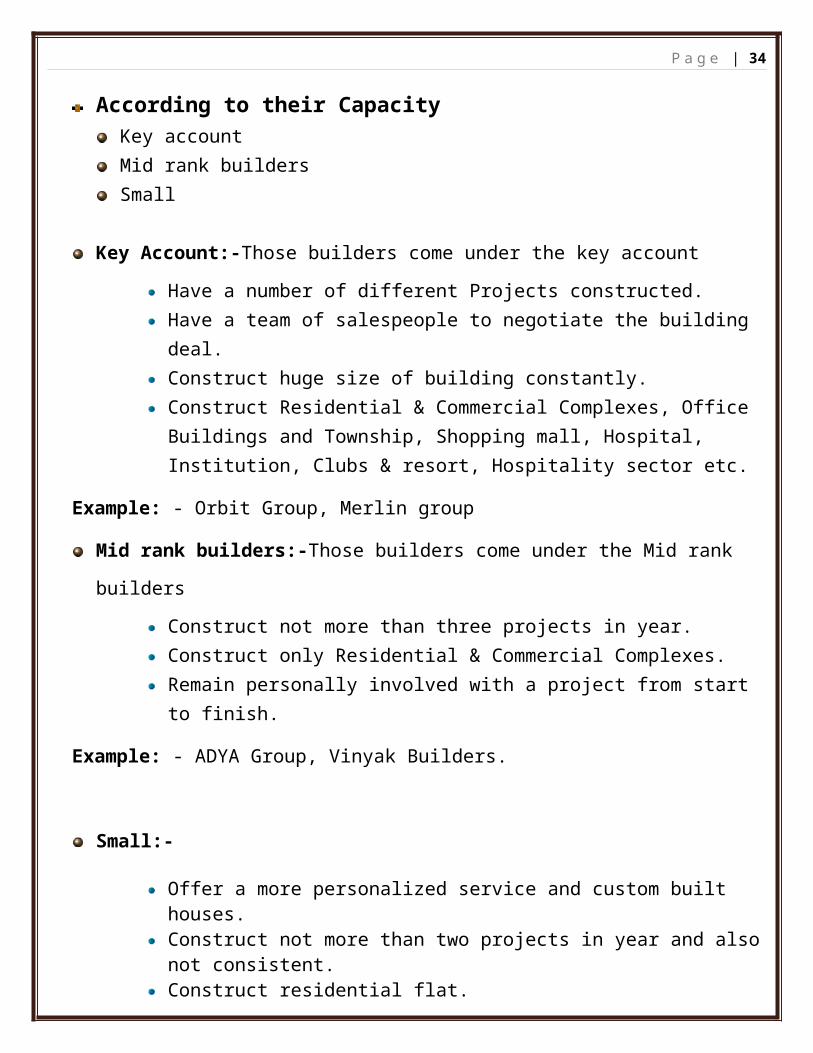
According to their CapacityKey account Mid rank buildersSmall
Key Account:-Those builders come under the key account
Have a number of different Projects constructed.Have a team of salespeople to negotiate the building deal.Construct huge size of building constantly.Construct Residential & Commercial Complexes, Office Buildings and Township, Shopping mall, Hospital, Institution, Clubs & resort, Hospitality sector etc.
Example: - Orbit Group, Merlin group
Mid rank builders:-Those builders come under the Mid rank builders
Construct not more than three projects in year.Construct only Residential & Commercial Complexes.Remain personally involved with a project from start to finish.
Example: - ADYA Group, Vinyak Builders.
Small:-
Offer a more personalized service and custom built houses.Construct not more than two projects in year and also not consistent.Construct residential flat.Usually known as promoter. Remain personally involved with a project from start to finish.
Example: - Rakhee construction.
P a g e | 27
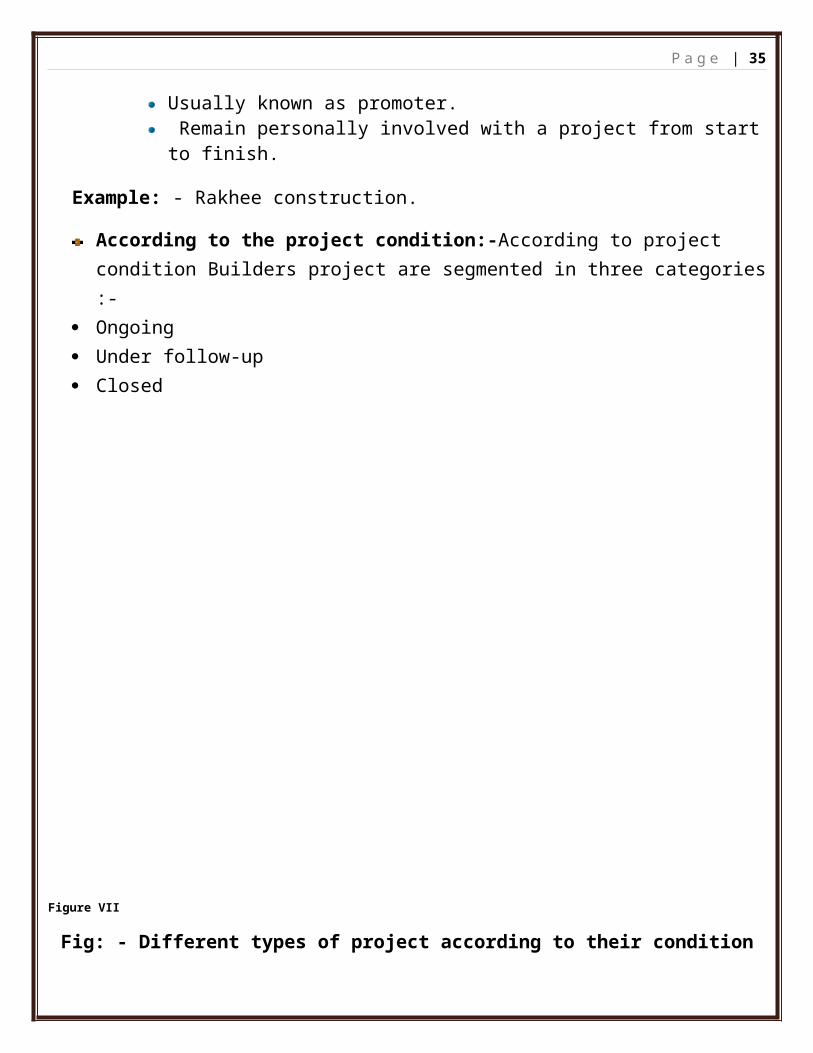
According to the project condition:-According to project condition Builders project are segmented in three categories :-
Ongoing Under follow-up Closed
Figure VII
Fig: - Different types of project according to their condition
Ongoing: - On going projects are those which are started but not ready for painting. It is segmented by three categories:-
Starting phaseUnder construction Fully completed
Builders project
Ongoing Under follow-up
Hot (0-60
days)
Warm (61-
120days)
Cold (120+)
Closed
P a g e | 28
Under follow-up:- Ready for painting but yet not painted for final decision. It is also segmented by three categories for its time duration:-
Hot (0 – 60 days)Warm (60-120 days)Cold (120+ days)
Closed: - Painting job fully completed
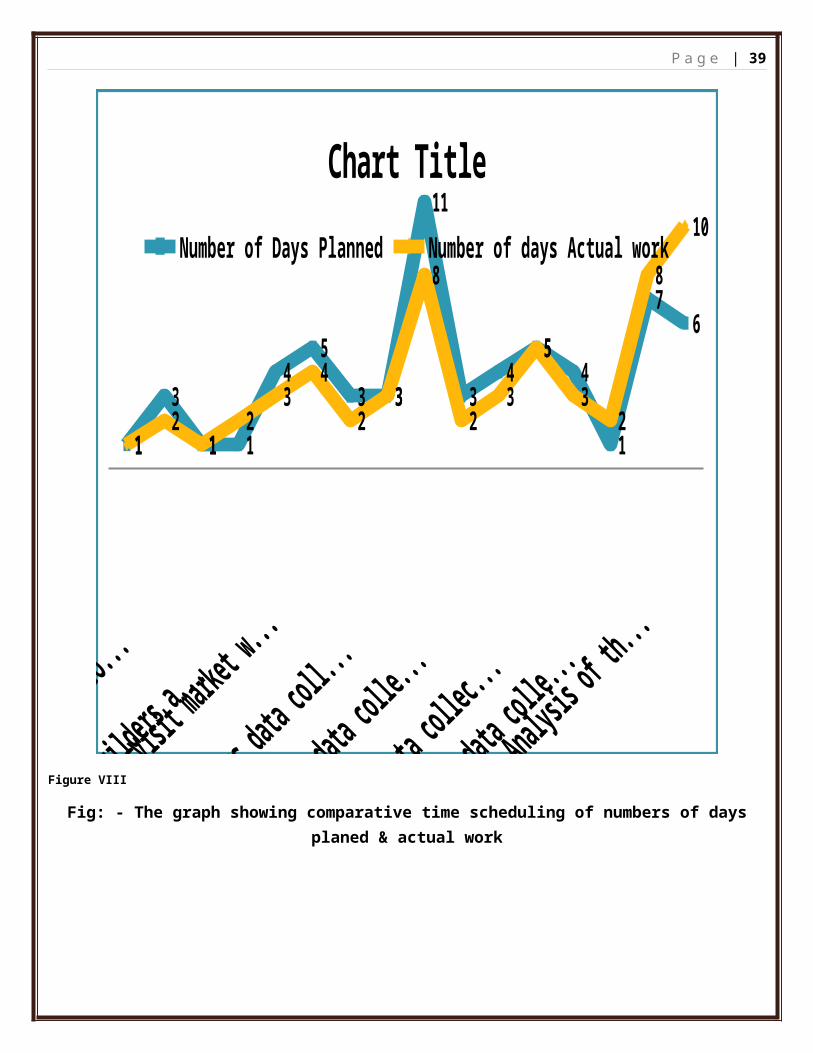
Time SchedulingIn this project I have some work plan and its execution. My project is of 60 days, i.e., 2 months.
Table a
Activities Number of Days Number of days
P a g e | 29
Planned Actual work
My induction & company profile 1 1
Product knowledge 3 2
Concept of Builders and their working
style
1 1
Questionnaire preparation 1 2
Visit market with PSO 4 3
Builders data collection from
Sonarpur
5 4
Builders data collection from Garia 3 2
Builders data collection from
Tollygunge
3 3
Builders data collection from
Dumdum
11 8
Builders data collection from Paik
para
3 2
Builders data collection from
Ballygunge
4 3
Builders data collection from Hazra
road
5 5
Builders data collection from Barasat 4 3
Grouping the raw data 1 2
Analysis of the data 7 8
Final preparation of the project 6 10
P a g e | 30
A graph of time scheduling
My induction & compan...
Product knowledge
Concept of Builders and th...
Questionnaire prepar...
Visit market with PSO
Builders data collection...
Builders data collection...
Builders data collection ...
Builders data collectio...
Builders data collection ...
Builders data collection ...
Builders data collection ...
Builders data collection...
Grouping the raw ...
Analysis of the data
Final preparation of th...
1
3
1 1
45
3 3
11
34
54
1
76
12
12
34
23
8
23
5
32
8
10
Chart TitleNumber of Days Planned Number of days Actual work
Figure VIII
Fig: - The graph showing comparative time scheduling of numbers of days planed & actual work
P a g e | 31
1 Research Framework
2 Research Process
Chapter Research methodology
P a g e | 32
Research methodologyResearch Framework:-
The report has been prepared on the basis of information collected from different
sources. In order to achieve the objective of the project proper research method was applied.
After giving thorough brain storming session, objectives were selected and the set on the base
of these objectives, a questionnaire was designed giving major emphasis by gathering new
ideas or insight so as to determine and bind out solution to the problems.
Research Process:-
In this project I had to survey the various location of Kolkata. In my survey primarily I
had to find out the ongoing project work, builders and project name of that project work,
information about the builders and secondarily the presence of competitor and the other
factors that would facilitate the company.
For these objectives the research methodology that I followed:
Defining the objective
Scope and limitation of the study
Develop the research plan
Determine research design
Identify data types and sources
Research approaches
Research Instruments
Design data collection questionnaires
Determine sample plan and size
Contact methods
Collect the data
P a g e | 33
Objectives of the study:-
To identify the loyalty of Builders towards Asian paints company.
To identify the key factor of builders satisfaction.
To measure the specific status for satisfaction and dissatisfaction of builders.
A study on competitive paint market in builders section.
Scope of the study:-
Scope of the study mainly to know the current level of Builders satisfaction.
Scope of the study mainly to know the loyalty of the Builders towards the
company.
To give suggestion regarding improvement of performance standard of the
Company.
To inform the management about current level.
The data has been analyzed and presented in a simple and precise way on the
basis of which pertinent recommendations have been made to the company to
better the services, policies and strategies.
Limitations of the study:-
Time limit restricts detailed survey work for this particular topic of research.
The survey is restricted to the builders who are involved in project work.
Some Builders have lack of time, so they may not communicate properly.
This research is geographically restricted to Kolkata only. Hence the result cannot
be extrapolated to other places.
The sample size is small due to the specified reasons.
Findings are based on sample survey.
P a g e | 34
Research plan:-
Time span – 12.05.2010 to 12.07.2010
Total 8 weeks working.
Actual field working-
1. To identify the project work.
2. To meet Builders directly on the project site or in their office as
their availability.
3. To meet promoters directly on the site.
Introduction and gathered product knowledge – 5 days
Data collection time – 5 weeks & 2 days.
Analysis of the data -1 week.
Final Preparation of project – 1 week.
Research design:- Marketing research can classify in one of three categories: -
Exploratory research
Descriptive research
Causal research
These classifications are made according to the objective of the research. In some cases
the research will fall into one of these categories, but in other cases different phases of
the same research project will fall into different categories.
Exploratory research: - has the goal of formulating problems more precisely,
clarifying concepts, and gathering explanations, gaining insight, eliminating
impractical ideas, and forming hypotheses.
In my project I have used this research. This study is a mix of explorative and formal
methodologies adopting monitoring and observing to study the Builders.
P a g e | 35
Descriptive research: - is more rigid than exploratory research and seeks to
describe users of a product, determine the proportion of the population that uses a
product, or predict future demand for a product.
Causal research: - seeks to find cause and affect relationships between variables. It
accomplishes this goal through laboratory and field experiments.
Data types and sources: - For this project both primary and secondary data were the
most valuable source of information.
Secondary Data
Before going through the time and expense of collecting primary data, one should
check for secondary data that previously may have been collected for other purposes
but that can be used in the immediate study. The secondary data was the most
important source for my project to find out the builders. In my project the secondary
data are collected from –
List of builders addresses given from company.
Internet.
Newspaper.
Magazines.
Company web site.
Secondary data has the advantage of saving time and reducing data gathering costs.
The disadvantages are that the data may not fit the problem perfectly and that the
accuracy may be more difficult to verify for secondary data than for primary data.
Primary data
Often, secondary data must be supplemented by primary data originated specifically
for the study at hand. Primary data are data freshly gathered for a specific purpose.
In my project the source of primary data is Questionnaire Method.
P a g e | 36
Research approaches: - From the two data source which I have mentioned above
secondary data are the easiest way to gather and the cost of collecting this data is very
low and easily available from the respective association.
After collecting the secondary data or information from the secondary sources
then I started collecting primary data from Builders to narrow down my research. There
are basically five ways to collect data:-
Survey Research: - This method was the most appropriate way to collect
data. The research approach is a widely used method for data collection and
best suited for descriptive type of research survey includes research
instrument like questionnaire which can be structured and unstructured. And
I have used this method in my project to find out the builders satisfaction.
Observational Research: - This method was not used by me in my project,
because this survey has no use for me.
Focus-group Research: - This method is also not used by me in my survey.
Behavioral data:-This method was also not used by me in my survey.
Research instrument: - There is various way of research instrument of collecting
primary data, the various methods are-
Questionnaires.
Psychological tools.
Mechanical Devices.
Qualitative Measures.
From the above mentioned research instruments I had used only Questionnaires
technique to find out the builders satisfaction towards Asian paints Company.
P a g e | 37
Questionnaire Design:-The questionnaire is an important tool for gathering primary
data. Poorly constructed questions can result in large errors and invalidate the research
data, so significant effort should be put into the questionnaire design. In this project I
am formulated the questionnaire in the following manner:-
At the top of the survey questionnaire was formulated to take the project
details and also builder’s details of that project.
Questionnaire was formulated containing 29 closed ended and open ended
questions.
Out of 29 questions 4 open ended questions and 25 close ended questions.
Out of 25 questions 2 Dichotomous Questions (The dichotomous question is
generally a "yes/no" question), 7 Rank Order Scaling Questions and 16 Rating
Scale Questions were there.
Questions were segmented into 4 parts to find out the satisfaction of builders
towards the company, product & services.
The last part formulated to find out competitive analysis of the paint market.
It is a total three pages questionnaire.
Sampling Plans: - After deciding the research approach and instruments, now I had to
decide on the sampling plan which was one of the important task, because from the
bunch of people I had to select only those people (Builders), whom I can target from
now onward .There are three way of sorting the data :-
Sampling Unit: - who is to be surveyed? And now my task was to define the target
population, which will be sampled from the number of people.
In this project my target population was only various types of builders.
For finding satisfaction level of the builders I survey three kind of builders –
P a g e | 38
a) Key account (those builders comes under key account who already done
huge size of project).
b) Mid rank builders (Done smaller project than key account).
c) Small or promoter.
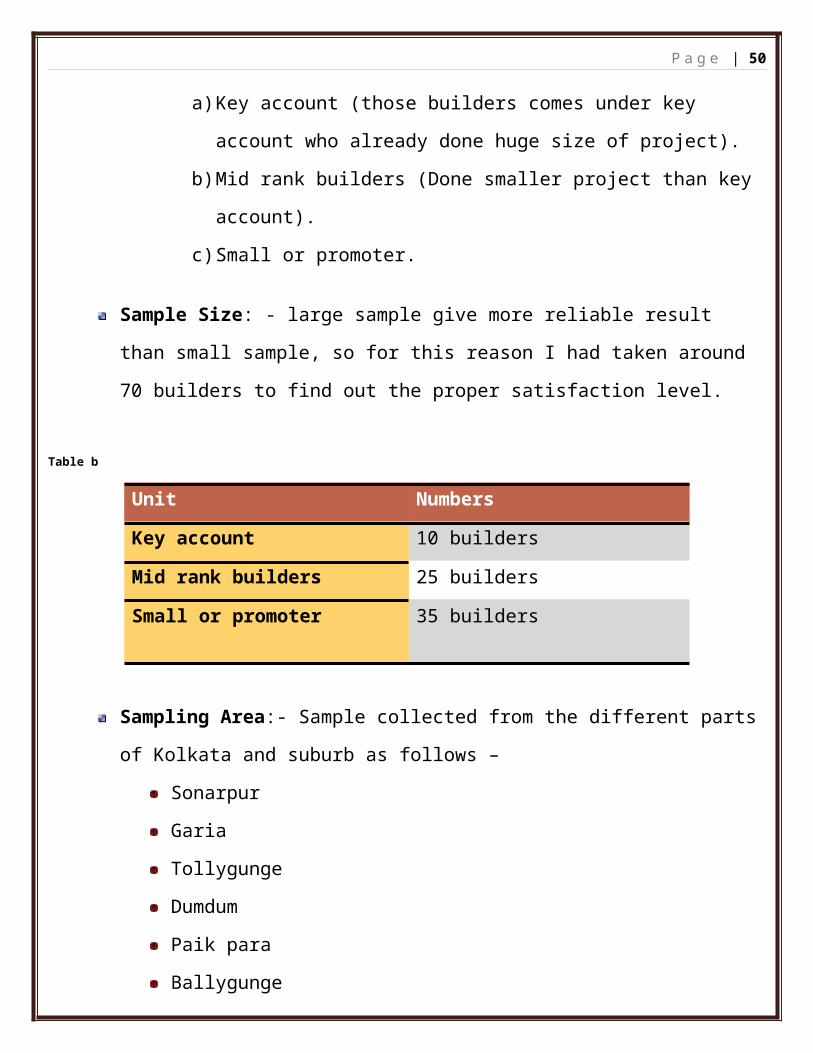
Sample Size: - large sample give more reliable result than small sample, so for this
reason I had taken around 70 builders to find out the proper satisfaction level.
Table b
Unit Numbers
Key account 10 builders
Mid rank builders 25 builders
Small or promoter 35 builders
Sampling Area:- Sample collected from the different parts of Kolkata and suburb as
follows –
Sonarpur
Garia
Tollygunge
Dumdum
Paik para
Ballygunge
Hazra road
Barasat
P a g e | 39
Contact methods: - After identified the exact location of a builder my task was how
to contact them, and for me there only two ways of contacting them.
Personal Interview: - this method was the most appropriate way of
survey, because by personal interview with the help of questionnaire I came
to know their feeling about the Asian paints Company.
Telephone: - This method is also used by me because the Builders had no
time for me and there was no other option to meet them.
P a g e | 40
Chapter Data analysis
1 Z test
2 Reliability analysis
3 Factor analysis
4 Graphical analysis
5 S.W.O.T analysis
P a g e | 41
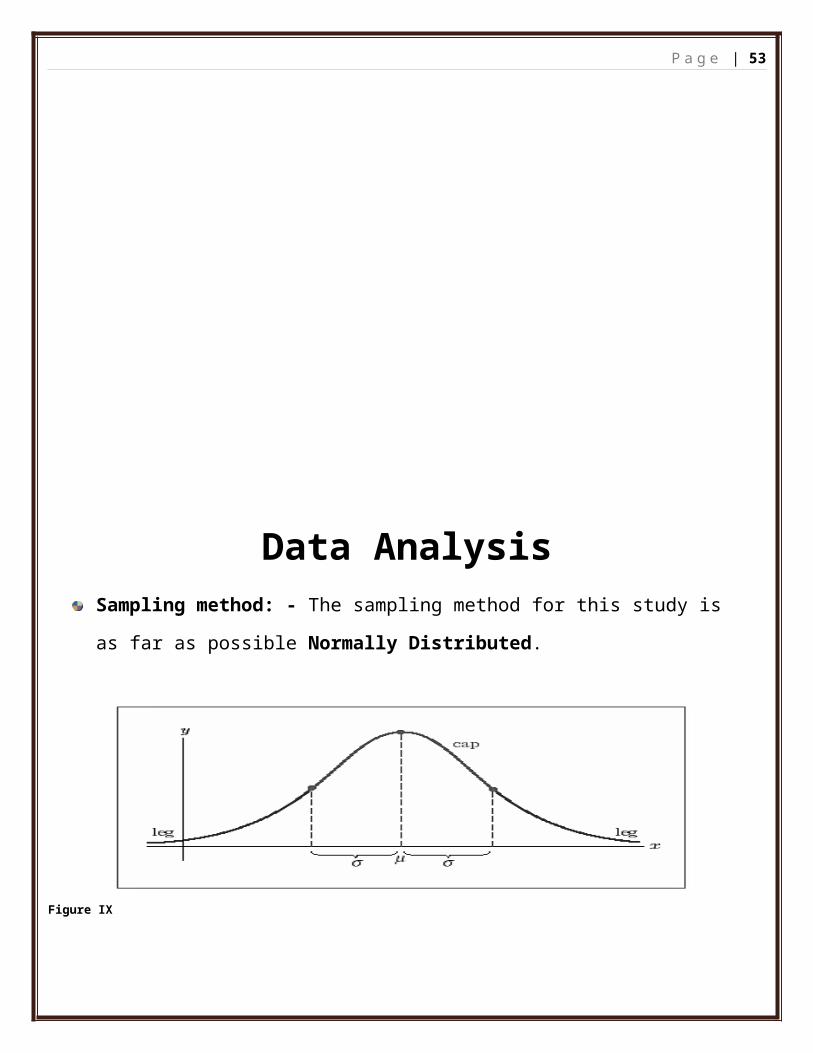
Data AnalysisSampling method: - The sampling method for this study is as far as possible Normally
Distributed.
Figure IX
The sampling is done kept in mind to achieve some realistic results. The Qualitative and
Quantitative analysis samples were obtained by Probability Sampling Method (where
every sample from the population of builders has equal chances of being selected). –
Simple Random Sampling. (Samples were randomly selected from the population of
builders).
Scaling:-A scale is a mechanism by which individuals are distinguished as to how they
differ from one another on the variables of interest of our study.
I have considered Nominal scale (Builders/project name, No. of project done/ongoing in
a year, project type) and the rest is Ordinal scale. (Product satisfaction parameters,
Service satisfaction parameters and company satisfaction)
Rating scale:-I have used a Likert Scale to examine how strongly respondents have
agreed or disagreed with the statements given in the Questionnaire on a five point
Data analysis and interpretation methods:-The methods followed for the analysis and
interpretation of data are:
Z- Test
Reliability analysis
Factor analysis
Univariate Percentage Analysis
Weighted average method
Z-test: - A Z-test is any statistical test for which the distribution of the test statistic under
the null hypothesis can be approximated by a normal distribution. Due to the central
limit theorem, many test statistics are approximately normally distributed for large
samples. Therefore, many statistical tests can be performed as approximate Z-tests if
the sample size is not too small.
P a g e | 43
Population normal, population infinite, sample size may be large or small but variance of
the population is known, Ha may be one-sided or two-sided:In such a situation z-test is
used for testing hypothesis of mean and the test statistic z is worked our as under:
z=x−μH0❑
σ p❑/√n
Reliability analysis: - For using factor analysis to validate a questionnaire, it is useful to
check the reliability of that scale. Reliability just means that a scale should consistently
reflect the construct it is measuring. One way to think of this is that, other things being
equal, a person should get the same score on a questionnaire if they complete it at two
different points in time.
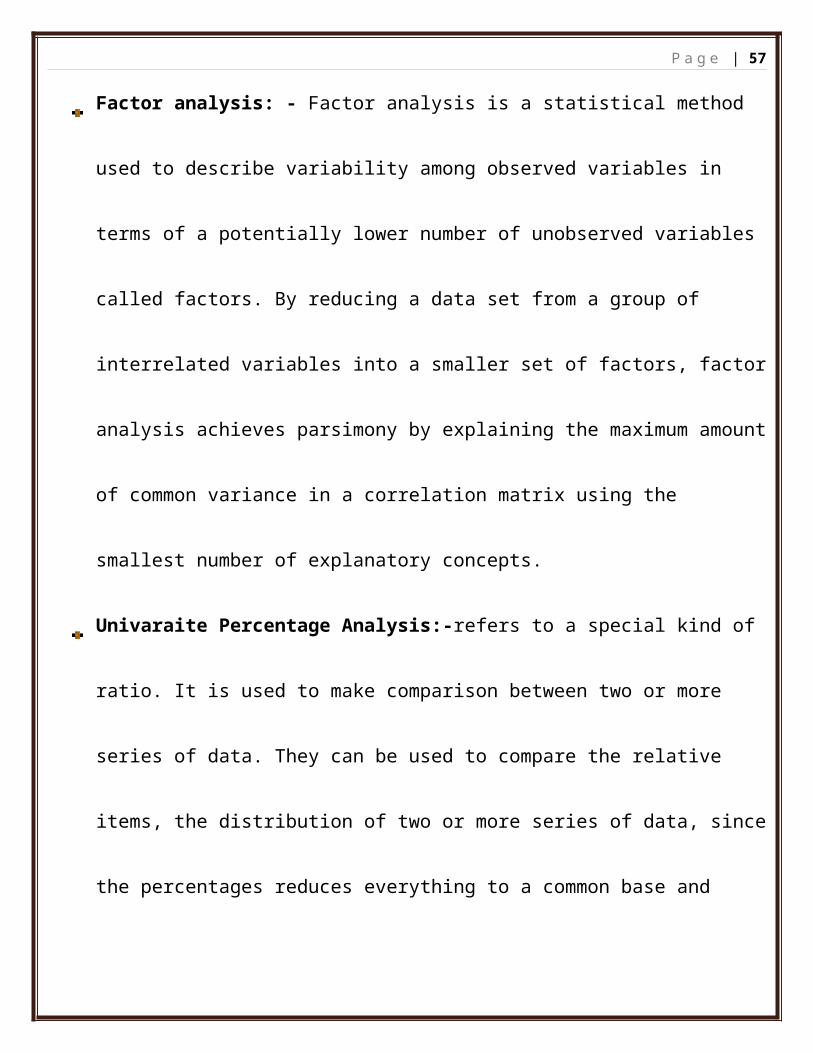
Factor analysis: - Factor analysis is a statistical method used to describe variability
among observed variables in terms of a potentially lower number of unobserved
variables called factors. By reducing a data set from a group of interrelated variables
into a smaller set of factors, factor analysis achieves parsimony by explaining the
maximum amount of common variance in a correlation matrix using the smallest
number of explanatory concepts.
Univaraite Percentage Analysis:-refers to a special kind of ratio. It is used to make
comparison between two or more series of data. They can be used to compare the
P a g e | 44
relative items, the distribution of two or more series of data, since the percentages
reduces everything to a common base and there by allow meaningful comparisons to be
made. Here only one factor is considered.
percentage=noof respondentstotalrespondents
×100
Weighted average method:-This method is a used when the relative importance of the
different items is not the same. The term weighted stands for the relative importance of
the different items. It is assumed that inventory costs should be assigned on the basis of
average costs of identical units. An average cost unit is determined by dividing the total
costs of the units by the number of units.
The weighted average method is logical when assigning costs to units that become
mixed together, thereby making separate identification difficult or impossible.
The formula is:
X ¿∑WX
∑W
Where; D
X = Weighted Arithmetic mean
P a g e | 45
X = Frequency or no of response dents
W = Weighted allotted to each factor
Hypothesis Testing
Flow of Hypothesis:-
P a g e | 46
Figure X
Fig: - Showing the components for hypothesis
Assumption for Hypothesis:-
Hypothesis 1:-Null hypothesis = H0 = Builders are not satisfied with the coverage of Asian paints products.
Builders satisfactionProductCoverage
longevity
Quality
Value for money
Product range
About companyValue
Reputation
Easy doing business
Reliable
Preferred
ServicesPost selling
Pre selling
delivery on time
P a g e | 47
Alternative hypothesis = H1 = Builders are satisfied with the coverage of Asian paints Products.
Hypothesis 2:-Null hypothesis = H0 = Builders are not satisfied with the longevity of Asian paints products.Alternative hypothesis = H1 = Builders are satisfied with the longevity of Asian paints products.
Hypothesis 3:-
Null hypothesis = H0 = Builders are not satisfied with the Quality of Asian paints Products.Alternative hypothesis = H1 = Builders are satisfied with the Quality of Asian paints Products.
Hypothesis 4:-Null hypothesis = H0 = Builders are not satisfied with the value for money of Asian paints products.Alternative hypothesis = H1 = Builders are satisfied with the value for money of Asian paints Products.
Hypothesis 5:-Null hypothesis = H0 = Builders are not satisfied with range of products of Asian paints.Alternative hypothesis = H1 = Builders are satisfied with range of products of Asian paints.
Hypothesis 6:-Null hypothesis = H0 = It is insignificant that painted by APL product increase the value of builders project.Alternative hypothesis = H1 = It is significant that painted by APL product increase the value of builders project.
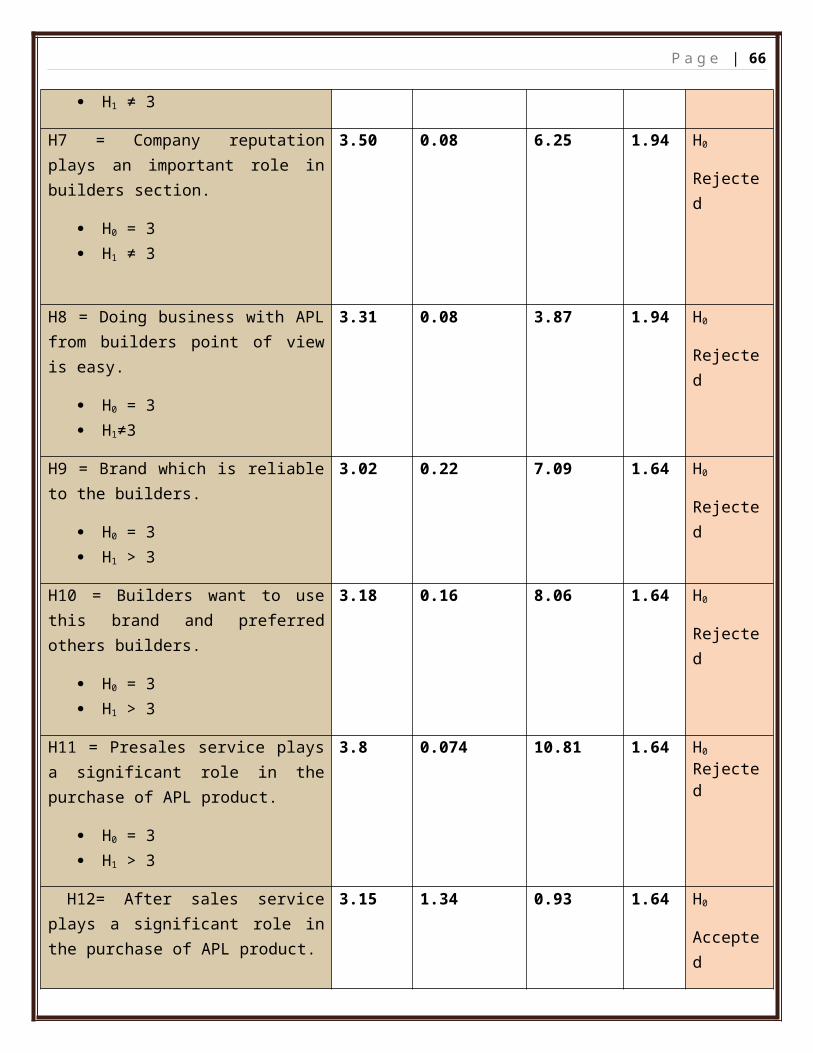
Hypothesis 7:-
Null hypothesis = H0 = Reputation of the Asian paints company plays insignificant
role in project sales division.
P a g e | 48
Alternative hypothesis = H1 = Reputation of the Asian paints company plays
significant role in project sales division.
Hypothesis 8:-
Null hypothesis = H0 = Easy doing business plays insignificant role in project sales division.Alternative hypothesis = H1 = Easy doing business plays significant role in project sales division.
Hypothesis 9:-
Null hypothesis = H0 = Asian paints is unreliable brand to builders.
Alternative hypothesis = H1 = Asian paints is reliable brand to builders.
Hypothesis 10:-
Null hypothesis = H0 = Asian paints is not preferable brand to builders.
Alternative hypothesis = H1 = Asian paints a preferable brand to builders.
Hypothesis 11:-
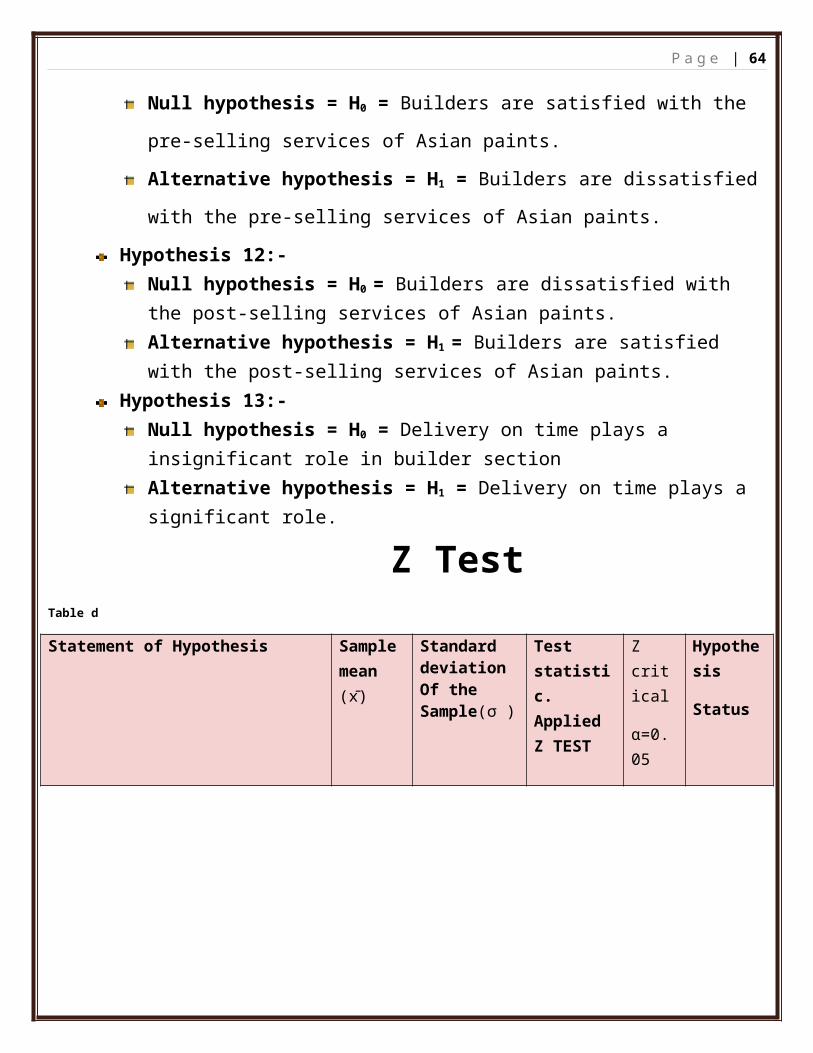
Null hypothesis = H0 = Builders are satisfied with the pre-selling services of Asian
paints.
Alternative hypothesis = H1 = Builders are dissatisfied with the pre-selling
services of Asian paints.
Hypothesis 12:-Null hypothesis = H0 = Builders are dissatisfied with the post-selling services of Asian paints.Alternative hypothesis = H1 = Builders are satisfied with the post-selling services of Asian paints.
Hypothesis 13:-Null hypothesis = H0 = Delivery on time plays a insignificant role in builder section Alternative hypothesis = H1 = Delivery on time plays a significant role.
Z Test
P a g e | 49
Table d
Statement of Hypothesis Sample mean (x ̄)
Standard deviation Of the Sample(σ )
Test statistic. Applied Z TEST
Z critical
α=0.05
Hypothesis
Status
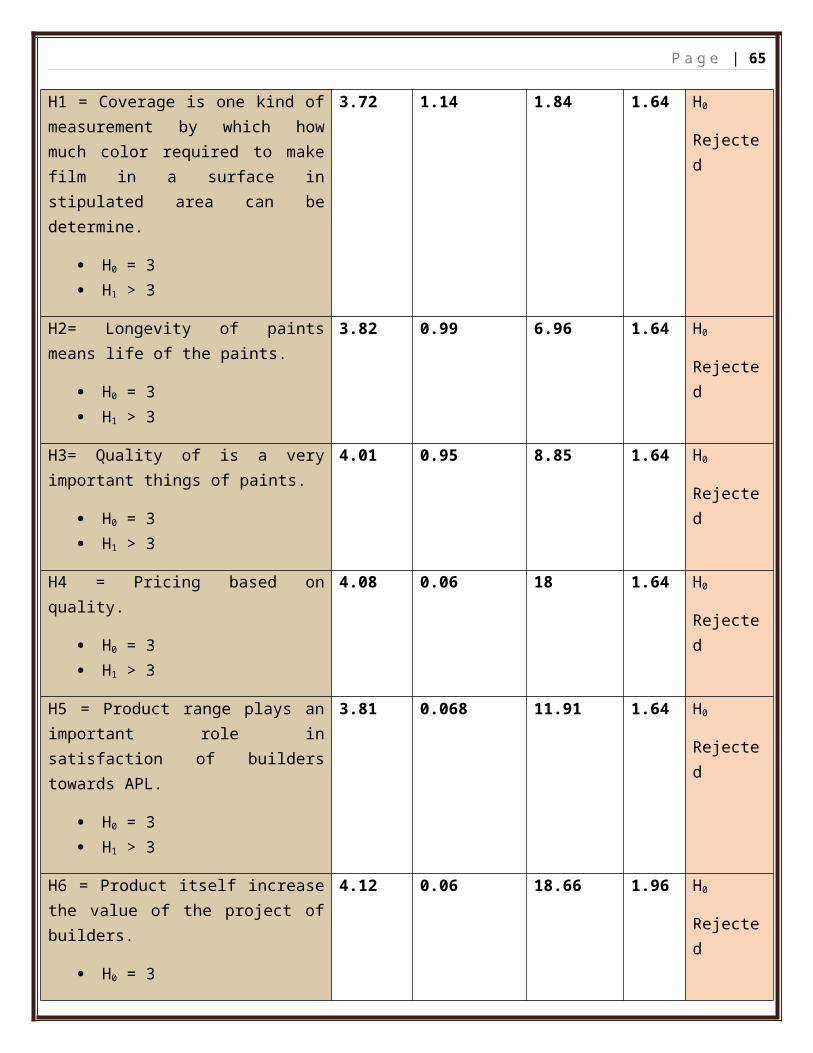
H1 = Coverage is one kind of measurement by which how much color required to make film in a surface in stipulated area can be determine.
H0 = 3 H1 > 3
3.72 1.14 1.84 1.64 H0
Rejected
H2= Longevity of paints means life of the paints.
H0 = 3 H1 > 3
3.82 0.99 6.96 1.64 H0
Rejected
H3= Quality of is a very important things of paints.
H0 = 3 H1 > 3
4.01 0.95 8.85 1.64 H0
Rejected
H4 = Pricing based on quality.
H0 = 3 H1 > 3
4.08 0.06 18 1.64 H0
Rejected
H5 = Product range plays an important role in satisfaction of builders towards APL.
H0 = 3 H1 > 3
3.81 0.068 11.91 1.64 H0
Rejected
H6 = Product itself increase the value of the project of builders.
H0 = 3 H1 ≠ 3
4.12 0.06 18.66 1.96 H0
Rejected
H7 = Company reputation plays an 3.50 0.08 6.25 1.94 H0
P a g e | 50
important role in builders section.
H0 = 3 H1 ≠ 3
Rejected
H8 = Doing business with APL from builders point of view is easy.
H0 = 3 H1≠3
3.31 0.08 3.87 1.94 H0
Rejected
H9 = Brand which is reliable to the builders.
H0 = 3 H1 > 3
3.02 0.22 7.09 1.64 H0
Rejected
H10 = Builders want to use this brand and preferred others builders.
H0 = 3 H1 > 3
3.18 0.16 8.06 1.64 H0
Rejected
H11 = Presales service plays a significant role in the purchase of APL product.
H0 = 3 H1 > 3
3.8 0.074 10.81 1.64 H0
Rejected
H12= After sales service plays a significant role in the purchase of APL product.
H0 = 3 H1 > 3
3.15 1.34 0.93 1.64 H0
Accepted
H13= Delivery on time plays a significant role in the purchase of APL product.
H0 = 3 H1 ≠ 3
3.35 0.22 4.59 1.96 H0
Rejected
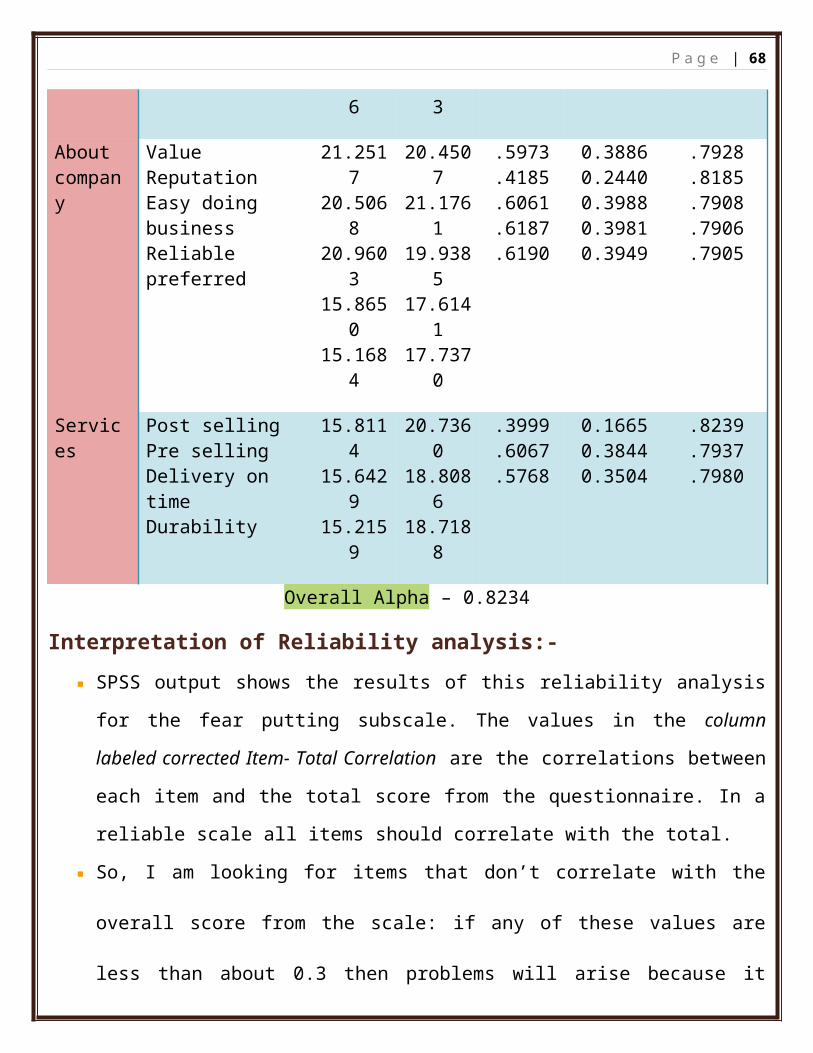
Reliability Analysis
P a g e | 51
The reliability of each scale was assed via ‘item to total correlation ( a method used to understand the reliability of a particular measure where in the responses of individual item in the measure and the sum total of the responses of all the items in the same measure are tested for correlation) and Cronbach coefficient alpha. The results of the reliability analysis are as follows:-
Table e
Scale Items Scale Mean if
item deleted
Scale Variance if item deleted
Corrected item –
Total correlati
on
Squared Multiple
correlation
Alpha if item
deleted
Product CoveragelongevityQualityValue for moneyProduct range
Services Post sellingPre selling Delivery on timeDurability
15.811415.642915.2159
20.736018.808618.7188
.3999
.6067
.5768
0.16650.38440.3504
.8239
.7937
.7980
Overall Alpha – 0.8234
Interpretation of Reliability analysis:-
SPSS output shows the results of this reliability analysis for the fear putting subscale.
The values in the column labeled corrected Item- Total Correlation are the correlations
between each item and the total score from the questionnaire. In a reliable scale all
items should correlate with the total.
P a g e | 52
So, I am looking for items that don’t correlate with the overall score from the scale: if
any of these values are less than about 0.3 then problems will arise because it means
that a particular item does not correlate very well the scale overall. Items with low
correlations may have to be dropped. For these data, all data have items-total
correlations above 0.3, which is encouraging.
The values in the column labeled Alpha if item deleted are the values of the overall if
that items isn’t included in the calculation. As such, they reflect the change in
Cronbach’s that would be seen if a particular item were deleted. The overall is 0.823
and so all values in this column should be around that same value.
What I am actually looking for is values of greater than the overall . If the deletion of
items increases Cronbach’s then this means that the deletion of that item improves
reliability. Therefore, any items that result in substantially greater values of than the
overall may need to be deleted from the scale to improve its reliability.
None of the items here would substantially affect reliability if they were deleted. The
worst offender is question about post selling services: deleting this question would
increase from 0.823 to 0.824. Nevertheless this increase is not dramatic and both
values reflect a reasonable degree of reliability.
Finally, and perhaps most importantly, the value of Alpha at the very bottom is
Cronbach’s: the overall reliability of the scale. In this case is slightly above 0.8 and is
certainly in the region indicated by Kline, so this probably indicates good reliability.
P a g e | 53
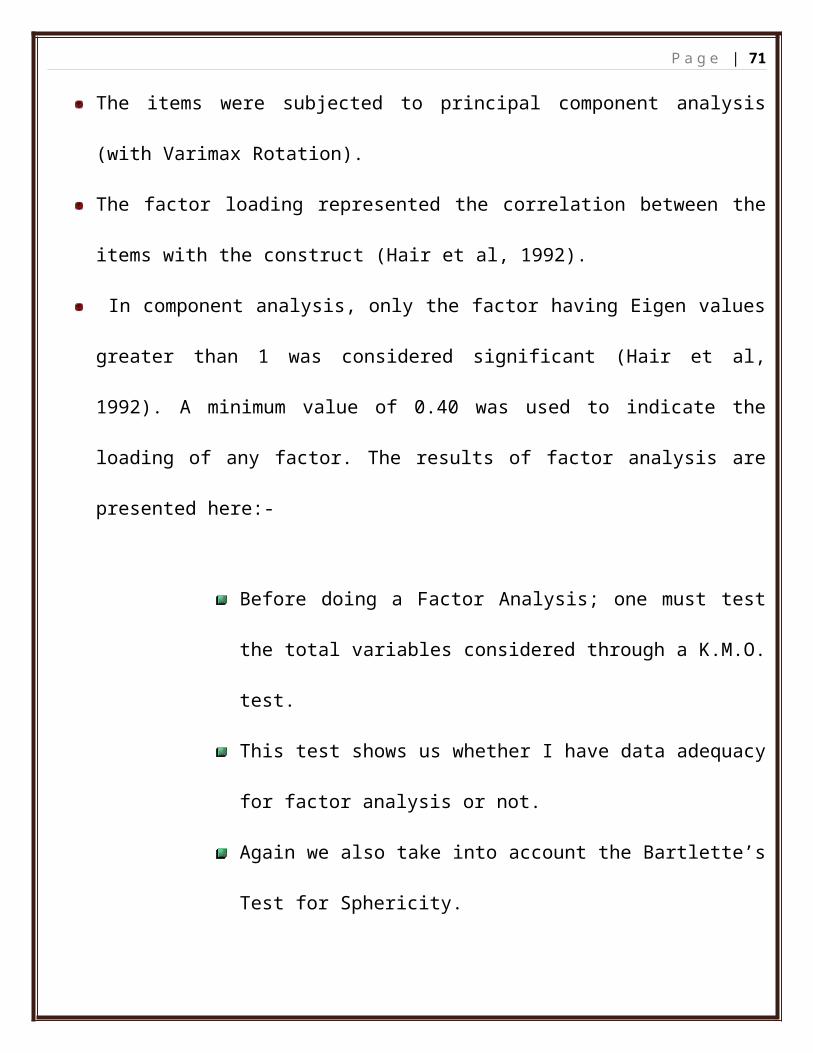
Factor analysisAs the first step in examining the validity of each measure, explanatory factor analysis
was employed using SPSS17.
All the items of all the measures were factor analyzed together to test convergent and
discriminate validity of the measures.
The items were subjected to principal component analysis (with Varimax Rotation).
The factor loading represented the correlation between the items with the construct
(Hair et al, 1992).
In component analysis, only the factor having Eigen values greater than 1 was
considered significant (Hair et al, 1992). A minimum value of 0.40 was used to indicate
the loading of any factor. The results of factor analysis are presented here:-
Before doing a Factor Analysis; one must test the total variables
considered through a K.M.O. test.
This test shows us whether I have data adequacy for factor analysis
or not.
Again we also take into account the Bartlette’s Test for Sphericity.
This state’s whether the intercorrelation matrix did come from a
population in which the intercorrelation matrix is an identity matrix
or not. The results for this test are as follows:-
P a g e | 54
Table f
KMO and Bartlett's Test
Kaiser-Meyer-Olkin Measure of Sampling Adequacy. .711
Bartlett's Test of Sphericity
Approx. Chi-Square 3067.645
df .378Sig. .000
Sample sizeThe K.M.O value of 0.711 indicates that the condition is “good” for further tests to be carried
out.
Bartlett’s test
This tests whether the correlations between questions are sufficiently large for factor analysis to be appropriate. In this case it is significant (x2 (378) = 2989.77, p < .001 indicating that the correlations within the R-matrix are sufficiently different from zero to warrant factor analysis
Now I have the SCREE PLOT showing the Eigen values according to the Components that are
being considered for the Factor Analysis:-
Figure XI
P a g e | 55
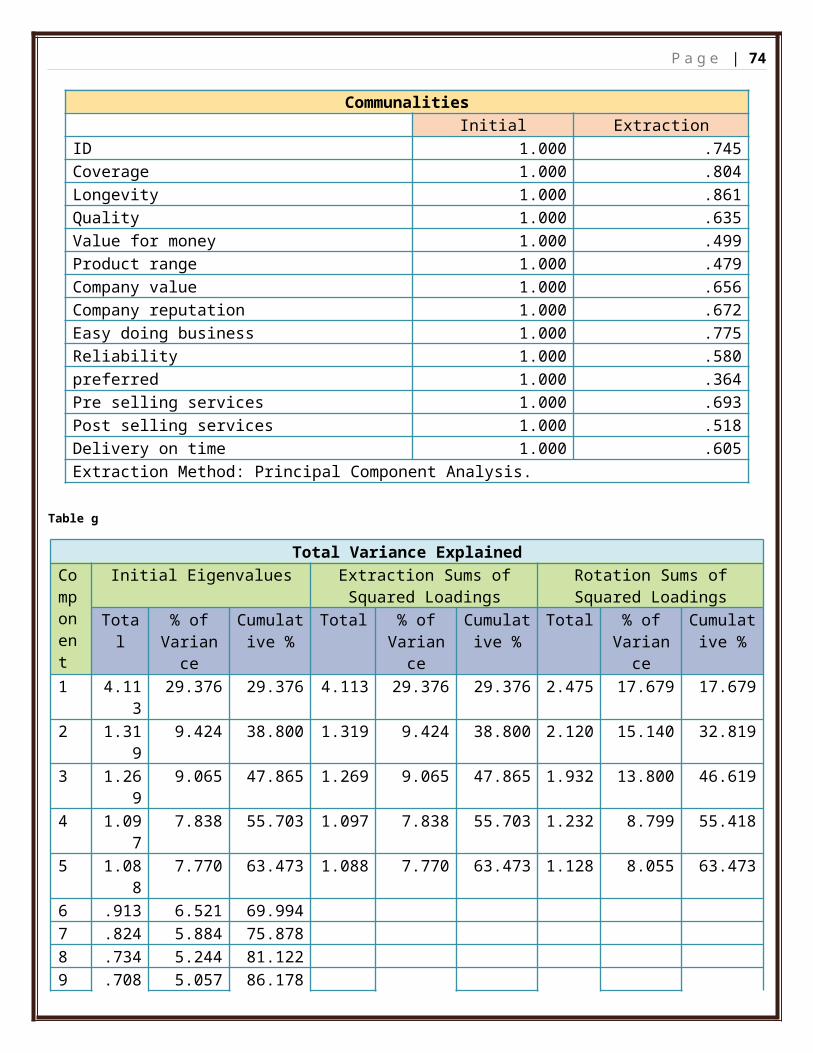
Communalities
Initial Extraction
ID 1.000 .745
Coverage 1.000 .804
Longevity 1.000 .861
Quality 1.000 .635
Value for money 1.000 .499
Product range 1.000 .479
Company value 1.000 .656
Company reputation 1.000 .672
Easy doing business 1.000 .775
Reliability 1.000 .580
preferred 1.000 .364
Pre selling services 1.000 .693
Post selling services 1.000 .518
Delivery on time 1.000 .605
Extraction Method: Principal Component Analysis.
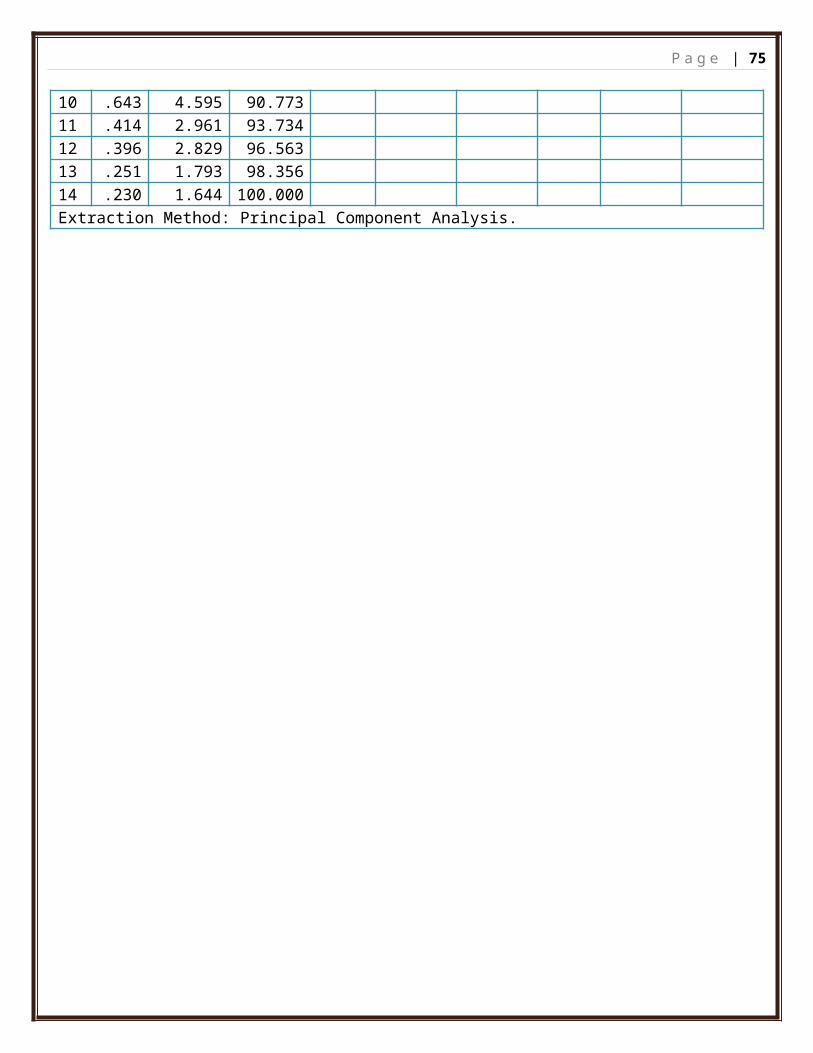
Table g
Total Variance Explained
Component
Initial Eigenvalues Extraction Sums of Squared Loadings
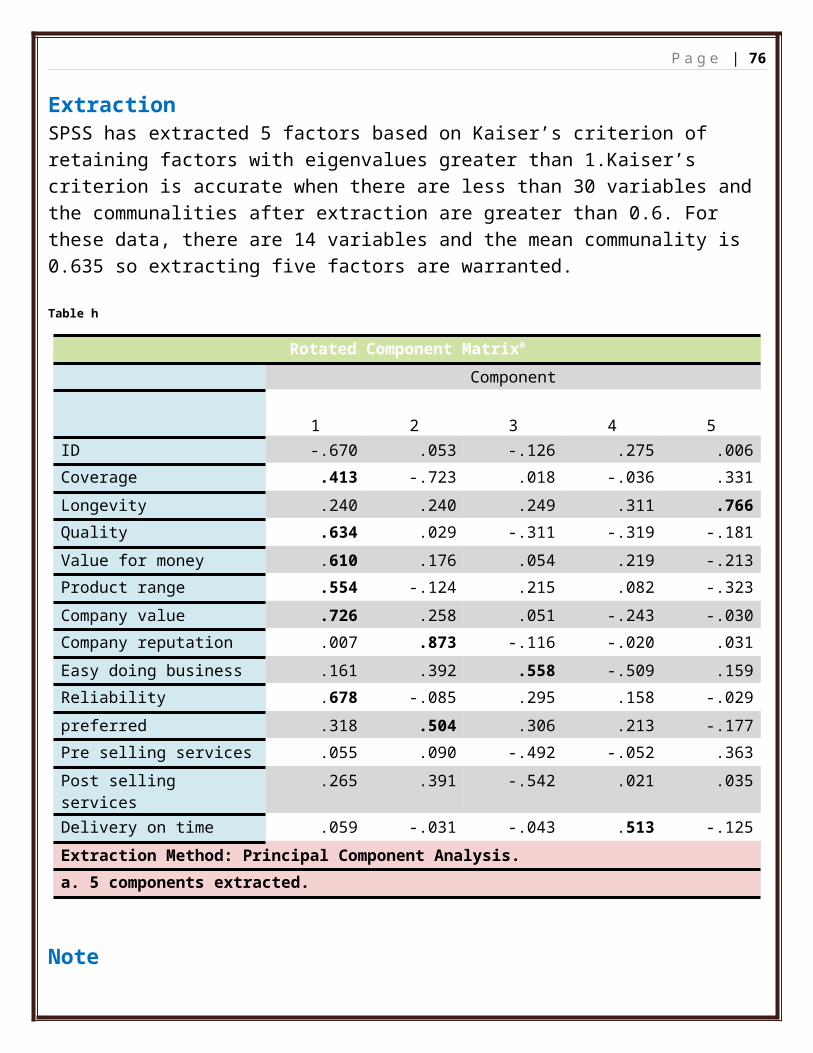
ExtractionSPSS has extracted 5 factors based on Kaiser’s criterion of retaining factors with eigenvalues greater than 1.Kaiser’s criterion is accurate when there are less than 30 variables and the communalities after extraction are greater than 0.6. For these data, there are 14 variables and the mean communality is 0.635 so extracting five factors are warranted.
Table h
Rotated Component Matrixa
Component
1 2 3 4 5
ID -.670 .053 -.126 .275 .006
Coverage .413 -.723 .018 -.036 .331
Longevity .240 .240 .249 .311 .766
Quality .634 .029 -.311 -.319 -.181
Value for money .610 .176 .054 .219 -.213
Product range .554 -.124 .215 .082 -.323
Company value .726 .258 .051 -.243 -.030
Company reputation .007 .873 -.116 -.020 .031
Easy doing business .161 .392 .558 -.509 .159
Reliability .678 -.085 .295 .158 -.029
preferred .318 .504 .306 .213 -.177
Pre selling services .055 .090 -.492 -.052 .363
Post selling services .265 .391 -.542 .021 .035
Delivery on time .059 -.031 -.043 .513 -.125
Extraction Method: Principal Component Analysis.
a. 5 components extracted.
Note
Five factors have been extracted, based on my criterion that only factors with eigenvalues of 1 or more should be extracted. Cumulative percentage of variance explained column extracted five factors together account for 63.4% of the total variance (Information contained in the original ten variables).
P a g e | 57
Extraction
Looking at the pattern matrix and using loading greater than 0.4 as recommended by Stevens, we see the following pattern:-
By this factor analysis, I am able to know above five components have maximum importance to increase the satisfaction level of builders. Therefore, the above five factor/component have significant effect in the satisfaction level of builders and each of the factor is inversely proportional to the satisfaction level. So, emphasizing the above factor leads to improve the satisfaction level of builders.
P a g e | 58
Result at a glance
Figure XII
The entire null hypothesis (H0) are rejected accept after sell services (H12).
It means the builders are not satisfied with the after sell services.
The questioner is fully reliable.
Five factor extracted those are Company value, Company reputation, Easy doing business, Delivery on time and Longevity.
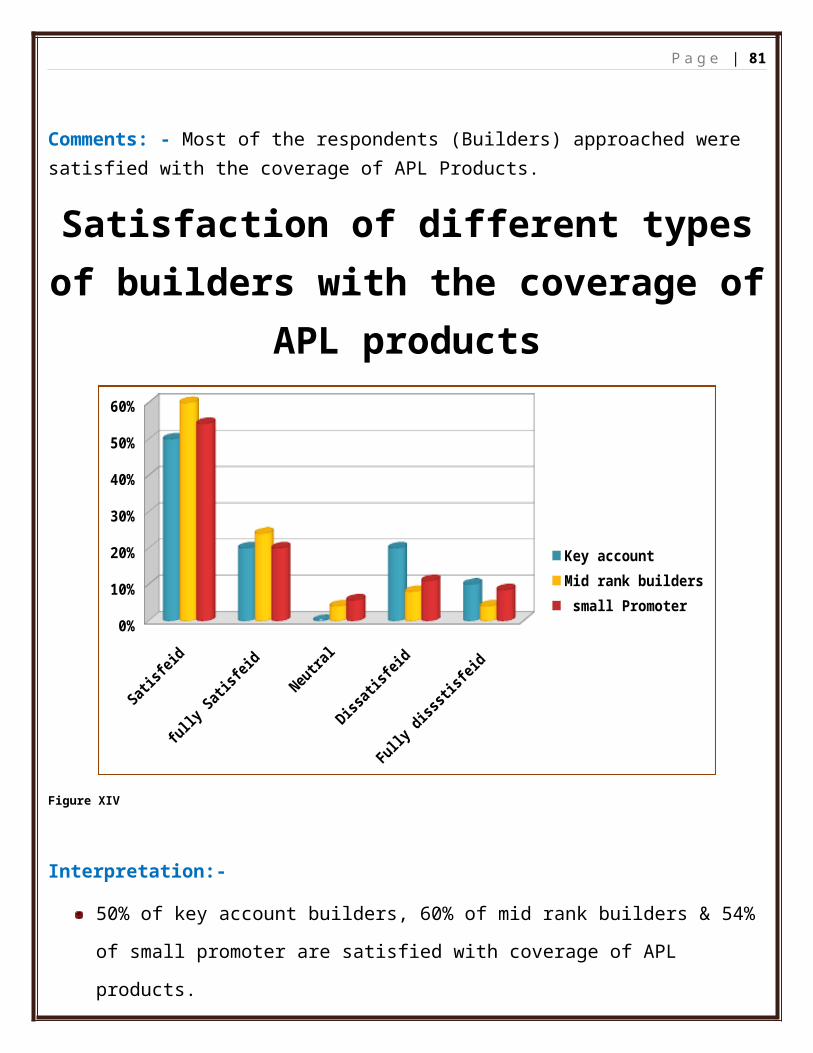
55.7% of builders are satisfied with the coverage of APL Products.21.4% of builders are fully satisfied with the coverage of APL products. Very negligible numbers of builders are dissatisfied (11.4%) and fully dissatisfied (7.14%).4.2% of builders are neutral to their selection.
P a g e | 60
Comments: - Most of the respondents (Builders) approached were satisfied with the coverage of APL Products.
Satisfaction of different types of builders with the coverage of APL products
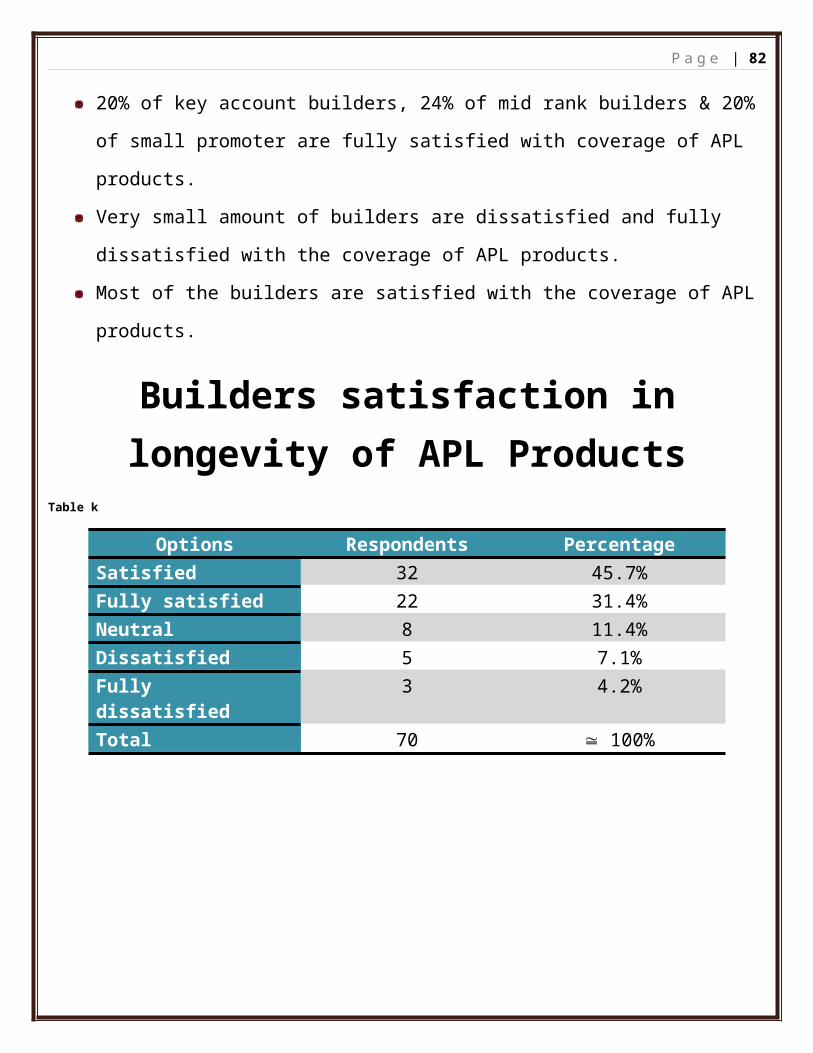
Comments: - Most of the respondents (Builders) approached were satisfied with the longevity of APL products.
Interpretation:-
46% of builders are satisfied & 31% of builders are fully satisfied with the longevity of APL products longevity.11% of builders are neutral to give their suggestion.7.1% and 4.2% of builders are dissatisfied & fully dissatisfied with APL
P a g e | 62
Satisfaction of different types of builders with the longevity of APL products
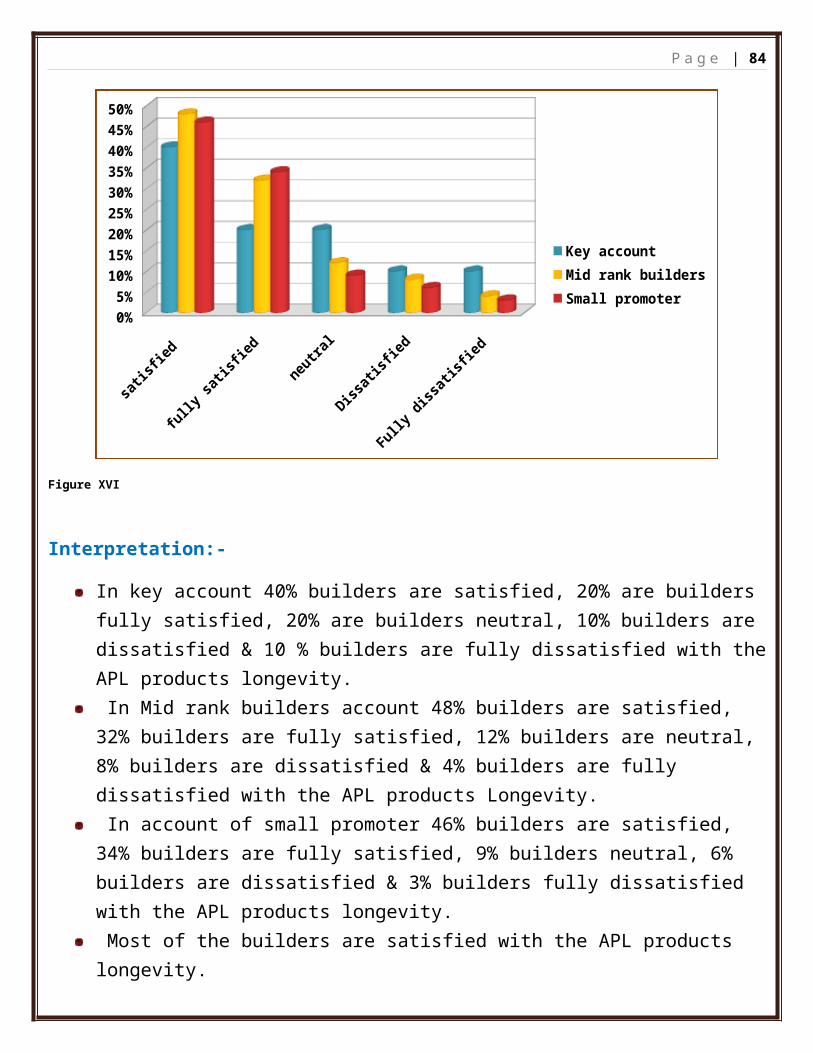
In key account 40% builders are satisfied, 20% are builders fully satisfied, 20% are builders neutral, 10% builders are dissatisfied & 10 % builders are fully dissatisfied with the APL products longevity. In Mid rank builders account 48% builders are satisfied, 32% builders are fully satisfied, 12% builders are neutral, 8% builders are dissatisfied & 4% builders are fully dissatisfied with the APL products Longevity. In account of small promoter 46% builders are satisfied, 34% builders are fully satisfied, 9% builders neutral, 6% builders are dissatisfied & 3% builders fully dissatisfied with the APL products longevity. Most of the builders are satisfied with the APL products longevity.
P a g e | 63
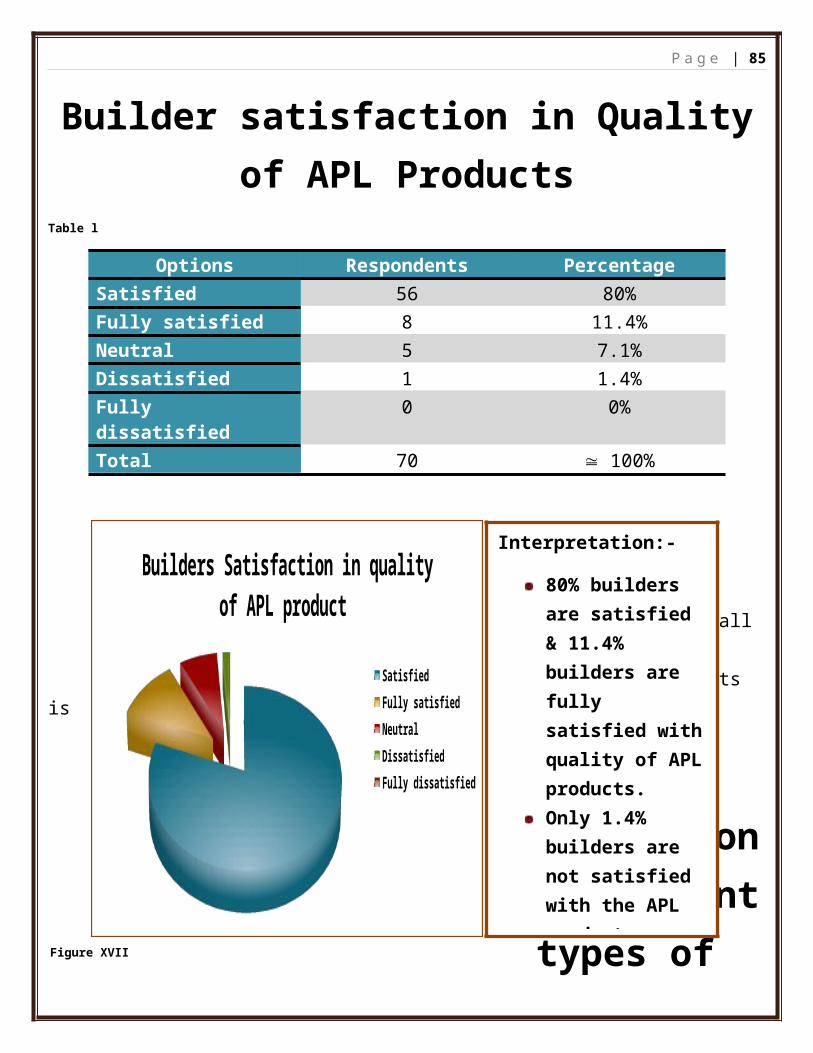
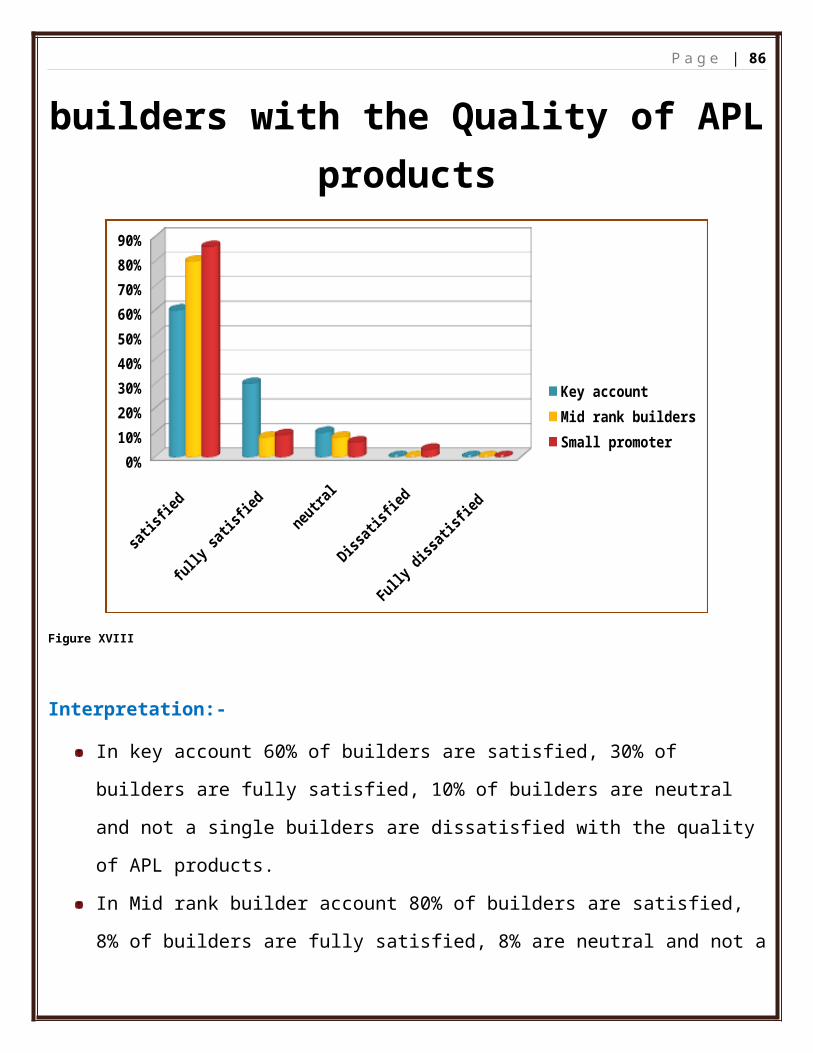
Builder satisfaction in Quality of APL ProductsTable l
45% of builders are satisfied with the value of money of APL products.A huge number of builders give neutral (32%) suggestion in this category.A negligible numbers of builders dissatisfied (4%) or fully dissatisfied (1.42%).
P a g e | 66
Comments: - In this category, a huge numbers of builders felt to understand the exact meaning of value for money, so that they give neutral suggestion.
Satisfaction of different types of builders with the value for money of APL products
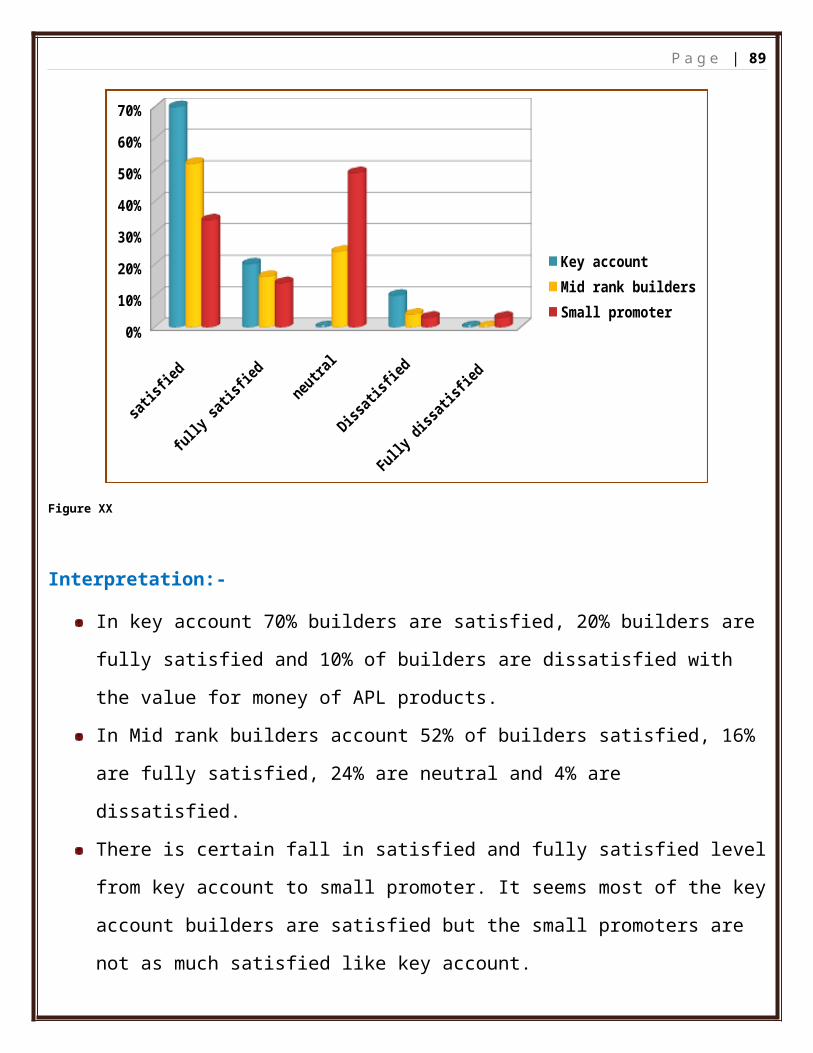
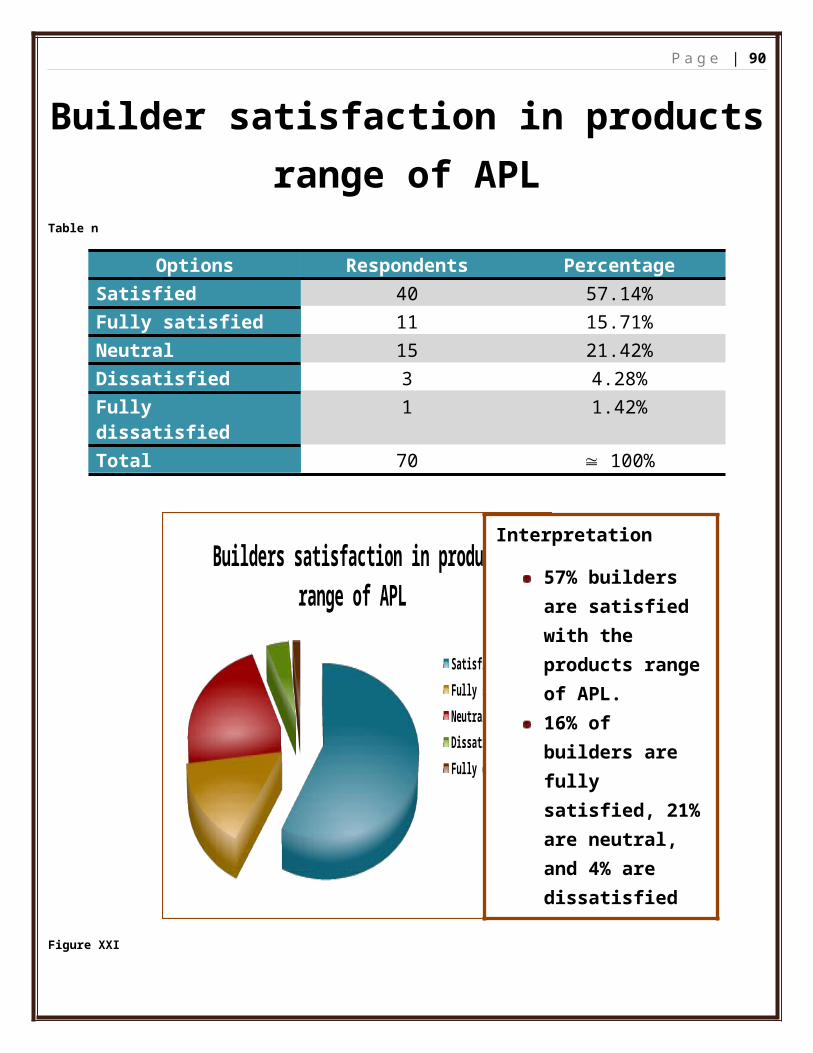
57% builders are satisfied with the products range of APL.16% of builders are fully satisfied, 21% are neutral, and 4% are dissatisfied while 1.42% is fully dissatisfied with the products range of APL.
P a g e | 68
Comments:-It seems APL has satisfactory number of products range which makes builders easy to choice in their project work.
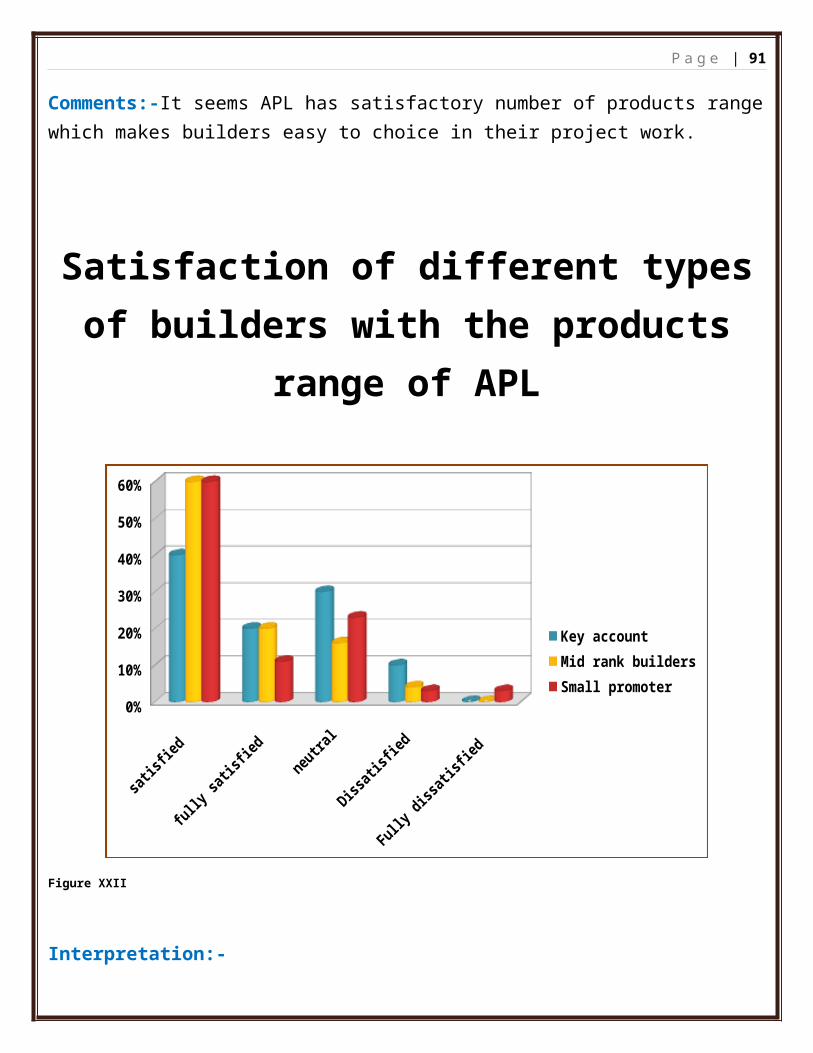
Satisfaction of different types of builders with the products range of APL
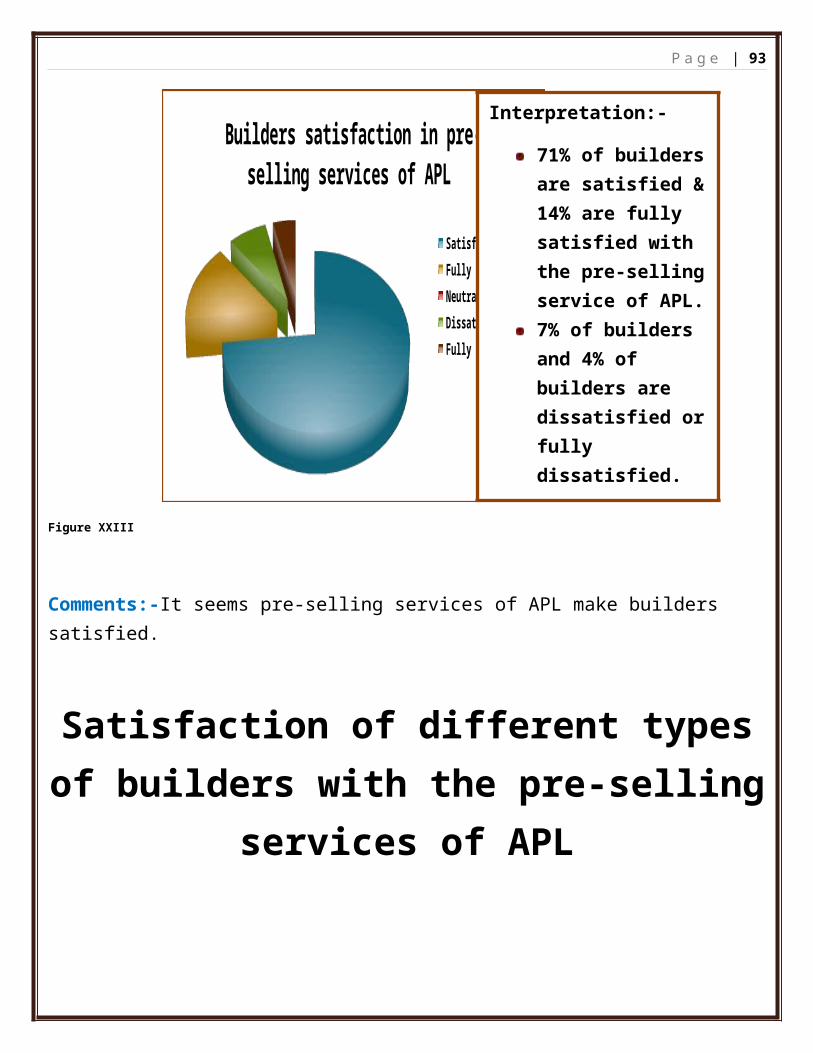
Comments:-It seems pre-selling services of APL make builders satisfied.
Satisfaction of different types of builders with the pre-selling services of APL
Interpretation:-
71% of builders are satisfied & 14% are fully satisfied with the pre-selling service of APL.7% of builders and 4% of builders are dissatisfied or fully dissatisfied.
Comments: - Dissatisfaction and fully dissatisfaction level are high in this category related to other categories.
Builder satisfaction in post-selling services of APL
Interpretation:-
In this category, 21% builders are satisfied and 20% are fully satisfied.17% builders are dissatisfied and 14% builders are fully dissatisfied while 27% are neutral to give their suggestion.
In key account 30% of builders satisfied, 10% are fully satisfied, 20% are neutral while 20% each in dissatisfied and fully dissatisfied category.In mid rank builders account 20% are satisfied, 16% are fully satisfied, 36% are neutral, 12% are dissatisfied while 16% are fully dissatisfied.In small promoter category 20% of builders are satisfied, 26% are fully satisfied, 23% are neutral, 20% are dissatisfied while 11% are fully dissatisfied.
Knowledge about texture finishTable q
Options Respondents Percentage
Yes 11 16%
No 59 84%
Total 70 100 %
P a g e | 74
Knowledge of texture finish
YesNo
Figure XXVII
Comments:-
Majority of the builders are not introduced with the texture finish.
Builders of key account and some of mid rank builders account have knowledge of
texture finish. It seems that there is no uniformity about the knowledge of texture
finish.
Preferred Brand by different types of builders
Interpretation:-
16% of builders have
knowledge of texture
finish while a large chunk
of builders (84%) did not
have any knowledge of
texture finish.
P a g e | 75
Apex Ultima Apex Duracast ACE0%
10%20%30%40%50%60%70%80%90%
100%
Chart Title
Rank 1 Rank 2 Rank 3 Rank 4
Figure XXVIII
Fig:-Most preferred brand by key account
Apex Ultima Apex Duracast ACE0%
10%20%30%40%50%60%70%80%90%
100%
Chart Title
Rank 1 Rank 2 Rank 3
Figure XXIX
Fig:-Most preferred brand by Mid rank builders
Interpretation:-
In rank 1 40% of key account builders preferred Apex Ultima, 30% to Apex, 30% to Duracast.In rank 2 Apex Ultima and Apex 30% each preferred, while Duracast and Ace by 20% each.In rank 3 Apex Ultima and Apex preferred each by 20% builders while Duracast and Ace preferred by 30% each.In rank 4 Apex Ultima preferred 10%, while Apex and Duracast each by 20% and Ace by 50% of builders.
Interpretation:-
In rank 1 Apex Ultima preferred by 40% mid rank builders, Apex by 60%, Duracast by 8% and Ace by 4% only.In rank 2 Apex Ultima preferred by 28%, Apex by 20%, Duracast by 12% and Ace by 40%.In rank 3 Apex Ultima preferred by 20%, Apex by 16%, Duracast by 36% and Ace by 28%.In rank 4 Apex Ultima preferred by 12%, Apex by 16%, Duracast by 44% and Ace by 28%.
P a g e | 76
Apex Ultima Apex Duracast ACE0%
10%20%30%40%50%60%70%80%90%
100%
Chart Title
Rank 1 Rank 2 Rank 3
Figure XXX
Fig: - most preferred brand by Small promoters
Comments:-
It seems there is a great acceptance of Apex Ultima and Duracast in key account
builders.
The mid rank builders are mostly preferred Apex and Apex Ultima while small promoters
preferred Apex, Ace and Apex Ultima.
Interpretation:-
In rank 1 Apex Ultima preferred by small promoter by 26%, Apex by 31% and Ace by 43%.In rank 2 Apex Ultima preferred by 23%, Apex by 26%, Duracast by 11 and Ace by 40%.In rank 3 Apex Ultima preferred by 43%, Apex by 20%, Duracast by 17% and Ace by 20%.In rank 4 Apex Ultima preferred by 9%, Apex by 23% and Duracast by 69%.
P a g e | 77
Comparative analysis of different paints company
ICI Berger Nerolac Shalimer Asianpaints Others0%
20%
40%
60%
80%
100%
Chart Title
Rank 1 Rank 2 Rank 3 Rank 4 Rank 5 Rank 6
Figure XXXI
Fig: -A graph of Comparative analysis according to the satisfaction level of builders
Interpretation:-
Rank 1 has been given to ICI 29% builder, 14% to BERGER, 21% to Nerolac, 3% to Shalimar, 26% Asian paints and 7% to other paint company.Rank 2 has been given to ICI 21% builder, 17% to BERGER, 19% to Nerolac, 6% to Shalimar, 17% to Asian Paints and 7% to Other Paint Co.Rank 3 has been given to ICI 21% builder, 29% to BERGER, 19% to Nerolac, 6% to Shalimar, 17% to Asian Paints and 9% to other Paint Co.Ran 4 has been given to ICI 14% builder, 14% to BERGER, 21% to Nerolac, 31% to Shalimar Paint, 4% to Asian Paints and 10% to other Paint Co.Rank 5 has been given to ICI 4% builder, 14% to BERGER, 11% to Nerolac Paint, 29% to Shalimar, 21% to Asian Paints and 20% to other Paint Co.Rank 6 has been given to ICI 10% builder, 11% to BERGER, 9% to Nerolac Paint, 3% to Asian Paints and 43 % to Other Paint Co.
P a g e | 78
According to builder’s satisfaction in paint Quality, coverage and longevity
ICI Berger Nerolac Shalimer Asianpaints 0thers0%
10%
20%
30%
40%
50%
60%
70%
80%
90%
100%
Rank 6Rank 5Rank 4Rank 3Rank 2Rank 1
Figure XXXII
Fig: - A graph of Comparative analysis according to builder’s satisfaction in paint Quality, coverage and longevity
Interpretation:-
Rank 1 has been given to ICI 40% builder, 3% to BERGER, 16% to Nerolac, 3% to Shalimar, 37% Asian paints and 1% to other paint company.Rank 2 has been given to ICI 28% builder, 10% to BERGER, 18% to Nerolac, 1% to Shalimar, 38% to Asian Paints and 3% to Other Paint Co.Rank 3 has been given to ICI 11% builder, 35% to BERGER, 21% to Nerolac, 7% to Shalimar, 14% to Asian Paints and 10% to other Paint Co.Ran 4 has been given to ICI 10% builder, 37% to BERGER, 23% to Nerolac, 10% to Shalimar Paint, 6% to Asian Paints and 14% to other Paint Co.Rank 5 has been given to ICI 6% builder, 11% to BERGER, 14% to Nerolac Paint, 28% to Shalimar, 3% to Asian Paints and 34% to other Paint Co.Rank 6 has been given to ICI 4% builder, 3% to BERGER, 7% to Nerolac Paint, 42% to Shalimar, 1%to Asian Paints and 37 % to Other Paint Co.
P a g e | 79
According to builder’s satisfaction in company services
ICI Berger Nerolac Shalimer Asianpaints 0thers0%
10%
20%
30%
40%
50%
60%
70%
80%
90%
100%
Rank 6Rank 5Rank 4Rank 3Rank 2Rank 1
Figure XXXIII
Fig:-A graph of Comparative analysis according to builder’s satisfaction in company services
Interpretation:-
Rank 1 has been given to ICI 17% builder, 14% to BERGER, 14% to Nerolac, 11% to Shalimar, 18% Asian paints and 24% to other paint company.Rank 2 has been given to ICI 23% builder, 17% to BERGER, 20% to Nerolac, 7% to Shalimar, 24% to Asian Paints and 8% to Other Paint Co.Rank 3 has been given to ICI 17% builder, 18% to BERGER, 8% to Nerolac, 24% to Shalimar, 17% to Asian Paints and 14% to other Paint Co.Ran 4 has been given to ICI 7% builder, 21% to BERGER, 21% to Nerolac, 14% to Shalimar Paint, 11% to Asian Paints and 24% to other Paint Co.Rank 5 has been given to ICI 21% builder, 11% to BERGER, 21% to Nerolac Paint, 13% to Shalimar, 17% to Asian Paints and 16% to other Paint Co.Rank 6 has been given to ICI 14% builder, 17% to BERGER, 14% to Nerolac Paint, 30% to Shalimar, 11%to Asian Paints and 13 % to Other Paint Co.
P a g e | 80
SWOT analysis for APL project division
Strengths WeaknessAPL is a market leader.
Corporate image of APL is
tremendous.
Establish brand for all economic
segment.
Good range of product backed
by project division.
Good quality of product has
increased the builder
confidence.
A well managed Company with
efficient Sales Force.
The company is giving lot of
support to builders which
increase the confidence of them
and value for money.
Post-selling service is a major
area to improve.
On time delivery is also an area
to improve.
Inadequate sales force to cover
up the Kolkata project area.
Opportunity ThreatRelation build up with the builders is to make them loyal and more business.To gain builders confidence proper and better services has to be provided.
Local paint companies are playing a significant role in builder project sector.Foreign companies may enter any moment in Kolkata project area.
P a g e | 81
FindingsAfter doing the factor analysis I found that most of the builders are satisfied with the
company product quality, longevity and coverage, but the comparative analysis shown
that builders (Mid rank builders & small) are little bit more fascination on ICI product.
Some of the key account builders are going for local paint company, such as Raj Paints
and Century Paint. They are the upcoming competitor of APL.
After completion of factor analysis I found that most of the builders are not satisfied
with the post-selling services of APL.
Pre-selling services of APL are not up to the mark in mid rank builders and small
promoter’s level.
Builders are satisfied with the range of product and value for money in APL Company.
The texture finish of APL has a good response from key account vendors but mid rank
builders/small builders, the same is totally absent.
Availability and delivery on time make some builders dissatisfied.
Most of the builders are choosing their paint product by influencer recommendation.
Architect/Engineers have a big roll to decide the paint company and product to be used
in the project.
New Builders Interaction center for customer APL project sales division
Sales associate
Relationship AssociateAsian paints color world
Relationship Associate
Applicator
Old Builders
Telephone /SMS /Mail Understands the requirement and forwards the lead to relevant project sales service provider
Appendices Communalities: -T he communalities for the variable are computed by taking the sum of
the squared loadings for that variable. This is expressed below:
Cronbach's α (alpha):- Cronbach's α (alpha) is a statistic. It is commonly used as a measure of the internal consistency or reliability of a psychometric test score for a sample of examinees. It was first named alpha by Lee Cronbach in 1951, as he had intended to continue with further coefficients.
Customer relationship management: - Customer relationship management (CRM) is a widely-implemented strategy for managing a company’s interactions with customers, clients and sales prospects.
Dichotomous Questions: - The dichotomous question is generally a "yes/no" question. Distemper: - Distemper is a term with a variety of meanings for paints used in
decorating and as a historical medium for painting pictures. The binding element may be some form of glue or oil; these are known in decorating respectively as soft distemper and oil bound distemper.
Emulsions: - Emulsions are solvent free binders used in the preparation of paints and coatings. Emulsions are manufactured by the polymerization process where monomers are dispersed in an aqueous phase to get a uniform and stable emulsion.
Eigenvalues: - In mathematics, eigenvalue is related concepts in the field of linear algebra. The prefix eigen- is adopted from the German word "eigen" for "innate", "idiosyncratic", "own". Linear algebra studies linear transformations, which are represented by matrices acting on vectors.
Hypothesis:-A statistical hypothesis test is a method of making decisions using
experimental data. In statistics, a result is called statistically significant if it is unlikely to
have occurred by chance. The phrase "test of significance" was coined by Ronald Fisher:
"Critical tests of this kind may be called tests of significance, and when such tests are
available we may discover whether a second sample is or is not significantly different
from the first."
P a g e | 87
In the start of the procedure, there are two hypotheses H0: "the defendant is innocent",
and H1: "the defendant is guilty". The first one is called null hypothesis, and is for the
time being accepted. The second one is called alternative (hypothesis). It is the
hypothesis one tries to prove.
Likert Scale: - A Likert scale is a psychometric scale commonly used in questionnaires, and is the most widely used scale in survey research, such that the term is often used interchangeably with rating scale even though the two are not synonymous.
Nominal scale: - A scale with data classified by names, rather than by any quantitative description.
Ordinal scale:-An ordinal scale is a measurement scale that assigns values to objects based on their ranking with respect to one another.
Probability Sampling Method:-where every sample from the population of builders has equal chances of being selected
Rotated Component Matrix:-In linear algebra, a rotation matrix is a matrix that performs a rotation in Euclidean space. For example the matrix
Scree plot: - A plot, in descending order of magnitude, of the eigenvalues of a correlation matrix. In the context of factor analysis or principal components analysis a scree plot helps the analyst visualize the relative importance of the factors — a sharp drop in the plot signals that subsequent factors are ignorable.
Simple Random Sampling:-Samples were randomly selected from the population of builders.
SPSS:- SPSS is a computer program used for statistical analysis Texture: - Texture in a painting is the feel of the canvas. It can be based on the paint,
and its application, or addition materials such as ribbon, metal, wood, lace, leather and sand. Texture in painting stimulates two different senses, visual and tactile. There are four types of texture in art: actual texture, simulated texture, abstract texture, and invented texture. The concept of 'painterliness' also has bearing on 'texture' in painting.
P a g e | 88
Abbreviation
APL: - Asian paints limited
CRM: - Customer relationship management
INR: - Indian rupees
KMO: - Kaiser-Meyer-Olkin Measure
SPSS:- Statistical Package for the Social Sciences
SWOT :- Strength, weakness, opportunity and threat
P a g e | 89
Annexure 1Questioner:-
PROJECT DETAILS
Project Name
Location/ Address
Floor Area Number of storey
Name of the Builder group
Project type Number of building
Project condition 1. Hot 2. Warm 3. Cold 4. Closed (Company name )
BUILDER DETAILS
Key person(s) of this project Sri
No. of project done No. of ongoing project No. of project in a year
Type of project already done?
Apartment Yes /No Number Description
Institution Yes /No Number Description
Hospital Yes /No Number Description
shopping mall Yes /No Number Description
Others Number Description
Office address
Office number
Contact Number (Mobile) ( Landline)
P a g e | 90
SURVEY QUESTIONNAIRE
Have you ever worked with Asian paints Company for your project? *A) Yes B) No
If yes then how is your working experience with Asian paints Company?A) Poor B) Very poor C) good D)Very Good
If very good then what are the positive point do you think Asian paints Company have?
Excluding Asian paints what are the other paint manufactures you have worked with?A) ICI B) Berger C) Nerolac D)Shalimar E) Others ( )
What are the better services provided by the competitors of Asian paints Company?
What type of extra services Asian paints is unable to provide, which the other company is able to provide?
*If no then what are the reason behind it?
P a g e | 91
Product satisfaction
Coverage of Asian paints products make builders satisfied.
A) Strongly Agree B) Agree C) Neutral D) Disagree E) Strongly Disagree Longevity of Asian paints products make builders satisfied.
A) Strongly Agree B) Agree C) Neutral D) Disagree E) Strongly Disagree
Quality of Asian paints products make builders satisfied.A) Strongly Agree B) Agree C) Neutral D) Disagree E) Strongly Disagree
Value for money of Asian paints products make builders satisfied.
A) Strongly Agree B) Agree C) Neutral D) Disagree E) Strongly Disagree
Product ranges of Asian Paints Company make builders satisfied.A) Strongly Agree B) Agree C) Neutral D) Disagree E) Strongly Disagree
About the Company satisfaction
Painted by Asian Paints Company is increase the value of your Project.
A) Strongly Agree B) Agree C) Neutral D) Disagree E) Strongly Disagree
Reputation of the Asian paints Company plays a significant role to doing business with builders.
A) Strongly Agree B) Agree C) Neutral D) Disagree E) Strongly Disagree
Easy to doing business plays a significant role to doing business with builders.
A) Strongly Agree B) Agree C) Neutral D) Disagree E) Strongly Disagree
Asian paints is reliable brand.
A) Strongly Agree B) Agree C) Neutral D) Disagree E) Strongly Disagree
Asian paints is the most preferred brand.
A) Strongly Agree B) Agree C) Neutral D) Disagree E) Strongly Disagree
Service satisfaction
Pre selling services of Asian paints make builders satisfied. A) Strongly Agree B) Agree C) Neutral D) Disagree E) Strongly Disagree
Post selling services of Asian paints make builders satisfied.A) Strongly Agree B) Agree C) Neutral D) Disagree E) Strongly Disagree
Delivery on time plays a significant role to doing business with builders.A) Strongly Agree B) Agree C) Neutral D) Disagree E) Strongly Disagree
P a g e | 92
Are you have a knowledge of exterior textures finish.
A) Yes B) No Following which Asianpaints exterior brands you prefer most? (Rank the flowing as 1,2,3,4,)
A) Apex Ultima B) Apex C) ACE D) Duracast
Following which Asianpaints exterior textures finish you prefer most. (Rank the flowing as 1,2,3,4,)
A) Finetex B) Swirltex C) Dholpurtex D)Roughtex
(Rank the flowing as 1,2,3,4, for very poor, poor, good and very good respectively)
Based upon your experience please rank the following brands according to your satisfaction.
A) ICI B) Berger C) Nerolac D) Shalimar E) Other Company D)Asian paints
Based upon your experience please rank the following brands according to paint coverage, quality and longevity.
A) ICI B) Berger C) Nerolac D) Shalimar E) Other Company D)Asian paints
Based upon your experience please rank the following brands according to service of the company.
A) ICI B) Berger C) Nerolac D) Shalimar E) Other Company D)Asian paints
P a g e | 93
Annexure 2
Picture of decorative external Asian Paints product