A Permanent-Magnet Quadrupole
Final-Focusing Optics at
PLEIADES Inverse Compton X-ray
Source
J. K. Lim , P. Frigola, J. B. Rosenzweig
& G. Travish (UCLA)
S. G. Anderson, D. J. Gibson, F. V. Hartemann
& A. M. Tremaine (LLNL)
• PLEIADES Phase I: Standard EM quadrupole– 15T/m in quad strength
– Over 50 micron spotsize at best
• Phase II: Permanent Magnet Quadrupole– Strong quad strength
– Under 20 micron spotsize
– Aiming for 5 micron spotsize w/ improved beamquality (~1mm-mrad emittance)
• Inverse Compton Scattering (ICS) x-ray yieldupgrades with strong PMQ focusing lens– Initial experiment run
Application of High-Density
Electron Beam
(An invited talk given by S. Anderson at this workshop)
Motivation for Strong Permanent-
Magnet Quadrupole
()()()() 0 00 // /
• For a few cm focal length and Lq=1cm,
chromatic aberration limits demagnification;
need stronger magnet B’ (short focal length)
Final spot size vs initial
~3.6 10-2 mm-mrad
=10 meter
=0.6%
5 micron spotsize
• Chromatic aberration from ratio of
final to initial beam-size is
Halbach design
• There’s minimum in beam-sizewhen 0/f p/p, demagnification
is2/pp
High-field Gradient obtained from PMQ
PMQ unit
B = 2Br1
ri
1
ro
For ri=7.5mm, ro=5mm and Br=1.2T
Field gradient of idealized PMQ is
640T/m
RADIA – 3D magnet simulation:
Linearity good to r ~ 2 mmB = 573 T/m
Effective length = 10.4 mm
10203040501020304050
2D field plotin bore region
RADIA PMQ Tolerance + ELEGANT
• RADIA magnet error tolerances:– ± 50 m bore radius error
± 3% B’ variation
– 2% wedge shape and easy axis
orientation allowable
Skew quad (rotation error)
PMQ bore radius error
• ELEGANT skew quad effects:
– Transverse magnet position
error has no significant beam
effect
– 10 mrad rotation (skew) error
produces significant emittance
growth
Measurements of built PMQs
agree with RADIA simulations
1. Manufacturing process ensures
consistency between PMQs,
minimizes skew errors.
2. Field linearity good to r ~ 2 mm.
3. Magnetic-mechanical centers within 25 µm
4. Hall probe measurement
gives B’ = 560 T/m
• Final focus system can’t tune with B’
• System adjusted by magnet spacing; L1, L2, L3
– F-DD-FF configuration
• Experiments showed adjustability of the PMQ beam lens in 30-100MeV beam energy range final -functions in 1-6 mm range
+2f -f +f
Adjustable PMQ Final Focus
System
Beam Transport Simulation
0.03 0.0 0.0 00.0 0.0 0.03
Trace3D (particle-transport code)
Electron Beam energy 30MeV
Electron Beam energy 60MeV
7.8mm 1.4mm 12mm
17.5mm 15.9mm 24.2mm
Elegant (2nd order transport code)
Drift spaces
Elegant Input parameters:
xn,yn =10mm-mrad, x,y ~6.5mm/mrad,
~116
Output parameters:
x,y ~1mm/mrad, x,y= ~10µm spot size!
Increase drift space as focal length goes up
for stronger triplet quads
0.04 0.0200.020.04yHmmL 20 10010
At the focal point
(includes chromatic aberration effect)
y
x’
y’
x
The PMQ mover system meets
experimental requirements
• CNC machined “PMQ holders” constrained by rail system
– < 25 µm PMQ to system center-line throughout range of motion
• Push-rods + stepper motors + LabVIEW for on-line, < 50 µm
resolution longitudinal positioning
• Alignment verified optically with theodolite in PLEIADES beamline
PMQ mover assembly PLEIADES PMQ final focus
Final focus performance is
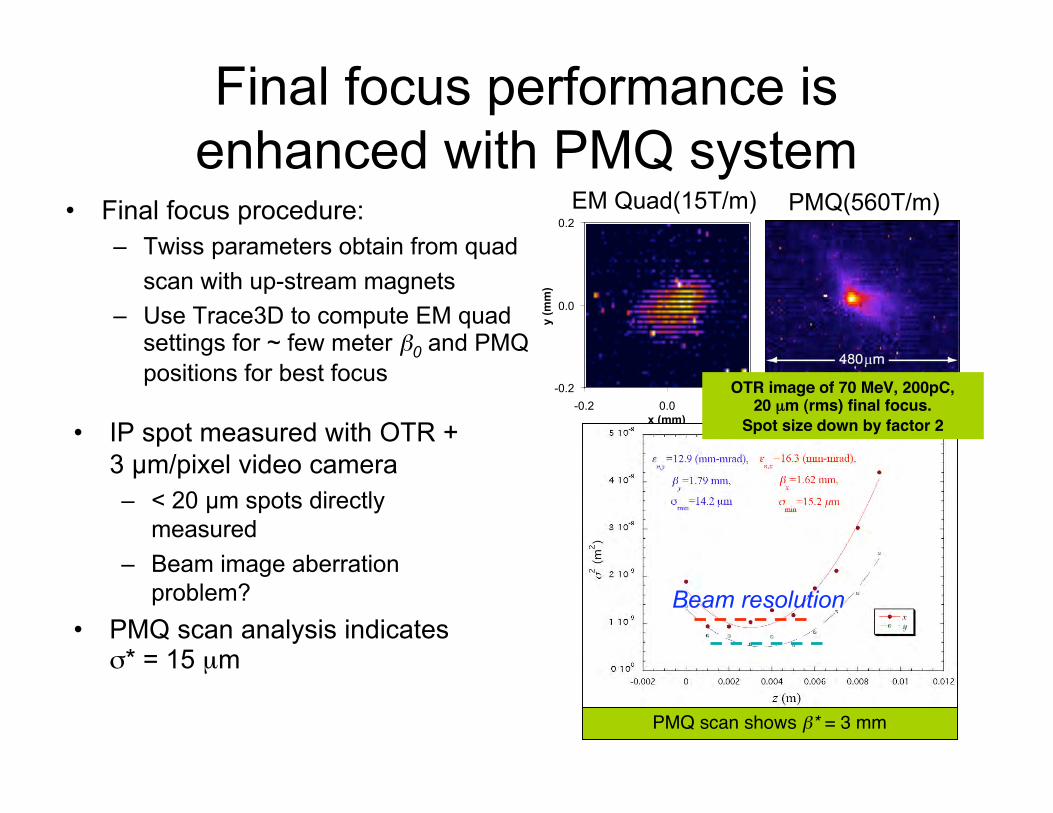
enhanced with PMQ system• Final focus procedure:
– Twiss parameters obtain from quad
scan with up-stream magnets
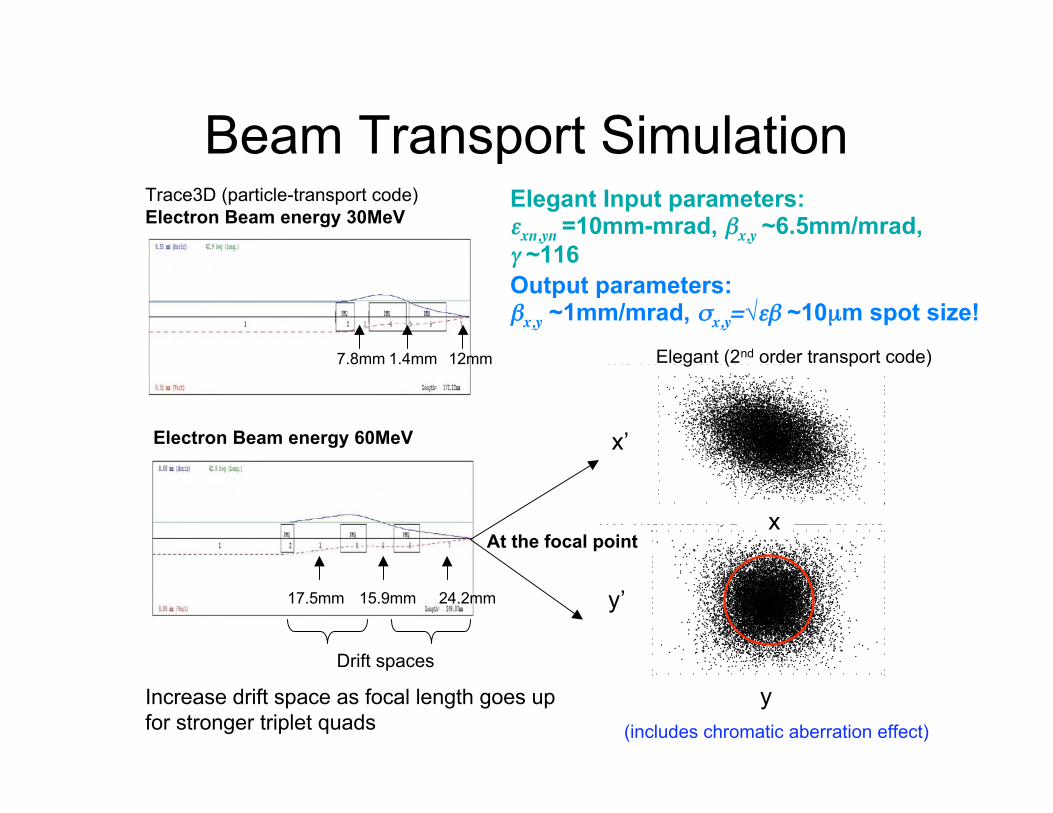
– Use Trace3D to compute EM quadsettings for ~ few meter 0 and PMQ
positions for best focus
• IP spot measured with OTR +
3 m/pixel video camera
– < 20 m spots directly
measured
– Beam image aberration
problem?
• PMQ scan analysis indicates* = 15 µm
PMQ scan shows * = 3 mm
-0.2
0.0
0.2
-0.2 0.0 0.2
x (mm)
y (
mm
)
-0.2
0.0
0.2
-0.2 0.0 0.2
x (mm)
y (
mm
)
EM Quad(15T/m) PMQ(560T/m)
OTR image of 70 MeV, 200pC,20 µm (rms) final focus.
Spot size down by factor 2
Beam resolution
Camera depth-of-focus/OTR
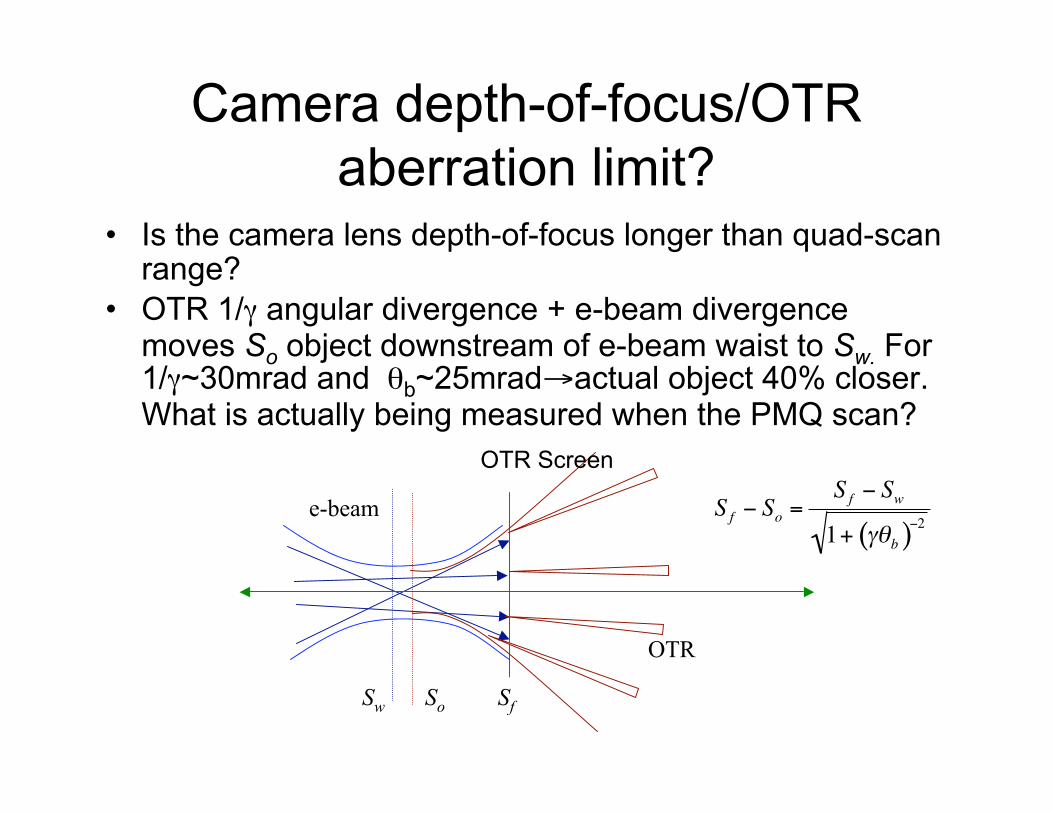
aberration limit?• Is the camera lens depth-of-focus longer than quad-scan
range?
• OTR 1/ angular divergence + e-beam divergencemoves So object downstream of e-beam waist to Sw. For1/ ~30mrad and b~25mrad actual object 40% closer.What is actually being measured when the PMQ scan?
SfSoSw
OTR
e-beam S f So =S f Sw
1+ b( )2
OTR Screen
The PLEIADES energy-tunable
x-ray source• Tunable, bright, ICS hard x-ray source
• 810 nm, 250 mJ, 54 fsec, Ti:Sapphire
laser
• Under 20 micron beam spotsize w/ PMQ
at ICS interaction
104
105
106
107
108
40 60 80 100 120 140
X-r
ay d
ose
(pho
tons
)
X-ray Energy (keV)
X-ray flux vs. energy
PMQ FINAL FOCUSING LENShas significantly increased source
flux and brightness.
100 MeV/m
Charge = 0.3 nC
n = 5 mm-mrad
f = 2.85 GHz (S-Band)
E = 20 - 100 MeV
¬ t = 3 ps (uncompressed)
¬ t < 300 fs (compressed)
RF Gun+LINAC
()() 5/2222.1%BWxxxx
Permanent Magnet
Quadrupole Assembly
Interaction
Point
Electron Dump
Dipole
Expanding and
Collimating Lenses
Mirror with
Hole
Beryllium
Window
Crystal
Polarizing
Beamsplitter
Waveplate
Laser Window
Pump
Delay
Focusing
Parabola
Incoming
Laser
Incoming
Electrons
Exiting
Electrons
Shielded X-Ray
CCD1" Steel
0.375"
Lead
.125" Aluminum
Alignment
Cube
PMQ
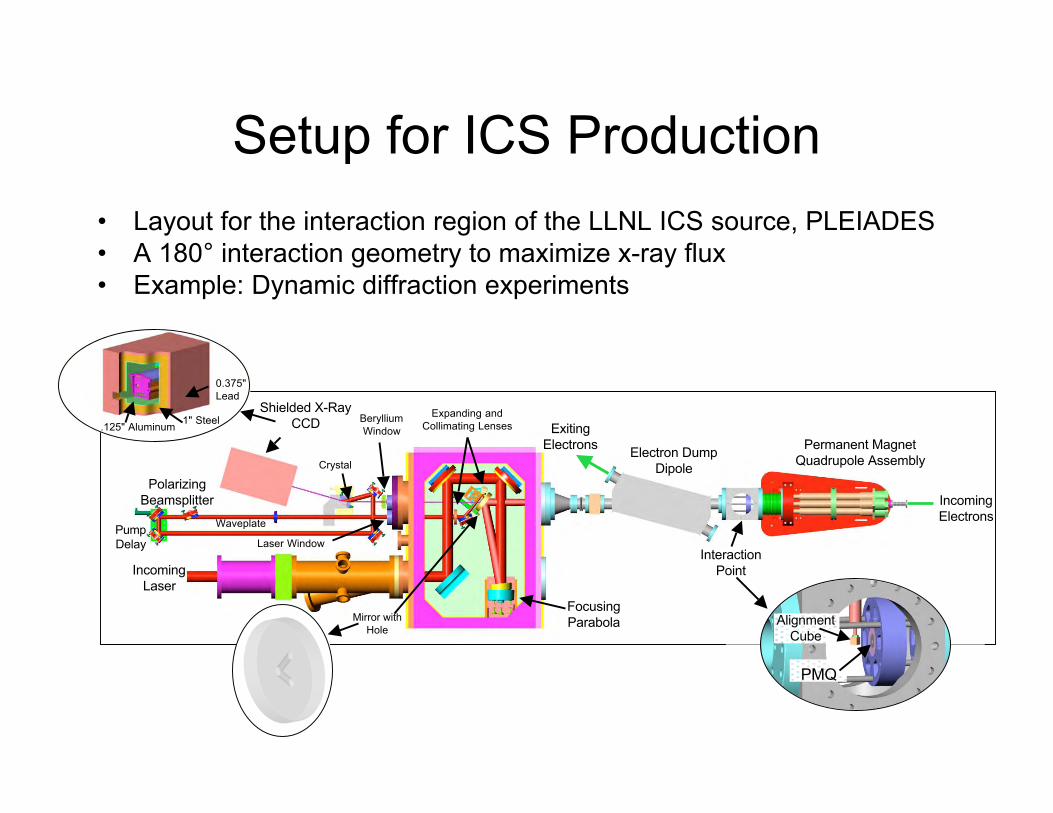
Setup for ICS Production
• Layout for the interaction region of the LLNL ICS source, PLEIADES
• A 180° interaction geometry to maximize x-ray flux
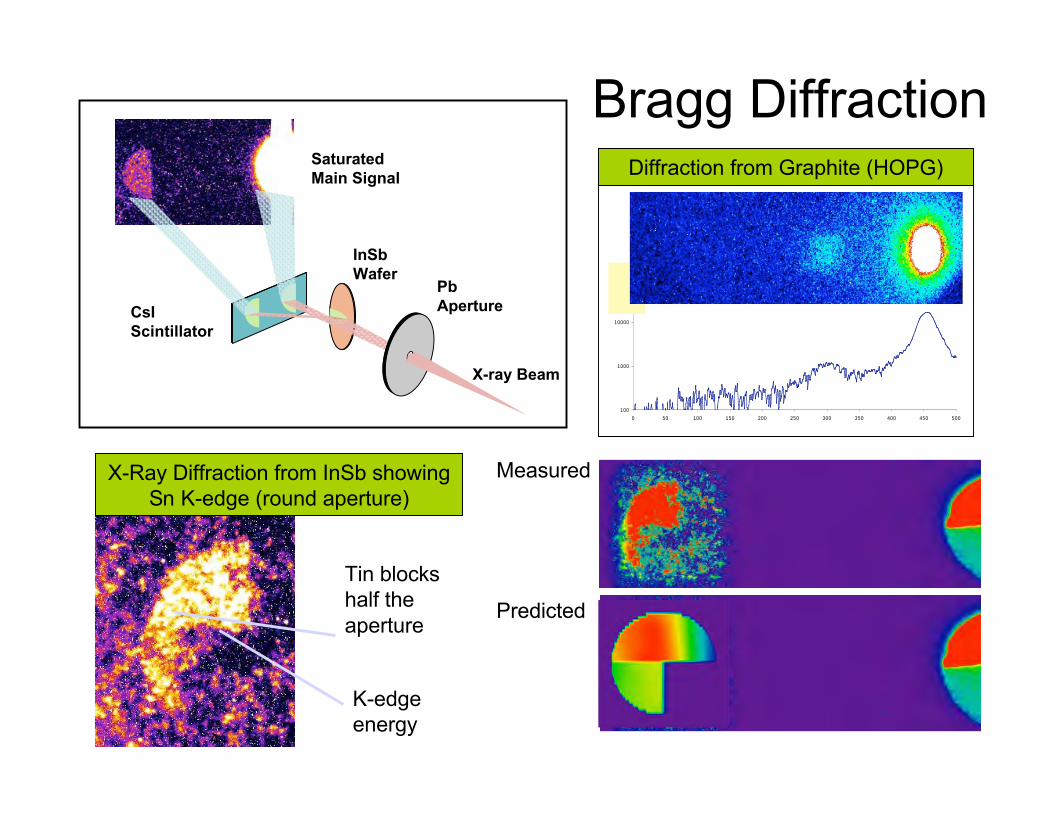
• Example: Dynamic diffraction experiments
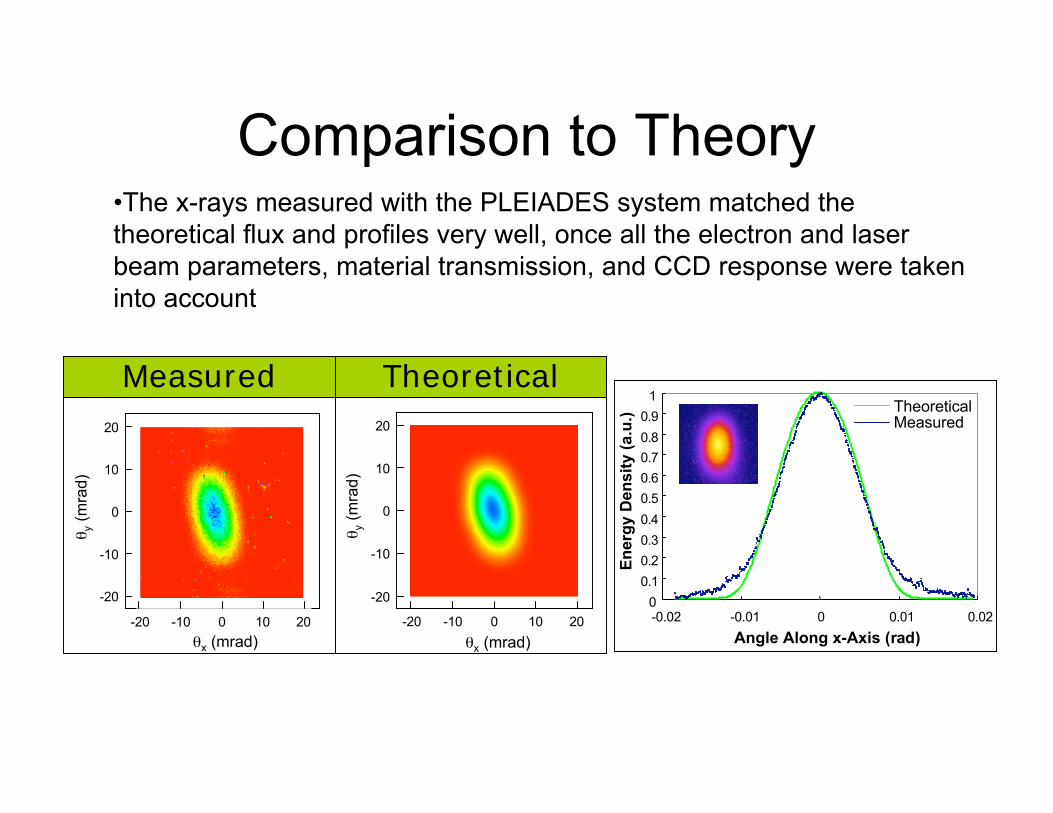
•The x-rays measured with the PLEIADES system matched the
theoretical flux and profiles very well, once all the electron and laser
beam parameters, material transmission, and CCD response were taken
into account
-20 -10 0 10 20
-20
-10
0
10
20
x (mrad)
y (
mra
d)
Measured
-20 -10 0 10 20
-20
-10
0
10
20
x (mrad)
y (
mra
d)
Theoretical
0
0.1
0.2
0.3
0.4
0.5
0.6
0.7
0.8
0.9
1
-0.02 -0.01 0 0.01 0.02
Angle Along x-Axis (rad)E
nerg
y D
en
sit
y (
a.u
.)
TheoreticalMeasured
Comparison to Theory
Laser excitation heat,shock, initiate chemicalreaction, etc
µs
ns
ps
fs
• heat diffusion
• buckling
• thermal expansion
• phase transitions/ melt
• electron/ phonon relaxation
• protein folding
• transport in hot plasmas
• chemical reaction dynamics
t
X-ray probe pulse(delayed afterexcitation pulse)
Compressed material(phonon or shock)
Diffraction
t
Photon energyX-r
ay a
bso
rptio
n
EXAFS features
Absorptionedge
Disordered/melted material
X-raysource
Absorptionspectroscopy
or
PLEIADES
X-ray Diffraction Studies
Tin blocks
half the
aperture
K-edge
energy
X-Ray Diffraction from InSb showing
Sn K-edge (round aperture)
Predicted
Measured
100
1000
10000
100000
0 50 100 150 200 250 300 350 400 450 500
Diffraction from Graphite (HOPG)
Pb
Aperture
InSb
Wafer
Saturated
Main Signal
CsI
Scintillator
X-ray Beam
Bragg Diffraction