A Physics-Based Rock Friction Constitutive Law:Steady State FrictionEinat Aharonov1 and Christopher H. Scholz2
1Institute of Earth Sciences, Hebrew University, Jerusalem, Israel, 2Lamont-Doherty Earth Observatory, Columbia University,Palisades, NY, USA
Abstract Experiments measuring friction over a wide range of sliding velocities find that the value ofthe friction coefficient varies widely: friction is high and behaves according to the rate and stateconstitutive law during slow sliding, yet markedly weakens as the sliding velocity approaches seismic slipspeeds. We introduce a physics-based theory to explain this behavior. Using conventional microphysicsof creep, we calculate the velocity and temperature dependence of contact stresses during sliding,including the thermal effects of shear heating. Contacts are assumed to reach a coupled thermal andmechanical steady state, and friction is calculated for steady sliding. Results from theory provide goodquantitative agreement with reported experimental results for quartz and granite friction over 11 ordersof magnitude in velocity. The new model elucidates the physics of friction and predicts the connectionbetween friction laws to independently determined material parameters. It predicts four frictionalregimes as function of slip rate: at slow velocity friction is either velocity strengthening or weakening,depending on material parameters, and follows the rate and state friction law. Differences betweensurface and volume activation energies are the main control on velocity dependence. At intermediatevelocity, for some material parameters, a distinct velocity strengthening regime emerges. At fast sliding,shear heating produces thermal softening of friction. At the fastest sliding, melting causes furtherweakening. This theory, with its four frictional regimes, fits well previously published experimental resultsunder low temperature and normal stress.
Plain Language Summary Experiments measuring friction over a wide range of sliding velocitiesfind that the value of the friction coefficient varies widely: friction is high during slow sliding, yet markedlyweakens as the sliding velocity rises to seismic slip rates. We introduce a physics-based theory to explainthis behavior. Our model assumes friction is controlled by creep at contacts that form between the slidingsurfaces. It also assumes that when sliding is fast contacts heat up, and this affects friction profoundly. Ourmodel is able to quantitatively predict, for the first time, reported experimental results for steady statefriction at all experimentally measured slip rates. This is done using material parameters that are measuredfrom other experiments, unrelated to friction. The new model may have far reaching implications forunderstanding friction in general and for earthquake physics in particular.
1. Introduction
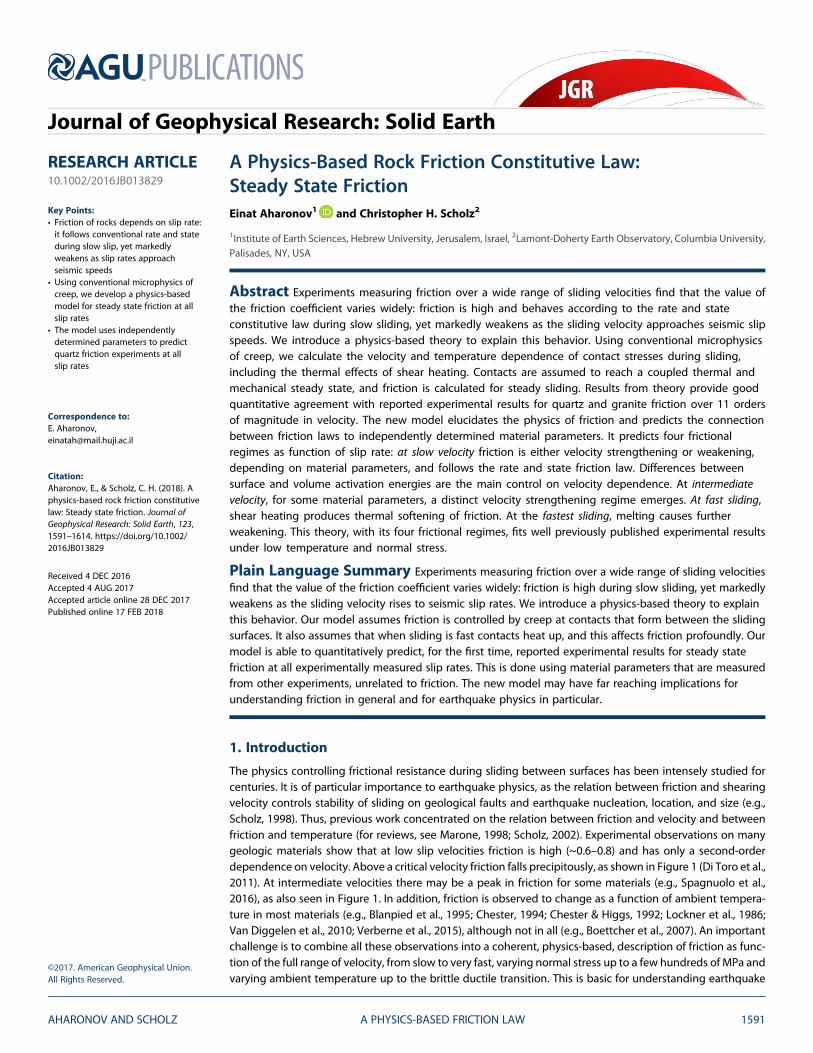
The physics controlling frictional resistance during sliding between surfaces has been intensely studied forcenturies. It is of particular importance to earthquake physics, as the relation between friction and shearingvelocity controls stability of sliding on geological faults and earthquake nucleation, location, and size (e.g.,Scholz, 1998). Thus, previous work concentrated on the relation between friction and velocity and betweenfriction and temperature (for reviews, see Marone, 1998; Scholz, 2002). Experimental observations on manygeologic materials show that at low slip velocities friction is high (~0.6–0.8) and has only a second-orderdependence on velocity. Above a critical velocity friction falls precipitously, as shown in Figure 1 (Di Toro et al.,2011). At intermediate velocities there may be a peak in friction for some materials (e.g., Spagnuolo et al.,2016), as also seen in Figure 1. In addition, friction is observed to change as a function of ambient tempera-ture in most materials (e.g., Blanpied et al., 1995; Chester, 1994; Chester & Higgs, 1992; Lockner et al., 1986;Van Diggelen et al., 2010; Verberne et al., 2015), although not in all (e.g., Boettcher et al., 2007). An importantchallenge is to combine all these observations into a coherent, physics-based, description of friction as func-tion of the full range of velocity, from slow to very fast, varying normal stress up to a few hundreds of MPa andvarying ambient temperature up to the brittle ductile transition. This is basic for understanding earthquake
AHARONOV AND SCHOLZ A PHYSICS-BASED FRICTION LAW 1591
PUBLICATIONSJournal of Geophysical Research: Solid Earth
RESEARCH ARTICLE10.1002/2016JB013829
Key Points:• Friction of rocks depends on slip rate:it follows conventional rate and stateduring slow slip, yet markedlyweakens as slip rates approachseismic speeds
• Using conventional microphysics ofcreep, we develop a physics-basedmodel for steady state friction at allslip rates
• The model uses independentlydetermined parameters to predictquartz friction experiments at allslip rates
Citation:Aharonov, E., & Scholz, C. H. (2018). Aphysics-based rock friction constitutivelaw: Steady state friction. Journal ofGeophysical Research: Solid Earth, 123,1591–1614. https://doi.org/10.1002/2016JB013829
Received 4 DEC 2016Accepted 4 AUG 2017Accepted article online 28 DEC 2017Published online 17 FEB 2018
physics, assessing stability of faults, and predicting the brittle-ductile transition in the Earth (e.g., Marone &Scholz, 1988; Scholz, 1988, 1998).
1.1. Previous Work on the Physics of Friction—Micromechanics of Contacts
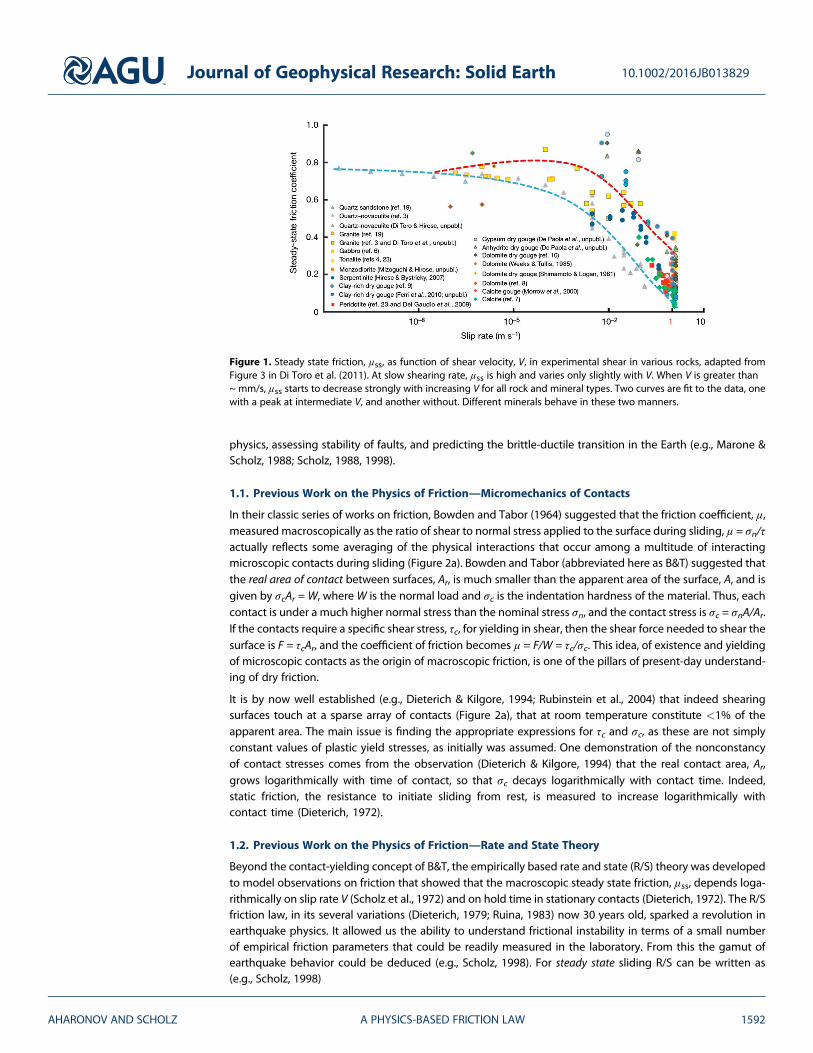
In their classic series of works on friction, Bowden and Tabor (1964) suggested that the friction coefficient, μ,measured macroscopically as the ratio of shear to normal stress applied to the surface during sliding, μ = σn/τactually reflects some averaging of the physical interactions that occur among a multitude of interactingmicroscopic contacts during sliding (Figure 2a). Bowden and Tabor (abbreviated here as B&T) suggested thatthe real area of contact between surfaces, Ar, is much smaller than the apparent area of the surface, A, and isgiven by σcAr = W, whereW is the normal load and σc is the indentation hardness of the material. Thus, eachcontact is under a much higher normal stress than the nominal stress σn, and the contact stress is σc = σnA/Ar.If the contacts require a specific shear stress, τc, for yielding in shear, then the shear force needed to shear thesurface is F = τcAr, and the coefficient of friction becomes μ = F/W = τc/σc. This idea, of existence and yieldingof microscopic contacts as the origin of macroscopic friction, is one of the pillars of present-day understand-ing of dry friction.
It is by now well established (e.g., Dieterich & Kilgore, 1994; Rubinstein et al., 2004) that indeed shearingsurfaces touch at a sparse array of contacts (Figure 2a), that at room temperature constitute <1% of theapparent area. The main issue is finding the appropriate expressions for τc and σc, as these are not simplyconstant values of plastic yield stresses, as initially was assumed. One demonstration of the nonconstancyof contact stresses comes from the observation (Dieterich & Kilgore, 1994) that the real contact area, Ar,grows logarithmically with time of contact, so that σc decays logarithmically with contact time. Indeed,static friction, the resistance to initiate sliding from rest, is measured to increase logarithmically withcontact time (Dieterich, 1972).
1.2. Previous Work on the Physics of Friction—Rate and State Theory
Beyond the contact-yielding concept of B&T, the empirically based rate and state (R/S) theory was developedto model observations on friction that showed that the macroscopic steady state friction, μss, depends loga-rithmically on slip rate V (Scholz et al., 1972) and on hold time in stationary contacts (Dieterich, 1972). The R/Sfriction law, in its several variations (Dieterich, 1979; Ruina, 1983) now 30 years old, sparked a revolution inearthquake physics. It allowed us the ability to understand frictional instability in terms of a small numberof empirical friction parameters that could be readily measured in the laboratory. From this the gamut ofearthquake behavior could be deduced (e.g., Scholz, 1998). For steady state sliding R/S can be written as(e.g., Scholz, 1998)
Figure 1. Steady state friction, μss, as function of shear velocity, V, in experimental shear in various rocks, adapted fromFigure 3 in Di Toro et al. (2011). At slow shearing rate, μss is high and varies only slightly with V. When V is greater than~ mm/s, μss starts to decrease strongly with increasing V for all rock and mineral types. Two curves are fit to the data, onewith a peak at intermediate V, and another without. Different minerals behave in these two manners.
Journal of Geophysical Research: Solid Earth 10.1002/2016JB013829
AHARONOV AND SCHOLZ A PHYSICS-BASED FRICTION LAW 1592
τ ¼ σn μss ¼ σn μ� þ a� bð Þ ln V=V�ð Þ½ � (1)
The constants μ* and V* are often chosen arbitrarily, and the constant coefficients a and b quantify the effectof direct velocity dependence and state dependence of friction, respectively. In this framework, the relativevalues of a and b control stability of sliding and therefore are suggested to control earthquake nucleation(Dieterich, 1978; Scholz, 1998). Equation (1) was shown by many experiments to provide a good descriptionof sliding friction at slow velocities (e.g., see reviews in Marone, 1998; Baumberger & Caroli, 2006).
R/S is very different in concept from B&T theory, as it was developed as an empirical constitutive relationwithout considering the physics of contacts. Yet although the ln(V/V*) term in equation (1) was introducedempirically by Dieterich (1979, 1978) and Ruina (1983), many studies suggest that it arises from thermally acti-vated creep processes at asperity contacts (e.g., Baumberger, 1997; Baumberger & Caroli, 2006; Brechet &Estrin, 1994; Chester, 1994; Heslot et al., 1994; Nakatani, 2001; Noda, 2008; Putelat et al., 2011; Rice et al.,2001). Since at room temperature real contact area is typically <1% of the nominal area (e.g., Dieterich &Kilgore, 1994; Rubinstein et al., 2004), assuming 10 MPa applied normal stress, each contact experiencesstress of the order of 1 GPa. At such high stress, creep is expected to be exponential in stress and may pro-ceed by one or several of the following physio-chemical mechanisms: stress corrosion, leading to subcriticalcrack growth (Atkinson, 1987) and static fatigue (Scholz, 1972); Peierls-type mechanisms impeding disloca-tion glide (Evans & Goetze, 1979; Rice et al., 2001; Tsenn & Carter, 1987) and solution transfer creep (pressuresolution) (Nakatani & Scholz, 2004a, 2004b). In friction there are two components of creep that must be con-sidered: normal creep that shortens the contact and increases its area, and creep on contact surfaces thataccommodates shear sliding (Figure 2b). Thermally activated creep in both components was used toexplain/predict the observed R/S behaviors, for both slow (e.g., Baumberger & Caroli, 2006; Brechet &Estrin, 1994; Li & Rubin, 2017; Nakatani, 2001; Nakatani & Scholz, 2004a, 2004b; Perfettini & Molinari, 2017)and intermediate rate sliding (Bar-Sinai et al., 2014; Noda, 2008).
1.3. Recent Work on the Physics of Friction—High Slip Rate
A different behavior from the R/S logarithmic behavior occurs at high slip rate. Using new high-speed experi-mental apparatuses, a dramatic weakening was observed at all sliding materials at around V~O(10�2) m/s,independent of material, as shown in Figure 1. This high-velocity weakening has been attributed to a varietyof mechanisms, all of them related to shear heating: (1) “Flash heating” of highly stressed, short-lived, contactasperities. Heated contacts soften and weaken, and even melt at high V (e.g., Beeler et al., 2008; Goldsby &Tullis, 2011; Proctor et al., 2014; Rice, 2006; Yao et al., 2016); (2) chemical/phase changes occurring above acertain temperature: for example, decomposition in carbonates (e.g., Goren et al., 2010; Sulem & Famin,2009), silica gel formation in quartz (e.g., Goldsby & Tullis, 2002; Kirkpatrick et al., 2013), or antigorite
(a) (b)
Figure 2. (a) Illustration of shearing rough surfaces, depicting that the real contact area, Ar, is much smaller than theapparent area of contact. (b) Zoom into a single asperity contact. The red fuzzy area depicts a highly compressed regionthat may undergo internal creep, with the maximum compression area depicted in yellow. This creep, driven by normalstress, may occur by dislocation glide within this region, pressure solution, or subcritical fracture growth, causingasperity convergence and flattening compensated by contact area growth. In contrast, the green region demarcates thecontact interface, where shear-activated creep is localized. Note that the two creep processesmay be different and that thisdifference strongly affects friction.
Journal of Geophysical Research: Solid Earth 10.1002/2016JB013829
AHARONOV AND SCHOLZ A PHYSICS-BASED FRICTION LAW 1593
serpentinite transformation into talc (Kohli et al., 2011); (3) thermal pressurization due to shear heating ofpore fluids (e.g., Faulkner et al., 2011; Ferri et al., 2010; Goren & Aharonov, 2007, 2009; Goren et al., 2010;Noda & Lapusta, 2013; Rice, 2006); (4) localization and thermo-elastic instabilities (e.g., Braeck &Podladchikov, 2007; Brown & Fialko, 2012; Kelemen & Hirth, 2007; Platt et al., 2014; Siman-Tov et al., 2015),possibly also driven by decomposition (Platt et al., 2015); (5) special behavior of nanograin layers that oftencover principle slip zones in faults (e.g., Chen et al., 2013; De Paola et al., 2015; Green et al., 2015; Reches &Lockner, 2010; Siman-Tov et al., 2013, 2015; Verberne et al., 2014, 2014).
Much of the above mentioned work (as well as other work) on high V sliding have been quite successful inexplaining steady state friction as a function of velocity. Yet nearly always these studies allowed fitting of freeparameters and so did not involve full constraint by material parameters. In addition, none of the above workwas able to carry the physics from low to high V, and from low to high ambient temperature and normalstress. They all looked at some window of the velocity, normal stress, and temperature phase space.
To summarize the current state of affairs in theoretical understanding of rock friction: separate theories existfor slow and fast shearing, many based on the Bowden and Tabor concept, and many are fitted somewhatfreely. To the best of our knowledge, there is currently no unifying, physics-based model, which may beapplied to different minerals, to predict friction across velocities and ambient temperatures. Such a modelis needed to predict sliding stability of faults (e.g., Noda & Lapusta, 2013; Scholz, 1998) and the brittle-ductiletransition (e.g., Shimamoto & Noda, 2014).
1.4. This Work
The R/S friction laws, being empirical, were rather opaque, lending themselves to various interpretationsof the physical processes represented by earthquake behavior and their relationships with the para-meters in the laws. It was naively hoped that the friction parameters would be dependent only on thematerial, so that measurements of these for a few key fault-forming minerals would map out the seismo-genic nature of faults in various environments. Laboratory measurements now show that the steady statefriction parameters, even for a given mineral type, vary in complex ways with sliding velocity, tempera-ture, normal stress, and with the microstructure formed on the fault sliding surfaces (e.g., Blanpied et al.,1995; Carpenter et al., 2016; Chester & Higgs, 1992; den Hartog et al., 2012; Verberne et al., 2014,2014, 2015).
These developments make it clear that for further progress to be made a physics-based friction law thatincorporates the R/S friction elements needs to be developed. Here we present some basic steps in that direc-tion. We present a single, physics-based, friction law to explain friction observations in rocks, across a widerange of rock types, slip velocities, and temperatures, predicting the data in Figure 1 and similar experimentalfindings. Our theory models friction at all velocities continuously, from low to high contact temperatureregimes, connecting previously proposed physics of contact creep at low contact temperature, to flashheating at intermediate contact temperature and to flash melting/decomposition at high contact tempera-ture. Although our model is general, we apply our results first to quartz and granite, as these materials havecurrently the largest number of friction data. Also, most of the thermodynamic parameters that appear in ourformulation of the friction law can be estimated from independent measurements for quartz. Hence, forquartz-rich rocks we can make quantitative and independent comparisons of theory with friction experi-ments, rather than relying on data fitting.
Specifically, we show below that our model may explain and predict the following general observations thatare not material specific: (a) high friction and second-order material-dependent V dependence at low V. (R/Sfriction law behavior); (b) material-dependent peak at intermediate V; (c) material independent abruptthermally induced velocity weakening above a critical V; and (d) all material dependencies result from inde-pendently determined variations in material properties.
2. Theory2.1. Assumption 1: Friction Arises From Creep of Contacts, and Is Predictable From Contact Stresses
We follow B&T, assuming friction arises from interactions of highly stressed contacts of microscopic asperitiesbetween surfaces and grains. The contacts exhibit time-dependent shortening and spreading under theapplied normal load, so that the asperity height h shortens with time via thermally activated creep driven
Journal of Geophysical Research: Solid Earth 10.1002/2016JB013829
AHARONOV AND SCHOLZ A PHYSICS-BASED FRICTION LAW 1594
by the normal stress on the contact, σc. Since plasticity maintains volume, their contact area grows as theyshorten, thereby reducing the contact stress σc. In a similar manner, shearing is assumed to occur at a rateV via thermally activated shear creep, driven by the shear stress on contacts, τc. This formalism for the physicsof friction has been extensively developed over the last decades (e.g., Baumberger & Caroli, 2006; Brechet &Estrin, 1994; Heslot et al., 1994; Nakatani, 2001; Putelat et al., 2011; Rice et al., 2001). Creep is assumed todepend exponentially on contact stresses τc and σc (e.g., Chester, 1994; Evans & Goetze, 1979; Tsenn &Carter, 1987). As mentioned above exponential creep represents low-temperature creep such as occurs insubcritical crack growth (e.g., Wiederhorn & Bolz, 1970), Peierls creep (e.g., Ashby & Verrall, 1973), andpressure solution. The application of low-temperature plasticity for asperity creep is also supported by experi-mental observations of dislocation activation at grain contacts (Boettcher et al., 2007). Thermal activationdepends on contact temperature, Tc, and uses the general expression for exponential creep based on ratetheory (e.g., Poirier, 1985). Under these assumptions, the equations for the shearing velocity V and contact(asperity) compaction (or convergence) velocity, dh/dt, are
V ¼ Vsmax exp �Qs � τcNΩs
RTc
� �; (2a)
dhdt
¼ �Vnmax exp �Qv � σcNΩv
RTc
� �; (2b)
where N is the Avogadro number, R is the gas constant, and h is the asperity height. Vsmax and Vnmax arereference, (highest possible), shear and normal creep rates, achieved when contact stresses are at theirhighest possible value τc ¼ τ�c = Qs/NΩs and σc ¼ σ�c = Qv/NΩv, respectively. Equations (2a)–(2b) describethermally activated creep in which the deformation is controlled by thermally activated jumps dictated bya pinning potential field with valley depth Q (activation energy) and spacing of valleys of the order of Ω1/3
(activation volume). Equations (2a) and (2b) are basically equations (6) and (12) of Putelat et al. (2011),respectively. It is important to note that activation energy, Qs, and activation volume, Ωs, for surface (shear)creep, may differ from bulk volumetric creep parameters, Qv and Ωv, which control flattening of the asper-ity by creep deep within the asperity, as depicted in Figure 2b. (To avoid confusion that may arise from theterm “volumetric,” we clarify that the asperity flattening creep process occurs at constant volume.)Potentially, different processes could control the flattening and shear deformations. Even under the sameprocess, the application of a von Mises yield criterion predicts a geometrical difference between the resis-tance to shortening and shear of asperities. In addition, varying water content will change the activationenergy as function of distance from the contact. Since shear occurs at the contact interface while flatten-ing occurs within the contact volume, differing dislocation densities, with increased dislocation densitynear the surface, could affect the different processes. Defect density, related to dislocation density, mayalso correlate with interstitial water content. The values of activation energies and activation volumesfor shear and normal creep will be shown below to control both the base value of the friction coefficientand its velocity dependence.
Although equations (2a) and (2b) are symmetrical, the two dependencies of σc and τc on shear velocity V aredifferent. This difference is due to the different boundary conditions in the normal and tangential directions:while steady state sliding experiments impose the shear velocity V as a boundary condition, the conver-gence rate dh/dt is not imposed. Its temporal evolution is solved from equation (2b). To solve equation (2b),we assume that contacts in steady state sliding are created and destroyed continuously. Steady state entailsthat each contact has a lifetime that depends on sliding rate V and contact size d. For each contact themoment it is born is t = 0, at which time the height of the contact is h0, its radius is r0, and the normal stress
on it is σ0c . Following Brechet and Estrin (1994), Baumberger and Caroli (2006), and Putelat et al. (2011), weassume constant contact volume during plastic deformation, that is, r2h = r0
2h0, where r is contact radius attime t. For steady state sliding we assume constant number of equal-sized circular contacts, n, per unit area,so σnA = σcAr = σcnπr
2. Thus, σc = σ0ch/h0 and dσc/dt = (σ0c/h0) dh/dt. From these, equation (2b) may be rewrit-ten as
dσcdt
¼ �Vnmaxσ0ch0
exp �Qv � σcNΩv
RTc
� �: (2c)
Journal of Geophysical Research: Solid Earth 10.1002/2016JB013829
AHARONOV AND SCHOLZ A PHYSICS-BASED FRICTION LAW 1595
We can now integrate (2c) to calculate the contact stress, σc(t), as function of time since formation of the
contact, the thermodynamic variables, and the initial contact stress σ0c .
σc tð Þ ¼ σ0c 1� b0 ln 1þ t=tcð Þ½ �; (2d)
b0 ¼ RTc
σ0cNΩv; tc ¼ b0
h0Vnmax
expQv � NΩvσ0c
RTc
� �(2e)
The characteristic time constant, tc, was defined as the “cutoff time” by Berthoud et al. (1999), and its physicalmeaning will be detailed in section 6.
In order to evaluate σc, the contact stress at time t = 0, σ0c; is needed. σ0c was assumed in previous the-
oretical analysis (Putelat et al., 2011) to be equal to QvNΩv
. However, there are several reasons to think that
σ0c = B QvNΩv
;with 0 < B < 1:
1. There is no physical argument that dictates that the two values—σ0c the indentation hardness at time ofcontact initiation and the thermodynamic parameter, Qv
NΩv, should be equal.
2. An assumption of B = 1, that is,σ0c =QvNΩv
, forces contact-normal creep rate (dh/dt in equation (2b)) at t = 0 tobe independent of temperature, while it is reasonable to expect it to be thermally activated—to vanish atTc = 0 and increase to maximum rate, Vnmax, at Tc➔∞. This argument leads to 0 < B < 1.
3. Using σ0c = QvNΩv
(i.e., B = 1) in equation (2e) predicts two things: that the cutoff time tc grows linearlywith Tc (due to b0), and that the activation energy for tc, Ec, is 0. In contrast, assuming B < 1 dictatesthat tc is thermally activated, with an activation energy Etc = (1 � B)Qv. In this case tc has an exponen-tial dependence on 1/T, in agreement with the experimental findings of Nakatani and Scholz (2004a,Figure 7).
4. The indentation hardness at time t = 0, σ0c , and thus also B, are expected to decrease with ambient tem-perature, following Evans (1984), who measured that indentation hardness of quartz drops by 30–50% astemperature is raised from 0 to 500°C. So not only is B < 1, it is even not a constant. Instead, it drops withthe ambient temperature T0.
5. In addition to depending on T and stress, creep rate dh/dt will also depend on the dislocation density.Creep laws are derived for steady state, but the initial creep response will occur with dislocation densitymuch less than that at steady state, allowingmuch faster initial creep owing to a lack of “work hardening.”It is common to observe rapid transient creep during dislocation creep (i.e., lower yield strength thansteady state strength). Thus, the assumption σ0c ¼ Qv
NΩv, that is, that the indentation hardness has the high-
est possible value at t = 0 clearly overestimates σ0c .
We now rewrite equations (2a)–(2e) doing two things—first, inverting equation (2a) to obtain τc as function ofV, providing equation (3b). Second, use the contact lifetime in steady state sliding rate t = d/V (where d = 2r isthe contact diameter), in place of time in equation (2d) (see, e.g., section 2 of Baumberger & Caroli, 2006 forjustification of this approximation):
σc tð Þ ¼ σ0c 1� b0 ln 1þ dVtc
� �� �(3a)
τc tð Þ ¼ τ�c 1þ a0 lnV
Vsmax
� �� �(3b)
Ar
A¼ σn
σ0c
1
1� b0 ln 1þ dVtc
� �� � (3c)
a0 ¼ RTc
Qs; b0 ¼ RTc
BQv; σ0c ¼
QvBNΩv
; τ�c ¼Qs
NΩs; Etc ¼ Qv � NΩvσ0c ¼ 1� Bð ÞQv (3d)
tc ¼ b0d
Vnmaxexp
EtcRTc
� �¼ tcr
TcTcr
exp � Etc ΔTcR Tc Tcr
� �; (3e)
Equations (3d) and (3e) provide the constants for calculating contact stresses σc and τc in equations (3a) and(3b). Equations (3a)–(3e) are the same as in the above mentioned previous studies (see Putelat et al., 2011 for
Journal of Geophysical Research: Solid Earth 10.1002/2016JB013829
AHARONOV AND SCHOLZ A PHYSICS-BASED FRICTION LAW 1596
detailed derivation, and Nakatani and Scholz (2004b), derivation of their equation (13)), except for the newlyadded prefactor B < 1, the outcome of which is the newly defined Etc.
Assuming a reference cutoff time tcr at a reference temperature Tcr, and ΔTc = Tc � Tcr, and dividing tc by thisreference cutoff time tcr, provides equation (3e) as another formulation for the cutoff time, with more easilyobtained parameters than those in equation (2e). Note that the physics behind this formalism dictates thatconstants Vsmax and Vnmax are much greater than the sliding rate V, as they represent the physical upper limitto the creep rate in the respective creep processes. Also note from equation (3b) that τ�c provides the value ofthe highest possible shear stress. This maximum shear stress is attained not at the time of contact initiation(i.e., τ�c is not attained at the same time asσ0c Þbut is only achieved when sliding is at the highest possible shearvelocity, Vsmax.
Equation (3c) provides the real contact area, calculated from equation (3a) using σnA = σcAr. The behavior pre-dicted by (3c), namely logarithmic growth of real contact area with time, is observed in microindentationexperiments by Scholz and Engelder (1976) in both olivine and quartz.
The steady state friction coefficient is easily obtained from equations (3a)–(3e) via
μss ¼τσn
¼ τcσc
¼τ�c 1þ a0 ln V
Vsmax
� �� �σ0c 1� b0 ln 1þ d
Vtc
� �� � (4a)
where σn and τ are the applied normal and shear stress on the surface.
From the full steady state friction one may obtain the rate and state equation by Taylor expanding
equation (4a), assuming that the b0 ln 1þ dVtc
� �term is small:
μss e μ0 þ a� lnV
Vsmax
� �þ b� ln 1þ d
tcV
� �þ a�b�
μ0ln
VVsmax
� �ln 1þ d
tcV
� �þ 1μ0
b� ln 1þ dtcV
� �� �2
þ… (4b)
a� ¼ a0 μ0 ¼ μ0RTc
Qs; b� ¼ b0μ0 ¼ μ0
RTcBQv
; μ0 ¼τ�cσ0c
¼ Qs
BQV
ΩV
ΩS; (4c)
where the coefficients a0, b0, and tc are given by equations (3d) and (3e). Equation (4b) contains first- andsecond-order terms. The above Taylor expansion required that the whole b0 term (not only the b0 coefficient)is <1, which indeed is always true. Yet the b0 term may in some cases be large enough to necessitateretaining the second-order terms, as discussed below. The first three terms of equation (4b) constitutethe regularized rate and state equation as derived in many previous works (see, e.g., Baumberger &Caroli, 2006, equation (32)).
We may further approximate equation (4b) for the slowest slip regime (where V ≪ dtc
), using the
approximation that in this regime ln 1þ dtcV
� �~ ln d
tcV
� �. In this regime also |lnV| ≫ 1, so we keep the
ln2 terms.
μss e μ� þ ln Vð Þ a� � b�ð Þ þ a�b�
μ0ln
dVsmax
tc
� �� 2b�2
μ0ln
dtc
� �� �� lnVð Þ2 b
�
μ0a� � b�ð Þ þ… (4d)
where in equation (4d) we defined base level friction, μ*,as
μ� e μ0 � a� ln Vsmaxð Þ þ b� lndtc
� �þ higher-order terms… (4e)
And μ0 is defined in equation (4c). Equation (4d) emerges as a rate and state description of steady state fric-tion at the low slip rate limit, recapturing equation (1):
μss e μ� þ ln Vð Þ a� bð Þ þ terms of order b�2 ln2V and higher�
; (4f)
where the friction parameters a and b in equation (1) emerge as a combination of material parameters:
a ¼ a� 1þ b�
μ0ln
dVsmax
tc
� �� �; b ¼ b� 1þ 2
b�
μ0ln
dtc
� �� �: (4g)
Journal of Geophysical Research: Solid Earth 10.1002/2016JB013829
AHARONOV AND SCHOLZ A PHYSICS-BASED FRICTION LAW 1597
and a* and b* are defined in equation (4c). The fact that a and b represent defined physical parameters isdiscussed at length in previous work (e.g., Bar-Sinai et al., 2014; Baumberger & Caroli, 2006; Noda, 2008;Putelat et al., 2011; Rice et al., 2001). Note, however, that in contrast to previous theoretical derivations,the R/S parameters a and b in equation (4g) include second-order corrections. These second-order correc-tions are crucial if Qs = Qv and B ≈ 1, since then a* = b* (see equation (4c)), the first-order terms cancel out,and only the second-order terms remain in equations (4f) and (4g). The corrections may be very importantin other cases as well. The reason is that although b* is small, of O(10�2), due to the large logarithmic term(absolute values ranging between 10 and 30 depending on parameters), the second-order corrections maychange a and b values by up to 50%. For the same reason, at very small V, one must also include the ln2Vterm. In addition, the values of a* and b* grow linearly with contact temperature (equation (4c)).
For all these reasons we calculate friction in our model directly from τcσc; that is, from equation (4a), and
not from equations (4b) or (4f). Yet since the approximations of equations (4b) and (4f) are valid for somevelocity and parameter ranges we use them in section 6 for analysis and to obtain insights into the fric-tional behaviors.
As a consequence of equations (4a)–(4g), contact temperature and friction are strongly coupled. During slid-ing, contact temperature, Tc, rises due to frictional shear heating, which is controlled by the friction coefficientfrom equation (4a). On the other hand, rising Tc changes frictional resistance via prefactors a, b, and tc inequations (3a)–(3e) and (4a). Thus, Tc and μss are coupled, and this coupling is crucial in controlling intermedi-ate to high-speed friction, as demonstrated recently in the experiments of Yao et al. (2016).
2.2. Assumption 2: Steady State Temperature and Friction
As seen in Figure 1 of DiToro et al. (2011), high-velocity friction weakens with slip and reaches a steady stateafter sliding a distances Dth. This high-velocity weakening is thermally induced, by various mechanismsincluding (but not limited to) flash heating, decomposition in carbonates, melting in quartz, and thermalpressurization. All of those mechanisms require a steady frictional heat production to be maintained,which results in negative feedback such that steady states in friction and temperature aresimultaneously attained.
To calculate the steady state contact temperature, Tc, we follow previous formulations (e.g., Beeler et al., 2008;Noda, 2008; Rice, 2006) and assume that sliding contacts undergo “flash heating,” via shear heating that takesplace during short “contact lifetimes.” Flash heating of contacts elevates Tc by amount δT above the averagetemperature of the surface, Ts, which also increases during sliding. Steady state contact temperature Tc is thusapproximated by the sum of the mean surface temperature after sliding distance Dth (DiToro et al., 2011,
equation (1)), Ts = T0 þ τcρC
σnσc
ffiffiffiffiffiffiffiffiVDthπα
q, plus flash heating contributions on contacts, δT ¼ τc
ρC
ffiffiffiffiffiVdπα
q, (Rice, 2006,
equation (3)), where T0 is ambient temperature, α is thermal diffusivity coefficient, C is heat capacity, and ρis density of the material:
Tc ¼ Ts þ δT ¼ T0 þ τcρC
ffiffiffiffiffiffiVπα
r ffiffiffid
pþ σn
σc
ffiffiffiffiffiffiffiDth
p� �(5)
At high enough sliding velocity, equation (5) predicts contact temperatures Tc that exceed the phase transi-tion temperature of the particular mineral, in this case the melting temperature in quartz (Tm). Yet thermody-namic considerations predict that the temperature at the contacts will remain at the phase boundary, that is,Tc = Tm, even if V increases. To maintain Tc at Tm with increasing V, equation (5) that predicts shear stress at
contact must follow τc ~ 1/ffiffiffiffiffiV
p, since
τmc Vð Þ ¼ ρCffiffiffiffiffiffiπα
pTmelt � T0ð Þ=
ffiffiffiV
p ffiffiffiffiffiffidm
pþ σnσmc
ffiffiffiffiffiffiffiDth
p� �� �; (6)
where we assume dm and σmc are constant and independent of V. Note that equation (5) was originally devel-oped for “flash heating” during premelting (Rice, 2006), yet it was used successfully to also model the phasechange during flash melting (Beeler et al., 2008), despite the approximations involved. Since the main focusof this paper is the premelting stage, the approximation of equation (6) is considered satisfactory and weleave more accurate theoretical representations of the melting regime for future work.
Journal of Geophysical Research: Solid Earth 10.1002/2016JB013829
AHARONOV AND SCHOLZ A PHYSICS-BASED FRICTION LAW 1598
3. Parameter Values
To solve coupled equations (3a)–(3e) and (5) (and also equation (6) oncemelting sets on), we constrain valuesof the parameters used, via previous independent measurements. All of these parameters are thermody-namic or mechanical parameters of the mineral. Here we concentrate on the mineral quartz for which manyof those parameters are well determined. Table 1 outlines their values.
Activation energies Qv and Qs, values are constrained to within a factor of less than 2, which is not too badgiven that the processes that control the creep are not well constrained. We expect a difference betweenQv and Qs: Shear deformation involves very high strain in a surface layer whereas the surface-normal defor-mation involves presumably a much smaller strain, which occurs within the bulk of the asperity volume(Figure 2b). These two processes may result in different defect structures, and especially the high dislocationdensity can result in strengthening of the surface layer. Additionally, these two processes may result in differ-ent interstitial water content that can greatly affect the activation energy of quartz. The variability of Q asfunction of water content was measured by Mainprice and Jaoul (2009), who found dislocation creep activa-tion energy in quartzite ranged between 185 kJ/mol for vacuum dried and 151 kJ/mol for 0.4 wt % wateradded samples. Similarly, Jaoul et al. (1984) measured a 25% decrease in activation energy as water contentin Heavitree Quartzite was raised from 0.1 to 0.5% weight. Thus, activation energy for internal deformationwithin the asperity, which controls the contact-normal creep, Qv, and surface deformation that controls shearcreep on the asperity surface, Qs, needs not be equal. Activation energies cited previously in the literature donot distinguish between volume and surface processes and do not even discuss the possibility for such dif-ference. Q associated with quartz friction usually ranges between 150 and 250 KJ/mol (Kirby & Kronenberg,1987; Mainprice & Jaoul, 2009; Nakatani, 2001; Rice et al., 2001), but values ranging between 90 and500 KJ/mol have also been suggested (Nakatani, 2001). Here we thus used values ranging between 150and 280 KJ/mol.
Similarly, volumetric and surface activation volumes, Ωv and Ωs, respectively, are not precisely known andneed not necessarily be equal. They again are expected to reflect specific defect structures and process,but values have not been suggested in connection to any specific physical process. Activation volumes areof the size of atomic volumes. Estimates for Ω for quartz friction vary up to 50%, ranging between(0.37 nm)3 = 5 × 10�29 m3 (Nakatani, 2001) and 5 × (0.25 nm)3 = 7.8× 10�29 m3 (Rice et al., 2001).
To calculate cutoff times tc (equation (3e)), one needs either Vnmax or a reference cutoff time, tcr, at a referencecontact temperature, Tcr. tcr values have been experimentally measured, while there is little knowledge ofVnmax. Room temperature tcr was measured in experiments to range from 1 s (Dieterich, 1972, 1978) to10,000 s (Nakatani & Scholz, 2004a), with the latter attributed to timescales of pressure solution. In addition,Nakatani and Scholz (2004b) measured tc as function of T0 and found tc is thermally activated, with an activa-tion energy in quartz of Etc = 58 KJ/mol. We can use this measured Etc to constrain also the prefactor B: fromequation (3c), Etc = (1 � B)Qv, so that assuming Qv = 280 KJ/mol and Etc = 58 KJ/mol gives B~0.79, whileassuming Qv = 170 KJ/mol with this Etc gives B~0.66. These constraints on B should be used cautiously,due to the fact that this value of Etc was measured during pressure solution. Etc is probably different in theexperiments that measured tcr~1 s, since the controlling process is different, but we do not know this for cer-tain as Etc was not measured there.
An independent additional constraint on prefactor B comes from the value of yield stress, σ0c . Optical mea-surement of asperity contact sizes (Dieterich & Kilgore, 1994, 1996) on various materials including soda-limeand quartz suggests that σ0c~0.2G, or even larger, where G is shear modulus. This value is consistent with anestimate by Boitnott et al. (1992) and with microhardness indentation strengths measured by Dieterich andKilgore (1994) (as interpreted by Rice et al., 2001). Using G = 31 GPa for quartz, this estimate suggests σ0c~6 GPa, and using Qv = 250 KJ/mol andΩv = 5 × 10�29 m3 inσ0c =
QvBNΩv
then predicts B~0.72. A lower activation
energy, Qv = 170 KJ/mol gives higher value for B, B > 0.9. However, high B values and low Qv values woulddictate a low Etc < 20 KJ/mol (according to equation (3e)). We therefore use the following ranges:
Qv = 220 ± 70 KJ/mol and B~0.85 ± 0.1, consistent with all experimental constrains known today for Etc, σ0c ,and Qv. This constrains Etc to be between 10 and 75 KJ/mol.
The value of B quoted above is for room ambient temperature, yet σ0c and B should be a function of T0. Evans(1984) showed that indentation hardness of quartz, that is, yield stress, drops by 30–50% as T0 increases from
Journal of Geophysical Research: Solid Earth 10.1002/2016JB013829
AHARONOV AND SCHOLZ A PHYSICS-BASED FRICTION LAW 1599
0 to 500°C. To represent this effect, we use B(T0) = Brexp(�0.0006(T0� Tr)), where Br is B at room temperature,
so that σ0c drops with ambient temperature T0 following the trend in Figure 5 of Evans (1984).
Another parameter is the upper limit for shear rate, Vsmax. The maximum value of Vsmax has been equated tothe natural vibration frequency of atoms in a mineral lattice and linked to the shear wave velocity cs (Riceet al., 2001). Noda (2008) uses physical arguments to state that Vsmax is close to this limit of cs. Since V mustbe smaller than Vsmax for the creep physics in equation (2) to hold, and since we use this creep physics acrossall V, we shall henceforth use Vsmax = 0.5cs. However, we note that since Vsmax is under the ln, its exact value isprobably not crucial.
The contact diameter is assumed at the time of contact initiation to be d0 = 0.1–15 μm (Beeler et al., 2008). It
then depends on slip rate via the constant load assumption: d2
d20¼ σ0c
σc. At low slip rates d remains close to d0
(within a factor of 1.3). Significant changes in d are only expected at higher ambient temperatures and normalstress, when the real area of contact increases appreciably. The value of d (together with the thermal para-meters), controls the amount of shear heating that takes place during contact lifetime. Small d pushes thethermal softening transition to higher slip rates.
Thermal parameters are needed for equations (5) and (6): From experiments at high slip rate, the thermalequilibration distance, Dth, is found to drop with applied normal stress, for all rock types, following an empiri-cal relationship (Di Toro et al., 2011) where Dth = k σn
�q, and constants k and q depend onmaterial. For lack ofbetter constrains on k and q, we assume k = 5 and q = 1, which using the empirical relationship above predict
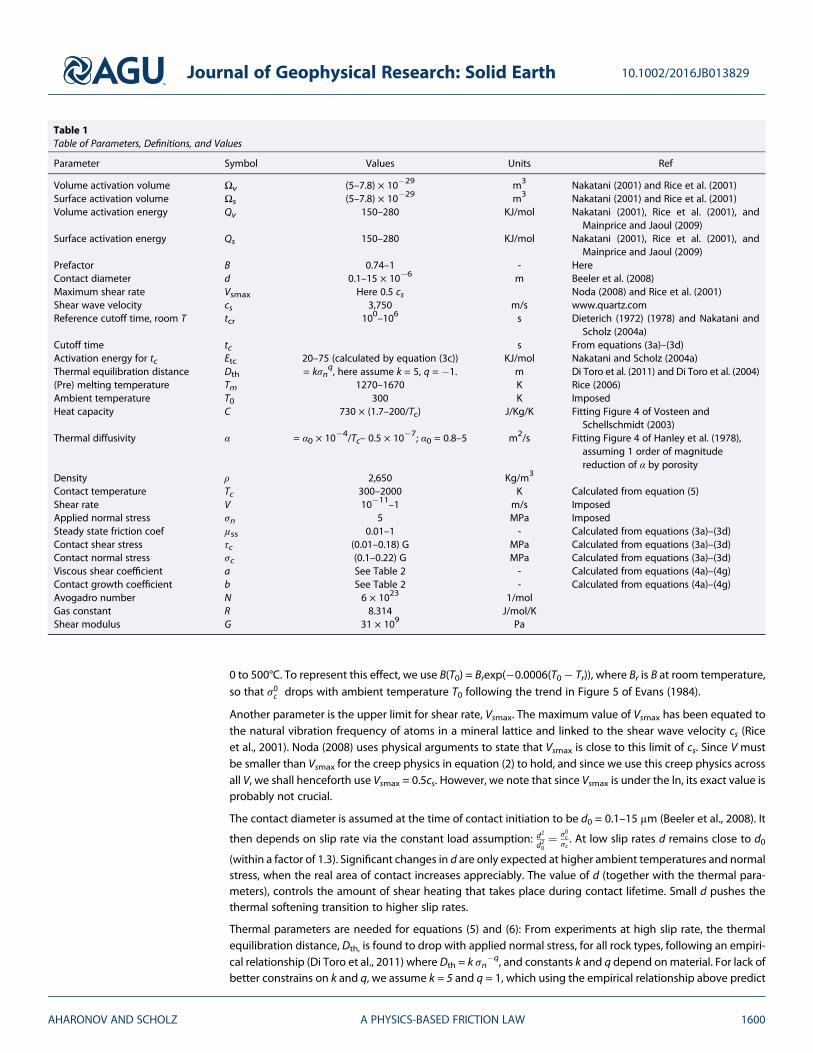
Table 1Table of Parameters, Definitions, and Values
Parameter Symbol Values Units Ref
Volume activation volume Ωv (5–7.8) × 10�29 m3 Nakatani (2001) and Rice et al. (2001)Surface activation volume Ωs (5–7.8) × 10�29 m3 Nakatani (2001) and Rice et al. (2001)Volume activation energy Qv 150–280 KJ/mol Nakatani (2001), Rice et al. (2001), and
Mainprice and Jaoul (2009)Surface activation energy Qs 150–280 KJ/mol Nakatani (2001), Rice et al. (2001), and
Mainprice and Jaoul (2009)Prefactor B 0.74–1 - HereContact diameter d 0.1–15 × 10�6 m Beeler et al. (2008)Maximum shear rate Vsmax Here 0.5 cs Noda (2008) and Rice et al. (2001)Shear wave velocity cs 3,750 m/s www.quartz.comReference cutoff time, room T tcr 100–106 s Dieterich (1972) (1978) and Nakatani and
Scholz (2004a)Cutoff time tc s From equations (3a)–(3d)Activation energy for tc Etc 20–75 (calculated by equation (3c)) KJ/mol Nakatani and Scholz (2004a)Thermal equilibration distance Dth = kσn
q, here assume k = 5, q = �1. m Di Toro et al. (2011) and Di Toro et al. (2004)(Pre) melting temperature Tm 1270–1670 K Rice (2006)Ambient temperature T0 300 K ImposedHeat capacity C 730 × (1.7–200/Tc) J/Kg/K Fitting Figure 4 of Vosteen and
assuming 1 order of magnitudereduction of α by porosity
Density ρ 2,650 Kg/m3
Contact temperature Tc 300–2000 K Calculated from equation (5)Shear rate V 10�11–1 m/s ImposedApplied normal stress σn 5 MPa ImposedSteady state friction coef μss 0.01–1 - Calculated from equations (3a)–(3d)Contact shear stress τc (0.01–0.18) G MPa Calculated from equations (3a)–(3d)Contact normal stress σc (0.1–0.22) G MPa Calculated from equations (3a)–(3d)Viscous shear coefficient a See Table 2 - Calculated from equations (4a)–(4g)Contact growth coefficient b See Table 2 - Calculated from equations (4a)–(4g)Avogadro number N 6 × 10²³ 1/molGas constant R 8.314 J/mol/KShear modulus G 31 × 109 Pa
Journal of Geophysical Research: Solid Earth 10.1002/2016JB013829
AHARONOV AND SCHOLZ A PHYSICS-BASED FRICTION LAW 1600
Dth = 1 m and 1 cm at 5 Mpa and 400 MPa,respectively, fitting on the one end resultsfrom 5 MPa shear experiments on novacu-lite (Figure 2 of Di Toro et al., 2004) and atthe other end providing Dth of order of1 cm at σn > 200 MPa (Di Toro et al., 2011).
Additional Thermal Parameters Are C, ρ, andα. The thermal diffusivity for quartz isα = 7 × 10�6 m2/s at room temperature;however, the fault and gouge zone porosityreduces this diffusivity by up to an order ofmagnitude (Gibert & Mainprice, 2009,Figure 8; Siman-Tov et al., 2015). Porosity isimportant both for “asperity-scale heating”(i.e., the flash heating term in equation (5))and for the “fault-scale heating” (i.e., themean surface temperature term inequation (5)): at the fault-scale heat diffuseswithin the broken and porous fault zonestructure. Also at the asperity scale, eachasperity is surrounded by a void filled withgas or fluid, that is, heat is diffusing in a veryporousmedium. Thus, we assume 1 order ofmagnitude reduction in α due to porosity(see Table 1 for equation). In addition,α drops with temperature (Vosteen &Schellschmidt, 2003), while the heatcapacity, C, increases. We fit the thermaldependence of α of quartzite from Hanleyet al., (1978, their Figure 4). Density, ρ, istaken constant (Vosteen & Schellschmidt,2003). Table 1 reports the equation we fittedto the C variation with temperature shownin Vosteen and Schellschmidt (2003).Another parameter is the melting tempera-ture, Tm, that for quartzite is ~ 1670°C. Rice(2006) uses a “weakening temperature” thatcould be equated with Tm, yet suggests it islower than melting, 1000–1400°C,representing weakening due to premelting.We consider all these values in ourvarious calculations.
4. Method
For accuracy we calculate friction from thefull friction equation, equation (4a). Wesolve equations (3a)–(3e), (4a), (5), and (6)numerically, seeking a coupled dynamicsteady state solution for contact stresses σcand τc and contact temperature Tc by itera-tive solutions using a Matlab subroutinethat we wrote.Ta
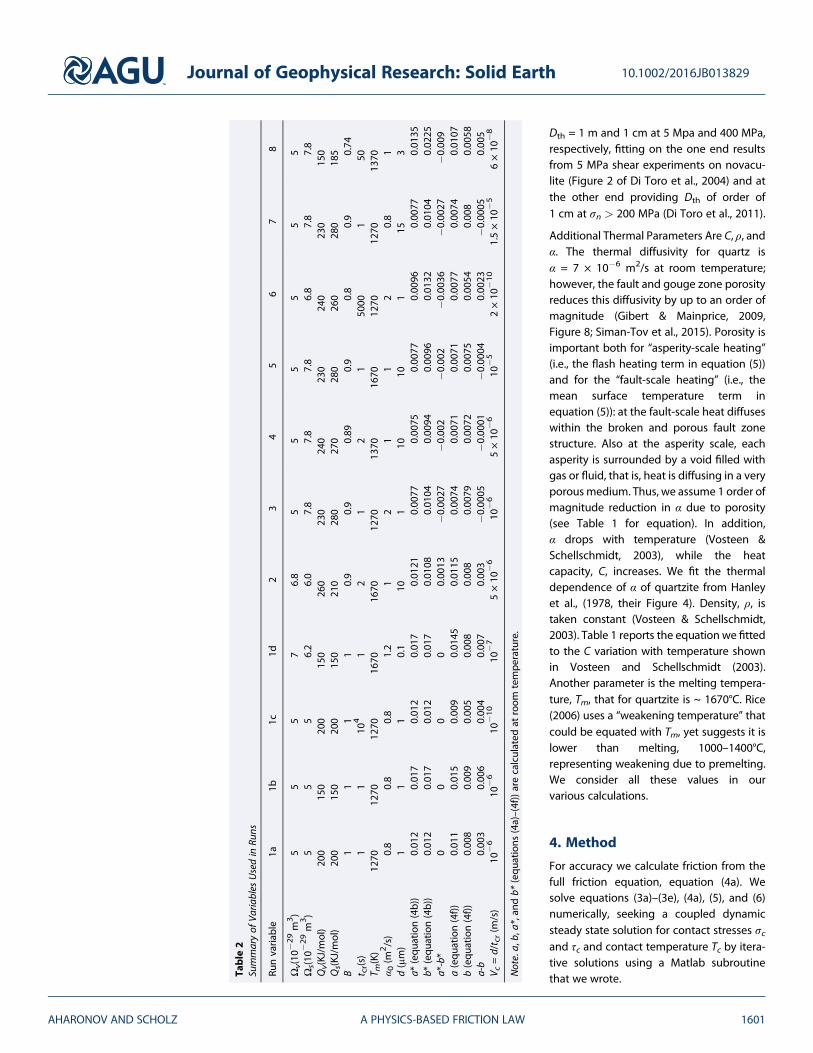
ble
2Summaryof
Varia
bles
Usedin
Runs
Runvaria
ble
1a1b
1c1d
23
45
67
8
Ωv(10
�29m3)
55
57
6.8
55
55
55
Ωs(10
�29m3)
55
56.2
6.0
7.8
7.8
7.8
6.8
7.8
7.8
Qv(KJ/m
ol)
200
150
200
150
260
230
240
230
240
230
150
Qs(KJ/m
ol)
200
150
200
150
210
280
270
280
260
280
185
B1
11
10.9
0.9
0.89
0.9
0.8
0.9
0.74
t cr(s)
11
104
12
12
150
001
50T m
(K)
1270
1270
1270
1670
1670
1270
1370
1670
1270
1270
1370
α 0(m
2/s)
0.8
0.8
0.8
1.2
12
11
20.8
1d(μm)
11
10.1
101
1010
115
3a*
(equ
ation(4b))
0.01
20.01
70.01
20.01
70.01
210.00
770.00
750.00
770.00
960.00
770.01
35b*
(equ
ation(4b))
0.01
20.01
70.01
20.01
70.01
080.01
040.00
940.00
960.01
320.01
040.02
25a*-b*
00
00
0.00
13�0
.002
7�0
.002
�0.002
�0.003
6�0
.002
7�0
.009
a(equ
ation(4f))
0.01
10.01
50.00
90.01
450.01
150.00
740.00
710.00
710.00
770.00
740.01
07b(equ
ation(4f))
0.00
80.00
90.00
50.00
80.00
80.00
790.00
720.00
750.00
540.00
80.00
58a-b
0.00
30.00
60.00
40.00
70.00
3�0
.000
5�0
.000
1�0
.000
40.00
23�0
.000
50.00
5V c
=d/t cr(m
/s)
10�6
10�6
10�1
010
�75×10
�6
10�6
5×10
�6
10�5
2×10
�10
1.5×10
�5
6×10
�8
Note.a,b,a*,and
b*(equ
ations
(4a)–(4f))arecalculated
atroom
tempe
rature.
Journal of Geophysical Research: Solid Earth 10.1002/2016JB013829
AHARONOV AND SCHOLZ A PHYSICS-BASED FRICTION LAW 1601
In our code the solution converges from the same reason that we pro-pose a dynamic steady state: Negative feedbacks ensure that steadystates in friction and temperature are coupled and are reached simulta-neously. If τc rises it increases Tc via shear heating (equation (5)). Theincrease in Tc reduces τc via prefactor a0, in equation (3d). The reductionin τc then reduces shear heating and so reduces Tc in equation (5), andso on.
An important deviation from this procedure is taken at high sliding velo-city, when intense shear heating produces a steady state Tc that exceedsTm. In this case equation (6) gives contact stress, τmc , that maintainsTc = Tm while sliding at velocity V.
The present analysis uses velocity V ranging between 10�11 and 1 m/s,calculating steady state Tc, τc, σc, and μss as function of shear velocityV for sliding quartz, using 11 different combinations of material para-meters, within the range stated in Table 1. All runs were run at roomtemperature, T0 = 300 K and normal stress σn = 5 Mpa. The parametersused for each of the runs are given in Table 2. The first four runs, runs1a–1d, use Qv = Qs and B = 1. These are “control runs”. Runs 2–8 havevariable Qv, Qs, and B.
5. Results5.1. Contact Temperature
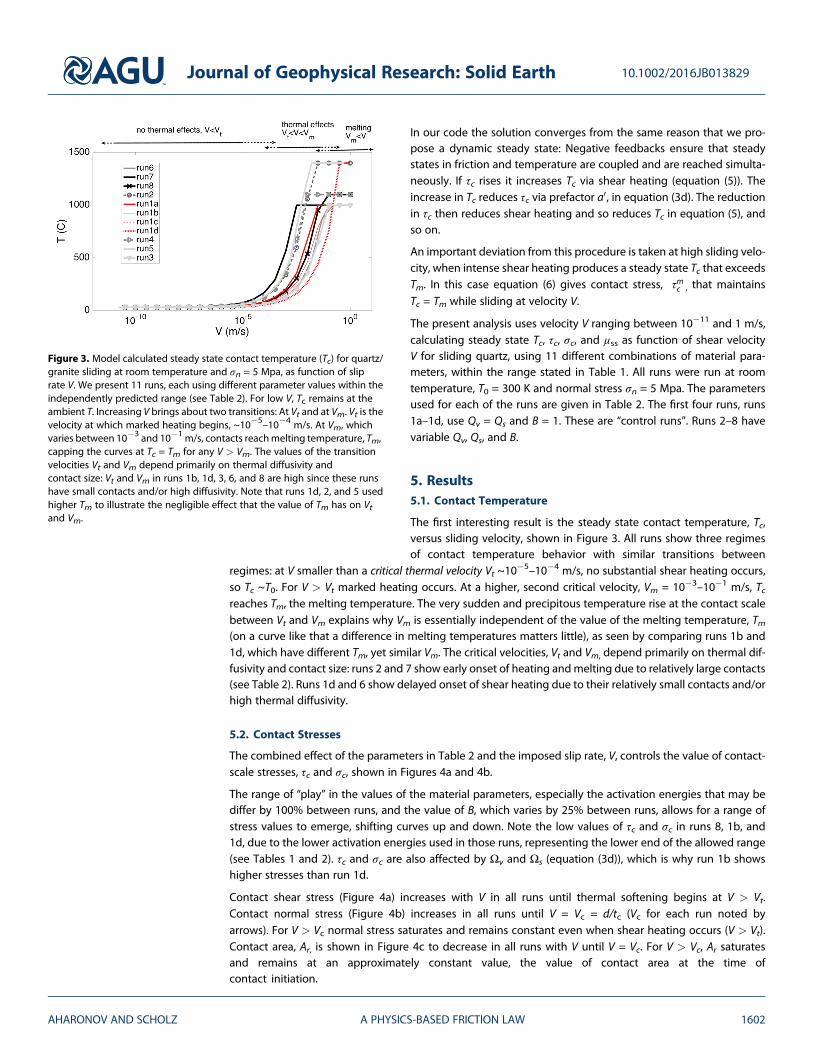
The first interesting result is the steady state contact temperature, Tc,versus sliding velocity, shown in Figure 3. All runs show three regimesof contact temperature behavior with similar transitions between
regimes: at V smaller than a critical thermal velocity Vt ~10�5–10�4 m/s, no substantial shear heating occurs,
so Tc ~T0. For V > Vt marked heating occurs. At a higher, second critical velocity, Vm = 10�3–10�1 m/s, Tcreaches Tm, the melting temperature. The very sudden and precipitous temperature rise at the contact scalebetween Vt and Vm explains why Vm is essentially independent of the value of the melting temperature, Tm(on a curve like that a difference in melting temperatures matters little), as seen by comparing runs 1b and1d, which have different Tm, yet similar Vm. The critical velocities, Vt and Vm, depend primarily on thermal dif-fusivity and contact size: runs 2 and 7 show early onset of heating andmelting due to relatively large contacts(see Table 2). Runs 1d and 6 show delayed onset of shear heating due to their relatively small contacts and/orhigh thermal diffusivity.
5.2. Contact Stresses
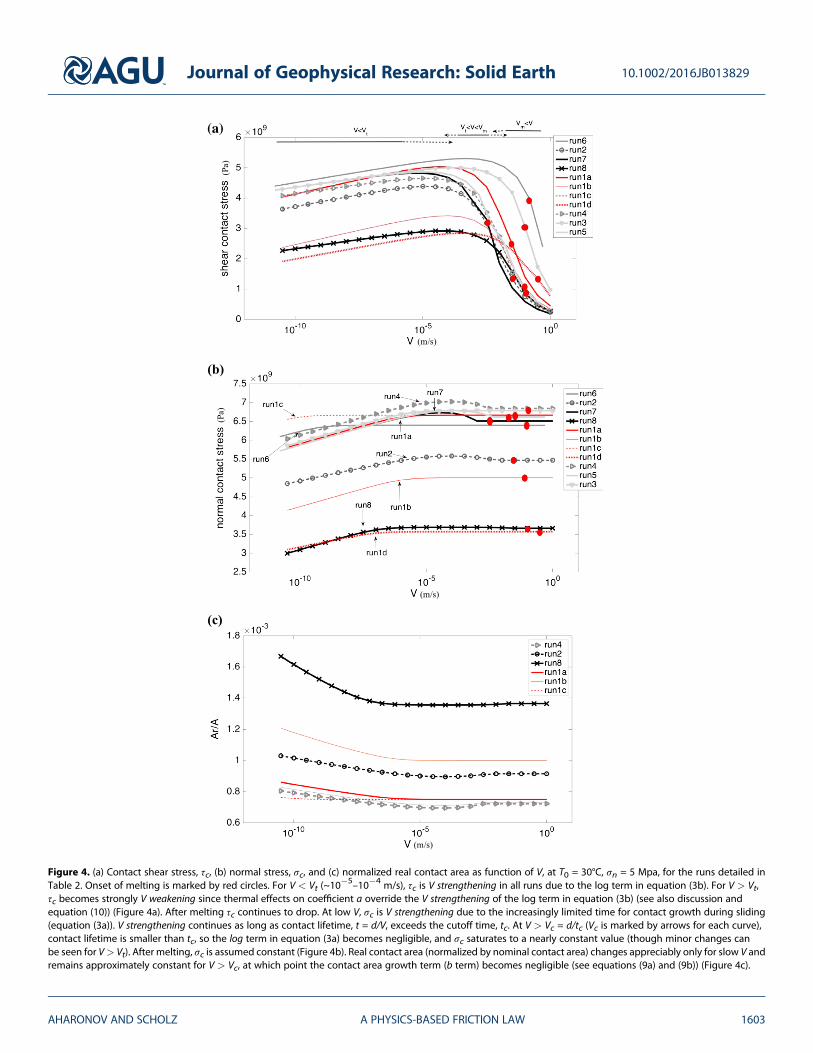
The combined effect of the parameters in Table 2 and the imposed slip rate, V, controls the value of contact-scale stresses, τc and σc, shown in Figures 4a and 4b.
The range of “play” in the values of the material parameters, especially the activation energies that may bediffer by 100% between runs, and the value of B, which varies by 25% between runs, allows for a range ofstress values to emerge, shifting curves up and down. Note the low values of τc and σc in runs 8, 1b, and1d, due to the lower activation energies used in those runs, representing the lower end of the allowed range(see Tables 1 and 2). τc and σc are also affected by Ωv and Ωs (equation (3d)), which is why run 1b showshigher stresses than run 1d.
Contact shear stress (Figure 4a) increases with V in all runs until thermal softening begins at V > Vt.Contact normal stress (Figure 4b) increases in all runs until V = Vc = d/tc (Vc for each run noted byarrows). For V > Vc normal stress saturates and remains constant even when shear heating occurs (V > Vt).Contact area, Ar, is shown in Figure 4c to decrease in all runs with V until V = Vc. For V > Vc, Ar saturatesand remains at an approximately constant value, the value of contact area at the time ofcontact initiation.
Figure 3. Model calculated steady state contact temperature (Tc) for quartz/granite sliding at room temperature and σn = 5 Mpa, as function of sliprate V. We present 11 runs, each using different parameter values within theindependently predicted range (see Table 2). For low V, Tc remains at theambient T. Increasing V brings about two transitions: At Vt and at Vm. Vt is thevelocity at which marked heating begins, ~10�5–10�4 m/s. At Vm, whichvaries between 10�3 and 10�1m/s, contacts reachmelting temperature, Tm,capping the curves at Tc = Tm for any V > Vm. The values of the transitionvelocities Vt and Vm depend primarily on thermal diffusivity andcontact size: Vt and Vm in runs 1b, 1d, 3, 6, and 8 are high since these runshave small contacts and/or high diffusivity. Note that runs 1d, 2, and 5 usedhigher Tm to illustrate the negligible effect that the value of Tm has on Vtand Vm.
Journal of Geophysical Research: Solid Earth 10.1002/2016JB013829
AHARONOV AND SCHOLZ A PHYSICS-BASED FRICTION LAW 1602
Figure 4. (a) Contact shear stress, τc, (b) normal stress, σc, and (c) normalized real contact area as function of V, at T0 = 30°C, σn = 5 Mpa, for the runs detailed inTable 2. Onset of melting is marked by red circles. For V < Vt (~10
�5–10�4 m/s), τc is V strengthening in all runs due to the log term in equation (3b). For V > Vt,τc becomes strongly V weakening since thermal effects on coefficient a override the V strengthening of the log term in equation (3b) (see also discussion andequation (10)) (Figure 4a). After melting τc continues to drop. At low V, σc is V strengthening due to the increasingly limited time for contact growth during sliding(equation (3a)). V strengthening continues as long as contact lifetime, t = d/V, exceeds the cutoff time, tc. At V > Vc = d/tc (Vc is marked by arrows for each curve),contact lifetime is smaller than tc, so the log term in equation (3a) becomes negligible, and σc saturates to a nearly constant value (though minor changes canbe seen for V> Vt). After melting, σc is assumed constant (Figure 4b). Real contact area (normalized by nominal contact area) changes appreciably only for slow V andremains approximately constant for V > Vc, at which point the contact area growth term (b term) becomes negligible (see equations (9a) and (9b)) (Figure 4c).
Journal of Geophysical Research: Solid Earth 10.1002/2016JB013829
AHARONOV AND SCHOLZ A PHYSICS-BASED FRICTION LAW 1603
5.3. Friction Coefficient
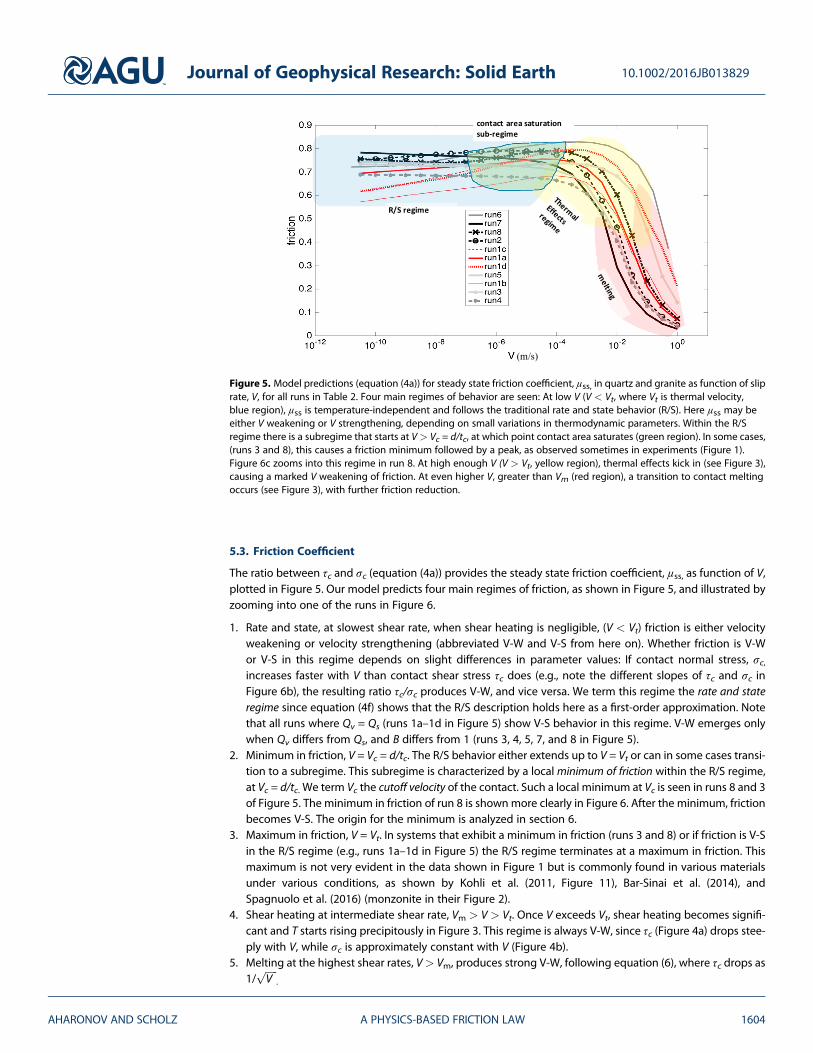
The ratio between τc and σc (equation (4a)) provides the steady state friction coefficient, μss, as function of V,plotted in Figure 5. Our model predicts four main regimes of friction, as shown in Figure 5, and illustrated byzooming into one of the runs in Figure 6.
1. Rate and state, at slowest shear rate, when shear heating is negligible, (V < Vt) friction is either velocityweakening or velocity strengthening (abbreviated V-W and V-S from here on). Whether friction is V-Wor V-S in this regime depends on slight differences in parameter values: If contact normal stress, σc,increases faster with V than contact shear stress τc does (e.g., note the different slopes of τc and σc inFigure 6b), the resulting ratio τc/σc produces V-W, and vice versa. We term this regime the rate and stateregime since equation (4f) shows that the R/S description holds here as a first-order approximation. Notethat all runs where Qv = Qs (runs 1a–1d in Figure 5) show V-S behavior in this regime. V-W emerges onlywhen Qv differs from Qs, and B differs from 1 (runs 3, 4, 5, 7, and 8 in Figure 5).
2. Minimum in friction, V = Vc = d/tc. The R/S behavior either extends up to V = Vt or can in some cases transi-tion to a subregime. This subregime is characterized by a localminimum of friction within the R/S regime,at Vc = d/tc. We term Vc the cutoff velocity of the contact. Such a local minimum at Vc is seen in runs 8 and 3of Figure 5. The minimum in friction of run 8 is shownmore clearly in Figure 6. After the minimum, frictionbecomes V-S. The origin for the minimum is analyzed in section 6.
3. Maximum in friction, V = Vt. In systems that exhibit a minimum in friction (runs 3 and 8) or if friction is V-Sin the R/S regime (e.g., runs 1a–1d in Figure 5) the R/S regime terminates at a maximum in friction. Thismaximum is not very evident in the data shown in Figure 1 but is commonly found in various materialsunder various conditions, as shown by Kohli et al. (2011, Figure 11), Bar-Sinai et al. (2014), andSpagnuolo et al. (2016) (monzonite in their Figure 2).
4. Shear heating at intermediate shear rate, Vm > V > Vt. Once V exceeds Vt, shear heating becomes signifi-cant and T starts rising precipitously in Figure 3. This regime is always V-W, since τc (Figure 4a) drops stee-ply with V, while σc is approximately constant with V (Figure 4b).
5. Melting at the highest shear rates, V> Vm, produces strong V-W, following equation (6), where τc drops as1/
ffiffiffiffiffiV
p.
Figure 5. Model predictions (equation (4a)) for steady state friction coefficient, μss, in quartz and granite as function of sliprate, V, for all runs in Table 2. Four main regimes of behavior are seen: At low V (V < Vt, where Vt is thermal velocity,blue region), μss is temperature-independent and follows the traditional rate and state behavior (R/S). Here μss may beeither V weakening or V strengthening, depending on small variations in thermodynamic parameters. Within the R/Sregime there is a subregime that starts at V> Vc = d/tc, at which point contact area saturates (green region). In some cases,(runs 3 and 8), this causes a friction minimum followed by a peak, as observed sometimes in experiments (Figure 1).Figure 6c zooms into this regime in run 8. At high enough V (V > Vt, yellow region), thermal effects kick in (see Figure 3),causing a marked V weakening of friction. At even higher V, greater than Vm (red region), a transition to contact meltingoccurs (see Figure 3), with further friction reduction.
Journal of Geophysical Research: Solid Earth 10.1002/2016JB013829
AHARONOV AND SCHOLZ A PHYSICS-BASED FRICTION LAW 1604
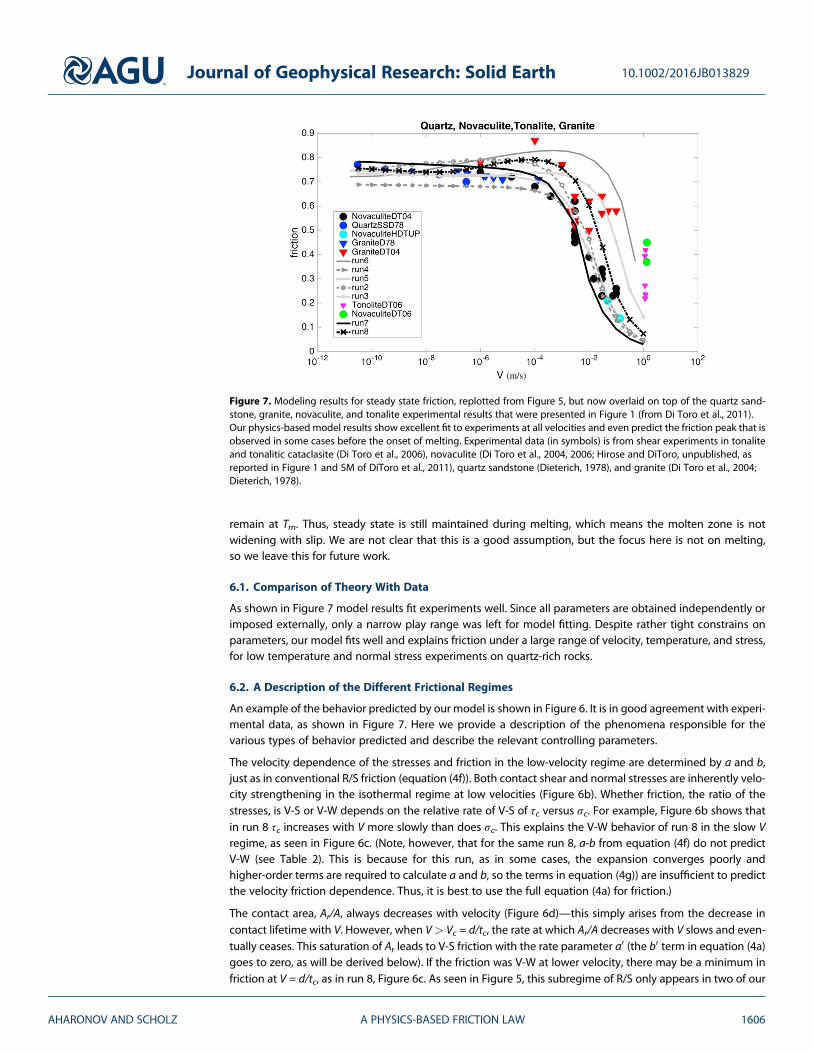
To compare with experiments, the simulations from Figure 5 are replotted in Figure 7 together with theexperimental data for quartzose rocks from Figure 1 (from Di Toro et al., 2011). The different model runs,which use a range of reasonable material parameters (as discussed in section 3 and summarized inTables 1 and 2), predict and envelope the various behaviors observed experimentally in steady state slidingin quartz sandstone (Dieterich, 1978), granite (Di Toro et al., 2004; Dieterich, 1978), tonalite and tonaliticcataclasite, (Di Toro et al., 2006), and novaculite (Di Toro et al., 2004, 2006; Hirose and DiToro, unpublished,as reported in Figure 1 and supporting information of Di Toro et al. (2011)).
6. Discussion
The new model for steady state friction is conceptually simple: it assumes thermally activated creep of con-tacts, under coupled steady state stress and thermal conditions during sliding. The micromechanics modelbuilds upon the works of, for example, Putelat et al. (2011), Rice et al. (2001), Nakatani and Scholz (2004b),Bowden and Tabor (1964), Baumberger and Caroli (2006), Brechet and Estrin (1994), and others but (1) addssteady state thermal effects, (2) relaxes nonphysical assumptions on yield stress σ0c , and (3) allows the activa-tion energies and activation volumes to differ between shear and flattening creep processes. We also added aphysical constraint to represent melting, assuming that once contacts reach melting they reduce stresses to
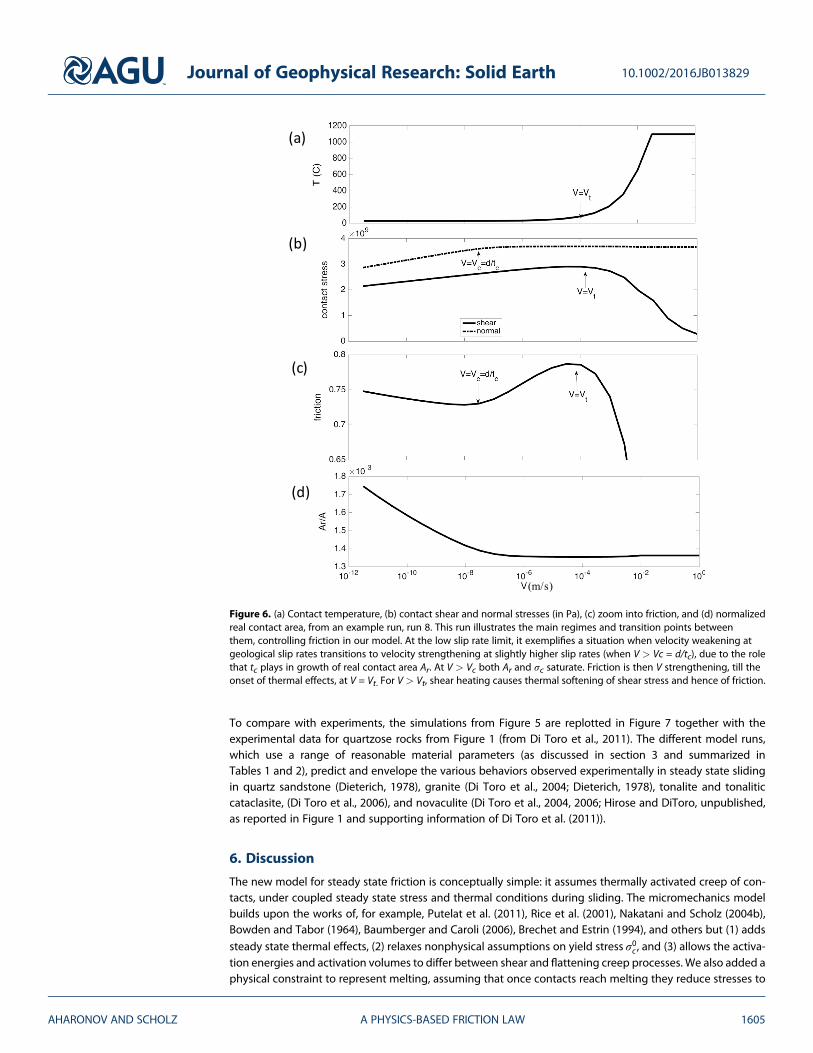
Figure 6. (a) Contact temperature, (b) contact shear and normal stresses (in Pa), (c) zoom into friction, and (d) normalizedreal contact area, from an example run, run 8. This run illustrates the main regimes and transition points betweenthem, controlling friction in our model. At the low slip rate limit, it exemplifies a situation when velocity weakening atgeological slip rates transitions to velocity strengthening at slightly higher slip rates (when V > Vc = d/tc), due to the rolethat tc plays in growth of real contact area Ar. At V > Vc both Ar and σc saturate. Friction is then V strengthening, till theonset of thermal effects, at V = Vt. For V > Vt, shear heating causes thermal softening of shear stress and hence of friction.
Journal of Geophysical Research: Solid Earth 10.1002/2016JB013829
AHARONOV AND SCHOLZ A PHYSICS-BASED FRICTION LAW 1605
remain at Tm. Thus, steady state is still maintained during melting, which means the molten zone is notwidening with slip. We are not clear that this is a good assumption, but the focus here is not on melting,so we leave this for future work.
6.1. Comparison of Theory With Data
As shown in Figure 7 model results fit experiments well. Since all parameters are obtained independently orimposed externally, only a narrow play range was left for model fitting. Despite rather tight constrains onparameters, our model fits well and explains friction under a large range of velocity, temperature, and stress,for low temperature and normal stress experiments on quartz-rich rocks.
6.2. A Description of the Different Frictional Regimes
An example of the behavior predicted by our model is shown in Figure 6. It is in good agreement with experi-mental data, as shown in Figure 7. Here we provide a description of the phenomena responsible for thevarious types of behavior predicted and describe the relevant controlling parameters.
The velocity dependence of the stresses and friction in the low-velocity regime are determined by a and b,just as in conventional R/S friction (equation (4f)). Both contact shear and normal stresses are inherently velo-city strengthening in the isothermal regime at low velocities (Figure 6b). Whether friction, the ratio of thestresses, is V-S or V-W depends on the relative rate of V-S of τc versus σc. For example, Figure 6b shows thatin run 8 τc increases with V more slowly than does σc. This explains the V-W behavior of run 8 in the slow Vregime, as seen in Figure 6c. (Note, however, that for the same run 8, a-b from equation (4f) do not predictV-W (see Table 2). This is because for this run, as in some cases, the expansion converges poorly andhigher-order terms are required to calculate a and b, so the terms in equation (4g)) are insufficient to predictthe velocity friction dependence. Thus, it is best to use the full equation (4a) for friction.)
The contact area, Ar/A, always decreases with velocity (Figure 6d)—this simply arises from the decrease incontact lifetime with V. However, when V> Vc = d/tc, the rate at which Ar/A decreases with V slows and even-tually ceases. This saturation of Ar leads to V-S friction with the rate parameter a0 (the b0 term in equation (4a)goes to zero, as will be derived below). If the friction was V-W at lower velocity, there may be a minimum infriction at V = d/tc, as in run 8, Figure 6c. As seen in Figure 5, this subregime of R/S only appears in two of our
(m/s)
Figure 7. Modeling results for steady state friction, replotted from Figure 5, but now overlaid on top of the quartz sand-stone, granite, novaculite, and tonalite experimental results that were presented in Figure 1 (from Di Toro et al., 2011).Our physics-based model results show excellent fit to experiments at all velocities and even predict the friction peak that isobserved in some cases before the onset of melting. Experimental data (in symbols) is from shear experiments in tonaliteand tonalitic cataclasite (Di Toro et al., 2006), novaculite (Di Toro et al., 2004, 2006; Hirose and DiToro, unpublished, asreported in Figure 1 and SM of DiToro et al., 2011), quartz sandstone (Dieterich, 1978), and granite (Di Toro et al., 2004;Dieterich, 1978).
Journal of Geophysical Research: Solid Earth 10.1002/2016JB013829
AHARONOV AND SCHOLZ A PHYSICS-BASED FRICTION LAW 1606
runs, as it requires Vc ≪ Vt. Similar behavior is observed in some othermaterials, for example, see Bar-Sinai et al.(2014, Figure 1).
At V = Vt, the contact temperature begins to rise rapidly with increasing slip rate, due to flash heating(Figure 6a). That causes the a0 term in equation (4a) to become increasingly negative as V increases, leadingτc to become strongly V-W. However, because Ar is already saturated, there is no such effect on σc, and frictionbecomes strongly V-W, resulting in a maximum in friction at Vt, as seen in Figure 6c.
This regime transitions to melting at a high V, V > Vm. V-W continues as τc drops to offset the shear heatingthat increases with V. This offset is required to attain constant Tc, so as to maintain our model-dictated steadystate during melting.
6.3. Physical Interpretation of the Friction Coefficient
Three main coefficients emerge in this formalism as collections of material parameters, which control thephysics of friction: a0, b0, and tc.6.3.1. The Viscous Shear TermThe a0 term represents the ratio of contact temperature to shear activation energy and thus thematerial com-pliance to shear deformation—the higher a0 is, the less resistance there is to shear deformation. The a0 ln(V/Vsmax) term in equation (4a) arises from the τc equation, (3b). This term is always negative since V < Vsmax.Since at low velocities a0 is a positive constant and ln(V/Vsmax) becomes less negative with increasing V, τcincreases with V at low velocities; hence, we call this a0 term the viscous shear term. At higher velocities, whereTc increases, a0 also increases accordingly (equation (4b)), resulting in thermal weakening of τc.6.3.2. The Contact Area Growth TermThe b0 term represents the ratio of contact temperature to volume creep activation energy and thus thematerial compliance to volume deformation. The higher b0 is, the less resistance there is to compactionand flattening of the asperity. It is easier to understand the b0 term in terms of Ar rather than from σc. The termb’ln(1 + d/(Vtc)) in equation (3c) is always positive, leading always to growth of Ar. Thus, we call this b0 term thecontact-area growth term. Increasing V reduces the growth of Ar because the load lifetime on contacts isreduced. When V>> d/tc, then ln(1 + d/Vtc) ➔0. Thus, when V ≫ d/tc, both Ar and σc will saturate, as seenin Figures 4 and 6. In contrast to the a0 term that changes considerably during shear heating, the b0 termremains negligible even during shear heating (yet slight changes to Ar and σc are noticeable in Figures 4and 6 at V = Vt). It will be demonstrated below that the b0 term is only significant at slow V (V ≪ d/tc), whilefor V ≫ d/tc it can be neglected, and Ar (and thus σc) can be taken as constant.6.3.3. The Cutoff TimeThe cutoff time, tc, has a physical meaning that may be understood from evaluating the differential equationfor contact normal stress, equation (2c), at time t = 0 and plugging in the definition of tc from equation (2d),which gives
dσcdt
����t¼0
¼ �b0 σ0ctc
(7)
Equation (7) says that tc (modulated by b0) is the combination of thermodynamic parameters, given byequation (2e), that controls the characteristic time for contact convergence and growth, at the time of con-tact formation (t = 0). Since tc may be thermally activated (equation (2e)), the contact area growth rate, therate of change in normal stress, and the rate of contact convergence are all thermally activated as well. Inaddition to its physical meaning, the cutoff time is a crucial parameter in controlling transitions betweenfriction-velocity regimes, as shown in Ben David et al. (2010) and Marone (1998).
6.4. The Four Frictional Regimes and the Critical Velocities
Our simulations predict four sliding regimes as function of slip rate, where the transition between regimes isset by three critical slip rates. The first critical velocity is Vc = d/tc, the “cutoff velocity” of the contact. Thesecond-critical velocity, Vt, is the velocity above which substantial shear heating, and thus strong thermalweakening, takes place. The third critical slip rate is the one above which contacts melt, Vm. We find here thatVc ranges between 10�10 and 10�5 m/s, Vt ranges between 10�5 and 10�3 m/s, and Vm ranges between 10�3
and 10�1 m/s, depending onmodel parameters, mainly thermal diffusivity and contact size (see Figure 3 andTable 2). We next analyze friction dependence on velocity for these separate regimes.
Journal of Geophysical Research: Solid Earth 10.1002/2016JB013829
AHARONOV AND SCHOLZ A PHYSICS-BASED FRICTION LAW 1607
6.4.1. Slow Sliding—the (a-b) Term and Frictional StabilityEquation (4f) shows that friction may be approximated in the slowest sliding regime, V ≪ Vc = d/tc, by the con-ventional R/S equation (1). In this regime the two behaviors of R/S, namely Vweakening and V strengthening,arise in our model when applying small differences in thermodynamic parameters, within the material-allowed range. To see how V-S or V-W depend on material parameters, we differentiate equation (4f):
∂μss
∂ ln Vð Þ ≈ a� b ¼ μ0RTc1Qs
� 1BQv
� �þ RTcð Þ2μ0
BQv
1Qs
lndVsmax
tc
� �� 2BQv
lndtc
� �� �; (8)
where the dependence of the a and b coefficients on material parameters is defined in equations (3d) and(4g)). The first equality of equation (8) predicts that when (a-b) > 0 friction is V-S, and when (a-b) < 0 frictionis V-W. This prediction agrees with the standard interpretation of R/S laws (Marone, 1998). The predictions ofequation (8), which are not material specific, also agree with the observations of Ikari et al. (2011) and Ikariet al. (2016) who find that in carbonates (a-b) depends linearly on the base friction μ0, and that a and b havedifferent linear dependence on μ0 (Ikari et al., 2016, Figure 2c). This agrees with our definition of a and b(equation (4g)) that predicts that differences between a and b may result from a difference in values of Qs
and BQv or from the second-order corrections.
It is easy to show from equation (8) that when the activation energies are equal and B = 1, that is,when Qs = BQv, friction is always V-S in this conventional R/S regime: The first parenthesis cancels out, whileplugging in reasonable numbers shows that the second parenthesis is always positive. Indeed runs 1a–1d,which have Qs = Qv, show V-S in this R/S regime (Figure 5), independent of other parameter values.
The second-order corrections may play a crucial role even when Qs ≠ Qv, if the first order is negative, but thesecond-order offsets it. Such a case is seen in run 6 for example (see Table 2). This is because although each ofthe first-order terms, a and b, may be relatively large on their own, their difference may be smaller than thesecond-order terms. In addition, for very small slip rate, the b term is large, and the (ln)2 term in equation (4d)may become important, as is the case for run 8. Run 8 has (a-b) > 0 but still shows V-W since the b term islarge (b term increases for low-activation energy) and the accurate assessment requires addition of theln2V term. Thus, although the R/S derivative equation (8) gives the correct stability criterion for friction inmost cases, for accuracy it is best to use the full equation for friction, equation (4a).
Note also that equation (8) predicts a temperature dependence of (a-b): increasing ambient temperature willenhance the V-S or V-W that occurs at low T, by increasing the absolute value of (a-b). This prediction hasimplications for the depth of earthquake nucleation, which we shall leave for future studies.6.4.2. Intermediate Sliding Rate—the Transition to Velocity Strengthening at V > d/tcThe second sliding regime is actually a subregime of R/S. It emerges when the validity of the approximation inthe low V R/S equation (4f) breaks down, that is, once V exceeds the cutoff velocity Vc = d/tc, and we return tothe primitive R/S approximation, equation (4b). Using the approximation that for small x, ln(1 + x)~x.Equation (4b) predicts that friction in this regime is
μss ≈ μ0 þ a� lnV
Vsmax
� �þ b�
dVtc
; (9a)
The size of the a* and b* terms can be evaluated as follows: on the one hand, for V< 0.1 m/s, | ln VVsmax
� �∣e10,
on the other hand, in this regime dVtc
< 1. Since a* is of the same order as b* (Table 2), then the b* term in
equation (9a) is negligible relative to the a* term, and equation (9a) can be approximated as
μss ≈ μ0 þ a� lnV
Vsmax
� �(9b)
which means that contact growth is not important in this regime, as is also seen in Figure 6, which shows thatcontact normal stress and area saturate for V > Vc.
In this regime, from equation (9b),∂μss
∂ ln Vð Þ ≈ a�, which is always positive. Thus, friction is always V strengthen-
ing in this R/S subregime of Vt ≫ V ≫ Vc (i.e., sliding rate that is still slow enough to not cause appreciableshear heating effects), independent of the sign of (a-b). Physically this is because contacts do not have timeto grow when the velocity exceeds the cutoff velocity d/tc, and in the absence of thermal effects (in this
Journal of Geophysical Research: Solid Earth 10.1002/2016JB013829
AHARONOV AND SCHOLZ A PHYSICS-BASED FRICTION LAW 1608
regime of still relatively slow slip), only the logarithmic V-S of the viscous term of τc prevails. This regime,however, only exists under certain conditions. For example, runs 4, 5, and 7 do not show a V-S portion ofthe curve because the window between Vc < V < Vt shrinks in these runs (they have small tc, large d, andrelatively small Vt).
Cases where this regime exists, as in runs 3 and 8, show V-W at very low slip rate, followed by V-S at moderateslip rates (when V > Vc), and a transition to thermal softening at higher V, when V > Vt (Figure 6c). A similarsaddle-like behavior, causing a peak in friction, was experimentally observed in various materials (e.g., Kilgoreet al., 1993; Shimamoto, 1986; Weeks & Tullis, 1985); Heslot et al., 1994), and its consequences have been dis-cussed theoretically (Bar-Sinai et al., 2014; Noda, 2008), yet here we suggest the physics behind it. This issue ofsaddle-like behavior of friction reveals a basic behavior of friction that was largely overlooked in previousworks. It stems from the control of d and tc on a cutoff velocity and may be overlooked if one concentratessolely on the sign of a and b.6.4.3. Fast Sliding—The Thermal Softening Regime at V > VtIn the case of even faster slip rate, when V exceeds the thermal velocity Vt, the contacts heat up. At this fastvelocity, certainly the condition of V> d/tc is met, and friction may be approximated by equation (9b). To ana-lyze the dependence of friction on velocity, we differentiate equation (9b) with respect to V, but due to shearheating we account also for changes in a* due to elevated contact temperature:
∂μss
∂V e a�
Vþ ∂a�
∂Vln
VVsmax
� �¼ a�
Vþ ∂a�
∂Tc∂Tc∂V
lnV
Vsmax
� �¼ a�
Vþ a�
VTc � T02Tc
lnV
Vsmax
� �: (10)
To obtain the last equality, we used ∂Tc∂V ¼ Tc�T0
2V from equation (5) and ∂a�∂Tc ¼ a�
Tcfrom equation (4c). From the
right-hand side (RHS) expression in equation (10) it is easy to see that friction thermally softens in this regime:the first term on the RHS is due to the regular velocity strengthening that is contributed by the viscous a*
coefficient and is always positive. The second term on the RHS comes from thermal softening. It is negativeand much larger than the first term, causing overall softening. This is easily seen by plugging values: forexample, for V = 0.01 m/s, Tc ≈ 250°C (Figure 3). Plugging Vsmax from Table 1 shows that the second termis negative, with a magnitude that is 2.5 times the first term. In short, thermal softening occurs becausethe thermal effect of the a* coefficient overwhelms the velocity strengthening (viscous shear) effects ofthe logarithmic term.6.4.4. Fastest Sliding—the Melting Regime at V > VmWhen contacts melt, equation (6) predicts that τc drops as 1/
ffiffiffiffiffiV
p. This is a consequence of the coupled steady
state calculation of T and stresses. This drop is slower than the τc~1/V predicted by the flash melting model ofRice (2006). The difference is since the flash melting model does not produce steady state. At this point wecannot say if steady state really occurs during melting in experiments or in nature. A possibly relevant aspectof the experimental high-velocity friction data is that the apparent steady state friction occurs in an “opensystem,” that is, with gouge/melt flying out of the sample, which would not be the case in the Earth. Thishas been shown (Nielsen et al., 2008, 2010) to influence the dependence of friction on velocity in theV > Vm regime. However, since melting is not the main issue of this study, we simply state these differencesbetween models, and between experiments and nature.
6.5. The Importance of the Difference Between Volume Creep and Shear Creep
From equation (8), it is clear that the values and differences between the activation energies for contact flat-tening and surface shear are important for fault stability. The difference between shear and volume creepprocesses has not been dwelled upon previously, yet equation (8) predicts that Qs = BQv leads to V-S, whileV-W will only emerge if Qs is larger than BQv. This criterion can be met when B < 1, and/or when Qs < Qv. Adifference in activation energies may arise from different processes controlling contact growth and shear, orfrom variations in structure as function of distance from contact, as discussed in section 3. The values of Qs
and Qv are not accurately known at present. Possible ways to measure separately Q (and Ω) for surfaceand volume processes involve microindentation hardness experiments at varying temperature. Qv may thenbe extracted from measurements of strain rate as function of t and T, following equation (3a). One can alsomeasure a and b as function of temperature to extract the activation energies, as in Ikari et al. (2011,2016). In that case fitted parameters at low V and T may be used to model the full phase space, namely
Journal of Geophysical Research: Solid Earth 10.1002/2016JB013829
AHARONOV AND SCHOLZ A PHYSICS-BASED FRICTION LAW 1609
the nonmonotonic friction as function of high V, T, and σn. A good fit across the full phase space, as obtainedhere, lends confidence to the validity of the model.6.5.1. Constraining the Parameter ValuesThe original Bowden & Tabor paper (1950) concluded that because friction is τc/σc, the ratio of strength prop-erties of the samematerial, the value of the friction coefficient should be independent of material. In geologythis conclusion is known as Byerlee’s law, which applies to all geological materials except for the laminarmaterials like phylosilicates (as was also recognized by B&T, 1964, chapter XI), which have unusual frictionalproperties. This conclusion of B&T (1950) agrees with our prediction: Qs, BQv, Ωs, and Ωv determine μss via τcand σc, and the absolute value of these depends onmaterial. However, we find that their ratio should dependmainly on process and not on material.
We have constrained parameter values for our model based on thermodynamics measurements, asexplained in section 3. Yet these parameters have a range of permissible values, as noted in Tables 1 and 2and seen in Figures 5 and 7. One may further constrain these parameters within the allowable range, usingexperiments of friction and velocity trends. For this we concentrate on the friction coefficient at the limitof slow V, V ≪ d/tc, derived in equation (4f). In this very slow velocity regime, friction is V-W if (a-b) < 0, whichrequires Qs> BQv. Since we know quartz is generally V-W, equation (4f) implies that in quartz the surface acti-vation energy Qs should be larger than BQv, the volumetric activation energy multiplied by constant B. Weused this constraint in all runs, except for run 2 and runs 1a–1d, which were added for exploratory purposes.Another constraint, discussed in section 3, is that Qv and Qs in quartz are constrained by independent mea-sures reported in the literature to be between 150 and 280 KJ/mol.
One may constrain Qs, B, and Qv further, by using experimental data of steady state values of (a-b). Marone(1998) compiled experiments on bare rock and gouge and finds steady state values of (a-b) for quartz, gran-ite, and novaculite between 0 and �0.006. Runs 4, 5, and 7 show (a-b) values within the experimental rangereported by Marone (1998) (see Table 2). These runs have relatively high activation energies, withQs > Qv + 30 KJ/mol and B< 1. Although it is easy to find reasons why Qv should differ from Qs, it is less clearwhy Qv should be smaller than Qs.
An additional check for the parameters of the model is offered by the value of the real contact area, as seen inFigure 4c. In agreement with the experiments of Dieterich and Kilgore (1994), we obtain that Ar/A ~ 10�3 atroom temperature and low normal stress. The change of Arwith V, and its constancy for V exceeding d/tc, canbe tested in future experiments.
Finally, the parameters αtherm and d are independently constrained, as discussed in section 3. However, theyare checked by Vt, the velocity at which thermal weakening initiates. Vt is observed by experiments (Figure 7)to be around 10�4–10�3 m/s. This constrains the ratio d/αtherm from equation (5), assuming we know Dth
from experiments.
6.6. Plastic Versus Brittle Behavior of Contacts
We have assumed that deformation at contacts, for what otherwise are considered brittle materials, is by lowtemperature plastic flow. Other models of rock friction have assumed brittle fracture at the contacts (e.g.,Beeler, 2004). Such models produce similar results to ours because, as mentioned earlier, the velocity of sub-critical crack growth depends exponentially on stress (Atkinson, 1987), similar to our equation (2a). Ourassumption of contact-scale plasticity is based on the observation that for such materials, under static andmoving loads, well-formed indentations and wear grooves are formed concordant with the indenting styli(Brace, 1963; Engelder & Scholz, 1976). This is explained because the high hydrostatic pressures that existbeneath contacts inhibit brittle fracture there (Bowden & Tabor, 1964, p.349; Evans & Goetze, 1979).
The wear detritus from rock friction is often dominated by angular fragments forming cataclasites. This indi-cates an important role for brittle fracture. The indentation experiments of Brace (1963) produced cone crackssurrounding the indents, and in the sliding styli experiments of Engelder and Scholz (1976) partial conecracks were observed at the trailing edge of the styli tracks. Such cone cracks are predicted by the high tensilestresses that exist at the edges of contacts (Johnson, 1985 p. 94; Lawn, 1967). Thus, while plastic deformationat the contacts is the controlling process for friction, the growth of such cone cracks will lead to the pluckingout of contacts, which will volumetrically dominate wear.
Journal of Geophysical Research: Solid Earth 10.1002/2016JB013829
AHARONOV AND SCHOLZ A PHYSICS-BASED FRICTION LAW 1610
7. Conclusions
1. A physics-based model is proposed, based on the assumption of contact creep, to quantitatively predictsteady state friction. The steady state is both of contact temperature and stresses at contacts. The modelgeneralizes R/S friction and finds its physical basis. It provides a unifying physical basis that carries thesame physics across all velocity scales. The a and b terms emerge as the viscous shear and contact growthterms, respectively.
2. Themodel explains and predicts the general observations of friction that are not material specific: (A) highfriction and second-order velocity dependence at low V (conventional R/S friction law behavior). (B)Material dependent peak at intermediate velocity, just before onset of thermal effects. (C) Abrupt weak-ening above a critical velocity, termed Vt for thermal. At this velocity shear heating becomes meaningful.Vt is ~100 times slower than the velocity that produces contact melting. (D) All material dependenciesresult from variations in material properties that may be independently determined.
3. The model predicts four regimes of frictional behavior: R/S in its usual form, equation (1), is shown to bethe low-velocity limit of our model, representing an end-member behavior on a continuum of the samephysical behavior. In this regime fault stability is controlled in most cases by ∂μss
∂ ln Vð Þ≈a� b (although somecases require higher-order terms). Our model predicts three more experimentally observed regimes forfrictional behavior, beyond the conventional R/S. The onset of the second regime is dictated by the cutofftime, tc: When slip rate exceeds d/tc, contacts cease to grow appreciably during sliding. This leads to con-tact area saturation and enhanced velocity strengthening. In this regime fault stability is controlled by theviscous shear term alone: ∂μss
∂ ln Vð Þ ¼ a�:This transition reveals the importance of the cutoff time tc for friction.The third regime occurs at even faster sliding, when shear heating causes thermal softening. Thermal soft-ening is achieved via thermal increase of the viscous shear a* term (reducing friction since this term isnegative). In this regime the b* term is negligible, and fault stability is controlled by the dependence ofthe viscous shear term on shear heating: ∂μss
∂V ≈ ∂a�∂Tc
∂Tc∂V ln V
Vsmax
� �:Friction calculation in this regime must thus
be coupled with calculation of contact shear heating. The last regime occurs at the onset of contact melt-ing and continues the weakening trend of the thermal softening regime.
4. The model predicts the importance of the difference between activation energies for shear and normalcreep processes. The difference between these energies controls whether friction is velocity weakeningor strengthening in the rate and state regime.
ReferencesAshby, M. F., & Verrall, R. A. (1973). Diffusion accommodated flow and superplasticity. Acta Metallurgica, 21(2), 149–163. https://doi.org/
10.1016/0001-6160(73)90057-6Atkinson, B. K. (1987). Introduction to fracture mechanics and its geophysical applications. In B. K. Atkinson (Ed.), Fracture mechanics of rock,
(pp. 1–26). London: Academic Press. https://doi.org/10.1016/B978-0-12-066266-1.50006-5Bar-Sinai, Y., Spatschek, R., Brener, E. A., & Bouchbinder, E. (2014). On the velocity-strengthening behavior of dry friction. Journal of
Geophysical Research: Solid Earth, 119, 1738–1748. https://doi.org/10.1002/2013JB010586Baumberger, T. (1997). Contact dynamics and friction at a solid-solid interface: Material versus statistical aspects. Solid State Communications,
102, 175–185.Baumberger, T., & Caroli, C. (2006). Solid friction from stick–slip down to pinning and aging. Advances in Physics, 55(3-4), 279–348. https://doi.
org/10.1080/00018730600732186Beeler, N. M. (2004). Review of the physical basis of laboratory-derived relations for brittle failure and their implications for earthquake
occurrence and earthquake nucleation. Pure and Applied Geophysics, 161(9–10), 1853–1876. https://doi.org/10.1007/s00024-004-2536-zBeeler, N. M., Tullis, T. E., & Goldsby, D. L. (2008). Constitutive relationships and physical basis of fault strength due to flash heating. Journal of
Geophysical Research, 113, B01401. https://doi.org/10.1029/2007JB004988Ben-David, O., Rubinstein, S. M., & Fineberg, J. (2010). Slip-stick and the evolution of frictional strength. Nature, 463(7277), 76–79. https://doi.
org/10.1038/nature08676Berthoud, P., Baumberger, T., G’sell, C., & Hiver, J. M. (1999). Physical analysis of the state-and rate-dependent friction law: Static friction.
Physical Review B, 59(22), 14,313–14,327. https://doi.org/10.1103/PhysRevB.59.14313Blanpied, M. L., Lockner, D. A., & Byerlee, J. D. (1995). Frictional slip of granite at hydrothermal conditions. Journal of Geophysical Research,
100(B7), 13,045–13,064. https://doi.org/10.1029/95JB00862Boettcher, M. S., Hirth, G., & Evans, B. (2007). Olivine friction at the base of oceanic seismogenic zones. Journal of Geophysical Research, 112,
B01205. https://doi.org/10.1029/2006JB004301Boitnott, G. N., Biegel, R. L., Scholz, C. H., Yoshioka, N., & Wang, W. (1992). Micromechanics of rock friction 2: Quantitative modeling of initial
friction with contact theory. Journal of Geophysical Research, 97(B6), 8965–8978.Bowden, F. P., & Tabor, D. (1950). The friction and lubrication of solids (Vol. 1, No. 1). Oxford: Clarendon press.Bowden, F. P., & Tabor, D. (1964). The friction and lubrication of solids (Vol. 2, No. 2). Oxford: Clarendon press.Brace, W. F. (1963). Behavior of quartz during indentation. Journal of Geology, 71(5), 581–595. https://doi.org/10.1086/626934Braeck, S., & Podladchikov, Y. Y. (2007). Spontaneous thermal runaway as an ultimate failure mechanism of materials. Physical Review Letters,
Journal of Geophysical Research: Solid Earth 10.1002/2016JB013829
AHARONOV AND SCHOLZ A PHYSICS-BASED FRICTION LAW 1611
AcknowledgmentsE. A. thanks H. Rubin, R. Toussaint, andJ. Rice for helpful discussions. We thankG. Hirth and an anonymous reviewer forimportant comments that improved themanuscript considerably. EA is fundedby ISF grant 910/17 The data andcomputer programs presented in thispaper are available at http://en.earth.huji.ac.il/people/einat-aharonov.
Brechet, Y., & Estrin, Y. (1994). The effect of strain rate sensitivity on dynamic friction of metals. Scripta Metallugica et Materialia, 30(11),1449–1454. https://doi.org/10.1016/0956-716X(94)90244-5
Brown, K. M., & Fialko, Y. (2012). Melt-welt mechanism of extreme weakening of gabbro at seismic slip rates. Nature, 488(7413), 638–641.https://doi.org/10.1038/nature11370
Carpenter, B. M., Collettini, C., Viti, C., & Cavallo, A. (2016). The influence of normal stress and sliding velocity on the frictional behaviour ofcalcite at room temperature: Insights from laboratory experiments and microstructural observations. Geophysical Journal International,205(1), 548–561. https://doi.org/10.1093/gji/ggw038
Chen, X., Madden, A. S., Bickmore, B. R., & Reches, Z. E. (2013). Dynamic weakening by nanoscale smoothing during high-velocity fault slip.Geology, 41(7), 739–742. https://doi.org/10.1130/G34169.1
Chester, F. M. (1994). Effects of temperature on friction: Constitutive equations and experiments with quartz gouge. Journal of GeophysicalResearch, 99(B4), 7247–7261. https://doi.org/10.1029/93JB03110
Chester, F. M., & Higgs, N. G. (1992). Multimechanism friction constitutive model for ultrafine quartz gouge at hypocentral conditions.Journal of Geophysical Research, 97(B2), 1859–1870. https://doi.org/10.1029/91JB02349
De Paola, N., Holdsworth, R. E., Viti, C., Collettini, C., & Bullock, R. (2015). Can grain size sensitive flow lubricate faults during the initial stages ofearthquake propagation? EPSL, 431, 48–58. https://doi.org/10.1016/j.epsl.2015.09.002
den Hartog, S. A., Peach, C. J., de Winter, D. M., Spiers, C. J., & Shimamoto, T. (2012). Frictional properties of megathrust fault gouges at lowsliding velocities: New data on effects of normal stress and temperature. Journal of Structural Geology, 38, 156–171. https://doi.org/10.1016/j.jsg.2011.12.001
Di Toro, G., Goldsby, D. L., & Tullis, T. E. (2004). Friction falls towards zero in quartz rock as slip velocity approaches seismic rates. Nature,427(6973), 436–439. https://doi.org/10.1038/nature02249
Di Toro, G., Hirose, T., Nielsen, S., Pennacchioni, G., & Shimamoto, T. (2006). Natural and experimental evidence of melt lubrication of faultsduring earthquakes. Science, 311(5761), 647–649. https://doi.org/10.1126/science.1121012
Di Toro, G., Hirose, T., Nielsen, S., & Shimamoto, T. (2006). Relating high-velocity rock friction experiments to coseismic slip. InR. Abercrombie, et al. (Eds.), Radiated energy and the physics of faulting, Geophysical Monograph Series (Vol. 170, pp. 121–134).Washington, DC: American Geophysical Union. https://doi.org/10.1029/170GM13
Di Toro, G., Han, R., Hirose, T., De Paola, N., Nielsen, S., Mizoguchi, K., … Shimamoto, T. (2011). Fault lubrication during earthquakes. Nature,471(7339), 494–498. https://doi.org/10.1038/nature09838
Dieterich, J. H. (1972). Time-dependent friction in rocks. Journal of Geophysical Research, 77(20), 3690–3697. https://doi.org/10.1029/JB077i020p03690
Dieterich, J. H. (1978). Time-dependent friction and the mechanics of stick-slip. Pure and Applied Geophysics, 116(4-5), 790–806. https://doi.org/10.1007/BF00876539
Dieterich, J. H. (1979). Modeling of rock friction: 1. Experimental results and constitutive equations. Journal of Geophysical Research, 84(B5),2161–2168. https://doi.org/10.1029/JB084iB05p02161
Dieterich, J. H., & Kilgore, B. D. (1994). Direct observation of frictional contacts—New insights for state-dependent properties. Pure andApplied Geophysics, 143(1-3), 283–302. https://doi.org/10.1007/BF00874332
Dieterich, J. H., & Kilgore, B. (1996). Implications of fault constitutive properties for earthquake prediction. Proceedings of the NationalAcademy of Sciences of the United States of America, 93(9), 3787–3794. https://doi.org/10.1073/pnas.93.9.3787
Engelder, T., & Scholz, C. H. (1976). The role of asperity indentation and ploughing in rock friction—II. Influence of relative hardness andnormal load. International Journal of Rock Mechanics and Mining Science and Geomechanics, 13(5), 155–163. https://doi.org/10.1016/0148-9062(76)90820-2
Evans, B. (1984). The effect of temperature and impurity content on indentation hardness of quartz. Journal of Geophysical Research, 89(B6),4213–4222. https://doi.org/10.1029/JB089iB06p04213
Evans, B., & Goetze, C. (1979). The temperature variation of hardness of olivine and its implication for polycrystalline yield stress. Journal ofGeophysical Research, 84(B10), 5505–5524. https://doi.org/10.1029/JB084iB10p05505
Faulkner, D. R., Mitchell, T. M., Behnsen, J., Hirose, T., & Shimamoto, T. (2011). Stuck in the mud? Earthquake nucleation andpropagation through accretionary forearcs. Geophysical Research Letters, 38, L18303. https://doi.org/10.1029/2011GL048552
Ferri, F., Di Toro, G., Hirose, T., & Shimamoto, T. (2010). Evidences of thermal pressurization in high velocity friction experiments on smectite-rich gouges. Terra Nova, 22(5), 347–353. https://doi.org/10.1111/j.1365-3121.2010.00955.x
Gibert, B., & Mainprice, D. (2009). Effect of crystal preferred orientations on the thermal diffusivity of quartz polycrystalline aggregates at hightemperature. Tectonophysics, 465(1-4), 150–163. https://doi.org/10.1016/j.tecto.2008.11.006
Goldsby, D. L., & Tullis, T. E. (2002). Low frictional strength of quartz rocks at subseismic slip rates. Geophysical Research Letters, 29(17), 1844.https://doi.org/10.1029/2002GL015240
Goldsby, D. L., & Tullis, T. E. (2011). Flash heating leads to low frictional strength of crustal rocks at earthquake slip rates. Science, 334(6053),216–218. https://doi.org/10.1126/science.1207902
Goren, L., & Aharonov, E. (2007). Long runout landslides: The role of frictional heating and hydraulic diffusivity. Geophysical Research Letters,34, L07301. https://doi.org/10.1029/2006GL028895
Goren, L., & Aharonov, E. (2009). On the stability of landslides: A thermo-poro-elastic approach. Earth and Planetary Science Letters, 277(3-4),365–372. https://doi.org/10.1016/j.epsl.2008.11.002
Goren, L., Aharonov, E., & Anders, M. H. (2010). The long runout of the Heart Mountain landslide: Heating, pressurization, and carbonatedecomposition. Journal of Geophysical Research, 115, B10210. https://doi.org/10.1029/2009JB007113
Green, H. W. II, Shi, F., Bozhilov, K., Xia, G., & Reches, Z. (2015). Phase transformation and nanometric flow cause extreme weakening duringfault slip. Nature Geoscience, 8(6), 484–489. https://doi.org/10.1038/ngeo2436
Hanley, E. J., Dewitt, D. P., & Roy, R. F. (1978). The thermal diffusivity of eight well-characterized rocks for the temperature range 300–1000 K.Engineering Geology, 12, 31–47. https://doi.org/10.1016/0013-7952(78)90003-0
Heslot, F., Baumberger, T., Perrin, B., Caroli, B., & Caroli, C. (1994). Creep, stick-slip, and dry friction dynamics: Experiments and a heuristicmodel. Physical Review E, 49(6), 4973–4988. https://doi.org/10.1103/PhysRevE.49.4973
Ikari, M. J., Marone, C., & Saffer, D. M. (2011). On the relation between fault strength and frictional stability. Geology, 39(1), 83–86. https://doi.org/10.1130/G31416.1
Ikari, M. J., Carpenter, B. M., & Marone, C. (2016). A microphysical interpretation of rate-and state-dependent friction for fault gouge.Geophysics, Geosystems, Geochemistry, 17, 1660–1677. https://doi.org/10.1002/2016GC006286
Jaoul, O., Tullis, J., & Kronenberg, A. (1984). The effect of varying water contents on the creep behavior of Heavitree quartzite. Journal ofGeophysical Research, 89(B6), 4298–4312. https://doi.org/10.1029/JB089iB06p04298
Journal of Geophysical Research: Solid Earth 10.1002/2016JB013829
AHARONOV AND SCHOLZ A PHYSICS-BASED FRICTION LAW 1612
Johnson, K. L. (1985). Contact mechanics. Cambridge: Cambridge University Press. https://doi.org/10.1017/CBO9781139171731Kelemen, P. B., & Hirth, G. (2007). A periodic shear-heating mechanism for intermediate-depth earthquakes in the mantle. Nature, 446(7137),
787–790. https://doi.org/10.1038/nature05717Kilgore, B. D., Blanpied, M. L., & Dieterich, J. H. (1993). Velocity dependent friction of granite over a wide range of conditions. Geophysical
Research Letters, 20(10), 903–906.Kirby, S. H., & Kronenberg, A. K. (1987). Rheology of the lithosphere: Selected topics. Reviews of Geophysics, 25(6), 1219–1244. https://doi.org/
10.1029/RG025i006p01219Kirkpatrick, J. D., Rowe, C. D., White, J. C., & Brodsky, E. E. (2013). Silica gel formation during fault slip: Evidence from the rock record. Geology,
41(9), 1015–1018. https://doi.org/10.1130/G34483.1Kohli, A. H., Goldsby, D. L., Hirth, G., & Tullis, T. (2011). Flash weakening of serpentinite at near-seismic slip rates. Journal of Geophysical
Research, 116, B03202. https://doi.org/10.1029/2010JB007833Lawn, B. R. (1967). Partial cone crack formation in a brittle material loaded with a sliding spherical indenter. Proceedings of the Royal Society of
London Series A, 299(1458), 307–316. https://doi.org/10.1098/rspa.1967.0138Li, T., & Rubin, A. M. (2017). A microscopic model of rate and state friction evolution. Journal of Geophysical Research: Solid Earth, 122,
6431–6453. https://doi.org/10.1002/2017JB013970Lockner, D. A., Summers, R., & Byerlee, J. D. (1986). Effects of temperature and sliding rate on frictional strength of granite. Pure and Applied
Geophysics, 124(3), 445–469. https://doi.org/10.1007/BF00877211Mainprice, D., & Jaoul, O. (2009). A transmission electron microscopy study of experimentally deformed quartzite with different degrees of
doping. Physics of the Earth and Planetary Interiors, 172(1-2), 55–66. https://doi.org/10.1016/j.pepi.2008.07.009Marone, C. (1998). Laboratory-derived friction laws and their application to seismic faulting. Annual Review of Earth and Planetary Sciences,
26(1), 643–696. https://doi.org/10.1146/annurev.earth.26.1.643Marone, C., & Scholz, C. (1988). The depth of seismic faulting and the upper transition from stable to unstable slip regimes. Geophysical
Research Letters, 15(6), 621–624. https://doi.org/10.1029/GL015i006p00621Nakatani, M. (2001). Conceptual and physical clarification of rate and state friction: Frictional sliding as a thermally activated rheology.
Journal of Geophysical Research, 106(B7), 13,347–13,380. https://doi.org/10.1029/2000JB900453Nakatani, M., & Scholz, C. H. (2004a). Frictional healing of quartz gouge under hydrothermal conditions: 1. Experimental evidence for solution
transfer healing mechanism. Journal of Geophysical Research, 109, B07201. https://doi.org/10.1029/2001JB001522Nakatani, M., & Scholz, C. H. (2004b). Frictional healing of quartz gouge under hydrothermal conditions: 2. Quantitative interpretation with a
physical model. Journal of Geophysical Research, 109, B07202. https://doi.org/10.1029/2003JB002938Nielsen, S., Di Toro, G., Hirose, T., & Shimamoto, T. (2008). Frictional melt and seismic slip. Journal of Geophysical Research, 113, B01308. https://
doi.org/10.1029/2007JB005122Nielsen, S., Mosca, P., Giberti, G., Di Toro, G., Hirose, T., & Shimamoto, T. (2010). On the transient behavior of frictional melt during seismic slip.
Journal of Geophysical Research, 115, B10301. https://doi.org/10.1029/2009JB007020Noda, H. (2008). Frictional constitutive law at intermediate slip rates accounting for flash heating and thermally activated slip process.
Journal of Geophysical Research, 113, B09302. https://doi.org/10.1029/2007JB005406Noda, H., & Lapusta, N. (2013). Stable creeping fault segments can become destructive as a result of dynamic weakening. Nature, 493(7433),
518–521. https://doi.org/10.1038/nature11703Perfettini, H., & Molinari, A. (2017). A micromechanical model of rate and state friction: 1. Static and dynamic sliding. Journal of Geophysical
Research: Solid Earth, 122, 2590–2637. https://doi.org/10.1002/2016JB013302.Platt, J. D., Rudnicki, J. W., & Rice, J. R. (2014). Stability and localization of rapid shear in fluid-saturated fault gouge: 2. Localized zone width
and strength evolution. Journal of Geophysical Research: Solid Earth, 119, 4334–4359. https://doi.org/10.1002/2013JB010711Platt, J. D., Brantut, N., & Rice, J. R. (2015). Strain localization driven by thermal decomposition during seismic shear. Journal of Geophysical
Research: Solid Earth, 120, 4405–4433. https://doi.org/10.1002/2014JB011493Poirier, J. P. (1985). Creep of crystals: High-temperature deformation processes in metals, ceramics and minerals. Cambridge, UK: Cambridge
University Press. https://doi.org/10.1017/CBO9780511564451Proctor, B. P., Mitchell, T. M., Hirth, G., Goldsby, D., Zorzi, F., Platt, J. D., & Di Toro, G. (2014). Dynamic weakening of serpentinite gouges and
bare surfaces at seismic slip rates. Journal of Geophysical Research: Solid Earth, 119, 8107–8131. https://doi.org/10.1002/2014JB011057Putelat, T., Dawes, J. H., & Willis, J. R. (2011). On the microphysical foundations of rate-and-state friction. Journal of the Mechanics and Physics
of Solids, 59(5), 1062–1075. https://doi.org/10.1016/j.jmps.2011.02.002Reches, Z. E., & Lockner, D. A. (2010). Fault weakening and earthquake instability by powder lubrication. Nature, 467(7314), 452–455. https://
doi.org/10.1038/nature09348Rice, J. R. (2006). Heating and weakening of faults during earthquake slip. Journal of Geophysical Research, 111, B05311. https://doi.org/
10.1029/2005JB004006Rice, J. R., Lapusta, N., & Ranjith, K. (2001). Rate and state dependent friction and the stability of sliding between elastically deformable solids.
Journal of the Mechanics and Physics of Solids, 49(9), 1865–1898. https://doi.org/10.1016/S0022-5096(01)00042-4Rubinstein, S. M., Cohen, G., & Fineberg, J. (2004). Detachment fronts and the onset of dynamic friction. Nature, 430(7003), 1005–1009.
https://doi.org/10.1038/nature02830Ruina, A. (1983). Slip instability and state variable friction laws. Journal of Geophysical Research, 88(10), 359–310.Scholz, C. H. (1972). Static fatigue of quartz. Journal of Geophysical Research, 77(11), 2104–2114. https://doi.org/10.1029/JB077i011p02104Scholz, C. H. (1988). The brittle-plastic transition and the depth of seismic faulting. Geologische Rundschau, 77(1), 319–328. https://doi.org/
10.1007/BF01848693Scholz, C. H. (1998). Earthquakes and friction laws. Nature, 391(6662), 37–42. https://doi.org/10.1038/34097Scholz, C. H. (2002). The mechanics of earthquakes and faulting. Cambridge, UK: Cambridge University Press. https://doi.org/10.1017/
CBO9780511818516Scholz, C. H., & Engelder, T. (1976). Role of asperity indentation and ploughing in rock friction. International Journal of Rock Mechanics and
Mining Sciences, 13(5), 149–154. https://doi.org/10.1016/0148-9062(76)90819-6Scholz, C. H., Molnar, P., & Johnson, T. (1972). Detailed studies of frictional sliding of granite and implications for earthquake mechanism.
Journal of Geophysical Research, 77(32), 6392–6406. https://doi.org/10.1029/JB077i032p06392Shimamoto, T. (1986). Transition between frictional slip and ductile flow for halite shear zones at room temperature. Science, 231(4739),
711–714. https://doi.org/10.1126/science.231.4739.711Shimamoto, T., & Noda, H. (2014). A friction to flow constitutive law and its application to a 2-D modeling of earthquakes. Journal of
Siman-Tov, S., Aharonov, E., Sagy, A., & Emmanuel, S. (2013). Nanograins form carbonate fault mirrors. Geology, 41(6), 703–706. https://doi.org/10.1130/G34087.1
Siman-Tov, S., Aharonov, E., Boneh, Y., & Reches, Z. E. (2015). Fault mirrors along carbonate faults: Formation and destruction during shearexperiments. Earth and Planetary Science Letters, 430, 367–376. https://doi.org/10.1016/j.epsl.2015.08.031
Spagnuolo, E., Nielsen, S., Violay, M., & Di Toro, G. (2016). An empirically-based steady-state friction law and implications for fault stability.Geophysical Research Letters, 43, 3263–3271. https://doi.org/10.1002/2016GL067881
Sulem, J., & Famin, V. (2009). Thermal decomposition of carbonates in fault zones: Slip-weakening and temperature-limiting effects. Journalof Geophysical Research, 114, B06311. https://doi.org/10.1029/2009JB006576
Tsenn, M. C., & Carter, N. L. (1987). Upper limits of power law creep of rocks. Tectonophysics, 136(1-2), 1–26. https://doi.org/10.1016/0040-1951(87)90332-5
Van Diggelen, E. W., De Bresser, J. H., Peach, C. J., & Spiers, C. J. (2010). High shear strain behaviour of synthetic muscovite fault gouges underhydrothermal conditions. Journal of Structural Geology, 32(11), 1685–1700. https://doi.org/10.1016/j.jsg.2009.08.020
Verberne, B. A., Spiers, C. J., Niemeijer, A. R., De Bresser, J. H. P., De Winter, D. A. M., & Plümper, O. (2014). Frictional properties andmicrostructure of calcite-rich fault gouges sheared at sub-seismic sliding velocities. Pure and Applied Geophysics, 171(10), 2617–2640.https://doi.org/10.1007/s00024-013-0760-0
Verberne, B. A., Plümper, O., de Winter, D. M., & Spiers, C. J. (2014). Superplastic nanofibrous slip zones control seismogenic fault friction.Science, 346(6215), 1342–1344. https://doi.org/10.1126/science.1259003
Verberne, B. A., Niemeijer, A. R., De Bresser, J. H., & Spiers, C. J. (2015). Mechanical behavior and microstructure of simulated calcite faultgouge sheared at 20–600°C: Implications for natural faults in limestone. Journal of Geophysical Research: Solid Earth, 120, 8169–8196.https://doi.org/10.1002/2015JB012292
Vosteen, H. D., & Schellschmidt, R. (2003). Influence of temperature on thermal conductivity, thermal capacity and thermal diffusivity fordifferent types of rock. Physics and Chemistry of the Earth, Parts A/B/C, 28(9-11), 499–509. https://doi.org/10.1016/S1474-7065(03)00069-X
Weeks, J. D., & Tullis, T. E. (1985). Frictional sliding of dolomite: A variation in constitutive behavior. Journal of Geophysical Research, 90(B9),7821–7826. https://doi.org/10.1029/JB090iB09p07821
Wiederhorn, S. M., & Bolz, L. H. (1970). Stress corrosion and static fatigue of glass. Journal of the American Ceramic Society, 53(10), 543–548.https://doi.org/10.1111/j.1151-2916.1970.tb15962.x
Yao, L., Ma, S., Niemeijer, A. R., Shimamoto, T., & Platt, J. D. (2016). Is frictional heating needed to cause dramatic weakening of nanoparticlegouge during seismic slip? Insights from friction experiments with variable thermal evolutions. Geophysical Research Letters, 43,6852–6860. https://doi.org/10.1002/2016GL069053
Journal of Geophysical Research: Solid Earth 10.1002/2016JB013829
AHARONOV AND SCHOLZ A PHYSICS-BASED FRICTION LAW 1614