64
| 1 1 A Plan for the Future 10-Year Strategy for the Air Traffic Control Workforce 2015 – 2024
| 1 1
A Plan for the Future10-Year Strategy for the Air Traffic Control Workforce
2015 – 2024

|
This 2015 report is the FAA’s tenth annual update to the controller workforce plan. The
FAA issued the first comprehensive controller workforce plan in December 2004. It
provides staffing ranges for all of the FAA’s air traffic control facilities and actual onboard
controllers as of September 20, 2014.
SECTION (221) OF PUBLIC LAW (108-176) (UPDATED BY PUBLIC LAW 111-
117) REQUIRES THE FAA ADMINISTRATOR TO TRANSMIT A REPORT TO THE
SENATE COMMITTEE ON COMMERCE, SCIENCE AND TRANSPORTATION AND
THE HOUSE OF REPRESENTATIVES COMMITTEE ON TRANSPORTATION AND
INFRASTRUCTURE THAT DESCRIBES THE OVERALL AIR TRAFFIC CONTROLLER
WORKFORCE PLAN. IT IS DUE BY MARCH 31 OF EACH FISCAL YEAR, OTHERWISE
THE FAA’S APPROPRIATION IS REDUCED BY $100,000 FOR EACH DAY IT IS LATE.

Table of Contents | 3 3
4 Executive Summary6 Chapter 1: Introduction6 Staffing to Traffic8 Meeting the Challenge10 Chapter 2: Facilities and Services10 Terminal and En Route Air Traffic Services10 FAA Air Traffic Control Facilities12 Chapter3:StaffingRequirements15 Staffing Ranges20 Air Traffic Staffing Standards Overview22 Tower Cab Overview23 TRACON Overview24 En Route Overview24 Summary25 Air Traffic Staffing Standards Review26 Air Traffic Controller Scheduling27 Specify Demand28 Manage a Schedule/Day of Operation Views29 OPAS Lite30 Air Traffic Scheduling Software Review31 Technological Advances32 Chapter 4: Losses 32 Controller Loss Summary33 Actual Controller Retirements34 Controller Workforce Age Distribution35 Controller Retirement Eligibility36 Controller Retirement Pattern
37 Controller Losses Due to Retirements38 Controller Losses Due to Resignations,
Removals and Deaths38 Developmental Attrition38 Academy Attrition39 Controller Losses Due to Promotions and
Other Transfers40 Total Controller Losses42 Chapter5:HiringPlan43 Controller Hiring Profile44 Trainee-to-Total-Controller Percentage47 Chapter6:HiringProcess47 Controller Hiring Sources47 Recruitment48 Chapter7:Training48 FAA’s Call to Action48 The Training Process49 FAA Academy Training49 FAA Facility Training49 Recurrent Training49 Infrastructure Investments50 Time to Certification50 Preparing for NextGen52 Chapter8:FundingStatus53 AppendixA:EnRouteFacilityController
StaffingRanges54 Appendix B: Terminal Facility Controller
StaffingRanges
Table of Contents

Executive Summary
4 A Plan for the Future: 10-Year Strategy for the Air Traffic Control Workforce|
Safety is the top priority of the Federal Aviation Administration (FAA) as it manages America’s National Airspace System
(NAS). Thanks to the expertise of people and the support of technology, tens of thousands of aircraft are guided safely and expeditiously every day through the NAS to their destinations. WORKLOADAn important part of managing the NAS involves actively aligning controller resources with demand. The FAA “staffs to traffic,” matching the number of air traffic controllers at its facilities with traffic volume and workload. The FAA’s staffing needs are dynamic due to the dynamic nature of the workload and traffic volume.
TRAFFICAir traffic demand has declined significantly since 2000, the peak year for traffic. For the purposes of this plan, air traffic includes aircraft that are controlled, separated and managed by air traffic controllers. This includes commercial passenger and cargo aircraft as well as general aviation and military aircraft. Since 2000 traffic volume has declined by 24 percent and is not expected to return to those levels in the near term.
HEADCOUNTIn many facilities, the current Actual on Board (AOB) number may exceed the facility’s target staffing ranges. This is because many facilities’ current AOB (all controllers at the facility) numbers include many developmental controllers in training to offset expected future attrition. While the FAA strives to keep Certified Professional Controllers (CPC) and Certified Professional Controllers in Training (CPC-IT) within the range, individual facilities can be above the range due to advance hiring. The FAA hires and staffs facilities so that trainees are fully prepared to take over responsibilities when senior controllers leave.
RETIREMENTSFiscal year 2014 retirements were close to projections, and also slightly higher than 2013 actuals, while 2015 retirements are currently tracking in line with the 2015 projected figure from last year’s controller workforce plan. Annual retirements continue to fall since the long-anticipated wave of retirements crested eight years ago, in 2007. Retirements are expected to continue to fall in the next decade. In the last five years, 2,975 controllers have retired. The FAA carefully tracks actual retirements and projects future losses to ensure its recruitment and training keep pace.

Executive Summary | 5 5
HIRINGIn the last five years, the FAA has hired approximately 4,400 new air traffic controllers. We plan to hire more than 6,300 new controllers over the next five years to keep pace with expected attrition and traffic growth. Due to the continuing effects of the hiring freeze from March 2013 through December 2013, the FAA hired 1,112 controllers compared to the previously reported plan of 1,286.
TRAININGAs the FAA brings these new employees on board, training continues to be closely monitored at all facilities. We must carefully manage the process to ensure that our trainees are hired in the places we need them and progress in a timely manner to become certified professional controllers (CPC). The FAA will also continue to take action at the facility level should adjustments become necessary due to changes in traffic volume, retirements or other attrition.
The FAA continues its efforts in response to an Independent Review Panel in 2011 that focused on air traffic controller selection, assignment and training. The panel, part of a nationwide Call to Action on air traffic control safety and professionalism, delivered its comprehensive set of recommendations to the agency for review and implementation.
Ongoing hiring and training initiatives, as well as increased simulator use, are helping the FAA meet its goals. While the FAA is managing today’s air traffic, we must also integrate new technologies into air traffic operations. From state-of-the-art simulators to satellite technology, air traffic is evolving into a more automated system. The FAA is working diligently to ensure well-trained controllers continue to uphold the highest safety standards as we plan for the future.
The FAA’s goal is to ensure that the agency has the flexibility to match the number of controllers at each facility with traffic volume and workload. Staffing to traffic is just one of the ways we manage America’s National Airspace System.
Chapter 1: Introduction
6 A Plan for the Future: 10-Year Strategy for the Air Traffic Control Workforce|
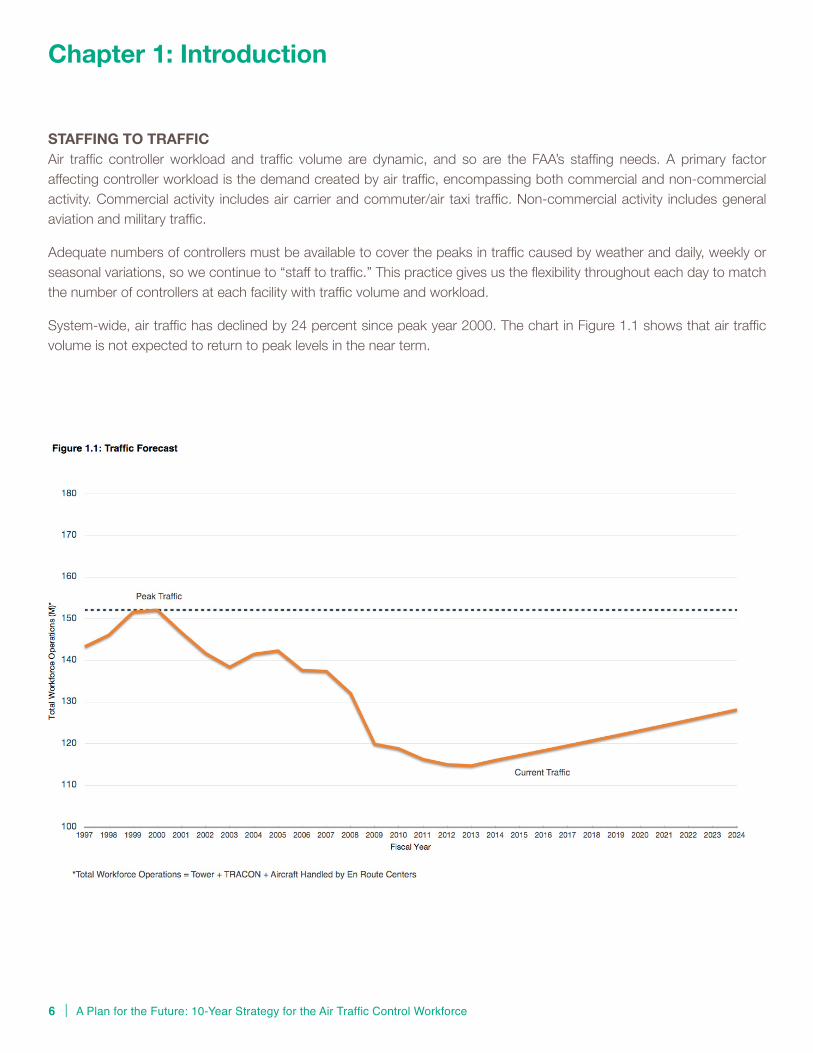
STAFFINGTOTRAFFICAir traffic controller workload and traffic volume are dynamic, and so are the FAA’s staffing needs. A primary factor affecting controller workload is the demand created by air traffic, encompassing both commercial and non-commercial activity. Commercial activity includes air carrier and commuter/air taxi traffic. Non-commercial activity includes general aviation and military traffic.
Adequate numbers of controllers must be available to cover the peaks in traffic caused by weather and daily, weekly or seasonal variations, so we continue to “staff to traffic.” This practice gives us the flexibility throughout each day to match the number of controllers at each facility with traffic volume and workload.
System-wide, air traffic has declined by 24 percent since peak year 2000. The chart in Figure 1.1 shows that air traffic volume is not expected to return to peak levels in the near term.

Chapter 1: Introduction | 7 7
Figure 1.2 shows system-wide controller staffing and traffic, indexed from 2000 and projected through 2024. Indexing is a widely used technique which compares the change over time of two or more data series (in this case, total controller headcount, certified profession controllers (CPC) and certified professional controllers in training (CPC-IT) and traffic). The data series are set equal to each other (or indexed) at a particular point in time (in this case, the year 2000, a high mark for traffic) and measured relative to that index point in each successive year. This way we know how much growth or decline has occurred compared to the base value.
Staffing to traffic not only applies on a daily basis, but also means that we staff to satisfy expected needs two to three years in advance. We do this to ensure sufficient training time for new hires. Despite the decline in air traffic shown in the figure below, “staffing to traffic” requires us to anticipate controller attrition, so that we plan and hire new controllers in advance of need. This is one reason that staffing remains well ahead of traffic. The gap between the green line (Headcount) and the orange line (CPC and CPC-IT staffing) is the advance hire trainee pipeline and is projected to close significantly by 2020. The headcount and CPC+CPC-IT lines converge due to reduced retirements and other losses.
8 A Plan for the Future: 10-Year Strategy for the Air Traffic Control Workforce|
MEETINGTHECHALLENGEThe FAA hires in advance to reflect all attrition, not just retirements. While the long-predicted wave of retirements has passed, we revised our plan to increase FY 2015 and FY 2016 hires so that we can catch up from the effects of sequestration and a hiring freeze experienced in the first three months of FY 2014.
The FAA’s current hiring plan has been designed to phase in new hires as needed over time. This will avoid creating another major spike in retirement eligibility in future years like the one resulting from the 1981 controller strike. Annual retirements continue to fall as the long-anticipated wave of retirements crested eight years ago, in 2007. Retirements are expected to continue to fall for the next decade. Starting in FY 2017 we will enter a steady-state period in which we expect new hires to approximately mirror the number of losses for the next several years.
Hiring, however, is just one part of the challenge. Other challenges involve controller placement, controller training and controller scheduling. It is important that newly hired and transferring controllers are properly placed in the facilities where we will need them. Once they are placed, they need to be effectively and efficiently trained, and assigned to efficient work schedules.
To address these challenges, the FAA has:
• Convened an Independent Review Panel that focused on air traffic controller selection, assignment and training.
• Implemented changes to its air traffic control hiring process.
• Procured a commercially available off-the-shelf scheduling product that provides a common toolset for FAA facilities to effectively develop and maintain optimal schedules based on traffic, staffing, work rules and qualifications.
Effective and efficient training, properly placing new and transferring controllers, and efficient scheduling of controllers are all important factors in the agency’s success.
Systematically replacing air traffic controllers where we need them, as well as ensuring the knowledge transfer required to maintain a safe NAS, is the focus of this plan.

Chapter 1: Introduction | 9 9

Chapter 2: Facilities and Services
10 A Plan for the Future: 10-Year Strategy for the Air Traffic Control Workforce|
America’s National Airspace System (NAS) is a network of people, procedures and equipment. Pilots, controllers,
technicians, engineers, inspectors and supervisors work together to make sure millions of passengers move through the airspace safely every day.More than 14,000 federal air traffic controllers in airport traffic control towers, terminal radar approach control facilities and air route traffic control centers guide pilots through the system. An additional 1,280 civilian contract controllers and more than 10,000 military controllers also provide air traffic services for the NAS.
These controllers provide air navigation services to aircraft in domestic airspace, including 24.6 million square miles of international oceanic airspace delegated to the United States by the International Civil Aviation Organization.
TERMINALANDENROUTEAIRTRAFFICSERVICESController teams in airport towers and radar approach control facilities watch over all aircraft traveling through the Terminal airspace. Their main responsibility is to organize the flow of aircraft into and out of an airport. Relying on visual observation and radar, they closely monitor each aircraft to ensure a safe distance between all aircraft and to guide pilots during takeoff and landing. In addition, controllers keep pilots informed about changes in weather conditions.
Once airborne, the aircraft quickly departs the Terminal airspace surrounding the airport. At this point, controllers in the radar approach control notify En Route controllers, who take charge in the vast airspace between airports. There are 21 air route traffic control centers around the country. Each En Route center is assigned a block of airspace containing many defined routes. Aircrafts fly along these designated routes to reach their destination.
En Route controllers use surveillance methods to maintain a safe distance between aircraft. En Route controllers also provide weather advisory and traffic information to aircraft under their control. As an aircraft nears its destination, En Route controllers transition it to the Terminal environment, where Terminal controllers guide it to a safe landing.
FAAAIRTRAFFICCONTROLFACILITIESAs of October 1, 2014, the FAA operated 316 air traffic control facilities, including the Air Traffic Control System Command Center, in the United States. Table 2.1 lists the type and number of these FAA facilities. More than one type of facility may be collocated in the same building.
Each type of FAA facility has several classification levels based on numerous factors, including traffic volume, complexity and sustainability of traffic. To account for changes in traffic and the effect of investments that reduce complexity, as well as to compensate controllers that work the highest and most complex volume of traffic, facilities are monitored for downward and upward trends.

Chapter 2: Facilities and Services | 11 11
Table 2.1: Types and Number of FAA Air Traffic Control Facilities
Type NameNumber
of FacilitiesDescription
1 Tower without Radar 1
An airport traffic control terminal that provides service using direct observation primarily to aircraft operating under visual flight rules (VFR). This terminal is located at airports where the principal user category is low-performance aircraft.
2Terminal Radar Approach Control (TRACON)
24 An air traffic control terminal that provides radar-control service to aircraft arriving or departing the primary airport and adjacent airports, and to aircraft transiting the terminal’s airspace.
3
Combination Radar Approach Control and Tower with Radar
130
An air traffic control terminal that provides radar-control service to aircraft arriving or departing the primary airport and adjacent airports, and to aircraft transiting the terminal’s airspace. This terminal is divided into two functional areas: radar approach control positions and tower positions. These two areas are located within the same facility, or in close proximity to one another, and controllers rotate between both areas.
4
Combination Non-Radar Approach Control and Tower without Radar
2An air traffic control terminal that provides air traffic control services for the airport at which the tower is located and without the use of radar, approach and departure control services to aircraft operating under instrument flight rules (IFR) to and from one or more adjacent airports.
6 Combined Control Facility 4
An air traffic control facility that provides approach control services for one or more airports as well as en route air traffic control (center control) for a large area of airspace. Some may provide tower services along with approach control and en route services. Also includes Combined Center Radar Approach (CERAP) facilities.
7 Tower with Radar 130An airport traffic control terminal that provides traffic advisories, spacing, sequencing and separation services to VFR and IFR aircraft operating in the vicinity of the airport, using a combination of radar and direct observations.
8Air Route Traffic Control Center (ARTCC)
21
An air traffic control facility that provides air traffic control service to aircraft operating on IFR flight plans within controlled airspace and principally during the en route phase of flight. When equipment capabilities and controller workload permit, certain advisory/assistance services may be provided to VFR aircraft.
9 Combined TRACON Facility 3
An air traffic control terminal that provides radar approach control services for two or more large hub airports, as well as other satellite airports, where no single airport accounts for more than 60 percent of the total Combined TRACON facility’s air traffic count. This terminal requires such a large number of radar control positions that it precludes the rotation of controllers through all positions.
—Air Traffic Control System Command Center
1The Air Traffic Control System Command Center is responsible for the strategic aspects of the NAS. The Command Center modifies traffic flow and rates when congestion, weather, equipment outages, runway closures or other operational conditions affect the NAS.
Total 316
Chapter3:StaffingRequirements
12 A Plan for the Future: 10-Year Strategy for the Air Traffic Control Workforce|
The FAA issued the first comprehensive controller workforce plan in December 2004. “A Plan for the Future: 10-Year
Strategy for the Air Traffic Control Workforce” detailed the resources needed to keep the controller workforce sufficiently staffed. This report is updated each year to reflect changes in traffic forecasts, retirements and other factors.“Staffing to traffic” requires the FAA to consider many facility-specific factors. They include traffic volumes based on FAA forecasts and hours of operation, as well as individualized forecasts of controller retirements and other non-retirement losses. In addition, staffing at each location can be affected by unique facility requirements such as temporary airport runway construction, seasonal activity and the number of controllers currently in training. Staffing numbers will vary as the requirements of the location dictate.
Proper staffing levels also depend on the efficient scheduling of employees, so the FAA tracks a number of indicators as part of its continuous staffing review. Some of these indicators are overtime, time on position, leave usage and the number of trainees. For example, in FY 2014, the system average for overtime was 2.1 percent, a slight increase from the FY 2013 level. Meanwhile, average time on position was 4 hours and 10 minutes, a two-minute increase over FY 2013.
The FAA hires and staffs facilities so that trainees are fully prepared to take over responsibilities when senior controllers retire.
Chapter 3: Staffing Requirements | 13 13
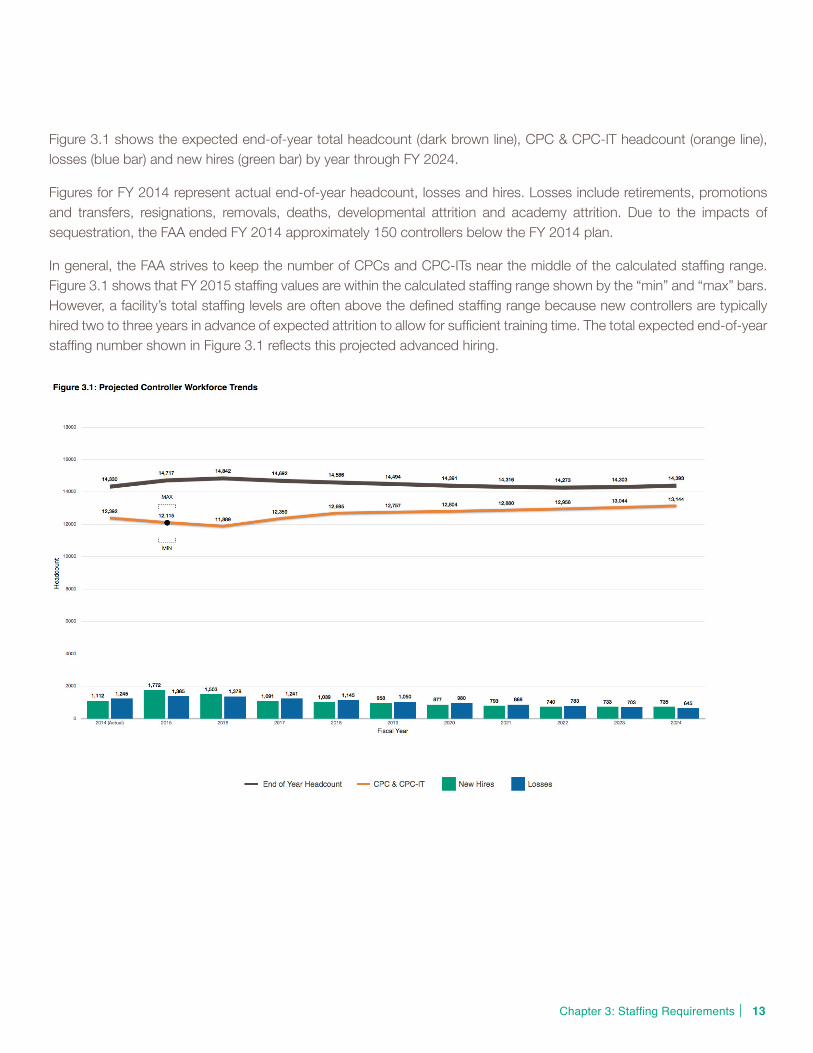
Figure 3.1 shows the expected end-of-year total headcount (dark brown line), CPC & CPC-IT headcount (orange line), losses (blue bar) and new hires (green bar) by year through FY 2024.
Figures for FY 2014 represent actual end-of-year headcount, losses and hires. Losses include retirements, promotions and transfers, resignations, removals, deaths, developmental attrition and academy attrition. Due to the impacts of sequestration, the FAA ended FY 2014 approximately 150 controllers below the FY 2014 plan.
In general, the FAA strives to keep the number of CPCs and CPC-ITs near the middle of the calculated staffing range. Figure 3.1 shows that FY 2015 staffing values are within the calculated staffing range shown by the “min” and “max” bars. However, a facility’s total staffing levels are often above the defined staffing range because new controllers are typically hired two to three years in advance of expected attrition to allow for sufficient training time. The total expected end-of-year staffing number shown in Figure 3.1 reflects this projected advanced hiring.

14 A Plan for the Future: 10-Year Strategy for the Air Traffic Control Workforce|
The FAA uses manymetrics to manage its facilities.
RETIREMENTS TRAINEESSTAFFINGRANGES
TRAFFICOVERTIMETIME ON POSITION
FIELD INPUTSIMULATORS AND
INSTRUCTORSPRODUCTIVE
TIME
Chapter 3: Staffing Requirements | 15 15
STAFFINGRANGESEach of the FAA’s 315 facilities typically staffs open positions with a combination of certified controllers who are proficient, or checked out, in specific sectors or positions. Because traffic and other factors are dynamic at these facilities, the FAA produces facility-level controller staffing ranges. These ranges are calculated to ensure that there are enough controllers to cover operating positions every day of the year.
Ensuring that we have enough controllers is not only important on a daily basis, but also means that we staff to satisfy expected needs two to three years in advance. We do this to ensure sufficient training time for new hires. The uptick caused by hiring two to three years ahead of time is one reason that staffing remains well ahead of traffic.
The FAA uses four data sources to calculate staffing ranges. Three are data driven; the other is based on field judgment. They are:
1. Staffing standards — output of mathematical models used to relate controller workload and air traffic activity.
2. Service unit input — the number of controllers required to staff the facility, typically based on past position utilization and other unique facility operational requirements. The service unit input is validated by field management.
3. Past productivity — the headcount required to match the historical best productivity for the facility. Productivity is defined as operations per controller. Facility productivity is calculated using operations and controller data from the years 2000 to 2014. If any annual point falls outside +/- 5 percent of the 2000 to 2014 average, it is eliminated from the analysis. From the remaining data points, the highest productivity year is then used.
4. Peer productivity — the headcount required to match peer group productivity. Like facilities are grouped by type, level and part-time or full-time status, and their corresponding productivity is calculated. If the facility being considered is consistently above or below the peer group, the peer group figure is not used in the overall average and analysis.
The average of this data is calculated, multiplied by +/- 10 percent and then rounded to determine the high and low points in the staffing range.
Exceptional situations or outliers are removed from the averages (for example, if a change in the type or level of a facility occurred over the period of evaluation). By analyzing the remaining data points, staffing ranges are generated for each facility.

16 A Plan for the Future: 10-Year Strategy for the Air Traffic Control Workforce|
The 2015 staffing ranges for certified controllers are published by facility in the Appendixes of this report. In general, the FAA strives to keep the number of CPCs and CPC-ITs near the middle of the range. In many facilities, the current Actual on Board (AOB) number may appropriately exceed the range. This is because many facilities’ current AOB (all controllers at the facility) numbers include larger numbers of developmental controllers in training to offset expected future attrition. Individual facilities can be above the range due to advance hiring. Facilities may also be above the range based upon facility-specific training and attrition forecasts.
In the longer term, the number of new hires and total controllers will decline. This is because the surge of developmental controllers that were hired to replace the long-expected retirement wave over the past decade will have become CPCs. In the future, the vast majority of the controllers will be CPCs and CPC-ITs, and more facilities will routinely fall within the ranges.
Figure 3.2: Controller Staffing
Characteristics/Drivers of High Staffing Levels
• Inefficient scheduling
• Fewer losses than projected
• Less overtime
• Reduction in traffic volumes
• Decrease in hours of operation
• Temporary airport construction
• Higher number of position-qualified controllers
• Higher number of advance hire traineesController Staffing
Facility X Staffing
High
Low
Characteristics/Drivers of Low Staffing Levels
• Reduced controller lost time
• Greater use of overtime
• Increase in traffic volumes
• Increase in hours of operation
• Lower number of position-qualified controllers
• Lower number of advance hire trainees

Chapter 3: Staffing Requirements | 17 17
Figure 3.3 depicts an example of a large, Type 3 FAA facility. This Combination Radar Approach Control and Tower with Radar facility is one in which controllers work in the tower cab portion and in the radar room (also known as a TRACON). To be a CPC in these types of facilities, controllers must be checked out on all positions in both the tower and the TRACON.
Trainees are awarded “D1” status (and the corresponding increase in pay) after being checked out on several positions. The levels of responsibility (and pay) gradually increase as the trainees progress through training. Once developmental controllers are checked out at the D1 level, they can work several positions in the tower independently and without training supervision (Clearance Delivery, Ground Control and Local Control). Once checked out on the Runway Crossing Coordinator position, developmental controllers would be tower certified and able to work any position in the tower cab independently and without training supervision. They would still not be a “D2” however, as there are also several positions in the TRACON to be checked out on (Arrival Data, Departure Data, Final Vector 1 and Final Vector 2). A controller in Figure 3.3 must be certified on all positions in the tower and TRACON to become a CPC.
Figure 3.3: Controller Training Progression

18 A Plan for the Future: 10-Year Strategy for the Air Traffic Control Workforce|
The levels of responsibility continue to increase as one progresses toward CPC status, but trainees can and do control traffic much earlier in the training process. Historically, the FAA has used these position-qualified controllers to staff operations and free up CPCs for more complex positions as well as to conduct training.
Having the majority of the workforce certified as CPCs makes the job of scheduling much easier at the facility. CPCs can cover all positions in their assigned area, whereas position-qualified developmentals require the manager to track who is qualified to work which positions independently. This task becomes much easier with a scheduling tool.
Trainees include both developmental controllers and certified professional controllers in training (CPC-IT). A CPC-IT is a controller who moves to another area within a facility or to a new facility and must be trained to the qualifications of that new environment. CPC-ITs are different from developmentals in that developmentals have never been fully checked out and certified as a CPC anywhere.

Chapter 3: Staffing Requirements | 19 19

20 A Plan for the Future: 10-Year Strategy for the Air Traffic Control Workforce|
AIRTRAFFICSTAFFINGSTANDARDSOVERVIEWThe FAA has used air traffic staffing standards to help determine controller staffing levels since the 1970s FAA facilities are currently identified and managed as either Terminal facilities where airport traffic control services are provided, including the immediate airspace around an airport, or En Route facilities where high-altitude separation services are provided using computer systems and surveillance technologies. Terminal facilities are further designated as tower cabs or TRACONs. These Terminal facilities may be collocated in the same building, but because of differences in workload, their staffing requirements are modeled separately. Figure 3.4 provides an overview of FAA facilities and air traffic control positions.
Figure 3.4: Air Traffic Control Position and Facility Overview
Airport Traf�c Control Tower (ATCT)
Airport Surface Terminal Departure En Route/Oceanic Terminal Arrival Airport Surface
Airport Traf�c Control Tower (ATCT)
Ground ControllerIssues approval for push back from gate and issues taxi instructions and clearances.
Local ControllerIssues takeoff clearances, maintains prescribed separation between departure aircraft, provides departure aircraft with latest weather/�eld conditions.
Clearance DeliveryIssues IFR and VFR �ight plan clearances.
Flight DataReceives and relays weather information and Notice to Airmen.
Departure ControllerAssigns headings and altitudes to departure aircraft. Hands off aircraft to the En Route Radar Controller.
Flight Data - RadarIssues IFR �ight plan clearances to aircraft at satellite airports, coordinates releases of satellite departures.
Radar ControllerEnsures the safe separation and orderly �ow of aircraft through En Route center airspace (includes oceanic airspace).
Radar AssociateAssists the Radar Controller.
Radar Associate (Flight Data)Supports the Center Radar Controller by handling �ight data.
Arrival ControllerAssigns headings and altitudes to arrival aircraft to establish aircraft on �nal approach course.
Local ControllerIssues landing clearances, maintains prescribed separation between arrivals, provides arrival aircraft with latest weather/�eld conditions.
Ground ControllerIssues taxi instructions and clearances to guide aircraft to the gate.
Terminal Radar Approach Control (TRACON)
Air Route Traf�c Control Center (ARTCC)
Terminal Radar Approach Control (TRACON)
Push back, taxi and takeoffAscent
Cruise Cruise
Descent and Landing and taxi to gateapproach
AIRPORTTRAFFICCONTROLTOWER(ATCT)GroundControllerIssues approval for push back from gate and issues taxi instructions and clearances.
Local ControllerIssues takeoff clearances, maintains prescribed separation between departure aircraft, provides departure aircraft with latest weather/field conditions.
ClearanceDeliveryIssues IFR and VFR flight plan clearances.
FlightDataReceives and relays weather information and Notice to Airmen.
TERMINALRADARAPPROACHCONTROL(TRACON)DepartureControllerAssigns headings and altitudes to departure aircraft. Hands off aircraft to the En Route Radar Controller.
FlightData—RadarIssues IFR flight plan clearances to aircraft at satellite airports, coordinates releases of satellite departures.
AIRROUTETRAFFICCONTROLCENTER(ARTCC)RadarControllerEnsures the safe separation and orderly flow of aircraft through En Route center airspace (includes oceanic airspace).
RadarAssociateAssists the Radar Controller.
AIRROUTETRAFFICCONTROLCENTER(ARTCC)RadarAssociate(FlightData)Supports the Center Radar Controller by handling flight data.
TERMINALRADARAPPROACHCONTROL(TRACON)Arrival ControllerAssigns headings and altitudes to arrival aircraft to establish aircraft on final approach course.
AIRPORTTRAFFICCONTROLTOWER(ATCT)Local ControllerIssues landing clearances, maintains prescribed separation between arrivals, provides arrival aircraft with latest weather/field conditions.
GroundControllerIssues taxi instructions and clearances to guide aircraft to the gate.

Chapter 3: Staffing Requirements | 21 21
Airport Traf�c Control Tower (ATCT)
Airport Surface Terminal Departure En Route/Oceanic Terminal Arrival Airport Surface
Airport Traf�c Control Tower (ATCT)
Ground ControllerIssues approval for push back from gate and issues taxi instructions and clearances.
Local ControllerIssues takeoff clearances, maintains prescribed separation between departure aircraft, provides departure aircraft with latest weather/�eld conditions.
Clearance DeliveryIssues IFR and VFR �ight plan clearances.
Flight DataReceives and relays weather information and Notice to Airmen.
Departure ControllerAssigns headings and altitudes to departure aircraft. Hands off aircraft to the En Route Radar Controller.
Flight Data - RadarIssues IFR �ight plan clearances to aircraft at satellite airports, coordinates releases of satellite departures.
Radar ControllerEnsures the safe separation and orderly �ow of aircraft through En Route center airspace (includes oceanic airspace).
Radar AssociateAssists the Radar Controller.
Radar Associate (Flight Data)Supports the Center Radar Controller by handling �ight data.
Arrival ControllerAssigns headings and altitudes to arrival aircraft to establish aircraft on �nal approach course.
Local ControllerIssues landing clearances, maintains prescribed separation between arrivals, provides arrival aircraft with latest weather/�eld conditions.
Ground ControllerIssues taxi instructions and clearances to guide aircraft to the gate.
Terminal Radar Approach Control (TRACON)
Air Route Traf�c Control Center (ARTCC)
Terminal Radar Approach Control (TRACON)
Push back, taxi and takeoffAscent
Cruise Cruise
Descent and Landing and taxi to gateapproach
AIRPORTTRAFFICCONTROLTOWER(ATCT)GroundControllerIssues approval for push back from gate and issues taxi instructions and clearances.
Local ControllerIssues takeoff clearances, maintains prescribed separation between departure aircraft, provides departure aircraft with latest weather/field conditions.
ClearanceDeliveryIssues IFR and VFR flight plan clearances.
FlightDataReceives and relays weather information and Notice to Airmen.
TERMINALRADARAPPROACHCONTROL(TRACON)DepartureControllerAssigns headings and altitudes to departure aircraft. Hands off aircraft to the En Route Radar Controller.
FlightData—RadarIssues IFR flight plan clearances to aircraft at satellite airports, coordinates releases of satellite departures.
AIRROUTETRAFFICCONTROLCENTER(ARTCC)RadarControllerEnsures the safe separation and orderly flow of aircraft through En Route center airspace (includes oceanic airspace).
RadarAssociateAssists the Radar Controller.
AIRROUTETRAFFICCONTROLCENTER(ARTCC)RadarAssociate(FlightData)Supports the Center Radar Controller by handling flight data.
TERMINALRADARAPPROACHCONTROL(TRACON)Arrival ControllerAssigns headings and altitudes to arrival aircraft to establish aircraft on final approach course.
AIRPORTTRAFFICCONTROLTOWER(ATCT)Local ControllerIssues landing clearances, maintains prescribed separation between arrivals, provides arrival aircraft with latest weather/field conditions.
GroundControllerIssues taxi instructions and clearances to guide aircraft to the gate.

22 A Plan for the Future: 10-Year Strategy for the Air Traffic Control Workforce|
The dynamic nature of air traffic controller workload coupled with traffic volume and facility staffing needs are all taken into account during the development of FAA staffing model and standards.
All FAA staffing models incorporate similar elements:
• Controller activity data is collected and processed quarterly, commensurate with the type of work being performed in the facilities.
• Models are developed that relate controller workload to air traffic activity. These requirements are entered into a scheduling algorithm.
• The modeled workload/traffic activity relationship is forecast for the 90th percentile (or 37th busiest) day for future years for each facility. Staffing based on the demands for the 90th percentile day assures that there are adequate numbers of controllers to meet traffic demands throughout the year.
• Allowances are applied for off-position activities such as vacation, training and additional supporting activities that must be accomplished off the control floor.
All staffing models go through similar development processes. Some components of the model-development phase vary as a function of the work being performed by the controllers. For example, a crew-based approach was used to model tower staffing requirements because the number and type of positions in a tower cab vary considerably as traffic changes, compared to those of a single sector in a TRACON or En Route center. All staffing models reflect the dynamic nature of staffing and traffic. Controller staffing requirements can vary throughout the day and throughout the year.
TOWERCABOVERVIEWAir traffic controllers working in tower cabs manage traffic within a radius of a few miles of the airport. They instruct pilots during taxiing, takeoff and landing, and they grant clearance for aircraft to fly. Tower controllers ensure that aircraft maintain minimum separation distances between landing and departing aircraft, transfer control of aircraft to TRACON controllers when the aircraft leave their airspace, and receive control of aircraft for flights coming into their airspace.
• There are a variety of positions in the tower cab, such as Local Control, Ground Control, Flight Data, Coordinator, etc. Depending on the airport layout and/or size of the tower cabs (some airports have more than one tower), there can be more than one of the same types of position on duty.
• As traffic, workload and complexity increase, more or different positions are opened; as traffic, workload and complexity decrease, positions are closed or combined with other positions. In practice, minimum staffing levels may be determined by hours of operation and work rules.
Important factors that surfaced during the tower staffing model development included the availability, accessibility and increased reliability of traffic data and controller on-position reporting systems. The FAA is now able to analyze much larger quantities of tower data at a level of granularity previously unattainable. Staffing data and traffic volumes are collected for every facility.
Chapter 3: Staffing Requirements | 23 23
The revised tower cab staffing models were developed using regression analysis as the primary method for modeling the relationship between staffing and workload drivers. The models relate observed, on-position controllers to the type and amount of traffic they actually handle. Regression analysis allows us to relate modeled controller staffing requirements with traffic activity and then use this relationship to predict future staffing requirements (standards) based on traffic projections.
TRACONOVERVIEWAir traffic controllers working in TRACONs typically manage traffic within a 40-mile radius of the primary airport; however, this radius varies by facility. They instruct departing and arriving flights, and they grant clearance for aircraft to fly through the TRACON’s airspace. TRACON controllers ensure that aircraft maintain minimum separation distances between landing and departing aircraft, transfer control of aircraft to tower or En Route center controllers when the aircraft leave their airspace, and receive control of aircraft for flights coming into their airspace.
• TRACON airspace is divided into sectors that often provide services to multiple airports. Consolidated or large TRACONs in major metropolitan areas provide service to several primary airports. Their airspace is divided into areas of specialization, each of which contains groups of sectors.
• Controllers are assigned to various positions such as Radar, Final Vector, Departure Data, etc., to work traffic within each sector. These positions may be combined or de-combined based on changes in air traffic operations.
• As traffic, workload and complexity increase, the sectors may be subdivided (de-combined) and additional positions opened, or the sector sizes can be maintained with an additional controller assigned to an assistant position within the same sector.
• Similarly, when traffic, workload and complexity decline, the additional positions can be closed or the sectors recombined. In practice, minimum staffing levels may be determined by hours of operation and work rules.
Like the tower analysis, the FAA is able to analyze much larger quantities of TRACON data at a level of granularity previously unattainable. Important factors surfaced during the TRACON staffing model review including the availability, accessibility and increased reliability of traffic data and controller on-position reporting systems. Staffing data and traffic volumes were collected for every facility.
The TRACON staffing models were updated in early 2009. These revised TRACON models were developed using regression analysis as the primary method for modeling the relationship between staffing and workload drivers. The models relate observed, on-position controllers to the type and amount of traffic they actually handled. Regression allows us to relate modeled controller staffing requirements with traffic activity and then use this relationship to predict future staffing requirements (standards) based on traffic projections.

24 A Plan for the Future: 10-Year Strategy for the Air Traffic Control Workforce|
ENROUTEOVERVIEWAir traffic controllers assigned to En Route centers guide aircrafts flying outside of Terminal airspace. They also provide approach control services to small airports around the country where no Terminal service is provided. As aircraft fly across the country, pilots talk to controllers in successive En Route centers.
• En Route center airspace is divided into smaller, more manageable blocks of airspace called areas and sectors.
• Areas are distinct, and rarely change based on changes in traffic. Within those areas, sectors may be combined or de-combined based on changes in air traffic operations.
• Controllers are assigned to positions within the sectors (e.g., Radar, Radar Associate, Tracker). As traffic increases, sectors can be de-combined and additional positions opened, or the sector sizes can be maintained but additional controllers added to assistant positions within the sectors.
• Similarly, when traffic declines, the additional positions can be closed or the sectors recombined. In practice, minimum staffing levels may be determined by hours of operation and work rules.
The FAA’s Federally Funded Research and Development Center, operated by the MITRE Corporation, developed a model to generate data needed for the FAA’s staffing models. Like the tower and TRACON standards models, this approach incorporated actual traffic and more facility-specific data.
MITRE’s modeling approach reflects the dynamic nature of the traffic characteristics in a sector. It estimates the number of controllers, in teams of one to three people, necessary to work the traffic for that sector in 15-minute intervals. Differences in traffic characteristics in a sector could require different numbers of controllers to handle the same volume of traffic. For example, at one time most traffic might be cruising through a sector toward another location requiring minimal controller intervention. At another time, traffic might be climbing and descending through the same sector, a more complex scenario requiring more controllers. The same modeling techniques were applied uniformly to all sectors, providing results based on a common methodology across the country.
SUMMARYThe FAA’s staffing models incorporate output provided by the Tower, TRACON and En Route workload models which is run through a shift scheduling algorithm. Next, factors are applied to cover vacation time, break time, training, etc. Lastly, traffic growth forecasts are applied to provide the annual staffing standards that are incorporated into the staffing ranges presented in this plan for each facility.
Chapter 3: Staffing Requirements | 25 25
AIRTRAFFICSTAFFINGSTANDARDSREVIEWFor more than 50 years, the FAA has developed and applied staffing standard models to help establish staffing requirements for its air traffic control (ATC) facilities. Over this period, independent groups, including the Transportation Research Board (TRB), have scrutinized the data sources and methods used by the FAA. A 1997 report, for example, recommended an approach that combines formal modeled predictions with less formal methods based on expert judgment concerning staffing requirements at individual facilities (TRB 1997). That report noted that controller workforce planning is not a one-size-fits-all problem and observed that national planning needs to recognize features specific to individual ATC facilities. A more recent report reviewed the task load “complexity model” used in generating staffing standards for En Route facilities and offered advice on “ways to improve the modeling process going forward” (TRB 2010, 6).
In the committee’s judgment, the efficacy of the entire staffing process needs to be judged by the extent to which efforts result in the right staffing at all of the FAA’s air traffic facilities. Thus, the extent to which subsequent staffing plans governing the hiring, training and transfer of controllers are properly executed must be considered in addition to the specific model used in generating the staffing standards or the correctness of the staffing ranges.
In September 2010, the National Academy of Sciences completed a review at the FAA’s request of MITRE’s workload modeling capabilities. The review concluded that “the model is superior to past models because it takes into account traffic complexity when estimating task load.” It recommended “obtaining more operational and experimental data on task performance, however, to establish and validate many key model assumptions, relationships and parameters.”
During 2013, the FAA continued its work with MITRE to address the 2010 National Academy of Sciences recommendations. One recommendation was that MITRE observes controllers in the field. In response to this recommendation, MITRE collaborated with the FAA and the National Air Traffic Controllers Association (NATCA) to develop a plan to evaluate the En Route workload model. The evaluation sought to validate the model by ensuring it covers tasks that are the major drivers of workload, quantifies task performance times, and determines task scheduling distributions. The evaluation consisted of two components: field observations and laboratory human-in-the-loop (HITL) experiments. The goals of the evaluation were to assess model task coverage across facilities, evaluate task performance times and distributions, estimate position-to-traffic thresholds, and calibrate a task time development approach for new tasks. These tasks were not completed and presented in time for the July 2014 review mentioned in the paragraphs below.
In July 2014, the National Academy of Sciences completed its review of FAA staffing standards. The study committee consisted of academicians, consultants and a current NATCA controller as well as retired air traffic controllers. Members have expertise in ATC and management, human factors, aviation safety, fatigue and sleep research, workforce planning, staffing models, aviation demand and management, public policy, economics, and budgeting.
The following is a quote from the National Academy of Sciences report: “Overall, the committee found FAA’s staffing standards for terminal ATC facilities to be reasonable for use in developing initial estimates of the number of controllers needed for managing traffic at each facility. However, it had concerns about the validity of the mathematical model used for En Route facilities and the resulting estimates of controller staffing needs. They also felt the steps taken by FAA to create a controller staffing plan from the staffing standards and then execute such plan were obscure. As a result, the committee was unable to determine the extent to which FAA staffing imbalances are being corrected over time to help ensure cost-effective staffing.” The FAA is in the process of consulting with the National Academy of Sciences to review and gain further understanding of the academy’s specific recommendations.

26 A Plan for the Future: 10-Year Strategy for the Air Traffic Control Workforce|
AIRTRAFFICCONTROLLERSCHEDULINGOptimizing controller schedules is a critical aspect of efficient workforce planning, since inefficient facility schedules can lead to excess staffing and/or increased overtime. Currently, the FAA’s air traffic facilities do not have access to a standardized, automated tool to assist them in developing optimal schedules and analyzing long-term workforce planning requirements. FAA facilities currently use a variety of non-standard methods that do not fully incorporate the complex resource management requirements that exist in today’s environment.
To address this need, the FAA has procured a commercially available “off-the-shelf” system that has been configured to FAA-specific requirements (e.g., national labor contract terms, FAA policy). The FAA’s Operational Planning and Scheduling (OPAS) tool can provide a common toolset for FAA facilities to effectively develop and maintain optimal schedules based on traffic, staffing, work rules and employee qualifications. Similar systems are being used by air navigation service providers worldwide and are commonplace in best-practice companies.
More specifically, the FAA envisions the system can be used to create and analyze optimized schedules over variable time frames, with viewing capability in days, weeks, months, seasons and years. The system is able to:
• Generate optimal schedules for a given period (day, pay period, month and year) based on demand, business rule constraints, employee qualification requirements and available resources.
• Calculate optimal shift start times and associated demand in support of national and local bargaining.
• Propose various shifts in the most efficient way to cover demand while abiding by business and contractual rules.
• Calculate projected time on position (signed on and controlling traffic) to staff an area by shift, schedule segment and/or person.
• Run what-if analyses.
• Aid in the assignment of efficiently scheduled overtime.
• Automate shift requests, bid process and other scheduling-related tasks.
The major functionalities in the OPAS application are split into long-term (typically annually), mid-term (generating schedules), and short-term (day of operations). A typical workflow is shown below:
Schedule Generation
Day of Operation
Specify Demand
Generate Shift Start Times
Create Shift Lines
Bidding
LONG TERM
MID TERM
SHORT TERM

Chapter 3: Staffing Requirements | 27 27
SPECIFYDEMANDOPAS determines the minimum number of controllers required to manage traffic based on an inputted demand curve. The demand curve gives the raw staffing required per 15-minute interval in a series of one-week periods. The number of different curves used can vary from one to 52 one-week curves. For example, one demand curve may describe the period from January to February and another the period from February to May, etc. If the summer is a particularly busy time, two separate demand curves can be used (one for the summer and one for the winter). The number of demand curves used in the field is determined after a statistical analysis and consultation with the facility.
OPAS uses a mathematical algorithm to minimize the number of controllers needed to satisfy these demand periods. The first optimizer defines the shift start times and the demand associated with each shift on a daily basis. This minimum demand number helps the facility determine whether it is possible to approve leave, or whether someone needs to be moved from an evening shift to a day shift to adequately cover the traffic demand.
The diagram below shows how OPAS uses the 15-minute demand (green blocks) to create the required shifts in the lower part of the diagram. OPAS allows for a different demand curve for different roles (e.g., controller versus supervisor), thus allowing for optimal schedules to be made for all positions in a facility. The blue line above the green blocks shows how the staffing per shift generated by OPAS more than adequately covers the inputted green demand curve.

28 A Plan for the Future: 10-Year Strategy for the Air Traffic Control Workforce|
In the diagram below, the left pane gives the category, names, and start and end times for the optimal shifts. There are three core shifts (for the day shift, evening shift and midnight shift) and three ancillary shifts per shift category. The last two panes give the demand per shift per day. In this example, since “Sunday” is selected, the last pane gives the minimum demand per shift on Sunday.
MANAGEASCHEDULE/DAYOFOPERATIONVIEWSOther views drill down to show the details of a single day. They allow the user to get a quick overview of what is happening on a given day, including leave, overtime, briefing periods and other duties (like training or special assignments). These views are updated in real time for all viewers as employees enter requests, and changes are made to the schedule.
The views can also address questions such as:
• “Who is scheduled to work today and when?”
• “Who is scheduled to work overtime?”
• “Who has a leave request for today, pending or approved?”

Chapter 3: Staffing Requirements | 29
OPASLITEOPAS Lite is a mobile Web application developed to provide access to many of the major functions within OPAS. It is accessible on modern browsers and devices such as smartphones and tablets. OPAS Lite allows users to view and interact with their schedule anywhere, anytime. Functionality in OPAS Lite also includes a desktop kiosk (view-only mode), quick changing of kiosk users, viewing schedules, submitting requests and proxy requests, and viewing and acting on requests.
30 A Plan for the Future: 10-Year Strategy for the Air Traffic Control Workforce|
AIRTRAFFICSCHEDULINGSOFTWAREREVIEWThe National Academy of Sciences listed in its 2014 report the following potential benefits of sophisticated scheduling software. The software:
• Provides a consistent basis for establishing work schedules that minimize or mitigate the safety risks associated with controller fatigue.
• Ensures that diverse facilities are all capable of generating efficient schedules, particularly at larger facilities where economies of scale may be possible.
• Provides a consistent basis for informing the development of staffing standards at FAA headquarters and the creation of work schedules at the facility level.
The report further stated, “Schedule changes significantly affect the controller workforce. FAA should, as a matter of priority, continue its efforts to develop an improved scheduling tool capable of creating efficient controller work schedules that incorporate fatigue mitigation strategies. The agency should collaborate closely with the National Air Traffic Controllers Association in implementing this improved scheduling capability, notably in adopting schedules that reflect science-based strategies for managing the risks associated with controller fatigue.”
Air Navigation Service Providers “in other countries including Australia, Canada, and Germany have replaced their legacy scheduling tools with sophisticated software capable of incorporating all constraints while generating efficient controller schedules.” – National Academy of Sciences
Chapter 3: Staffing Requirements | 31 31
TECHNOLOGICALADVANCESIn 2014, the FAA made great progress toward completing the foundational phase of the Next Generation Air Transportation System (NextGen). Through En Route Automation Modernization (ERAM), the FAA upgraded automation capabilities in 20 planned En Route centers. In Terminal facilities, the FAA is upgrading its automation platform through the Terminal Automation Modernization and Replacement (TAMR) program. In March 2014, the FAA completed the installation of 634 radios to serve as ground infrastructure for Automatic Dependent Surveillance-Broadcast (ADS-B).
Meanwhile, the FAA continues to move ahead with several other key NextGen programs including Data Communications (Data Comm), NAS Voice System, and Time Based Flow Management (TBFM).
While there are many NextGen technologies on the horizon, ERAM and Data Comm are believed to have to most impact on air traffic controller productivity in the near term.
ERAM technology is foundational to NextGen. Upgrading the 1970s automation platform will advance the transition from a ground-based system of air traffic control to a satellite-based system of air traffic management. ERAM technology processes flight radar data, provides communications and generates display data for air traffic controllers. Future ERAM enhancements could also improve controller productivity, but the scope and precise impact of those enhancements are still under development.
Data Comm is a key transformational program in the NextGen portfolio that provides a digital data mode of communication between air traffic controllers and pilots. It will enable controllers to send routine instructions, such as revised departure clearances and weather-avoiding reroutes, directly to the flight deck with the push of a button. Data Comm will reduce the talk time between controllers and pilots, decreasing the potential for errors in voice communication while enabling controllers to handle more traffic.
Data Comm departure clearance trials at Memphis and Newark airports are coming along well. Each site is using Data Comm 24 hours a day, seven days a week to conduct as many as 80 operations a day. This year, the FAA starts key site testing at Salt Lake Tower, and two control towers in Houston. The FAA is on schedule for deployment at 56 airports starting in 2016, which is based on “challenge” implementation dates agreed to with the NextGen Advisory Committee (NAC), and at all of its En Route control centers starting in 2019.
As part of the NAC prioritization effort, the FAA agreed to concentrate its efforts on four NextGen priorities: (1) increasing the use of Performance Based (or satellite-based) Navigation, (2) making multiple runway operations more efficient, (3) improving surface operations and (4) implementing Data Communications.
Increased productivity and efficiency, and their ultimate impact on the size and composition of the FAA’s workforce, depend on many factors. As with ERAM, the scope and precise impact of NextGen enhancements are still under development.
Over time the relationship between pilots and air traffic controllers will evolve. The relationship between controller and automated systems will similarly evolve. These evolutions will occur gradually and require much testing and analysis to ensure the safety of the system.
Chapter4:LossesPlan
32 A Plan for the Future: 10-Year Strategy for the Air Traffic Control Workforce|
In total, the FAA expects to lose almost 1,400 controllers due to retirements, promotions and other losses this fiscal year.
Other controller losses include transfers, resignations, removals, deaths, developmental attrition and academy attrition.The FAA hires and staffs facilities so that trainees are fully prepared to take over responsibilities when senior controllers leave.
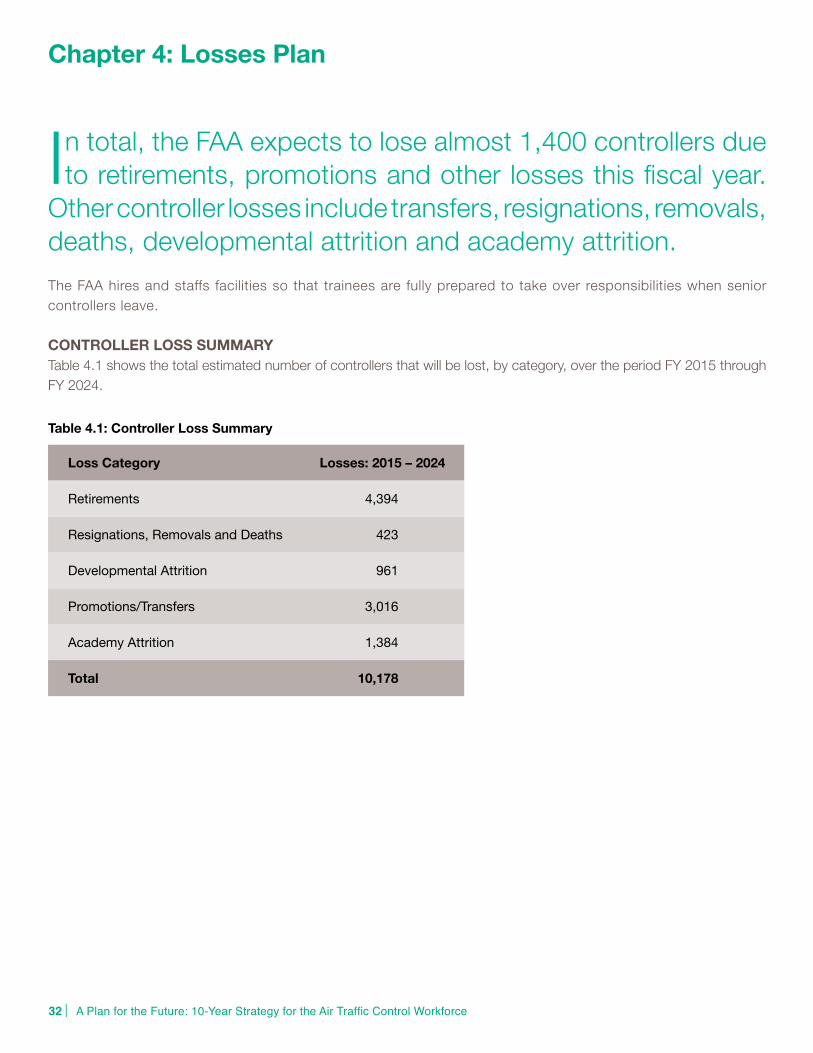
CONTROLLERLOSSSUMMARYTable 4.1 shows the total estimated number of controllers that will be lost, by category, over the period FY 2015 through FY 2024.
Table 4.1: Controller Loss Summary
Loss Category Losses: 2015 – 2024
Retirements 4,394
Resignations, Removals and Deaths 423
Developmental Attrition 961
Promotions/Transfers 3,016
Academy Attrition 1,384
Total 10,178

Chapter 4: Losses Plan | 33 33
ACTUALCONTROLLERRETIREMENTSFiscal year 2007 was correctly projected to be a peak year for retirements of controllers hired in the early 1980s. The long-anticipated retirement wave has passed, and annual retirements are expected to decline for the next ten years.
34 A Plan for the Future: 10-Year Strategy for the Air Traffic Control Workforce|
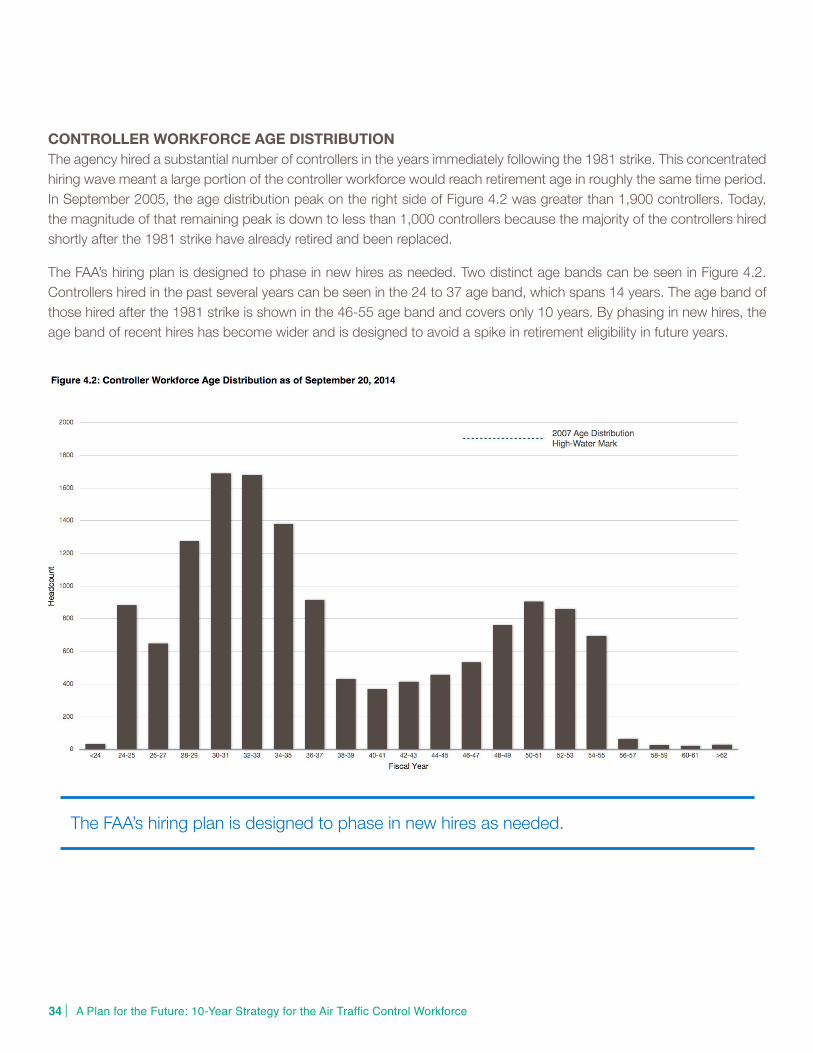
CONTROLLERWORKFORCEAGEDISTRIBUTIONThe agency hired a substantial number of controllers in the years immediately following the 1981 strike. This concentrated hiring wave meant a large portion of the controller workforce would reach retirement age in roughly the same time period. In September 2005, the age distribution peak on the right side of Figure 4.2 was greater than 1,900 controllers. Today, the magnitude of that remaining peak is down to less than 1,000 controllers because the majority of the controllers hired shortly after the 1981 strike have already retired and been replaced.
The FAA’s hiring plan is designed to phase in new hires as needed. Two distinct age bands can be seen in Figure 4.2. Controllers hired in the past several years can be seen in the 24 to 37 age band, which spans 14 years. The age band of those hired after the 1981 strike is shown in the 46-55 age band and covers only 10 years. By phasing in new hires, the age band of recent hires has become wider and is designed to avoid a spike in retirement eligibility in future years.
The FAA’s hiring plan is designed to phase in new hires as needed.

Chapter 4: Losses Plan | 35 35
CONTROLLERRETIREMENTELIGIBILITYIn addition to normal civil service retirement criteria, controllers can become eligible under special retirement criteria for air traffic controllers (age 50 with 20 years of “good time” service or any age with 25 years “good time” service). “Good time” is defined as service in a covered position, as defined in Public Law 92-297. Under Public Law 92-297, air traffic controllers are usually required to retire at age 56.
After computing eligibility dates using all criteria, the FAA assigns the earliest of the dates as the eligibility date. Eligibility dates are then aggregated into classes based on the fiscal year in which eligibility occurs.
Figure 4.3 shows the number of controllers who are currently retirement eligible as of September 2014 and those projected to become retirement eligible each fiscal year through FY 2024. Agency projections show that an additional 373 controllers will become eligible to retire in FY 2015. The number of retirement eligible controllers has been in decline in recent years and should continue to do so for the next few years.
Because of advance hiring, we have already replaced many of the controllers currently eligible to retire. The FAA strives to minimize retirement, hiring and training spikes through the process of examining trends and proactively planning years in advance of expected activity.

36 A Plan for the Future: 10-Year Strategy for the Air Traffic Control Workforce|
CONTROLLERRETIREMENTPATTERNHistory shows that not all controllers retire when they first become eligible. In 2014, 13.3 percent of controllers who first became eligible actually retired. This is comparable to the 13.2 percent in last year’s plan.
Since the economic downturn began in 2008, the FAA has observed that many controllers are delaying retirement until they get closer to the mandatory retirement age of 56. Because most controllers are retirement eligible at the age of 50, they typically reach mandatory retirement age in their seventh year of eligibility.
These trends are seen in Figure 4.4 below, which shows fewer controllers are retiring earlier in their eligibility and are waiting until closer to their mandatory retirement age.
Despite the increased likelihood of delayed retirement, the majority of controllers still leave the controller workforce prior to reaching the mandatory age.
Chapter 4: Losses Plan | 37 37
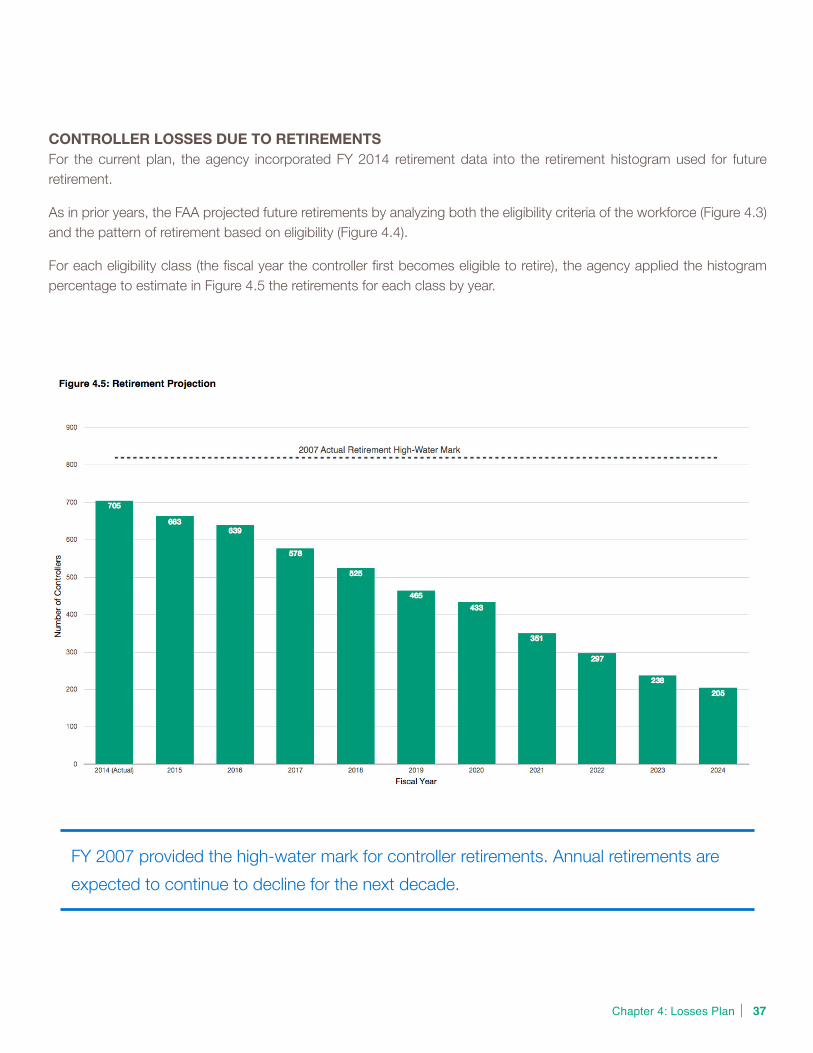
CONTROLLERLOSSESDUETORETIREMENTSFor the current plan, the agency incorporated FY 2014 retirement data into the retirement histogram used for future retirement.
As in prior years, the FAA projected future retirements by analyzing both the eligibility criteria of the workforce (Figure 4.3) and the pattern of retirement based on eligibility (Figure 4.4).
For each eligibility class (the fiscal year the controller first becomes eligible to retire), the agency applied the histogram percentage to estimate in Figure 4.5 the retirements for each class by year.
FY 2007 provided the high-water mark for controller retirements. Annual retirements are expected to continue to decline for the next decade.
38 A Plan for the Future: 10-Year Strategy for the Air Traffic Control Workforce|
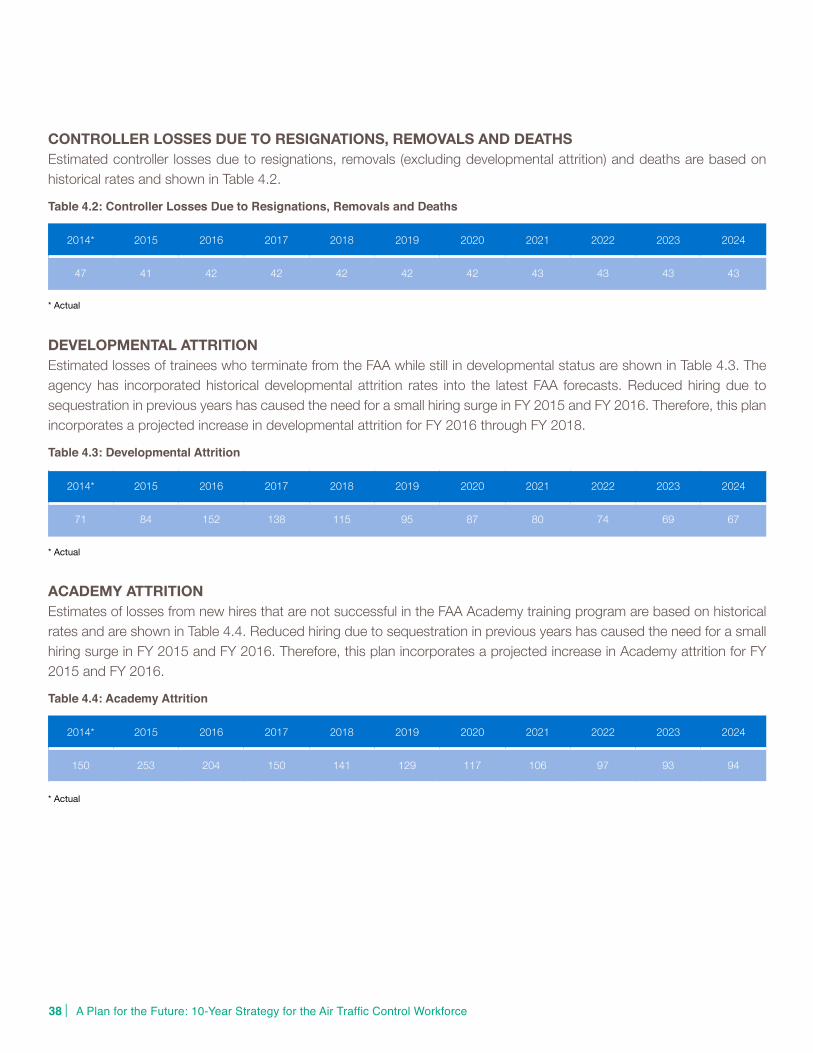
CONTROLLERLOSSESDUETORESIGNATIONS,REMOVALSANDDEATHSEstimated controller losses due to resignations, removals (excluding developmental attrition) and deaths are based on historical rates and shown in Table 4.2.
Table 4.2: Controller Losses Due to Resignations, Removals and Deaths
2014* 2015 2016 2017 2018 2019 2020 2021 2022 2023 2024
47 41 42 42 42 42 42 43 43 43 43
* Actual
DEVELOPMENTALATTRITIONEstimated losses of trainees who terminate from the FAA while still in developmental status are shown in Table 4.3. The agency has incorporated historical developmental attrition rates into the latest FAA forecasts. Reduced hiring due to sequestration in previous years has caused the need for a small hiring surge in FY 2015 and FY 2016. Therefore, this plan incorporates a projected increase in developmental attrition for FY 2016 through FY 2018.
Table 4.3: Developmental Attrition
2014* 2015 2016 2017 2018 2019 2020 2021 2022 2023 2024
71 84 152 138 115 95 87 80 74 69 67
* Actual
ACADEMYATTRITIONEstimates of losses from new hires that are not successful in the FAA Academy training program are based on historical rates and are shown in Table 4.4. Reduced hiring due to sequestration in previous years has caused the need for a small hiring surge in FY 2015 and FY 2016. Therefore, this plan incorporates a projected increase in Academy attrition for FY 2015 and FY 2016.
Table 4.4: Academy Attrition
2014* 2015 2016 2017 2018 2019 2020 2021 2022 2023 2024
150 253 204 150 141 129 117 106 97 93 94
* Actual

Chapter 4: Losses Plan | 39 39
CONTROLLERLOSSESDUETOPROMOTIONSANDOTHERTRANSFERSThis section presents FAA estimates of controller losses due to internal transfers to other positions (staff support specialists, traffic management coordinators, etc.) and controller losses due to promotions to front line manager (FLM) or air traffic management/supervisory positions.
Over the past five years, we’ve observed an average of 162 net promotions each year from CPC to supervisory positions. The majority of these promotions replace retiring supervisors. We expect net transfers to promotions to increase slightly and to peak at 213 in 2017 and slightly fall in future years as seen in Figure 4.6.

40 A Plan for the Future: 10-Year Strategy for the Air Traffic Control Workforce|
TOTALCONTROLLERLOSSES
The FAA projects a total loss of 10,178 controllers over the next 10 years. Should losses outpace projections for FY 2015, the FAA will hire additional controllers to reach the end-of-year goal of 14,717 air traffic controllers on board.

Chapter 4: Losses Plan | 41 41

42 A Plan for the Future: 10-Year Strategy for the Air Traffic Control Workforce|
The FAA safely operates and maintains the NAS because of the combined expertise of its people, the support of
technology and the application of standardized procedures. Every day tens of thousands of aircraft are guided safely and expeditiously through the NAS to their destinations.Deploying a well-trained and well-staffed air traffic control workforce plays an essential role in fulfilling this responsibility. The FAA’s current hiring plan has been designed to phase in new hires as needed. To staff the right number of people in the right places at the right time, the FAA develops annual hiring plans that are responsive to changes in traffic and in the controller workforce.
The FAA hires new developmental controllers in advance of the agency’s staffing needs in order to have ample time to train them to offset future attrition, including retirements, promotions, etc. Proper execution of the hiring plan, while flexibly adapting to the dynamic nature of traffic and attrition, is critical to the plan’s success. If the new developmentals are not placed correctly or if CPCs are not transferred from other facilities, shortages could occur at individual facilities that may affect schedules, increase overtime usage or require the use of more developmentals on position.
Staffing is and will continue to be monitored at all facilities throughout the year. The agency will continue to modify the hiring plan at the facility level should adjustments become necessary due to changes in traffic volume, retirements or other attrition.
There are thousands of qualified controller candidates eager to be hired. The FAA has again been able to attract large numbers of qualified controller candidates. Through a revised controller hiring process, the FAA will attract and recruit a sufficient number of applicants to achieve this hiring plan.
Chapter5:HiringPlan

Chapter 5: Hiring Plan | 43 43
CONTROLLERHIRINGPROFILEThe controller hiring profile is shown in Figure 5.1. Despite the effects of sequestration during the first three months of FY 2014 during which the FAA was under a hiring freeze, the FAA was able to hire 1,112 of the planned 1,286 controllers in FY 2014. The difference between planned and actual hiring in FY 2014, as well as a significant remaining backlog of new hires needed from FY 2013, is expected to be addressed over the next two fiscal years, raising hiring projections in those years relative to last year’s plan. The number of controllers projected to be hired through FY 2024 is 10,241.
Due to the effects of sequestration, the FAA only hired 554 controllers in FY 2013 and 1,112 in FY 2014.

44 A Plan for the Future: 10-Year Strategy for the Air Traffic Control Workforce|
TRAINEE-TO-TOTAL-CONTROLLERPERCENTAGEThe hiring plan allows the FAA to maintain an appropriate number of trainees (developmental and CPC-IT) in the workforce. While the FAA strives to keep trainees below 35 percent for both Terminal and En Route controllers, it is not the only metric used by the agency to measure trainee progress.
Figure 5.2 shows the projected trainee-to-total-controller percentages for En Route and Terminal by year to 2024. The percentage shown is calculated as the sum of CPC-ITs plus developmentals divided by all controllers.
While Terminal facilities are showing a decline through 2024, there is a slight uptick in the En Route percentage for the next several years as controllers in the current developmental pipeline become fully certified. Note the trainee percentage for both En Route and Terminal is still well below 35 percent. In general, the En Route trainee ratio exceeds the Terminal ratio primarily because of the longer times to certify (on average) in En Route facilities.

Chapter 5: Hiring Plan | 45 45
Before the 1981 strike, the FAA experienced trainee percentages ranging from 23 to 44 percent. Following the strike, through the end of the hiring wave in 1992, the trainee percentage ranged from 24 to 52 percent. When the post-strike hires became fully certified by the end of decade, the trainee percentage declined.
As the new controllers hired en masse in the early 1980s achieved full certification, the subsequent need for new hires dropped significantly from 1993 to 2006. This caused trainee percentages to reach unusually low levels. The FAA’s current hiring plans return trainee percentages to their historical averages.
By phasing in new hires as needed, the FAA will level out the significant training spikes and troughs experienced over the last 40 years. Even though there was a long-expected trainee peak in 2009, the trainee percentage remains low as thousands of trainees hired over the past decade have become certified controllers.
Figure 5.3 shows historical trainee percentages from 1969 to the present.

46 A Plan for the Future: 10-Year Strategy for the Air Traffic Control Workforce|
The FAA uses many metrics (e.g., 35 percent trainee to total controllers) to manage the flow of trainees while accomplishing daily operations. Facilities meter training to coincide with a number of dynamic factors, including technology upgrades, new runway construction and recurrent proficiency training for existing CPCs. Facility training is enabled by many factors. Examples include the use of contract instructors, access to simulators, scheduled overtime, and the seasonality and complexity of operations.
In itself, the actual number of trainees does not indicate the progress of each individual in the training program or the additional utility they provide that can help to supplement other on-the-job training instruction and support operations. A key facility measure of training performance is measurement of trainee completion time against the goals. The goal ranges from one and one-half years at our lower-level Terminal facilities to three years at our En Route facilities.
The FAA is striving to meet these goals by improving training and scheduling processes through increased use of simulators and better tracking of controller training using the FAA’s national training database.
The FAA will continue to closely monitor facilities to make sure trainees are progressing through each stage of training while also maintaining the safe and efficient operation of the NAS.

Chapter 6: Hiring Process | 47 47
CONTROLLERHIRINGSOURCESThe FAA has two primary categories of controller hiring sources.
• Prior ATCS experience: These individuals have at least 52 weeks of certified air traffic control experience.
• No prior ATCS experience: These individuals are not required to have prior air traffic control experience and may apply for vacancies announced by the FAA.
RECRUITMENTThe agency continues to attract and recruit high-quality applicants into the controller workforce to meet staffing requirements.
In FY 2014, the FAA revised the air traffic control hiring process. The changes allowed the FAA to more efficiently compare applicants across previously used hiring sources to select those candidates most likely to succeed as air traffic control specialists. Key changes of the new approach included: (1) a single vacancy announcement; (2) a single set of minimum qualifications/eligibility requirements; (3) a multi-hurdle selection process with increased validity and efficiency; and (4) eliminated the Centralized Selection Panel process and Interview.
In January 2015, the FAA stated that it would conduct a two-track announcement process for hiring air traffic control specialists for the year. The first track includes an announcement targeting applicants who have at least 52 weeks of certified air traffic control experience in either civilian or military air traffic control facilities. The second track targets candidates without operational air traffic control experience.
Chapter6:HiringProcess

Chapter7:Training
48 A Plan for the Future: 10-Year Strategy for the Air Traffic Control Workforce|
One of the primary goals of the FAA’s technical training and development programs is to ensure that our air traffic
controllers have all the necessary skills and abilities to perform their jobs effectively and maintain the safety of the NAS.The FAA’s technical training framework is designed to provide controllers with training to meet the challenges of today and prepare them for the next advancements of air traffic management.
The FAA’s Office of Safety and Technical Training is helping the agency to firmly instill its safety mission in controllers from the start of their careers. The powerful combination of safety, training and quality assurance under the same leadership structure enhances the FAA’s ability to identify, mitigate and manage risks, and integrate lessons learned into the technical training curriculum. The training program for air traffic controllers is governed by FAA Order 3120.4, Air Traffic Technical Training, and is reviewed annually to ensure its technical accuracy.
FAA’SCALLTOACTIONThe FAA previously reported on its independent review of the selection, assignment and training of air traffic control specialists (see http://1.usa.gov/IRP_Release) as part of a nationwide Call to Action in 2011 on air traffic control safety and professionalism. About a third of the Independent Review Panel’s (IRP) 49 recommendations dealt with the selection and placement of air traffic control specialists. The rest covered improvements to professionalism, on-the-job training instruction, learning technologies, record-keeping, and curriculum design. The FAA continues to work on projects that adopt the panel’s recommendations.
The agency has updated training courses to support cumulative grading, in which students are assessed at multiple points in training, with new training advancement decision points, so that students underperforming in training are either provided remedial training or are released from the agency. The revamped process increases staffing flexibility for the agency and improves efficiency in both hiring and initial training of air traffic controllers.
THETRAININGPROCESSTraining begins at the FAA Academy, where students gain foundational air traffic control knowledge through classroom and simulation training. Later, at field facilities, they receive additional classroom and simulation training and then on-the job training to become certified professional controllers (CPC). All controllers are assigned periodic proficiency training, in the form of recurrent training or other supplemental training.
The FAA is adopting an outcome-based approach to the design and development of training, based on one of the recommendations from the IRP. The outcome-based approach refers to the strategy used to design individual courses and is based on the performance requirements found in the competency model. It uses the collection of job tasks, knowledge, skills and abilities to define the operational outcome required for the controller’s job so that training can be designed accordingly. The newer approach includes mapping curriculum to job tasks, knowledge, skills and training methods. The techniques apply to new course development, redesigns and updates.

Chapter 7: Training | 49 49
FAAACADEMYTRAININGThe FAA Academy trains new controllers using lecture, computer-based instruction, and simulation with a range of fidelity. The academy lays the foundation for controller development by teaching common, fundamental air traffic control procedures that are used throughout the country.
FAAFACILITYTRAININGAfter graduating from the FAA Academy, developmental controllers begin facility training in the classroom, where they learn facility-specific rules and procedures. Often, these rules and procedures are practiced in simulation. The FAA is increasing the use of simulators – technology that allows instructors to duplicate and play back actual operating events to give students opportunities for improvement in a safe environment. Simulators enable students to not only see the cause and effect, but also to avoid mistakes in the future. Since live traffic is inconsistent and unpredictable due to weather and system delays, a controller may have to wait days or weeks for an opportunity to learn a particular procedure, and even longer to become proficient at it. The FAA uses simulation to help compress the training timeline while also improving the students’ learning experience and reducing training costs.
After classroom and simulation training have been completed, developmental controllers begin on-the-job training on operational positions. This training is conducted by CPCs who observe and instruct developmental controllers working the control position. Once they are certified on control positions, developmental controllers often work independently on those positions under the direction of a supervisor to gain experience and to supplement staffing.
The Flight Deck Training (FDT) program is supplemental training designed for current controllers to improve understanding and communications between controllers and pilots. During 2014, the program accomplished over 2,900 FDT flights.
RECURRENTTRAININGIn 2012, the FAA initiated recurrent training to enhance controller proficiency. The recurrent training program is administered annually as a combination of classroom and computer-based instruction for air traffic controllers that deliver evidence-based topics derived from the Air Traffic Safety Action Program (ATSAP), Quality Assurance and Quality Control activities and data. As contrasted with annually-required refresher training on static, predetermined topics, recurrent training delivers timely and directly relevant safety training based on safety trends and lessons learned from safety data and analysis. Recurrent training is developed in collaboration with subject matter experts from the National Air Traffic Controllers Association.
Most recently, the FAA initiated a multi-year, three-step program to revise and update its training courses for on-the-job-training field instructors. It is especially important for field instructors to maintain proficiency on all of the latest skills, new procedures and technologies coming into the system through NextGen improvements.
INFRASTRUCTUREINVESTMENTSTo improve the performance and reliability of the eLearning Management System (eLMS) across the Air Traffic Organization (ATO), the FAA set up a Content Delivery Network (CDN) on Computer Based Instruction (CBI) training platforms. This system delivers replacement CBI hard drives with all qualified eLMS course content to air traffic facilities. The CDN is basically a network that places the eLMS content on a distributor at the site so the content is viewed from a local area network instead of downloading the content every time it’s viewed. Approximately 150 air traffic sites have the CDN solution installed, and there are plans to deploy the CDN solution to the remaining Air Traffic sites in 2015. Sites with the CDN configuration have the ability to view more robust training typically associated with multimedia and simulation.
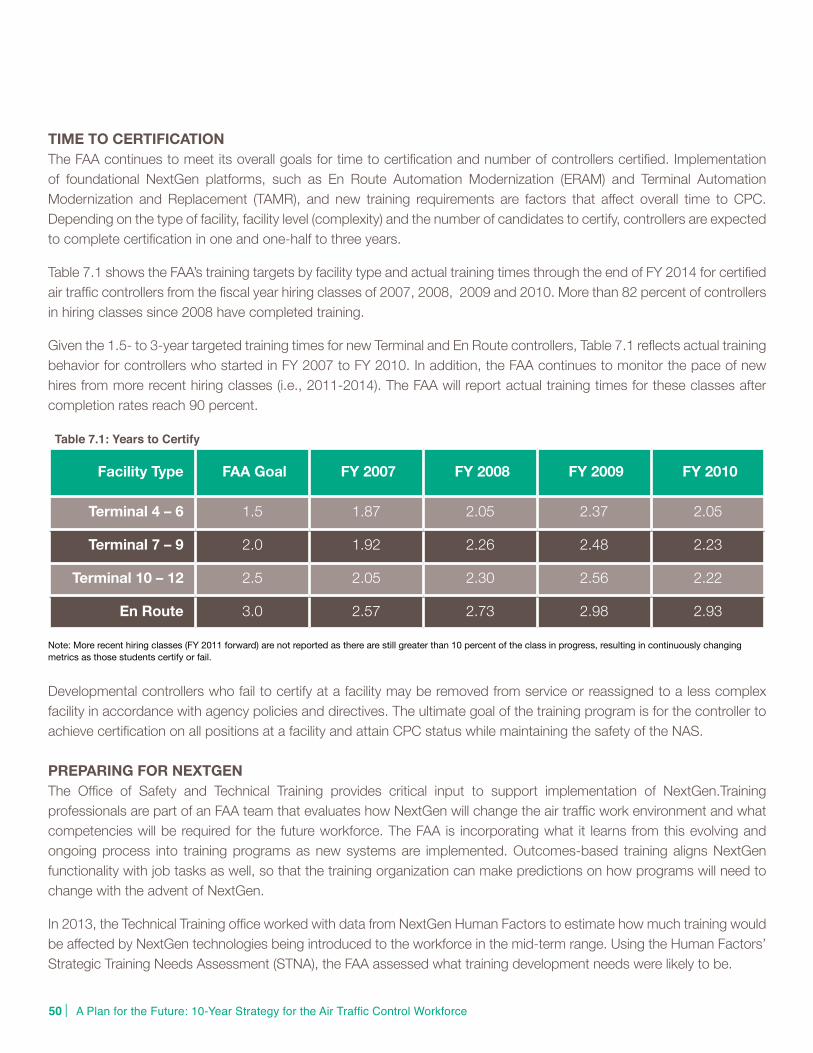
50 A Plan for the Future: 10-Year Strategy for the Air Traffic Control Workforce|
TIMETOCERTIFICATIONThe FAA continues to meet its overall goals for time to certification and number of controllers certified. Implementation of foundational NextGen platforms, such as En Route Automation Modernization (ERAM) and Terminal Automation Modernization and Replacement (TAMR), and new training requirements are factors that affect overall time to CPC. Depending on the type of facility, facility level (complexity) and the number of candidates to certify, controllers are expected to complete certification in one and one-half to three years.
Table 7.1 shows the FAA’s training targets by facility type and actual training times through the end of FY 2014 for certified air traffic controllers from the fiscal year hiring classes of 2007, 2008, 2009 and 2010. More than 82 percent of controllers in hiring classes since 2008 have completed training.
Given the 1.5- to 3-year targeted training times for new Terminal and En Route controllers, Table 7.1 reflects actual training behavior for controllers who started in FY 2007 to FY 2010. In addition, the FAA continues to monitor the pace of new hires from more recent hiring classes (i.e., 2011-2014). The FAA will report actual training times for these classes after completion rates reach 90 percent.
Table 7.1: Years to Certify
Facility Type FAAGoal FY2007 FY2008 FY2009 FY2010
Terminal 4 – 6 1.5 1.87 2.05 2.37 2.05
Terminal7–9 2.0 1.92 2.26 2.48 2.23
Terminal 10 – 12 2.5 2.05 2.30 2.56 2.22
EnRoute 3.0 2.57 2.73 2.98 2.93
Note: More recent hiring classes (FY 2011 forward) are not reported as there are still greater than 10 percent of the class in progress, resulting in continuously changing metrics as those students certify or fail.
Developmental controllers who fail to certify at a facility may be removed from service or reassigned to a less complex facility in accordance with agency policies and directives. The ultimate goal of the training program is for the controller to achieve certification on all positions at a facility and attain CPC status while maintaining the safety of the NAS.
PREPARINGFORNEXTGENThe Office of Safety and Technical Training provides critical input to support implementation of NextGen.Training professionals are part of an FAA team that evaluates how NextGen will change the air traffic work environment and what competencies will be required for the future workforce. The FAA is incorporating what it learns from this evolving and ongoing process into training programs as new systems are implemented. Outcomes-based training aligns NextGen functionality with job tasks as well, so that the training organization can make predictions on how programs will need to change with the advent of NextGen.
In 2013, the Technical Training office worked with data from NextGen Human Factors to estimate how much training would be affected by NextGen technologies being introduced to the workforce in the mid-term range. Using the Human Factors’ Strategic Training Needs Assessment (STNA), the FAA assessed what training development needs were likely to be.

Chapter 7: Training | 51 51
Examples of NextGen training efforts include Time Based Flow Management (TBFM), ERAM and Automatic Dependent Surveillance-Broadcast (ADS-B).
• The TBFM system enhances efficiency and improves traffic flow by leveraging the capabilities of the Traffic Management Advisor (TMA) decision support tool. Although some form of TBFM has been in the field for many years, a national training program was never developed. The Technical Training office is now filling the training gap with a series of courses for the Web and classroom to be implemented as supplemental or refresher training.
• Multiple courses covering ERAM have been implemented to support transition of En Route facilities to this new technology. Courses include workforce training, refresher training, supplemental training and cadre training for instructors who deliver training in the field. These various courses enable a consistent yet flexible delivery of ERAM training as facilities cycle through the phases of system implementation.
• ADS-B training combines instructor-led training with hands-on performance verification on the actual equipment. This training covers ADS-B, Fused Mode and associated new functionality in the Standard Terminal Automation Replacement System (STARS).
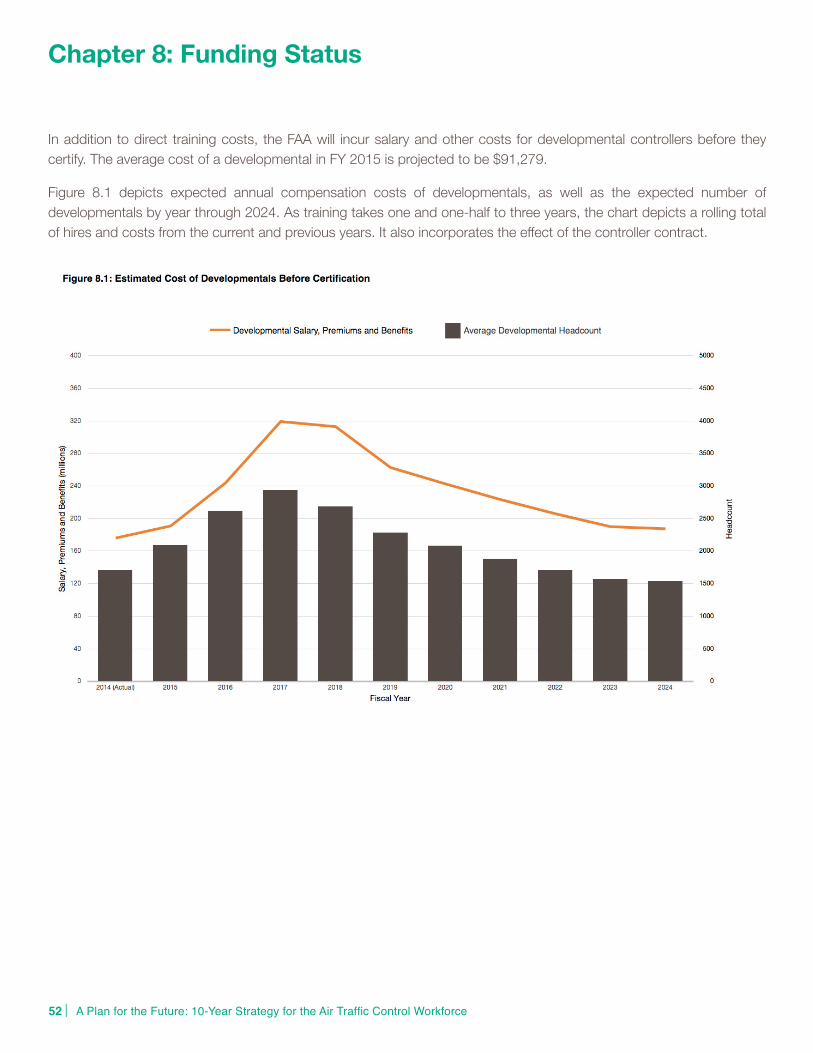
Chapter8:FundingStatus
52 A Plan for the Future: 10-Year Strategy for the Air Traffic Control Workforce|
In addition to direct training costs, the FAA will incur salary and other costs for developmental controllers before they certify. The average cost of a developmental in FY 2015 is projected to be $91,279.
Figure 8.1 depicts expected annual compensation costs of developmentals, as well as the expected number of developmentals by year through 2024. As training takes one and one-half to three years, the chart depicts a rolling total of hires and costs from the current and previous years. It also incorporates the effect of the controller contract.

Appendix A: En Route Facility Controller Staffing Ranges | 53 53
The Appendix below presents controller staffing ranges, by facility, for En Route air traffic control facilities for FY 2015. Additional detail on how the staffing ranges are calculated is provided in Chapter 3.
In general, the FAA strives to keep the number of CPCs and CPC-ITs near the middle of the range. While most of the work is accomplished by CPCs, work is also being performed in facilities by CPC-IT and position-qualified developmental controllers who are proficient, or checked out, in specific sectors or positions and handle work independently. Accordingly, facilities can safely operate even with CPC staffing levels below the defined staffing range.
Conversely, a facility’s total staffing levels are often above the defined staffing range because new controllers are typically hired two to three years in advance of expected attrition to allow for sufficient training time. The total expected end-of-year staffing number shown in Figure 3.1 reflects this projected advanced hiring.
AppendixA:EnRouteFacilityControllerStaffingRanges
ZAB Albuquerque ARTCC 166 1 27 194 161 197
ZAN Anchorage ARTCC 70 7 19 96 84 103
ZAU Chicago ARTCC 318 16 38 372 274 335
ZBW Boston ARTCC 212 7 43 262 186 228
ZDC Washington ARTCC 270 14 54 338 263 322
ZDV Denver ARTCC 243 16 43 302 227 277
ZFW Fort Worth ARTCC 254 19 33 306 251 306
ZHU Houston ARTCC 224 12 27 263 237 290
ZID Indianapolis ARTCC 269 12 38 319 245 300
ZJX Jacksonville ARTCC 276 6 19 301 217 266
ZKC Kansas City ARTCC 199 15 52 266 204 249
ZLA Los Angeles ARTCC 219 17 43 279 209 256
ZLC Salt Lake City ARTCC 156 1 13 170 138 169
ZMA Miami ARTCC 225 8 22 255 214 262
ZME Memphis ARTCC 242 8 33 283 223 273
ZMP Minneapolis ARTCC 226 9 44 279 223 272
ZNY New York ARTCC 239 10 64 313 244 298
ZOA Oakland ARTCC 171 17 65 253 171 209
ZOB Cleveland ARTCC 317 8 41 366 268 327
ZSE Seattle ARTCC 128 6 40 174 129 157
ZSU San Juan ARTCC 40 6 5 51 44 54
ZTL Atlanta ARTCC 343 11 22 376 311 380
ZUA Guam ARTCC 16 0 0 16 14 17
EN ROUTE TOTAL 4,823 226 785 5,834 4,537 5,547
ACTUAL ON BOARD AS OF 09/20/14 STAFFING RANGES
ID FACILITY NAME CPC CPC-IT DEVELOPMENTAL TOTAL LOW HIGH

54 A Plan for the Future: 10-Year Strategy for the Air Traffic Control Workforce|
AppendixB:TerminalFacilityControllerStaffingRanges
ACTUAL ON BOARD AS OF 09/20/14 STAFFING RANGES
ID FACILITY NAME CPC CPC-IT DEVELOPMENTAL TOTAL LOW HIGH
The Appendix below presents controller staffing ranges, by facility, for Terminal air traffic control facilities for FY 2015. Additional detail on how the staffing ranges are calculated is provided in Chapter 3.
In general, the FAA strives to keep the number of CPCs and CPC-ITs near the middle of the range. While most of the work is accomplished by CPCs, work is also being performed in facilities by CPC-IT and position-qualified developmental controllers who are proficient, or checked out, in specific sectors or positions and handle work independently. Accordingly, facilities can safely operate even with CPC staffing levels below the defined staffing range.
Conversely, a facility’s total staffing levels are often above the defined staffing range because new controllers are typically hired two to three years in advance of expected attrition to allow for sufficient training time. The total expected end-of-year staffing number shown in Figure 3.1 reflects this projected advanced hiring.
A11 Anchorage TRACON 14 6 9 29 20 24
A80 Atlanta TRACON 76 13 0 89 82 100
A90 Boston TRACON 57 2 0 59 49 60
ABE Allentown Tower 19 5 5 29 22 27
ABI Abilene Tower 15 0 6 21 16 20
ABQ Albuquerque Tower 27 6 3 36 22 26
ACK Nantucket Tower 9 0 2 11 9 11
ACT Waco Tower 14 2 6 22 16 20
ACY Atlantic City Tower 17 4 6 27 20 24
ADS Addison Tower 11 1 0 12 9 11
ADW Andrews Tower 14 0 2 16 11 14
AFW Alliance Tower 15 0 1 16 13 16
AGC Allegheny Tower 14 1 3 18 9 11
AGS Augusta Tower 13 0 6 19 13 15
ALB Albany Tower 14 3 5 22 20 24
ALO Waterloo Tower 8 0 7 15 11 13
AMA Amarillo Tower 16 1 6 23 15 18
ANC Anchorage Tower 21 3 6 30 21 26
APA Centennial Tower 16 4 3 23 18 22
APC Napa Tower 6 0 2 8 6 7
ARB Ann Arbor Tower 7 0 1 8 8 10

Appendix B: Terminal Facility Controller Staffing Ranges | 55
ACTUAL ON BOARD AS OF 09/20/14 STAFFING RANGES
ID FACILITY NAME CPC CPC-IT DEVELOPMENTAL TOTAL LOW HIGH
ARR Aurora Tower 9 1 2 12 8 10
ASE Aspen Tower 10 0 7 17 11 13
ATL Atlanta Tower 45 11 0 56 43 52
AUS Austin Tower 28 14 0 42 31 37
AVL Asheville Tower 11 0 6 17 13 16
AVP Wilkes-Barre Tower 16 0 3 19 16 20
AZO Kalamazoo Tower 12 1 4 17 14 17
BDL Bradley Tower 15 1 3 19 10 13
BED Hanscom Tower 15 0 1 16 11 13
BFI Boeing Tower 18 5 3 26 14 17
BFL Bakersfield Tower 16 1 9 26 17 21
BGM Binghamton Tower 13 0 2 15 11 13
BGR Bangor Tower 19 0 1 20 15 19
BHM Birmingham Tower 21 2 3 26 22 26
BIL Billings Tower 16 0 3 19 16 19
BIS Bismarck Tower 7 0 5 12 13 15
BJC Broomfield Tower 12 1 0 13 8 10
BNA Nashville Tower 26 10 3 39 32 40
BOI Boise Tower 25 3 5 33 20 25
BOS Boston Tower 28 8 0 36 27 33
BPT Beaumont Tower 9 0 1 10 9 11
BTR Baton Rouge Tower 12 3 5 20 15 18
BTV Burlington Tower 14 2 6 22 16 19
BUF Buffalo Tower 24 1 8 33 24 29
BUR Burbank Tower 15 4 0 19 14 17
BWI Baltimore Tower 27 3 3 33 19 24
C90 Chicago TRACON 74 19 0 93 80 98
CAE Columbia Tower 23 0 1 24 18 21
CAK Akron-Canton Tower 23 1 3 27 16 20
CCR Concord Tower 8 0 0 8 8 10
CDW Caldwell Tower 11 0 0 11 8 9
CHA Chattanooga Tower 14 3 5 22 16 19

56 A Plan for the Future: 10-Year Strategy for the Air Traffic Control Workforce|
ACTUAL ON BOARD AS OF 09/20/14 STAFFING RANGES
ID FACILITY NAME CPC CPC-IT DEVELOPMENTAL TOTAL LOW HIGH
AppendixB:TerminalFacilityControllerStaffingRanges
CHS Charleston Tower 23 0 3 26 18 23
CID Cedar Rapids Tower 15 0 3 18 13 16
CKB Clarksburg Tower 17 0 2 19 13 16
CLE Cleveland Tower 43 5 6 54 35 43
CLT Charlotte Tower 62 24 2 88 74 90
CMA Camarillo Tower 11 2 2 15 9 10
CMH Columbus Tower 38 8 1 47 36 45
CMI Champaign Tower 11 0 5 16 13 16
CNO Chino Tower 10 3 2 15 9 11
COS Colorado Springs Tower 24 6 3 33 22 26
CPR Casper Tower 11 0 3 14 11 13
CPS Downtown Tower 12 0 1 13 9 11
CRP Corpus Christi Tower 26 6 5 37 28 34
CRQ Palomar Tower 14 0 2 16 9 11
CRW Charleston Tower 21 2 5 28 17 21
CSG Columbus Tower 7 0 0 7 4 5
CVG Cincinnati Tower 48 1 0 49 34 41
D01 Denver TRACON 55 13 0 68 65 80
D10 Dallas-Fort Worth TRACON 55 22 0 77 77 94
D21 Detroit TRACON 41 16 0 57 48 59
DAB Daytona Beach Tower 37 13 8 58 47 57
DAL Dallas Love Tower 24 3 1 28 17 21
DAY Dayton Tower 17 0 0 17 12 14
DCA Washington National Tower 21 9 4 34 23 28
DEN Denver Tower 36 5 0 41 34 42
DFW DFW Tower 48 4 0 52 46 57
DLH Duluth Tower 15 1 7 23 17 21
DPA Dupage Tower 11 2 1 14 9 12
DSM Des Moines Tower 15 5 6 26 17 21
DTW Detroit Tower 33 0 0 33 29 35
DVT Deer Valley Tower 17 2 1 20 14 18
DWH Hooks Tower 17 0 0 17 11 13
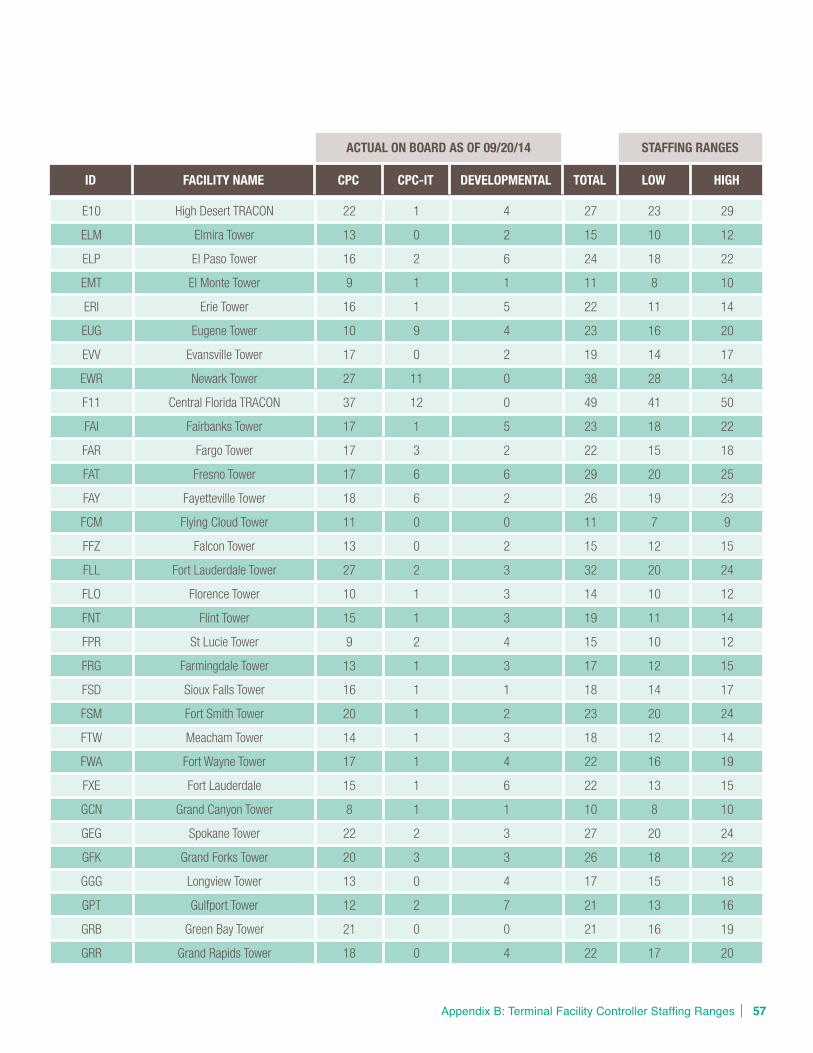
Appendix B: Terminal Facility Controller Staffing Ranges | 57
ACTUAL ON BOARD AS OF 09/20/14 STAFFING RANGES
ID FACILITY NAME CPC CPC-IT DEVELOPMENTAL TOTAL LOW HIGH
E10 High Desert TRACON 22 1 4 27 23 29
ELM Elmira Tower 13 0 2 15 10 12
ELP El Paso Tower 16 2 6 24 18 22
EMT El Monte Tower 9 1 1 11 8 10
ERI Erie Tower 16 1 5 22 11 14
EUG Eugene Tower 10 9 4 23 16 20
EVV Evansville Tower 17 0 2 19 14 17
EWR Newark Tower 27 11 0 38 28 34
F11 Central Florida TRACON 37 12 0 49 41 50
FAI Fairbanks Tower 17 1 5 23 18 22
FAR Fargo Tower 17 3 2 22 15 18
FAT Fresno Tower 17 6 6 29 20 25
FAY Fayetteville Tower 18 6 2 26 19 23
FCM Flying Cloud Tower 11 0 0 11 7 9
FFZ Falcon Tower 13 0 2 15 12 15
FLL Fort Lauderdale Tower 27 2 3 32 20 24
FLO Florence Tower 10 1 3 14 10 12
FNT Flint Tower 15 1 3 19 11 14
FPR St Lucie Tower 9 2 4 15 10 12
FRG Farmingdale Tower 13 1 3 17 12 15
FSD Sioux Falls Tower 16 1 1 18 14 17
FSM Fort Smith Tower 20 1 2 23 20 24
FTW Meacham Tower 14 1 3 18 12 14
FWA Fort Wayne Tower 17 1 4 22 16 19
FXE Fort Lauderdale 15 1 6 22 13 15
GCN Grand Canyon Tower 8 1 1 10 8 10
GEG Spokane Tower 22 2 3 27 20 24
GFK Grand Forks Tower 20 3 3 26 18 22
GGG Longview Tower 13 0 4 17 15 18
GPT Gulfport Tower 12 2 7 21 13 16
GRB Green Bay Tower 21 0 0 21 16 19
GRR Grand Rapids Tower 18 0 4 22 17 20

58 A Plan for the Future: 10-Year Strategy for the Air Traffic Control Workforce|
ACTUAL ON BOARD AS OF 09/20/14 STAFFING RANGES
ID FACILITY NAME CPC CPC-IT DEVELOPMENTAL TOTAL LOW HIGH
AppendixB:TerminalFacilityControllerStaffingRanges
GSO Greensboro Tower 25 2 6 33 21 26
GSP Greer Tower 12 2 7 21 17 20
GTF Great Falls Tower 10 1 5 16 12 15
HCF Honolulu Control Facility 72 11 13 96 73 89
HEF Manassas Tower 9 1 4 14 8 10
HIO Hillsboro Tower 16 1 2 19 12 14
HLN Helena Tower 8 0 3 11 7 9
HOU Hobby Tower 24 0 0 24 17 21
HPN Westchester Tower 14 0 4 18 11 14
HSV Huntsville Tower 15 0 4 19 14 17
HTS Huntington Tower 19 0 1 20 12 15
HUF Terre Haute Tower 15 1 7 23 13 16
HWD Hayward Tower 9 1 2 12 7 9
I90 Houston TRACON 69 20 0 89 74 90
IAD Dulles Tower 32 1 4 37 25 31
IAH Houston Intercontinental Tower 40 2 0 42 29 36
ICT Wichita Tower 28 8 1 37 26 32
ILG Wilmington Tower 11 1 3 15 7 9
ILM Wilmington Tower 16 2 3 21 15 19
IND Indianapolis Tower 37 6 3 46 32 40
ISP Islip Tower 12 0 6 18 10 12
ITO Hilo Tower 13 1 4 18 12 14
JAN Jackson Tower 12 0 3 15 13 16
JAX Jacksonville Tower 24 11 7 42 37 46
JFK Kennedy Tower 26 7 3 36 28 35
JNU Juneau Tower 9 0 3 12 9 12
K90 Cape TRACON 22 2 1 25 19 24
L30 Las Vegas TRACON 36 15 1 52 40 49
LAF Lafayette Tower 8 2 1 11 7 9
LAN Lansing Tower 18 1 5 24 16 19
LAS Las Vegas Tower 37 10 0 47 31 38
LAX Los Angeles Tower 38 11 0 49 38 46

Appendix B: Terminal Facility Controller Staffing Ranges | 59
ACTUAL ON BOARD AS OF 09/20/14 STAFFING RANGES
ID FACILITY NAME CPC CPC-IT DEVELOPMENTAL TOTAL LOW HIGH
LBB Lubbock Tower 15 1 5 21 15 18
LCH Lake Charles Tower 11 0 5 16 12 15
LEX Lexington Tower 20 3 4 27 18 22
LFT Lafayette Tower 14 0 5 19 15 18
LGA La Guardia Tower 29 5 2 36 26 32
LGB Long Beach Tower 24 0 0 24 16 20
LIT Little Rock Tower 23 5 4 32 22 27
LNK Lincoln Tower 10 0 0 10 8 9
LOU Bowman Tower 9 0 2 11 8 9
LVK Livermore Tower 9 4 1 14 8 10
M03 Memphis TRACON 27 7 7 41 30 37
M98 Minneapolis TRACON 47 6 0 53 49 59
MAF Midland Tower 15 0 6 21 18 21
MBS Saginaw Tower 14 2 2 18 10 13
MCI Kansas City Tower 31 3 1 35 30 37
MCO Orlando Tower 24 4 1 29 21 26
MDT Harrisburg Tower 23 1 8 32 20 24
MDW Midway Tower 22 6 0 28 20 24
MEM Memphis Tower 25 1 4 30 20 24
MFD Mansfield Tower 12 1 4 17 11 13
MGM Montgomery Tower 12 7 4 23 16 20
MHT Manchester Tower 18 0 1 19 10 12
MIA Miami Tower 68 18 3 89 78 95
MIC Crystal Tower 11 0 0 11 8 10
MKC Downtown Tower 12 1 3 16 10 12
MKE Milwaukee Tower 40 9 3 52 31 38
MKG Muskegon Tower 14 0 1 15 12 15
MLI Quad City Tower 6 1 9 16 15 18
MLU Monroe Tower 9 1 4 14 11 13
MMU Morristown Tower 11 0 0 11 7 9
MOB Mobile Tower 19 1 3 23 18 23
MRI Merrill Tower 10 2 1 13 9 11

60 A Plan for the Future: 10-Year Strategy for the Air Traffic Control Workforce|
ACTUAL ON BOARD AS OF 09/20/14 STAFFING RANGES
ID FACILITY NAME CPC CPC-IT DEVELOPMENTAL TOTAL LOW HIGH
AppendixB:TerminalFacilityControllerStaffingRanges
MRY Monterey Tower 8 0 1 9 6 7
MSN Madison Tower 19 4 0 23 16 20
MSP Minneapolis Tower 31 3 0 34 30 37
MSY New Orleans Tower 23 6 0 29 30 37
MWH Grant County Tower 9 1 5 15 13 16
MYF Montgomery Tower 10 1 6 17 10 12
MYR Myrtle Beach Tower 13 3 9 25 22 27
N90 New York TRACON 150 18 35 203 177 217
NCT Northern California TRACON 146 27 10 183 152 186
NEW Lakefront Tower 8 0 0 8 7 8
NMM Meridian TRACON 8 0 3 11 11 14
OAK Oakland Tower 24 4 0 28 17 21
OGG Maui Tower 10 1 4 15 8 10
OKC Oklahoma City Tower 32 2 5 39 26 32
OMA Eppley Tower 16 0 0 16 10 12
ONT Ontario Tower 15 0 3 18 10 12
ORD Chicago O'Hare Tower 48 21 0 69 59 72
ORF Norfolk Tower 22 6 8 36 25 31
ORL Orlando Executive Tower 10 0 2 12 9 11
P31 Pensacola TRACON 27 2 2 31 28 35
P50 Phoenix TRACON 51 10 0 61 52 64
P80 Portland TRACON 24 5 4 33 22 27
PAE Paine Tower 10 2 2 14 9 10
PAO Palo Alto Tower 7 1 1 9 9 11
PBI Palm Beach Tower 29 12 9 50 33 41
PCT Potomac TRACON 143 29 9 181 137 167
PDK DeKalb-Peachtree Tower 18 4 0 22 12 14
PDX Portland Tower 23 8 2 33 18 22
PHF Patrick Henry Tower 11 1 4 16 8 10
PHL Philadelphia Tower 77 12 0 89 65 79
PHX Phoenix Tower 30 3 0 33 27 33
PIA Peoria Tower 11 1 6 18 15 18
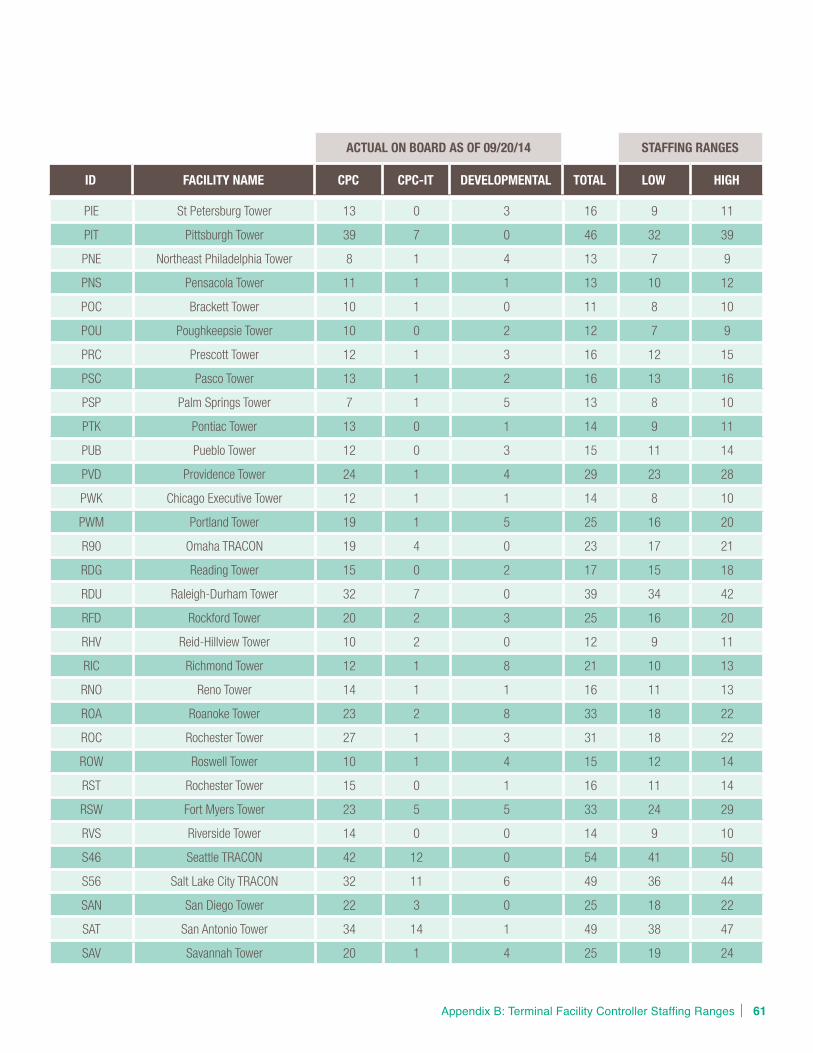
Appendix B: Terminal Facility Controller Staffing Ranges | 61
ACTUAL ON BOARD AS OF 09/20/14 STAFFING RANGES
ID FACILITY NAME CPC CPC-IT DEVELOPMENTAL TOTAL LOW HIGH
PIE St Petersburg Tower 13 0 3 16 9 11
PIT Pittsburgh Tower 39 7 0 46 32 39
PNE Northeast Philadelphia Tower 8 1 4 13 7 9
PNS Pensacola Tower 11 1 1 13 10 12
POC Brackett Tower 10 1 0 11 8 10
POU Poughkeepsie Tower 10 0 2 12 7 9
PRC Prescott Tower 12 1 3 16 12 15
PSC Pasco Tower 13 1 2 16 13 16
PSP Palm Springs Tower 7 1 5 13 8 10
PTK Pontiac Tower 13 0 1 14 9 11
PUB Pueblo Tower 12 0 3 15 11 14
PVD Providence Tower 24 1 4 29 23 28
PWK Chicago Executive Tower 12 1 1 14 8 10
PWM Portland Tower 19 1 5 25 16 20
R90 Omaha TRACON 19 4 0 23 17 21
RDG Reading Tower 15 0 2 17 15 18
RDU Raleigh-Durham Tower 32 7 0 39 34 42
RFD Rockford Tower 20 2 3 25 16 20
RHV Reid-Hillview Tower 10 2 0 12 9 11
RIC Richmond Tower 12 1 8 21 10 13
RNO Reno Tower 14 1 1 16 11 13
ROA Roanoke Tower 23 2 8 33 18 22
ROC Rochester Tower 27 1 3 31 18 22
ROW Roswell Tower 10 1 4 15 12 14
RST Rochester Tower 15 0 1 16 11 14
RSW Fort Myers Tower 23 5 5 33 24 29
RVS Riverside Tower 14 0 0 14 9 10
S46 Seattle TRACON 42 12 0 54 41 50
S56 Salt Lake City TRACON 32 11 6 49 36 44
SAN San Diego Tower 22 3 0 25 18 22
SAT San Antonio Tower 34 14 1 49 38 47
SAV Savannah Tower 20 1 4 25 19 24

62 A Plan for the Future: 10-Year Strategy for the Air Traffic Control Workforce|
ACTUAL ON BOARD AS OF 09/20/14 STAFFING RANGES
ID FACILITY NAME CPC CPC-IT DEVELOPMENTAL TOTAL LOW HIGH
AppendixB:TerminalFacilityControllerStaffingRanges
SBA Santa Barbara Tower 24 10 0 34 22 26
SBN South Bend Tower 13 1 8 22 18 21
SCK Stockton Tower 7 0 3 10 7 8
SCT Southern California TRACON 214 27 3 244 192 235
SDF Standiford Tower 33 8 6 47 34 41
SDL Scottsdale Tower 8 4 3 15 9 11
SEA Seattle Tower 27 0 1 28 23 28
SEE Gillespie Tower 10 1 2 13 11 13
SFB Sanford Tower 16 4 1 21 15 18
SFO San Francisco Tower 26 6 0 32 28 34
SGF Springfield Tower 26 1 3 30 20 25
SHV Shreveport Tower 14 0 9 23 18 22
SJC San Jose Tower 14 0 0 14 10 13
SJU San Juan Tower 12 2 8 22 12 15
SLC Salt Lake City Tower 29 4 0 33 24 29
SMF Sacramento Tower 14 0 3 17 10 12
SMO Santa Monica Tower 10 2 1 13 8 10
SNA John Wayne Tower 25 3 0 28 19 23
SPI Springfield Tower 8 0 6 14 10 13
SRQ Sarasota Tower 11 1 4 16 10 12
STL St Louis Tower 20 2 3 25 14 17
STP St Paul Tower 13 0 0 13 8 10
STS Sonoma Tower 7 1 2 10 7 8
STT St Thomas Tower 8 1 2 11 7 9
SUS Spirit Tower 10 0 3 13 9 11
SUX Sioux Gateway Tower 11 0 5 16 9 11
SYR Syracuse Tower 20 0 7 27 17 21
T75 St Louis TRACON 30 0 1 31 25 31
TEB Teterboro Tower 16 5 4 25 14 17
TLH Tallahassee Tower 16 3 3 22 14 18
TMB Tamiami Tower 16 0 0 16 14 17
TOA Torrance Tower 9 2 0 11 8 10

Appendix B: Terminal Facility Controller Staffing Ranges | 63
ACTUAL ON BOARD AS OF 09/20/14 STAFFING RANGES
ID FACILITY NAME CPC CPC-IT DEVELOPMENTAL TOTAL LOW HIGH
TOL Toledo Tower 16 2 3 21 16 20
TPA Tampa Tower 45 7 2 54 45 54
TRI Tri-Cities Tower 15 1 4 20 14 17
TUL Tulsa Tower 28 0 6 34 22 27
TUS Tucson Tower 13 1 5 19 11 14
TVC Traverse City Tower 8 0 1 9 8 10
TWF Twin Falls Tower 6 1 2 9 7 8
TYS Knoxville Tower 18 4 7 29 22 26
U90 Tucson TRACON 16 3 1 20 15 18
VGT North Las Vegas Tower 6 7 1 14 9 11
VNY Van Nuys Tower 18 5 2 25 17 20
VRB Vero Beach Tower 13 0 2 15 10 13
Y90 Yankee TRACON 18 5 6 29 18 21
YIP Willow Run Tower 12 0 0 12 10 12
YNG Youngstown Tower 16 1 1 18 22 26
TERMINAL TOTAL 6,369 974 882 8,225 6,118 7,477
EN ROUTE TOTAL 4,823 226 785 5,834 4,537 5,547
TERMINAL TOTAL 6,369 974 882 8,225 6,118 7,477
GRAND TOTAL 11,192 1,200 1,667 14,059 10,655 13,024

800 Independence Avenue, SWWashington, DC 20591 2015-ABA-037 • Produced by FAA Communications


